labour productivity: oct to dec 2016 - backup.ons · page 2 of 10 1 . main points uk labour...
TRANSCRIPT

Page 1 of 10
Next release: 5 July 2017
Release date: 5 April 2017
Contact: Ciaren Taylor [email protected] +44 (0)1633 455619
Statistical bulletin
Labour productivity: Oct to Dec 2016
Output per hour, output per job and output per worker for the whole economy and a range of industries. Includes estimates of unit labour costs.
Table of contents
1. Main points
2. Things you need to know about this release
3. Labour productivity up for the fourth consecutive quarter
4. Output per hour up in services and manufacturing
5. Unit labour costs grow for the seventh consecutive quarter
6. Links to related statistics
7. What’s changed in this release?
8. Quality and methodology

Page 2 of 10
1 . Main points
UK labour productivity, as measured by output per hour, is estimated to have grown by 0.4% from Quarter 3 (July to Sept) 2016 to Quarter 4 (Oct to Dec) 2016; however, over a longer time-period, labour productivity growth has been lower on average than prior to the downturn.
Productivity grew in both the services and the manufacturing industries; services productivity grew by 0.8% on the previous quarter, while manufacturing productivity grew by 1.7% on the previous quarter.
Earnings and other labour costs growth outpaced productivity growth, resulting in unit labour cost (ULC) growth of 2.1% in the year to Quarter 4 2016.
This edition forms part of our quarterly productivity bulletin which also includes an , overarching commentarysummaries of recently published estimates and .new quarterly estimates of public service productivity
2 . Things you need to know about this release
This release reports labour productivity estimates for Quarter 4 (Oct to Dec)12016 for the whole economy and a range of industries, together with estimates of unit labour costs. Productivity is important as it is generally considered a driver of long-run improvements in average living standards.
Labour productivity is calculated by dividing output by labour input. Output refers to gross value added (GVA), which is an estimate of the volume of goods and services produced by an industry, for the UK as a whole. Labour inputs in this release are measured in terms of workers, jobs (“productivity jobs”) and hours worked (“productivity hours”).
For the first time, are experimental quarterly estimates of labour input for English regions and devolved nationspublished in tables alongside this release. These will be published regularly each quarter in the tables accompanying the labour productivity bulletin.
This release also reports estimates of unit labour costs (ULCs), which capture the full labour costs – including social security and employers’ pension contributions – incurred in the production of a unit of economic output. Labour costs make up around two-thirds of the overall cost of production of UK economic output. Changes in labour costs are therefore a large factor in overall changes in the cost of production. If increases in labour costs are not reflected in the volume of output, this can put upwards pressure on the prices of goods and services – sometimes referred to as “inflationary pressure”. ULCs are therefore a closely watched indicator of inflationary pressure in the economy.
The equations for labour productivity and ULCs can be found in the Quality and methodology section.
The output statistics in this release are consistent with the latest published on 31 Quarterly National AccountsMarch 2017. Note that productivity in this release does not refer to , gross domestic product (GDP) per personwhich is a measure including people who are not in employment.
The labour input measures used in this release are consistent with the latest as described labour market statisticsfurther in the Quality and methodology section of this bulletin. Measures of jobs and hours worked in this release are affected by . These affect the industry splits of jobs revisions from data sources feeding into workforce jobsand hours worked, as well as the whole-economy estimate for jobs. Unless otherwise stated all figures are seasonally adjusted.
Notes for: Things you need to know about this release

Page 3 of 10
1. Q1 refers to Quarter 1 (Jan to Mar), Q2 refers to Quarter 2 (Apr to June), Q3 refers to Quarter 3 (July to Sept), and Q4 refers to Quarter 4 (Oct to Dec).
3 . Labour productivity up for the fourth consecutive quarter
Productivity – as measured by output per hour – grew by 0.4% in Quarter 4 (Oct to Dec) 2016. Productivity in Quarter 4 2016 was 1.1% higher than in Quarter 1 (Jan to Mar) 2008, immediately prior to the recent economic downturn.
Quarterly growth of 0.4% is below the 1994 to 2007 average – which even taken together with recent stronger quarters, provides little sign of an end to the UK's “productivity puzzle”. This term refers to the relative stagnation of labour productivity since the recent economic downturn. This is in contrast with patterns following previous UK economic downturns where productivity initially fell, but subsequently bounced back to the previous trend rate of growth. There is wide and varied economic debate regarding the causes of this puzzle, and further analysis of recent UK productivity trends can be found in the , and Economic Review, January 2016 May 2016 June 2016and also in several standalone articles including: , What is the productivity puzzle? The productivity conundrum,
, and explanations and preliminary analysis The Productivity Conundrum, Interpreting the Recent Behaviour of the .Economy
This puzzle is shown in Figure 1, which presents two alternative measures of productivity – output per hour and output per worker – alongside their projected 1994 to 2007 trends. Following years of steady growth, each measure peaked in Quarter 4 2007 and fell during the economic downturn. However, due to a strong labour
, productivity has not returned to market performance accompanying a relatively weak recovery in output growththe pre-downturn trend. Productivity in Quarter 4 2016, as measured by output per hour, stood 16% below its pre-downturn trend – or, equivalently, productivity would have been 19% higher had it followed this pre-downturn trend
.1

Page 4 of 10
1.
Figure 1: Output per hour and output per worker, UK
Seasonally adjusted, Quarter 1 (Jan to Mar) 1994 to Quarter 4 (Oct to Dec) 2016
Source: Office for National Statistics
Notes:
Q1 refers to Quarter 1 (January to March), Q2 refers to Quarter 2 (April to June), Q3 (July to September) and Q4 refers to Quarter 4 (October to December).
Figure 2 breaks down the growth in productivity between Quarter 1 (Jan to Mar) 2008 and Quarter 4 2016 into contributions from different industry groupings, and an “allocation effect” due to changes in the share of output and labour in each grouping. All else equal, stronger (weaker) productivity growth in any given industry, or a movement of output and labour towards (away from) higher productivity industries will tend to raise (reduce) aggregate productivity growth. Non-financial services are the main positive contributor to productivity growth over the period, partly offset by negative contributions from non-manufacturing production and finance. The negative allocation effect – suggesting that output and labour have been moving away from higher to lower productivity industries in recent years – partly captures the falling share of output in mining and quarrying, which has among the highest levels of productivity of UK industry. Although negative for the period as a whole, the allocation effect was initially positive following the downturn, but .turned negative in recent years

Page 5 of 10
1.
1.
Figure 2: Contributions to growth of whole economy output per hour
Seasonally adjusted, cumulative since Quarter 1 (Jan to Mar) 2008, Quarter 4 (Oct to Dec) 2016, UK
Source: Office for National Statistics
Notes:
Non-manufacturing production refers to: 1) Agriculture, Forestry and Fishing, 2) Mining and Quarrying, 3) Electricity, Gas, Steam and Air Conditioning Supply, and 4) Water Supply, Sewerage, Waste Management and Remediation Activities.
Notes for: Labour productivity up for the fourth consecutive quarter
Differences between these two measures are due to differences in the denominator used in the calculation. Using the actual output per hour series as the denominator rather than the trend series results in a higher % gap. This is due to the actual series being lower than the trend series post-downturn.
4 . Output per hour up in services and manufacturing
Both manufacturing and services output per hour increased in Quarter 4 (Oct to Dec) 2016, each reflecting a rise in output and a fall in hours worked. Output per hour growth in manufacturing was almost twice as strong as services in Quarter 4 2016: manufacturing rose by 1.7% and services grew by 0.8%.
Figure 3 examines longer-term trends, showing output per hour and its components since Quarter 1 (Jan to Mar) 2008. Services are represented in the first panel, while manufacturing is represented in the second. Manufacturing output per hour has been more volatile than services in recent years. This reflects a divergence of manufacturing gross value added (GVA) and hours, most pronounced in 2009 and 2011 to 2012, whereas GVA and hours for services follow fairly similar trends. However, in recent quarters services GVA grew faster than hours, potentially marking a break from this trend.

Page 6 of 10
Figure 3: Components of manufacturing and services productivity measures
Seasonally adjusted, UK, Quarter 1 (Jan to Mar) 2007 to Quarter 4 (Oct to Dec) 2016
5 . Unit labour costs grow for the seventh consecutive quarter
Unit labour costs (ULCs) reflect the full labour costs, including social security and employers’ pension contributions, incurred in the production of a unit of economic output. Changes in labour costs are a large factor in overall changes in the cost of production. If increased costs are not reflected in increased output, for instance, this can put upward pressure on the prices of goods and services – sometimes referred to as “inflationary pressure”. ULCs grew by 2.1% in the year to Quarter 4 (Oct to Dec) 2016, reflecting a larger percentage increase in labour costs per hour than output per hour.
Figure 4 shows changes in ULCs since Quarter 1 (Jan to Mar) 2008 on a quarter on same quarter a year earlier basis. The bars represent the contribution to changes in ULCs from changes in labour costs per hour and changes in output per hour. Holding other factors constant, increasing output per hour reduces ULCs – as total labour costs remain constant while output rises. As a result, output per hour has its sign reversed in Figure 4. In this presentation, positive (negative) output per hour growth has a negative (positive) effect on ULC growth.
While growth in ULCs has been broadly positive since the period following the recent economic downturn, averaging around 1.5% since Quarter 1 2008, there has been substantial variation during this period. During the recent economic downturn, ULCs began to grow at a relative high rate, reaching a peak of 6.8% by the end of the downturn in Quarter 2 (Apr to June) 2009 and remaining elevated until Quarter 1 2010. Figure 4 shows that the initial increase in ULC growth during the downturn was driven by falling output per hour, but from Quarter 2 2009 onwards increasing labour costs per hour were the driving factor. Following the downturn, growth in ULCs began to slow, eventually becoming negative in Quarter 4 2010. Since then ULC growth has been either low or negative, reflecting both low growth in hourly labour costs and productivity. The most recent quarterly observations are at the higher end of the range observed since 2011 – and are notably stronger than 2 years earlier – but have been relatively stable. This increase broadly reflects higher hourly labour cost growth, with little offsetting output per hour growth.

Page 7 of 10
1. 1.
2.
Figure 4: Whole economy unit labour costs and their compositions, growth on quarter a year ago
Seasonally adjusted, UK, Quarter 1 (Jan to Mar) 2008 to Quarter 4 (Oct to Dec) 2016
Source: Office for National Statistics
Notes:
Labour costs per hour estimates will differ from those in the ONS bulletin Index of Labour Costs per Hour due to differences in methodology.
Q1 refers to Quarter 1 (January to March), Q2 refers to Quarter 2 (April to June), Q3 (July to September) and Q4 refers to Quarter 4 (October to December).
6 . Links to related statistics
5 April 2017: draws together the headlines of the productivity UK productivity introduction: Oct to Dec 2016releases into a single release, providing additional analysis of our productivity statistics.
5 April 2017: contains the latest estimates of labour productivity for the Labour productivity: Oct to Dec 2016whole economy and a range of industries, together with estimates of unit labour costs.
5 April 2017: presents an international International comparisons of UK productivity (ICP), final estimates: 2015comparison of labour productivity across the G7 nations, in terms of growth in GDP per hour and GDP per worker.
5 April 2017: decomposes output growth into Multi-factor productivity estimates: Experimental estimates to 2015the contributions that can be accounted for by labour and capital inputs. The contribution of labour is further decomposed into quantity (hours worked) and quality dimensions.
5 April 2017: presents an analysis Labour productivity measures from the Annual Business Survey, 2006 to 2015of detailed productivity trends and distributions among businesses in the UK from 2006 to 2015, using firm-level data from the Annual Business Survey (ABS).

Page 8 of 10
5 April 2017: presents Quarterly public service productivity (experimental statistics): Oct to Dec 2016experimental estimates for quarterly UK total public service productivity, inputs and output to provide a short-term, timely indicator of the future path of the annual productivity estimates.
5 April 2017: provides a first look at the new experimental Introducing quarterly regional labour input metricsquarterly regional labour input metrics. Hours and jobs for the NUTS1 regions.
5 April 2017: investigates differences in Exploring labour productivity in rural and urban areas in Great Britainrural and urban labour productivity in Great Britain using firm-level microdata analysis of the business economy.
5 April 2017: presents analysis of a small sample of An initial assessment of regional management practicessingle-site British manufacturing businesses from the Management Practice Survey pilot, and finds no evidence of regional variation in management practices.
6 January 2017: provides statistics for several Regional and sub-regional productivity in the UK: Jan 2017measures of labour productivity. Statistics are provided for the NUTS1, NUTS2 and NUTS3 subregions of the UK, and for selected UK city regions.
6 January 2017: Regional firm-level productivity analysis for the non-financial business economy: Jan 2017provides experimental analysis on the sources of regional differences in labour productivity in the non-financial business economy in Great Britain.
6 January 2017: provide estimates of the Volume index of UK capital services (experimental): estimates to 2015contribution of the capital stock to production in the economy, split by asset and industry.
6 January 2017: Management practices and productivity for manufacturing businesses in Great Britain: is a secondary paper analysing the relationship between management practices experimental estimates for 2015
and productivity, following the release of initial results in October.
6 January 2017: presents updated measures Public service productivity estimates: total public service, UK: 2014of output, inputs and productivity for public services in the UK between 1997 and 2013, in addition to new estimates for 2014. Includes service area breakdown, as well as impact of quality adjustment and latest revisions.
6 January 2017: presents updated estimates of output, Public service productivity estimates: healthcare, 2014inputs and productivity for public service healthcare in the UK between 1995 and 2013, and new estimates for 2014.
6 October 2016: includes estimates of changes in the Quality adjusted labour input: UK estimates to 2015number of hours supplied in the UK economy adjusted for changes in the quality of the labour supply.
6 October 2016: Measuring output in the Information Communication and Telecommunications industries: 2016presents initial findings from a review of data sources and methods used in estimating output of the information communication and telecommunications industries, with a focus on the telecommunications industry.
Related content
International comparisons of productivity is published in levels and growth rates for the G7 countries. More international data on productivity are available from the Organisation for Economic Co-operation and
, and the .Development (OECD) Eurostat Conference Board

Page 9 of 10
We publish experimental estimates of (MFP), which decompose output growth into the multi-factor productivitycontributions that can be accounted for by labour and capital inputs. In these estimates, the contribution of labour is further decomposed into quantity (hours worked) and quality dimensions.
The covers recent developments in the UK economy, featuring our latest economic statistics Economic Reviewas well as in-depth analysis of current issues.
Experimental indices of labour costs per hour differ from the concept of labour costs used in the unit labour cost estimates in the labour productivity release. The main difference is that experimental indices of labour costs per hour relate to employees only, whereas unit labour costs also include the labour remuneration of the self-employed.
Lastly, we publish a range of and related articles. These measures define Public sector productivity measuresproductivity differently from that used in our labour productivity and MFP estimates. Further information can be found in and in an published on 4 June 2015.Phelps (2010) information note
More information on the range of our productivity estimates can be found in the ONS .Productivity Handbook
7 . What’s changed in this release?
Revisions in this release are small and primarily come from regular and scheduled revisions to source data. Revisions from Quarterly National Accounts affect data from Quarter 1 (Jan to Mar) 2016 onward. Revised seasonal factor estimates from Quarter 1 2015 onward for whole-economy hours affect both whole economy and industry hours estimates. Revisions to jobs estimates affect both hours and jobs at the industry level, with the effects concentrated in the most recent years.
8 . Quality and methodology
The measure of output used in these statistics is the chain volume (real) measure of gross value added (GVA) at basic prices, with the exception of the regional analysis in Table 9, where the output measure is nominal GVA (NGVA). These measures differ because NGVA is not adjusted to account for price changes; this means that if prices were to rise more quickly in one region than the others, then this would be reflected in apparent improved measured productivity performance in that region relative to the others.
Labour input measures used in this bulletin are known as “productivity jobs” and “productivity hours”. Productivity jobs differ from the Workforce Jobs (WFJ) estimates published in Table 6 of our labour market statistical bulletin, in three ways:
to achieve consistency with the measurement of GVA, the employee component of productivity jobs is derived on a Reporting Unit (RU) basis, whereas the employee component of the WFJ estimates is on a Local Unit (LU) basis
productivity jobs are scaled so industries sum to total Labour Force Survey (LFS) jobs – note that this constraint is applied in non-seasonally adjusted terms; the nature of the seasonal adjustment process means that the sum of seasonally adjusted productivity jobs and hours by industry can differ slightly from the seasonally adjusted LFS totals
productivity jobs are calendar quarter average estimates whereas WFJ estimates are provided for the last month of each quarter

Page 10 of 10
Productivity hours are derived by multiplying employee and self-employed jobs at an industry level (before seasonal adjustment) by average actual hours worked from the LFS at an industry level. Results are scaled so industries sum to total unadjusted LFS hours, and then seasonally adjusted. Labour productivity is then derived using growth rates for GVA and labour inputs in line with the following equation:
Industry estimates of average hours derived in this process differ from published estimates (found in Table HOUR03 in the ) as the HOUR03 estimates are calculated by allocating all hours labour market statistics releaseworked to the industry of main employment, whereas the productivity hours system takes account of hours worked in first and second jobs by industry.
Whole-economy ULCs are calculated as the ratio of total labour costs (that is, the product of labour input and costs per unit of labour) to GVA. Further detail on the methodology can be found in revised methodology for unit
. The equation for growth of ULCs can be calculated as:wage costs and unit labour costs: explanation and impact
Manufacturing unit wage costs are calculated as the ratio of manufacturing average weekly earnings to manufacturing output per filled job. On 28 November 2012 we published Productivity measures: sectional unit
, describing new measures of ULCs below the whole-economy level, and proposing to replace the labour costscurrently published series for manufacturing unit wage costs with a broader and more consistent measure of ULCs.
A research note, , is available on the archived version of our Sources of revisions to labour productivity estimateswebsite, and further commentary on the nature and sources of the revisions introduced in this quarter is available in the .UK Productivity Bulletin – Introduction
The contains important information on:Labour Productivity Quality and Methodology Information document
the strengths and limitations of the data and how it compares with related data
uses and users of the data
how the output was created
the quality of the output including accuracy of the data

1 Labour productivity key measuresUnited Kingdom
Seasonally adjusted (2013=100)
Whole economy Production Manufactur ing Ser vices
Output per Output Output Output Output Output Output Output Outputworker per job per hour per job per hour per job per hour per job per hour
Section A-U A-U A-U B-E B-E C C G-U G-U
IndicesA4YM LNNN LZVB DJ4M DJK3 DJ4P DJK6 DJE3 DJP9
2013 100.0 100.0 100.0 100.0 100.0 100.0 100.0 100.0 100.02014 101.0 100.9 100.6 101.1 101.4 102.1 102.4 100.8 100.6
†
2015 101.6 101.7 101.5 101.1 101.6 101.0 101.2 101.5†
101.32016 102.0 102.3 101.8 102.6 103.7 102.2 103.0 103.1 102.6
2013 Q1 100.1 100.2 100.2 99.4 99.3 99.6 99.6 100.5 100.3Q2 100.0 100.0 100.2 100.6 100.4 100.6 100.3 100.0 100.2Q3 100.0 99.9 99.6 99.9 99.3
†99.6
†99.2 99.8 99.6
Q4 99.9 99.9 100.0 100.1 101.0 100.2 101.0 99.7 99.8†
2014 Q1 100.2 100.2 100.0 101.4 101.4 102.4 102.3 100.0 100.1Q2 100.7 100.5 100.2 101.4 101.5 102.5 102.3
†100.3 100.3
Q3 101.3 101.2 100.9 100.7 101.4 101.7 102.5 101.0 100.8Q4 101.8 101.8 101.3 100.7 101.2 101.8 102.4 101.8 101.3
2015 Q1 101.3 101.3 101.1 100.1 101.0 100.9 101.4 101.1 100.9Q2 101.9 101.8 101.8 101.2 101.7 101.0 101.4 101.5 101.4Q3 101.6 101.7 102.0 101.3
†102.7 100.8 101.7 101.5 101.7
Q4 101.7 101.9 101.1 101.8 101.0 101.3 100.3 102.0†
101.1
2016 Q1 101.7†
102.0†
101.4†
101.4 101.8 101.4 101.2 102.6 101.8Q2 101.7 101.9 101.7 102.8 104.1 102.1 103.1 102.6 102.4Q3 102.0 102.2 101.9 102.9 104.3 101.9 103.0 103.2 102.6Q4 102.6 102.9 102.3 103.3 104.6 103.4 104.7 104.0 103.4
Per cent chang e on quarter a year agoA4YN LNNP LZVD DJ4O DJK5 DJ4R DJK8 DJE5 DJQ3
2013 Q1 0.1 0.2 −0.7 −3.5 −5.2 −3.3 −4.8 1.0 −
Q2 0.6 0.7 −0.2 0.6 −1.5 0.7 −1.1 0.6 −0.1Q3 −0.3 −0.4 −1.0 0.8 −1.4
†−
†−1.9 −0.9 −1.1
Q4 0.4 0.4 − 1.9 0.7 1.6 0.6†
−0.2 −0.3†
2014 Q1 0.1 − −0.2 2.0 2.1 2.8 2.7 −0.5 −0.2Q2 0.7 0.5 − 0.8 1.1 1.9 2.0 0.3 0.1Q3 1.3 1.3 1.3 0.8 2.1 2.1 3.3 1.2 1.2Q4 1.9 1.9 1.3 0.6 0.2 1.6 1.4 2.1 1.5
2015 Q1 1.1 1.1 1.1 −1.3 −0.4 −1.5 −0.9 1.1 0.8Q2 1.2 1.3 1.6 −0.2 0.2 −1.5 −0.9 1.2 1.1Q3 0.3 0.5 1.1 0.6
†1.3 −0.9 −0.8 0.5 0.9
Q4 −0.1 0.1 −0.2 1.1 −0.2 −0.5 −2.1 0.2†
−0.2
2016 Q1 0.4†
0.7†
0.3†
1.3 0.8 0.5 −0.2 1.5 0.9Q2 −0.2 0.1 −0.1 1.6 2.4 1.1 1.7 1.1 1.0Q3 0.4 0.5 −0.1 1.6 1.6 1.1 1.3 1.7 0.9Q4 0.9 1.0 1.2 1.5 3.6 2.1 4.4 2.0 2.3
Per cent chang e on previous quarterA4YO DMWR TXBB DJ4N DJK4 DJ4Q DJK7 DJE4 DJQ2
2013 Q1 0.6 0.7 0.2 1.2 −1.0 1.0 −0.8†
0.6 0.2Q2 −0.1 −0.2 − 1.2 1.1 1.0 0.7 −0.5 −0.1Q3 − −0.1 −0.6 −0.7 −1.1
†−1.0
†−1.1 −0.2 −0.6
Q4 −0.1 − 0.4 0.2 1.7 0.6 1.8 −0.1 0.2†
2014 Q1 0.3 0.3 − 1.3 0.4 2.2 1.3 0.3 0.3Q2 0.5 0.3 0.2 − 0.1 0.1 − 0.3 0.2Q3 0.6 0.7 0.7 −0.7 −0.1 −0.8 0.2 0.7 0.5Q4 0.5 0.6 0.4 − −0.2 0.1 −0.1 0.8 0.5
2015 Q1 −0.5 −0.5 −0.2 −0.6 −0.2 −0.9 −1.0 −0.7 −0.4Q2 0.6 0.5 0.7 1.1 0.7 0.1 − 0.4 0.5Q3 −0.3 −0.1 0.2 0.1
†1.0 −0.2 0.3 − 0.3
Q4 0.1 0.2 −0.9 0.5 −1.7 0.5 −1.4 0.5†
−0.6
2016 Q1 −
†0.1
†0.3
†−0.4 0.8 0.1 0.9 0.6 0.7
Q2 − −0.1 0.3 1.4 2.3 0.7 1.9 − 0.6Q3 0.3 0.3 0.2 0.1 0.2 −0.2 −0.1 0.6 0.2Q4 0.6 0.7 0.4 0.4 0.3 1.5 1.7 0.8 0.8
†indicates that estimates are new or have been revised. The period marked
is the earliest in the table to have been revised
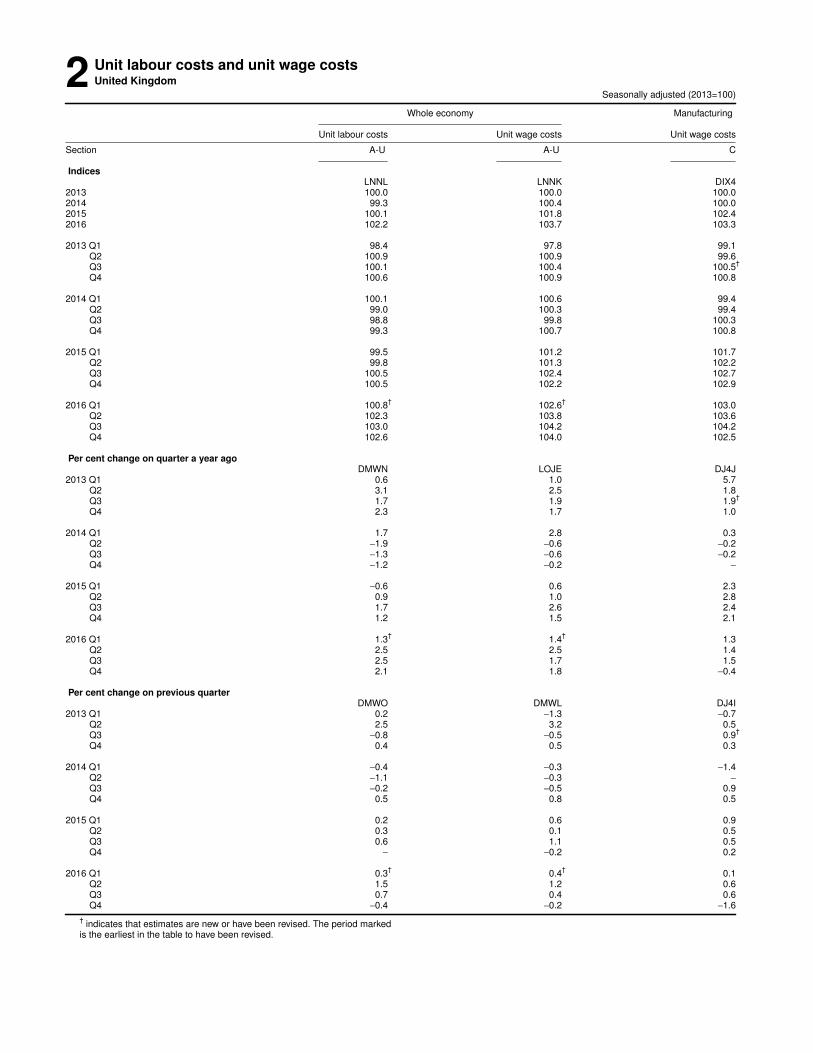
2 Unit labour costs and unit wage costsUnited Kingdom
Seasonally adjusted (2013=100)
Whole economy Manufactur ing
Unit labour costs Unit wage costs Unit wage costs
Section A-U A-U C
IndicesLNNL LNNK DIX4
2013 100.0 100.0 100.02014 99.3 100.4 100.02015 100.1 101.8 102.42016 102.2 103.7 103.3
2013 Q1 98.4 97.8 99.1Q2 100.9 100.9 99.6Q3 100.1 100.4 100.5
†
Q4 100.6 100.9 100.8
2014 Q1 100.1 100.6 99.4Q2 99.0 100.3 99.4Q3 98.8 99.8 100.3Q4 99.3 100.7 100.8
2015 Q1 99.5 101.2 101.7Q2 99.8 101.3 102.2Q3 100.5 102.4 102.7Q4 100.5 102.2 102.9
2016 Q1 100.8†
102.6†
103.0Q2 102.3 103.8 103.6Q3 103.0 104.2 104.2Q4 102.6 104.0 102.5
Per cent chang e on quarter a year agoDMWN LOJE DJ4J
2013 Q1 0.6 1.0 5.7Q2 3.1 2.5 1.8Q3 1.7 1.9 1.9
†
Q4 2.3 1.7 1.0
2014 Q1 1.7 2.8 0.3Q2 −1.9 −0.6 −0.2Q3 −1.3 −0.6 −0.2Q4 −1.2 −0.2 −
2015 Q1 −0.6 0.6 2.3Q2 0.9 1.0 2.8Q3 1.7 2.6 2.4Q4 1.2 1.5 2.1
2016 Q1 1.3†
1.4†
1.3Q2 2.5 2.5 1.4Q3 2.5 1.7 1.5Q4 2.1 1.8 −0.4
Per cent chang e on previous quarterDMWO DMWL DJ4I
2013 Q1 0.2 −1.3 −0.7Q2 2.5 3.2 0.5Q3 −0.8 −0.5 0.9
†
Q4 0.4 0.5 0.3
2014 Q1 −0.4 −0.3 −1.4Q2 −1.1 −0.3 −
Q3 −0.2 −0.5 0.9Q4 0.5 0.8 0.5
2015 Q1 0.2 0.6 0.9Q2 0.3 0.1 0.5Q3 0.6 1.1 0.5Q4 − −0.2 0.2
2016 Q1 0.3†
0.4†
0.1Q2 1.5 1.2 0.6Q3 0.7 0.4 0.6Q4 −0.4 −0.2 −1.6
†indicates that estimates are new or have been revised. The period marked
is the earliest in the table to have been revised.

3 Output per job: Manufacturing subsectionsUnited Kingdom
Seasonally adjusted (2013=100)
Coke &Te xtiles, Wood & Rubber, Basic Computer etc refined
Food, wear ing paper Chemicals, plastics & metals products, petroleum,beverages apparel products, Phar maceutic- non-metallic & metal Electrical Machinery & Transpor t Other& tobacco & leather & pr inting als minerals products equipment equipment equipment manufactur ing
Divisions 10-12 13-15 16-18 20-21 22-23 24-25 26-27 28 29-30 19,31-33
Level (£k)2013 63.0 50.0 47.4 146.2 51.7 51.2 60.8 56.6 76.1 54.7
IndicesDJ54 DJ57 DJ5F DJ5I DJ5L DJB2 DJB7 DJC2 DJC5 DJD3
2013 100.0 100.0 100.0 100.0 100.0 100.0 100.0 100.0 100.0 100.02014 102.8 95.5 98.2 103.9 104.9 101.4 100.9 111.3 100.9 104.22015 100.0 104.0 98.2 109.2 101.8 99.3 104.0 96.1 101.9 100.62016 99.5 100.7 100.5 113.8 103.8 99.2 105.2 98.2 101.5 103.8
2013 Q1 100.3 106.6 97.5 96.2 101.1 99.4 103.1 99.1 100.4 97.0†
Q2 101.3 100.2 101.0 105.2 98.0 99.0 102.7 98.2†
99.6 99.0Q3 98.8 98.2 101.6
†98.3 98.8 99.6 97.5 100.5 100.5 102.2
Q4 99.5†
95.0 99.9 100.3 102.1 102.0 96.7 102.2 99.5 101.8
2014 Q1 103.9 97.8 99.2 102.3 106.5 102.6 98.8 109.0 100.6 105.2Q2 103.3 99.5 97.8 101.6 106.1 101.2 101.0 113.8 101.9 103.0Q3 102.2 91.1 97.8 104.7 104.4 101.0 101.6 112.9 99.6 104.0Q4 101.7 93.4 98.0 107.1 102.4 100.6 102.1 109.6 101.6 104.6
2015 Q1 100.5 101.0 98.8 108.4 101.3 101.0 100.4 99.8 101.7 100.0Q2 99.0 105.1 97.0 108.5 99.3 101.3 105.8 96.0 103.7 101.2Q3 100.3 106.6 98.1 109.5 103.1 96.2 105.3 94.2 101.0 100.5Q4 100.2 103.1 98.9 110.5 103.5 98.6 104.6 94.2 101.3 100.8
2016 Q1 99.4 104.7†
99.1 110.5†
104.5†
101.3†
103.0†
93.8 99.5†
102.5Q2 99.4 96.7 101.9 116.5 105.5 98.4 105.2 96.5 103.0 100.1Q3 99.8 101.9 100.7 111.5 101.1 98.1 103.9 100.3 100.4 106.9Q4 99.2 99.4 100.4 116.5 104.2 99.1 108.8 102.1 103.2 105.6
Per cent chang e on quarter a year agoDJ56 DJ5E DJ5H DJ5K DJ5N DJB6 DJB9 DJC4 DJD2 DJD7
2013 Q1 −2.8 −3.4 −4.2 −6.5 1.3 −3.6 1.5 −14.6 6.1 −7.2†
Q2 −1.3 −3.7 8.1 10.0 −3.6 −3.2 −0.8 −14.0†
7.6 2.6Q3 −3.1 −6.0 8.7 0.9 − −5.7 −6.9 −9.3 6.1 12.4Q4 −1.4
†−11.8 4.7 4.7 2.9 1.6 −7.3 −7.3 5.6 14.5
2014 Q1 3.6 −8.3 1.7†
6.3 5.3 3.2 −4.2 10.0 0.2 8.5Q2 2.0 −0.7 −3.2 −3.4 8.3 2.2 −1.7 15.9 2.3 4.0Q3 3.4 −7.2 −3.7 6.5 5.7 1.4 4.2 12.3 −0.9 1.8Q4 2.2 −1.7 −1.9 6.8 0.3 −1.4 5.6 7.2 2.1 2.8
2015 Q1 −3.3 3.3 −0.4 6.0 −4.9 −1.6 1.6 −8.4 1.1 −4.9Q2 −4.2 5.6 −0.8 6.8 −6.4 0.1 4.8 −15.6 1.8 −1.7Q3 −1.9 17.0 0.3 4.6 −1.2 −4.8 3.6 −16.6 1.4 −3.4Q4 −1.5 10.4 0.9 3.2 1.1 −2.0 2.4 −14.1 −0.3 −3.6
2016 Q1 −1.1 3.7†
0.3 1.9†
3.2†
0.3†
2.6†
−6.0 −2.2†
2.5Q2 0.4 −8.0 5.1 7.4 6.2 −2.9 −0.6 0.5 −0.7 −1.1Q3 −0.5 −4.4 2.7 1.8 −1.9 2.0 −1.3 6.5 −0.6 6.4Q4 −1.0 −3.6 1.5 5.4 0.7 0.5 4.0 8.4 1.9 4.8
Per cent chang e on previous quarterDJ55 DJ58 DJ5G DJ5J DJ5M DJB3 DJB8 DJC3 DJC6 DJD4
2013 Q1 −0.6 −1.0 2.2 0.4 1.9 −1.0 −1.2 −10.1†
6.6 9.1†
Q2 1.0 −6.0 3.6 9.4 −3.1 −0.4 −0.4 −0.9 −0.8 2.1Q3 −2.5 −2.0 0.6
†−6.6 0.8 0.6 −5.1 2.3 0.9 3.2
Q4 0.7†
−3.3 −1.7 2.0 3.3 2.4 −0.8 1.7 −1.0 −0.4
2014 Q1 4.4 2.9 −0.7 2.0 4.3 0.6 2.2 6.7 1.1 3.3Q2 −0.6 1.7 −1.4 −0.7 −0.4 −1.4 2.2 4.4 1.3 −2.1Q3 −1.1 −8.4 − 3.1 −1.6 −0.2 0.6 −0.8 −2.3 1.0Q4 −0.5 2.5 0.2 2.3 −1.9 −0.4 0.5 −2.9 2.0 0.6
2015 Q1 −1.2 8.1 0.8 1.2 −1.1 0.4 −1.7 −8.9 0.1 −4.4Q2 −1.5 4.1 −1.8 0.1 −2.0 0.3 5.4 −3.8 2.0 1.2Q3 1.3 1.4 1.1 0.9 3.8 −5.0 −0.5 −1.9 −2.6 −0.7Q4 −0.1 −3.3 0.8 0.9 0.4 2.5 −0.7 − 0.3 0.3
2016 Q1 −0.8 1.6 0.2 −
†1.0
†2.7
†−1.5
†−0.4 −1.8
†1.7
Q2 − −7.6†
2.8 5.4 1.0 −2.9 2.1 2.9 3.5 −2.3Q3 0.4 5.4 −1.2 −4.3 −4.2 −0.3 −1.2 3.9 −2.5 6.8Q4 −0.6 −2.5 −0.3 4.5 3.1 1.0 4.7 1.8 2.8 −1.2
†indicates that estimates are new or have been revised. The period marked
is the earliest in the table to have been revised.
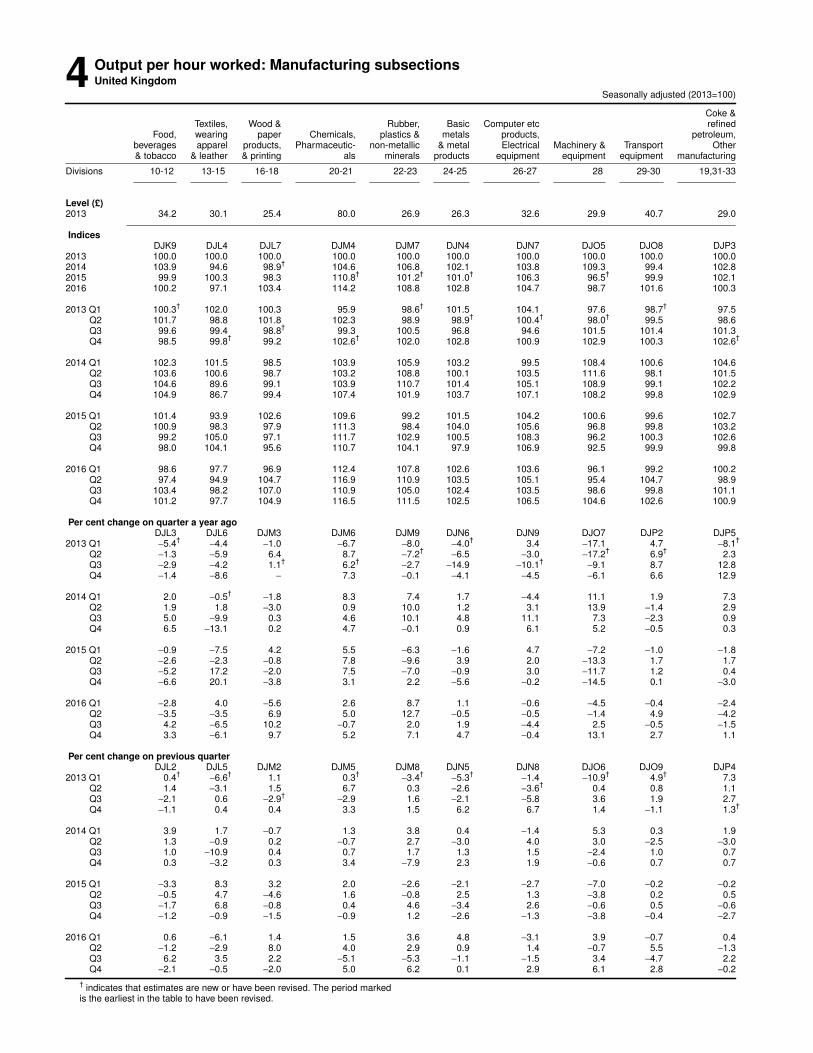
4 Output per hour worked: Manufacturing subsectionsUnited Kingdom
Seasonally adjusted (2013=100)
Coke &Te xtiles, Wood & Rubber, Basic Computer etc refined
Food, wear ing paper Chemicals, plastics & metals products, petroleum,beverages apparel products, Phar maceutic- non-metallic & metal Electrical Machinery & Transpor t Other& tobacco & leather & pr inting als minerals products equipment equipment equipment manufactur ing
Divisions 10-12 13-15 16-18 20-21 22-23 24-25 26-27 28 29-30 19,31-33
Level (£)2013 34.2 30.1 25.4 80.0 26.9 26.3 32.6 29.9 40.7 29.0
IndicesDJK9 DJL4 DJL7 DJM4 DJM7 DJN4 DJN7 DJO5 DJO8 DJP3
2013 100.0 100.0 100.0 100.0 100.0 100.0 100.0 100.0 100.0 100.02014 103.9 94.6 98.9
†104.6 106.8 102.1 103.8 109.3 99.4 102.8
2015 99.9 100.3 98.3 110.8†
101.2†
101.0†
106.3 96.5†
99.9 102.12016 100.2 97.1 103.4 114.2 108.8 102.8 104.7 98.7 101.6 100.3
2013 Q1 100.3†
102.0 100.3 95.9 98.6†
101.5 104.1 97.6 98.7†
97.5Q2 101.7 98.8 101.8 102.3 98.9 98.9
†100.4
†98.0
†99.5 98.6
Q3 99.6 99.4 98.8†
99.3 100.5 96.8 94.6 101.5 101.4 101.3Q4 98.5 99.8
†99.2 102.6
†102.0 102.8 100.9 102.9 100.3 102.6
†
2014 Q1 102.3 101.5 98.5 103.9 105.9 103.2 99.5 108.4 100.6 104.6Q2 103.6 100.6 98.7 103.2 108.8 100.1 103.5 111.6 98.1 101.5Q3 104.6 89.6 99.1 103.9 110.7 101.4 105.1 108.9 99.1 102.2Q4 104.9 86.7 99.4 107.4 101.9 103.7 107.1 108.2 99.8 102.9
2015 Q1 101.4 93.9 102.6 109.6 99.2 101.5 104.2 100.6 99.6 102.7Q2 100.9 98.3 97.9 111.3 98.4 104.0 105.6 96.8 99.8 103.2Q3 99.2 105.0 97.1 111.7 102.9 100.5 108.3 96.2 100.3 102.6Q4 98.0 104.1 95.6 110.7 104.1 97.9 106.9 92.5 99.9 99.8
2016 Q1 98.6 97.7 96.9 112.4 107.8 102.6 103.6 96.1 99.2 100.2Q2 97.4 94.9 104.7 116.9 110.9 103.5 105.1 95.4 104.7 98.9Q3 103.4 98.2 107.0 110.9 105.0 102.4 103.5 98.6 99.8 101.1Q4 101.2 97.7 104.9 116.5 111.5 102.5 106.5 104.6 102.6 100.9
Per cent chang e on quarter a year agoDJL3 DJL6 DJM3 DJM6 DJM9 DJN6 DJN9 DJO7 DJP2 DJP5
2013 Q1 −5.4†
−4.4 −1.0 −6.7 −8.0 −4.0†
3.4 −17.1 4.7 −8.1†
Q2 −1.3 −5.9 6.4 8.7 −7.2†
−6.5 −3.0 −17.2†
6.9†
2.3Q3 −2.9 −4.2 1.1
†6.2
†−2.7 −14.9 −10.1
†−9.1 8.7 12.8
Q4 −1.4 −8.6 − 7.3 −0.1 −4.1 −4.5 −6.1 6.6 12.9
2014 Q1 2.0 −0.5†
−1.8 8.3 7.4 1.7 −4.4 11.1 1.9 7.3Q2 1.9 1.8 −3.0 0.9 10.0 1.2 3.1 13.9 −1.4 2.9Q3 5.0 −9.9 0.3 4.6 10.1 4.8 11.1 7.3 −2.3 0.9Q4 6.5 −13.1 0.2 4.7 −0.1 0.9 6.1 5.2 −0.5 0.3
2015 Q1 −0.9 −7.5 4.2 5.5 −6.3 −1.6 4.7 −7.2 −1.0 −1.8Q2 −2.6 −2.3 −0.8 7.8 −9.6 3.9 2.0 −13.3 1.7 1.7Q3 −5.2 17.2 −2.0 7.5 −7.0 −0.9 3.0 −11.7 1.2 0.4Q4 −6.6 20.1 −3.8 3.1 2.2 −5.6 −0.2 −14.5 0.1 −3.0
2016 Q1 −2.8 4.0 −5.6 2.6 8.7 1.1 −0.6 −4.5 −0.4 −2.4Q2 −3.5 −3.5 6.9 5.0 12.7 −0.5 −0.5 −1.4 4.9 −4.2Q3 4.2 −6.5 10.2 −0.7 2.0 1.9 −4.4 2.5 −0.5 −1.5Q4 3.3 −6.1 9.7 5.2 7.1 4.7 −0.4 13.1 2.7 1.1
Per cent chang e on previous quarterDJL2 DJL5 DJM2 DJM5 DJM8 DJN5 DJN8 DJO6 DJO9 DJP4
2013 Q1 0.4†
−6.6†
1.1 0.3†
−3.4†
−5.3†
−1.4 −10.9†
4.9†
7.3Q2 1.4 −3.1 1.5 6.7 0.3 −2.6 −3.6
†0.4 0.8 1.1
Q3 −2.1 0.6 −2.9†
−2.9 1.6 −2.1 −5.8 3.6 1.9 2.7Q4 −1.1 0.4 0.4 3.3 1.5 6.2 6.7 1.4 −1.1 1.3
†
2014 Q1 3.9 1.7 −0.7 1.3 3.8 0.4 −1.4 5.3 0.3 1.9Q2 1.3 −0.9 0.2 −0.7 2.7 −3.0 4.0 3.0 −2.5 −3.0Q3 1.0 −10.9 0.4 0.7 1.7 1.3 1.5 −2.4 1.0 0.7Q4 0.3 −3.2 0.3 3.4 −7.9 2.3 1.9 −0.6 0.7 0.7
2015 Q1 −3.3 8.3 3.2 2.0 −2.6 −2.1 −2.7 −7.0 −0.2 −0.2Q2 −0.5 4.7 −4.6 1.6 −0.8 2.5 1.3 −3.8 0.2 0.5Q3 −1.7 6.8 −0.8 0.4 4.6 −3.4 2.6 −0.6 0.5 −0.6Q4 −1.2 −0.9 −1.5 −0.9 1.2 −2.6 −1.3 −3.8 −0.4 −2.7
2016 Q1 0.6 −6.1 1.4 1.5 3.6 4.8 −3.1 3.9 −0.7 0.4Q2 −1.2 −2.9 8.0 4.0 2.9 0.9 1.4 −0.7 5.5 −1.3Q3 6.2 3.5 2.2 −5.1 −5.3 −1.1 −1.5 3.4 −4.7 2.2Q4 −2.1 −0.5 −2.0 5.0 6.2 0.1 2.9 6.1 2.8 −0.2
†indicates that estimates are new or have been revised. The period marked
is the earliest in the table to have been revised.
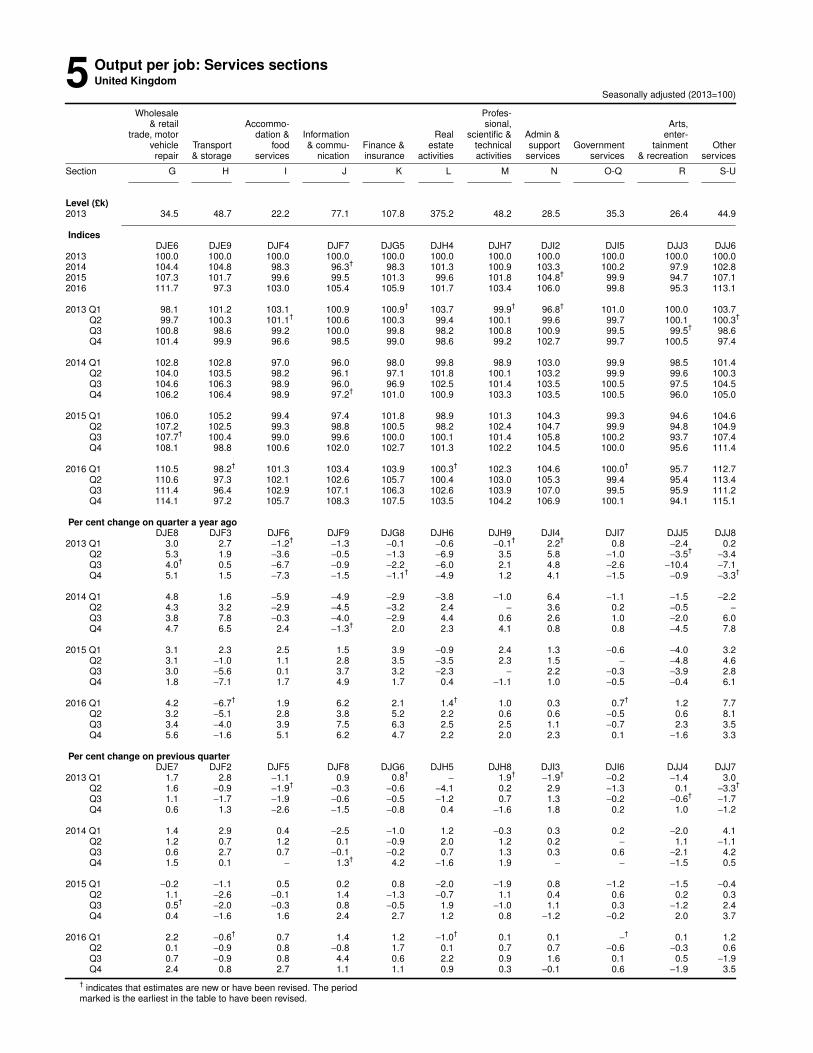
5 Output per job: Services sectionsUnited Kingdom
Seasonally adjusted (2013=100)
Wholesale Profes-& retail Accommo- sional, Arts,
trade, motor dation & Infor mation Real scientific & Admin & enter-vehicle Transpor t food & commu- Finance & estate technical suppor t Government tainment Otherrepair & storage services nication insurance activities activities services services & recreation services
Section G H I J K L M N O-Q R S-U
Level (£k)2013 34.5 48.7 22.2 77.1 107.8 375.2 48.2 28.5 35.3 26.4 44.9
IndicesDJE6 DJE9 DJF4 DJF7 DJG5 DJH4 DJH7 DJI2 DJI5 DJJ3 DJJ6
2013 100.0 100.0 100.0 100.0 100.0 100.0 100.0 100.0 100.0 100.0 100.02014 104.4 104.8 98.3 96.3
†98.3 101.3 100.9 103.3 100.2 97.9 102.8
2015 107.3 101.7 99.6 99.5 101.3 99.6 101.8 104.8†
99.9 94.7 107.12016 111.7 97.3 103.0 105.4 105.9 101.7 103.4 106.0 99.8 95.3 113.1
2013 Q1 98.1 101.2 103.1 100.9 100.9†
103.7 99.9†
96.8†
101.0 100.0 103.7Q2 99.7 100.3 101.1
†100.6 100.3 99.4 100.1 99.6 99.7 100.1 100.3
†
Q3 100.8 98.6 99.2 100.0 99.8 98.2 100.8 100.9 99.5 99.5†
98.6Q4 101.4 99.9 96.6 98.5 99.0 98.6 99.2 102.7 99.7 100.5 97.4
2014 Q1 102.8 102.8 97.0 96.0 98.0 99.8 98.9 103.0 99.9 98.5 101.4Q2 104.0 103.5 98.2 96.1 97.1 101.8 100.1 103.2 99.9 99.6 100.3Q3 104.6 106.3 98.9 96.0 96.9 102.5 101.4 103.5 100.5 97.5 104.5Q4 106.2 106.4 98.9 97.2
†101.0 100.9 103.3 103.5 100.5 96.0 105.0
2015 Q1 106.0 105.2 99.4 97.4 101.8 98.9 101.3 104.3 99.3 94.6 104.6Q2 107.2 102.5 99.3 98.8 100.5 98.2 102.4 104.7 99.9 94.8 104.9Q3 107.7
†100.4 99.0 99.6 100.0 100.1 101.4 105.8 100.2 93.7 107.4
Q4 108.1 98.8 100.6 102.0 102.7 101.3 102.2 104.5 100.0 95.6 111.4
2016 Q1 110.5 98.2†
101.3 103.4 103.9 100.3†
102.3 104.6 100.0†
95.7 112.7Q2 110.6 97.3 102.1 102.6 105.7 100.4 103.0 105.3 99.4 95.4 113.4Q3 111.4 96.4 102.9 107.1 106.3 102.6 103.9 107.0 99.5 95.9 111.2Q4 114.1 97.2 105.7 108.3 107.5 103.5 104.2 106.9 100.1 94.1 115.1
Per cent chang e on quarter a year agoDJE8 DJF3 DJF6 DJF9 DJG8 DJH6 DJH9 DJI4 DJI7 DJJ5 DJJ8
2013 Q1 3.0 2.7 −1.2†
−1.3 −0.1 −0.6 −0.1†
2.2†
0.8 −2.4 0.2Q2 5.3 1.9 −3.6 −0.5 −1.3 −6.9 3.5 5.8 −1.0 −3.5
†−3.4
Q3 4.0†
0.5 −6.7 −0.9 −2.2 −6.0 2.1 4.8 −2.6 −10.4 −7.1Q4 5.1 1.5 −7.3 −1.5 −1.1
†−4.9 1.2 4.1 −1.5 −0.9 −3.3
†
2014 Q1 4.8 1.6 −5.9 −4.9 −2.9 −3.8 −1.0 6.4 −1.1 −1.5 −2.2Q2 4.3 3.2 −2.9 −4.5 −3.2 2.4 − 3.6 0.2 −0.5 −
Q3 3.8 7.8 −0.3 −4.0 −2.9 4.4 0.6 2.6 1.0 −2.0 6.0Q4 4.7 6.5 2.4 −1.3
†2.0 2.3 4.1 0.8 0.8 −4.5 7.8
2015 Q1 3.1 2.3 2.5 1.5 3.9 −0.9 2.4 1.3 −0.6 −4.0 3.2Q2 3.1 −1.0 1.1 2.8 3.5 −3.5 2.3 1.5 − −4.8 4.6Q3 3.0 −5.6 0.1 3.7 3.2 −2.3 − 2.2 −0.3 −3.9 2.8Q4 1.8 −7.1 1.7 4.9 1.7 0.4 −1.1 1.0 −0.5 −0.4 6.1
2016 Q1 4.2 −6.7†
1.9 6.2 2.1 1.4†
1.0 0.3 0.7†
1.2 7.7Q2 3.2 −5.1 2.8 3.8 5.2 2.2 0.6 0.6 −0.5 0.6 8.1Q3 3.4 −4.0 3.9 7.5 6.3 2.5 2.5 1.1 −0.7 2.3 3.5Q4 5.6 −1.6 5.1 6.2 4.7 2.2 2.0 2.3 0.1 −1.6 3.3
Per cent chang e on previous quarterDJE7 DJF2 DJF5 DJF8 DJG6 DJH5 DJH8 DJI3 DJI6 DJJ4 DJJ7
2013 Q1 1.7 2.8 −1.1 0.9 0.8†
− 1.9†
−1.9†
−0.2 −1.4 3.0Q2 1.6 −0.9 −1.9
†−0.3 −0.6 −4.1 0.2 2.9 −1.3 0.1 −3.3
†
Q3 1.1 −1.7 −1.9 −0.6 −0.5 −1.2 0.7 1.3 −0.2 −0.6†
−1.7Q4 0.6 1.3 −2.6 −1.5 −0.8 0.4 −1.6 1.8 0.2 1.0 −1.2
2014 Q1 1.4 2.9 0.4 −2.5 −1.0 1.2 −0.3 0.3 0.2 −2.0 4.1Q2 1.2 0.7 1.2 0.1 −0.9 2.0 1.2 0.2 − 1.1 −1.1Q3 0.6 2.7 0.7 −0.1 −0.2 0.7 1.3 0.3 0.6 −2.1 4.2Q4 1.5 0.1 − 1.3
†4.2 −1.6 1.9 − − −1.5 0.5
2015 Q1 −0.2 −1.1 0.5 0.2 0.8 −2.0 −1.9 0.8 −1.2 −1.5 −0.4Q2 1.1 −2.6 −0.1 1.4 −1.3 −0.7 1.1 0.4 0.6 0.2 0.3Q3 0.5
†−2.0 −0.3 0.8 −0.5 1.9 −1.0 1.1 0.3 −1.2 2.4
Q4 0.4 −1.6 1.6 2.4 2.7 1.2 0.8 −1.2 −0.2 2.0 3.7
2016 Q1 2.2 −0.6†
0.7 1.4 1.2 −1.0†
0.1 0.1 −
†0.1 1.2
Q2 0.1 −0.9 0.8 −0.8 1.7 0.1 0.7 0.7 −0.6 −0.3 0.6Q3 0.7 −0.9 0.8 4.4 0.6 2.2 0.9 1.6 0.1 0.5 −1.9Q4 2.4 0.8 2.7 1.1 1.1 0.9 0.3 −0.1 0.6 −1.9 3.5
†indicates that estimates are new or have been revised. The period
mar ked is the earliest in the table to have been revised.

6 Output per hour worked: Services sectionsUnited Kingdom
Seasonally adjusted (2013=100)
Wholesale Profes-& retail Accommo- sional, Arts,
trade, motor dation & Infor mation Real scientific & Admin & enter-vehicle Transpor t food & commu- Finance & estate technical suppor t Government tainment Otherrepair & storage services nication insurance activities activities services services & recreation services
Section G H I J K L M N O-Q R S-U
Level (£)2013 22.8 26.6 16.3 42.0 60.3 244.6 27.4 18.3 24.5 20.5 30.0
IndicesDJQ4 DJQ7 DJR2 DJR5 DJS3 DJS6 DJS9 DJT7 DJU2 DJV6 DJV9
2013 100.0 100.0 100.0 100.0 100.0 100.0 100.0 100.0 100.0 100.0 100.02014 103.4 104.9 99.2 96.1 97.7 100.1 100.1
†106.9 99.7 96.3 102.3
2015 107.3 102.0 98.5†
100.1 102.0 97.3 100.6 106.0 99.6 92.8 107.32016 111.6 98.3 102.1 104.0 104.0 97.5 103.3 104.2 99.9 94.7 111.5
2013 Q1 98.2 100.0 102.5 101.5 101.8 103.5 99.9 95.4 101.2 98.7 103.5†
Q2 99.6 100.4 101.7 101.3 100.2 101.8†
100.1 98.8†
100.2 100.3†
101.4Q3 100.7 99.3
†98.7 99.0 98.6
†96.7 100.4
†101.6 99.1 100.7 100.1
Q4 101.5†
100.3 97.1 98.2†
99.3 98.0 99.6 104.2 99.5 100.2 95.0
2014 Q1 102.5 101.6 98.8†
95.7 96.8 98.2 99.8 105.9 99.7 98.6 98.6Q2 103.1 103.0 99.4 95.6 96.5 100.5 98.9 107.8 99.6 96.1 101.3Q3 102.8 106.9 99.7 96.5 97.0 103.8 100.0 107.6 99.9 96.9 102.2Q4 105.2 108.2 98.8 96.5 100.5 97.7 101.8 106.2 99.6 93.6 107.1
2015 Q1 105.7 105.6 98.6 98.2 103.0 95.8 99.4 106.4 99.3 90.6 103.4Q2 107.0 103.0 98.0 98.8 101.4 95.0 101.1 106.9 99.9 93.1 106.9Q3 108.8 100.9 97.5 100.9 101.6 96.5 101.2 107.1 100.1 93.7 107.9Q4 107.7 98.5 100.0 102.5 101.8 101.9 100.5 103.4 99.0 93.7 110.9
2016 Q1 109.5 98.9 101.6 102.7 102.5 99.1 100.5 104.3 99.6†
93.3 111.3Q2 111.0 98.3 101.0 102.9 104.3 94.5 104.9 101.8 100.4 96.0 110.0Q3 111.4 97.5 101.9 104.8 103.7 100.7 104.1 104.5 99.5 94.9 111.7Q4 114.5 98.5 103.9 105.4 105.6 95.5 103.5 106.2 100.2 94.6 113.0
Per cent chang e on quarter a year agoDJQ6 DJQ9 DJR4 DJR7 DJS5 DJS8 DJT6 DJT9 DJU7 DJV8 DJW3
2013 Q1 2.1 2.2 −4.7 −0.1 0.5 5.8 −1.1 0.4 −0.6 −1.8 0.2†
Q2 3.0 1.9 −5.8 −1.2 −2.0 −0.3†
2.0 4.9†
−0.9 −1.9 −3.5Q3 3.0 0.8 −8.6 −2.8 −2.6 −5.3 2.1
†6.5 −2.7 −5.9 −8.0
Q4 5.0†
1.5 −8.1 −5.2†
−1.7†
−3.5 0.4 5.1 −1.0 −0.5 −4.6
2014 Q1 4.4 1.6 −3.6†
−5.7 −4.9 −5.1 −0.1 11.0 −1.5 −0.1†
−4.7Q2 3.5 2.6 −2.3 −5.6 −3.7 −1.3 −1.2 9.1 −0.6 −4.2 −0.1Q3 2.1 7.7 1.0 −2.5 −1.6 7.3 −0.4 5.9 0.8 −3.8 2.1Q4 3.6 7.9
†1.8 −1.7 1.2 −0.3 2.2 1.9 0.1 −6.6 12.7
2015 Q1 3.1 3.9 −0.2 2.6 6.4 −2.4 −0.4 0.5 −0.4 −8.1 4.9Q2 3.8 − −1.4 3.3 5.1 −5.5 2.2 −0.8 0.3 −3.1 5.5Q3 5.8 −5.6 −2.2 4.6 4.7 −7.0 1.2 −0.5 0.2 −3.3 5.6Q4 2.4 −9.0 1.2 6.2 1.3 4.3 −1.3 −2.6 −0.6 0.1 3.5
2016 Q1 3.6 −6.3 3.0 4.6 −0.5 3.4 1.1 −2.0 0.3†
3.0 7.6Q2 3.7 −4.6 3.1 4.1 2.9 −0.5 3.8 −4.8 0.5 3.1 2.9Q3 2.4 −3.4 4.5 3.9 2.1 4.4 2.9 −2.4 −0.6 1.3 3.5Q4 6.3 − 3.9 2.8 3.7 −6.3 3.0 2.7 1.2 1.0 1.9
Per cent chang e on previous quarterDJQ5 DJQ8 DJR3 DJR6 DJS4 DJS7 DJT2 DJT8 DJU6 DJV7 DJW2
2013 Q1 1.6 1.2†
−3.0 −2.0 0.8†
1.9 0.7 −3.7 0.7 −2.0†
3.9†
Q2 1.4 0.4 −0.8 −0.2 −1.6 −1.6†
0.2 3.6†
−1.0 1.6 −2.0Q3 1.1 −1.1 −2.9 −2.3 −1.6 −5.0 0.3
†2.8 −1.1 0.4 −1.3
Q4 0.8†
1.0 −1.6 −0.8†
0.7 1.3 −0.8 2.6 0.4 −0.5 −5.1
2014 Q1 1.0 1.3 1.8†
−2.5 −2.5 0.2 0.2 1.6 0.2 −1.6 3.8Q2 0.6 1.4 0.6 −0.1 −0.3 2.3 −0.9 1.8 −0.1 −2.5 2.7Q3 −0.3 3.8 0.3 0.9 0.5 3.3 1.1 −0.2 0.3 0.8 0.9Q4 2.3 1.2 −0.9 − 3.6 −5.9 1.8 −1.3 −0.3 −3.4 4.8
2015 Q1 0.5 −2.4 −0.2 1.8 2.5 −1.9 −2.4 0.2 −0.3 −3.2 −3.5Q2 1.2 −2.5 −0.6 0.6 −1.6 −0.8 1.7 0.5 0.6 2.8 3.4Q3 1.7 −2.0 −0.5 2.1 0.2 1.6 0.1 0.2 0.2 0.6 0.9Q4 −1.0 −2.4 2.6 1.6 0.2 5.6 −0.7 −3.5 −1.1 − 2.8
2016 Q1 1.7 0.4 1.6 0.2 0.7 −2.7 − 0.9 0.6†
−0.4 0.4Q2 1.4 −0.6 −0.6 0.2 1.8 −4.6 4.4 −2.4 0.8 2.9 −1.2Q3 0.4 −0.8 0.9 1.8 −0.6 6.6 −0.8 2.7 −0.9 −1.1 1.5Q4 2.8 1.0 2.0 0.6 1.8 −5.2 −0.6 1.6 0.7 −0.3 1.2
†indicates that estimates are new or have been revised. The period
mar ked is the earliest in the table to have been revised.

7 Market sector productivityUnited Kingdom
Seasonally adjusted (2013=100)
Output per wor ker Output per hour wor ked
Per cent change on Per cent change on Per cent change on Per cent change onIndex quar ter a year ago previous quarter Index quar ter a year ago previous quarter
GYY4 GYY5 GYY6 GYY7 GYY8 GYY92013 100.0 .. .. 100.0 .. ..2014 100.9 .. .. 100.5 .. ..2015 101.6 .. .. 101.5 .. ..2016 102.8 .. .. 102.7 .. ..
2013 Q1 100.0 −0.8 0.6 100.1 −1.4 −
Q2 100.1 0.6 0.2 100.2 −0.3 0.1Q3 100.0 −0.5 −0.1
†99.7 −1.0 −0.4
†
Q4 99.9 0.5 −0.1 100.0 −0.1 0.2
2014 Q1 100.0 − 0.1 99.9 −0.2 −
Q2 100.6 0.5 0.6 100.2 − 0.3Q3 101.1 1.1 0.5 100.9 1.1 0.6Q4 101.8 1.9 0.7 101.2 1.2 0.3
2015 Q1 101.3 1.3 −0.5 101.2 1.3 0.1Q2 102.1 1.5 0.7 101.7 1.5 0.5Q3 101.6
†0.4 −0.5 101.9 1.0 0.2
Q4 101.6 −0.1 0.1 101.3 0.1 −0.6
2016 Q1 102.0 0.6†
0.3 101.8†
0.6†
0.6Q2 102.4 0.3 0.5 102.5 0.8 0.7Q3 103.0 1.4 0.6 102.9 1.0 0.4Q4 103.8 2.1 0.8 103.8 2.5 0.8
†indicates that estimates are new or have been revised. The period marked
is the earliest in the table to have been revised

8 Output per job and hour worked: Other industries1
United Kingdom
(2013=100)
Agriculture, forestr y and fishing Constr uction
Output per Output per hour Output per Output per hourjob wor ked job worked
Section A A F F
Level (£)2013 31 200 14.2 46 300 24.0
Indices
DJ4K DJJ9 DJD8 DJP62000 95.2 92.7 100.5 96.42001 97.6 98.2 100.3 96.4
†
2002 112.4 114.6†
104.2 101.02003 107.9 108.0 106.6 104.82004 103.0 103.1 109.4 107.7
2005 104.3 107.4 103.7 102.62006 99.5
†100.1 103.2 102.0
2007 96.8 99.4 102.2 101.12008 99.8 102.0 99.1 99.52009 92.6 88.3 89.5 91.8
2010 86.4 81.8 102.5 103.62011 95.4 93.6 105.1 108.12012 88.5 91.1 98.7 100.92013 100.0 100.0 100.0 100.02014 100.2 99.5 104.9 102.3
2015 111.9 115.2 107.8 106.32016 107.1 106.6 107.8 106.2
Per cent chang e on previous year
DJ4L DJK2 DJE2 DJP82000 9.8 8.6 0.2 −0.42001 2.5 6.0
†−0.2 0.1
2002 15.2 16.7 3.9 4.8†
2003 −4.0 −5.8 2.3 3.72004 −4.5 −4.6 2.6 2.8
2005 1.3 4.2 −5.2 −4.72006 −4.6
†−6.8 −0.5 −0.6
2007 −2.7 −0.7 −1.0 −0.82008 3.1 2.6 −3.0 −1.62009 −7.2 −13.4 −9.7 −7.7
2010 −6.7 −7.4 14.5 12.92011 10.4 14.4 2.5 4.42012 −7.2 −2.7 −6.1 −6.72013 13.0 9.9 1.3 −0.92014 0.2 −0.5 4.9 2.4
2015 11.7 15.8 2.8 3.82016 −4.3 −7.4 − −0.1
1 Productivity figures for industry F are exper imental†indicates that estimates are new or have been revised. The period marked
is the earliest in the table to have been revised

9 Productivity measures by region
(UK=100)
2009 2010 2011 2012 2013 2014 2015
United Kingdom 100.0 100.0 100.0 100.0 100.0 100.0 100.0
Nominal GVA per filled job
Nor th East DJDO 83.1†
83.7 84.9 85.7 84.9 86.1 85.3Nor th West DJDP 91.8
†90.9 88.9 89.5 89.9 88.7 90.1
Yorkshire and The Humber DMBC 88.8†
87.1 86.7 86.8 86.7 85.0 84.3East Midlands DMBE 86.7
†87.6 86.6 87.1 88.3 88.9 87.6
West Midlands DMDN 86.5†
88.1 88.4 88.0 87.6 88.4 87.3East of England DMDQ 98.7
†99.0 98.2 97.1 98.4 98.0 97.5
London DMGH 138.7†
140.1 142.9 139.9 137.1 138.8 139.0South East DMGJ 106.8 106.9
†106.0 106.7 107.6 107.2 107.1
South West DMGK 91.0†
91.2 88.9 89.9 89.3 89.0 89.4England DMGL 101.8 102.1 102.0 101.9 101.8 102.0 101.9Wales DMGM 80.0 78.6
†81.1 81.4 81.5 78.4 79.0
Scotland DMGX 96.7†
95.0 94.3 93.8 95.2 95.4 96.2Nor thern Ireland DMOA 85.6
†83.5 84.6 86.8 85.5 83.8 83.5
Nominal GVA per hour worked
Nor th East DMOB 85.1 85.4†
87.4 88.4 87.7 88.0 87.6Nor th West DMOH 93.2
†91.4 90.5 90.5 91.6 88.8 90.1
Yorkshire and The Humber DMOK 90.2†
88.4 87.5 87.7 87.9 86.0 86.1East Midlands DMOL 87.0 87.1
†87.4 88.0 89.3 90.3 86.9
West Midlands DMON 86.4†
87.3 88.7 87.9 87.4 87.9 85.3East of England DMOO 100.2
†100.3 99.6 98.4 99.2 100.1 99.2
London DMOR 130.2†
131.1 133.1 130.9 128.9 130.9 131.6South East DMOS 108.6 109.9
†107.9 107.7 109.0 108.2 109.3
South West DMOT 93.9†
94.3 91.6 92.9 92.1 92.2 92.8England DMOV 101.8 102.0
†101.9 101.7 101.8 101.8 101.7
Wales DMOW 81.9 80.8†
82.0 84.0 83.4 81.2 80.5Scotland DMOY 96.8
†96.1 95.3 95.7 96.2 97.0 98.3
Nor thern Ireland DMWA 81.5†
80.9 82.2 83.5 81.1 79.3 80.9
†indicates that estimates are new or have been revised. The period marked
is the earliest in the table to have been revised.
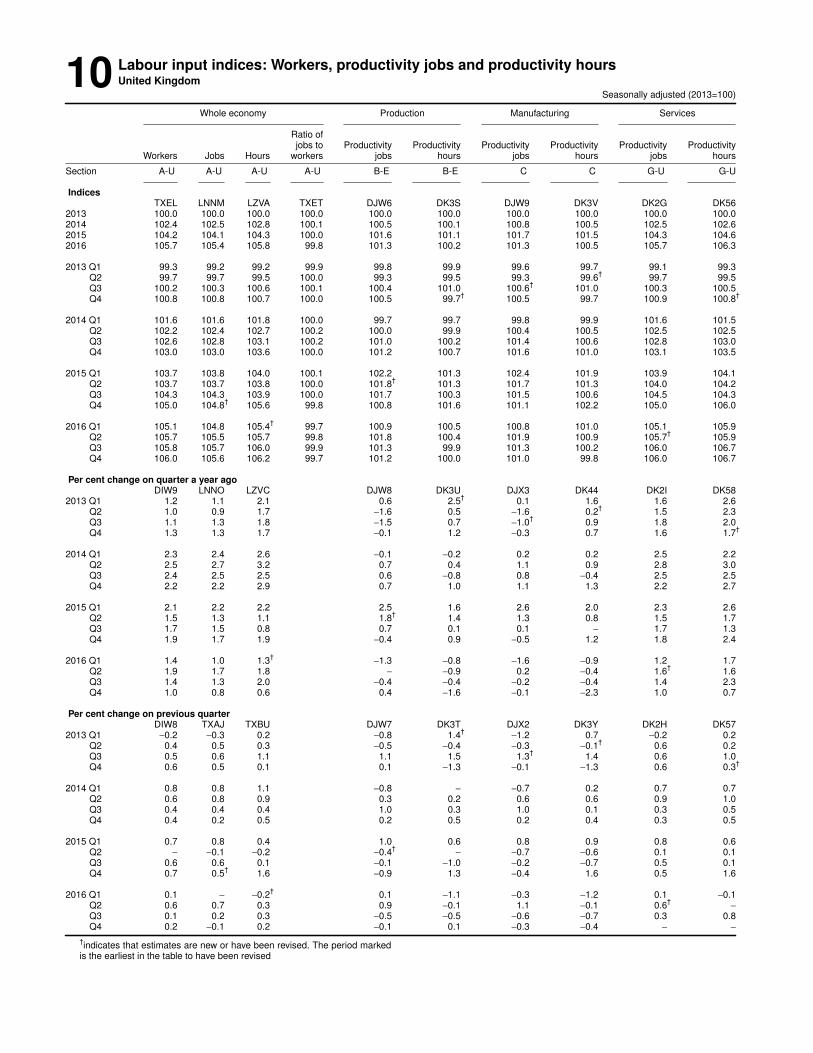
10 Labour input indices: Workers, productivity jobs and productivity hoursUnited Kingdom
Seasonally adjusted (2013=100)
Whole economy Production Manufactur ing Ser vices
Ratio ofjobs to Productivity Productivity Productivity Productivity Productivity Productivity
Workers Jobs Hours wor kers jobs hours jobs hours jobs hours
Section A-U A-U A-U A-U B-E B-E C C G-U G-U
IndicesTXEL LNNM LZVA TXET DJW6 DK3S DJW9 DK3V DK2G DK56
2013 100.0 100.0 100.0 100.0 100.0 100.0 100.0 100.0 100.0 100.02014 102.4 102.5 102.8 100.1 100.5 100.1 100.8 100.5 102.5 102.62015 104.2 104.1 104.3 100.0 101.6 101.1 101.7 101.5 104.3 104.62016 105.7 105.4 105.8 99.8 101.3 100.2 101.3 100.5 105.7 106.3
2013 Q1 99.3 99.2 99.2 99.9 99.8 99.9 99.6 99.7 99.1 99.3Q2 99.7 99.7 99.5 100.0 99.3 99.5 99.3 99.6
†99.7 99.5
Q3 100.2 100.3 100.6 100.1 100.4 101.0 100.6†
101.0 100.3 100.5Q4 100.8 100.8 100.7 100.0 100.5 99.7
†100.5 99.7 100.9 100.8
†
2014 Q1 101.6 101.6 101.8 100.0 99.7 99.7 99.8 99.9 101.6 101.5Q2 102.2 102.4 102.7 100.2 100.0 99.9 100.4 100.5 102.5 102.5Q3 102.6 102.8 103.1 100.2 101.0 100.2 101.4 100.6 102.8 103.0Q4 103.0 103.0 103.6 100.0 101.2 100.7 101.6 101.0 103.1 103.5
2015 Q1 103.7 103.8 104.0 100.1 102.2 101.3 102.4 101.9 103.9 104.1Q2 103.7 103.7 103.8 100.0 101.8
†101.3 101.7 101.3 104.0 104.2
Q3 104.3 104.3 103.9 100.0 101.7 100.3 101.5 100.6 104.5 104.3Q4 105.0 104.8
†105.6 99.8 100.8 101.6 101.1 102.2 105.0 106.0
2016 Q1 105.1 104.8 105.4†
99.7 100.9 100.5 100.8 101.0 105.1 105.9Q2 105.7 105.5 105.7 99.8 101.8 100.4 101.9 100.9 105.7
†105.9
Q3 105.8 105.7 106.0 99.9 101.3 99.9 101.3 100.2 106.0 106.7Q4 106.0 105.6 106.2 99.7 101.2 100.0 101.0 99.8 106.0 106.7
Per cent chang e on quarter a year agoDIW9 LNNO LZVC DJW8 DK3U DJX3 DK44 DK2I DK58
2013 Q1 1.2 1.1 2.1 0.6 2.5†
0.1 1.6 1.6 2.6Q2 1.0 0.9 1.7 −1.6 0.5 −1.6 0.2
†1.5 2.3
Q3 1.1 1.3 1.8 −1.5 0.7 −1.0†
0.9 1.8 2.0Q4 1.3 1.3 1.7 −0.1 1.2 −0.3 0.7 1.6 1.7
†
2014 Q1 2.3 2.4 2.6 −0.1 −0.2 0.2 0.2 2.5 2.2Q2 2.5 2.7 3.2 0.7 0.4 1.1 0.9 2.8 3.0Q3 2.4 2.5 2.5 0.6 −0.8 0.8 −0.4 2.5 2.5Q4 2.2 2.2 2.9 0.7 1.0 1.1 1.3 2.2 2.7
2015 Q1 2.1 2.2 2.2 2.5 1.6 2.6 2.0 2.3 2.6Q2 1.5 1.3 1.1 1.8
†1.4 1.3 0.8 1.5 1.7
Q3 1.7 1.5 0.8 0.7 0.1 0.1 − 1.7 1.3Q4 1.9 1.7 1.9 −0.4 0.9 −0.5 1.2 1.8 2.4
2016 Q1 1.4 1.0 1.3†
−1.3 −0.8 −1.6 −0.9 1.2 1.7Q2 1.9 1.7 1.8 − −0.9 0.2 −0.4 1.6
†1.6
Q3 1.4 1.3 2.0 −0.4 −0.4 −0.2 −0.4 1.4 2.3Q4 1.0 0.8 0.6 0.4 −1.6 −0.1 −2.3 1.0 0.7
Per cent chang e on previous quarterDIW8 TXAJ TXBU DJW7 DK3T DJX2 DK3Y DK2H DK57
2013 Q1 −0.2 −0.3 0.2 −0.8 1.4†
−1.2 0.7 −0.2 0.2Q2 0.4 0.5 0.3 −0.5 −0.4 −0.3 −0.1
†0.6 0.2
Q3 0.5 0.6 1.1 1.1 1.5 1.3†
1.4 0.6 1.0Q4 0.6 0.5 0.1 0.1 −1.3 −0.1 −1.3 0.6 0.3
†
2014 Q1 0.8 0.8 1.1 −0.8 − −0.7 0.2 0.7 0.7Q2 0.6 0.8 0.9 0.3 0.2 0.6 0.6 0.9 1.0Q3 0.4 0.4 0.4 1.0 0.3 1.0 0.1 0.3 0.5Q4 0.4 0.2 0.5 0.2 0.5 0.2 0.4 0.3 0.5
2015 Q1 0.7 0.8 0.4 1.0 0.6 0.8 0.9 0.8 0.6Q2 − −0.1 −0.2 −0.4
†− −0.7 −0.6 0.1 0.1
Q3 0.6 0.6 0.1 −0.1 −1.0 −0.2 −0.7 0.5 0.1Q4 0.7 0.5
†1.6 −0.9 1.3 −0.4 1.6 0.5 1.6
2016 Q1 0.1 − −0.2†
0.1 −1.1 −0.3 −1.2 0.1 −0.1Q2 0.6 0.7 0.3 0.9 −0.1 1.1 −0.1 0.6
†−
Q3 0.1 0.2 0.3 −0.5 −0.5 −0.6 −0.7 0.3 0.8Q4 0.2 −0.1 0.2 −0.1 0.1 −0.3 −0.4 − −
†indicates that estimates are new or have been revised. The period marked
is the earliest in the table to have been revised

R1REVISIONS ANALYSISRevisions since previously published estimates
Whole economy
Output per wor ker Output per job Output per hour wor ked Unit labour costs
Per cent change Per cent change Per cent change Per cent change Per cent change Per cent change Per cent change Per cent changeon quarter a on previous on quar ter a on previous on quar ter a on previous on quar ter a on previous
year ago quar ter year ago quar ter year ago quar ter year ago quar ter
A4YN A4YO LNNP DMWR LZVD TXBB DMWN DMWO2012 Q3 − − − − − − − −
Q4 − − − − − − − −
2013 Q1 − − − − − − − −
Q2 − − − − − − − −
Q3 − − − − − − − −
Q4 − − − − − − − −
2014 Q1 − − − − − − − −
Q2 − − − − − − − −
Q3 − − − − − − − −
Q4 − − − − − − − −
2015 Q1 − − − − − − − −
Q2 − − − − − − − −
Q3 − − − − − − − −
Q4 − − − − − − − −
2016 Q1 −0.2 −0.2 −0.2 −0.2 −0.1 −0.1 0.2 0.1Q2 −0.4 −0.2 −0.3 −0.1 −0.3 −0.2 0.3 0.1Q3 −0.5 −0.1 −0.5 −0.2 −0.5 −0.2 0.2 −0.1
Manufactur ing
Output per job Output per hour wor ked Unit wage costs
Per cent change on Per cent change on Per cent change on Per cent change on Per cent change on Per cent change onquar ter a year ago previous quarter quarter a year ago previous quarter quarter a year ago previous quarter
DJ4R DJ4Q DJK8 DJK7 DJ4J DJ4I2012 Q3 0.1 − − − − −
Q4 − − −0.1 −0.1 − −
2013 Q1 − − − 0.1 − −
Q2 − − − − − −
Q3 −0.1 −0.1 − − 0.1 0.1Q4 − 0.1 0.1 − − −0.1
2014 Q1 − − − − − −
Q2 − − 0.1 0.1 − −
Q3 0.1 − − −0.1 − 0.1Q4 − − −0.1 −0.1 − −0.1
2015 Q1 0.1 0.1 − 0.1 −0.1 −0.1Q2 −0.1 −0.2 −0.1 − − 0.1Q3 − 0.1 − − −0.1 −
Q4 − − − − 0.1 0.1
2016 Q1 0.1 0.2 0.3 0.3 −0.1 −0.3Q2 0.5 0.2 0.4 0.1 −0.3 −0.1Q3 0.4 − 0.5 0.1 −0.4 −0.2
Ser vices
Output per job Output per hour wor ked
Per cent change on quarter a Per cent change on previous Per cent change on quarter a Per cent change on previousyear ago quar ter year ago quar ter
DJE5 DJE4 DJQ3 DJQ22012 Q3 − − − −
Q4 − − − −
2013 Q1 − − − −
Q2 − − − −
Q3 − − − −
Q4 − − −0.1 −0.1
2014 Q1 − − − 0.1Q2 − − − −
Q3 − − − −
Q4 − − − −0.1
2015 Q1 − − − 0.1Q2 − − − −
Q3 − − − −
Q4 −0.1 −0.1 0.1 −
2016 Q1 − 0.1 0.2 0.2Q2 0.1 0.1 0.1 −0.1Q3 − −0.1 − −0.1