wages and labour productivity in indian...
TRANSCRIPT

1 Manufacturing
The micro economic theory of labour market posits that in the short run, assuming factor and product markets perfectly competitive, profit maximising firm goes on employing labour until the real wage rate equals the value of marginal product of the labour (Lal, 1979 provides a lucid explanation of the micro economic theory of wage). Quite important, in the short run, capital tends to remain fixed, making the output being sensitive only to the labour. However, the rationality that is applicable to the short run is unlikely to emerge as a profit maximising scenario when both the capital and labour change in the long run. Drawing cues from micro economic theory of production in the long run, the profit maximising employment of labour leads to wage is being determined by capital labour ratio (Appendix 1). While these models capture firms’ decision making to determine employment and wage, known as the demand side of the labour market, variations in wage also emanate from household-personal characteristics of labour, called the supply side of the labour market. As illustrated by the economic theory, wage may be specified as function of age, years of schooling, and socio-demographic characteristics, culminating in direct relation between wage and years of schooling (Schultz, 1961). Juxtaposing both the demand and the supply, direct relation of wage with productivity, capital-labour ratio, and educational attainment presumably lead to an inference that points to why technological changes, implicit in increasing capital labour ratio over time, require workers with higher educational attainment who are to be paid higher for their higher productivity levels.
Wages and Labour Productivity in Indian Manufacturing
Bino PaulTata Institute of Social Sciences, Mumbai
The manufacturing labour market in India is far from being a space that allows free matching of employers’ and labour’s expectation. Indian manufacturing work systems continue to be highly homogenous, defying the emerging human resource management paradigms that are built around employee engagement, sustainable performance, gender diversity, career growth and trust. While there is a direct relationship between wage rate and productivity, the conversion of productivity to wage is interrupted by many factors importantly, archaic labour laws and ineffective enforcement systems that need widespread reform.
88

2Wages and Labour Productivity in Indian Manufacturing / Bino Paul
We, drawing cues from basic micro economic theory of labour market, explore determinants of wages in Indian manufacturing, covering both the demand and the supply side.1 Wage Productivity Relation There exists a direct relationship between the two variables which is linked to value addition by a firm and the substitution process between labour and capital. Using data from Annual Survey of Industries (ASI), we infer that there’s a negative relation between employment and adoption of technology. Across industries, however, real wages have remained static over time pointing the need of policy intervention. This linkage of low real wages and productivity growth in the organized manufacturing sector has led to the enormous growth of the informal sector which is more flexible. As observed from the survey period, wage productivity relations involves both product and process innovation. The relation between productivity and wages has been explored using standard microeconomic theory of wage determination. We use real wages, defined as nominal emolument per employee2 divided by Consumer Price Index (CPI) deflator while we use average productivity, derived by dividing value of output by manufacturing price deflators per employee to measure productivity; both have been valued at 2001-02 prices. We form the database by pooling the data of 57 industries, as classified by National Industrial Classification (NIC) 2004, during 1993-1994 to 2007-2008. This forms a panel of 845 data units.3 Figure 1 portrays the relation between wage rate and productivity after aggregating 57 industries into 22 industrial groups, following the NIC 2 digit classification. Overall, the pattern indicates a direct relation. Disaggregating the pattern, as shown in appendix 2, we observe direct relation between real wage and productivity, notwithstanding a few vague patterns between these two variables. As given in Table 1, different papers that were published during 1960-2013 corroborate the positive relation between wage rate and productivity in Indian manufacturing.
89
1 While the demand side is captured by using a panel database (A database becomes a panel when there are multiple units of time and multiple cases.) of manufacturing industries, disaggregated for National Industrial Classification (NIC) 3 digit during 1993-1994-2007-08, supply side is elucidated by plotting patterns drawn from National Sample Survey 66th Round unit records. 2 According to Annual Survey Industries (ASI), employees include work men and managerial and supervi-sory staff. As shown in Appendix 3, across industries percentage of workmen out of employees hovers in the range of 60 to 80, barring a few exceptions. 3 Although the panel ought to have 57 industries and 15 units of time, sizing 855 data units, due to missing observations the panel is delimited by 845 units.

3 Manufacturing
Table 1: Select Papers on Wage-Productivity Relation in Indian Manufacturing
Hajra (1963) Positive Relation between wage rate and productivity(Time series data: 1952-1958)
Johri and Agarwal (1966) Positive Relation between wage rate and productivity (Time series data: 1950-1961)
Dadi (1970) Positive Relation between wage rate and productivity(1962 cross sectional data)
Verma (1972) Positive Relation between wage rate and productivity (Time series data: 1950-1964)
Sen (1985) Positive Relation between rate of change in wage rate and rate of change in productivity (Time series data: 1960-1976)
Banga (2005) Positive Relation between wage rate and productivity (Panel data: 1991-92-1997-98)
Muralidharan et al (2013) Positive Relation between wage rate and productivity (Panel data: 1993-04-2007-08)
Figure 1: Real Wage and Average Employee Productivity during 1993-04-2007-08
Source: Pooled Data across industries and years extracted from Annual Survey Industries (ASI) 1973-74-2003-04, EPW Research Foundation Compact Disc and ASI reports
However, across industries, as depicted in Appendix 4, real wage rate appears to be more static during 1993-94-2007-08.4 Muralidharan et al (2013), point to the yawning
90
4 Trivedi et al (2011) share concern on stagnation of real wage rates for manufacturing workers.
4Wages and Labour Productivity in Indian Manufacturing / Bino Paul
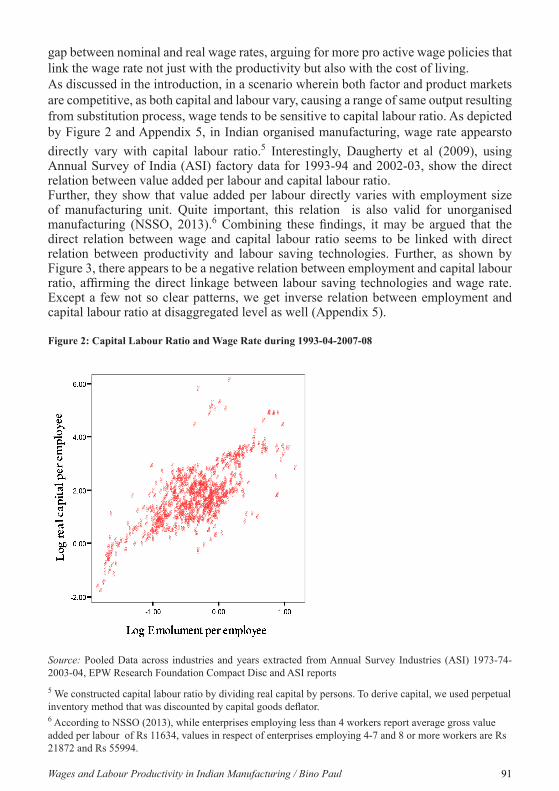
gap between nominal and real wage rates, arguing for more pro active wage policies that link the wage rate not just with the productivity but also with the cost of living. As discussed in the introduction, in a scenario wherein both factor and product markets are competitive, as both capital and labour vary, causing a range of same output resulting from substitution process, wage tends to be sensitive to capital labour ratio. As depicted by Figure 2 and Appendix 5, in Indian organised manufacturing, wage rate appearsto directly vary with capital labour ratio.5 Interestingly, Daugherty et al (2009), using Annual Survey of India (ASI) factory data for 1993-94 and 2002-03, show the direct relation between value added per labour and capital labour ratio.Further, they show that value added per labour directly varies with employment size of manufacturing unit. Quite important, this relation is also valid for unorganised manufacturing (NSSO, 2013).6 Combining these findings, it may be argued that the direct relation between wage and capital labour ratio seems to be linked with direct relation between productivity and labour saving technologies. Further, as shown by Figure 3, there appears to be a negative relation between employment and capital labour ratio, affirming the direct linkage between labour saving technologies and wage rate. Except a few not so clear patterns, we get inverse relation between employment and capital labour ratio at disaggregated level as well (Appendix 5).
Figure 2: Capital Labour Ratio and Wage Rate during 1993-04-2007-08
Source: Pooled Data across industries and years extracted from Annual Survey Industries (ASI) 1973-74-2003-04, EPW Research Foundation Compact Disc and ASI reports
91
5 We constructed capital labour ratio by dividing real capital by persons. To derive capital, we used perpetual inventory method that was discounted by capital goods deflator.6 According to NSSO (2013), while enterprises employing less than 4 workers report average gross value added per labour of Rs 11634, values in respect of enterprises employing 4-7 and 8 or more workers are Rs 21872 and Rs 55994.

5 Manufacturing
Figure 3: Capital Labour Ratio and Labour during 1993-04-2007-08
Source: Pooled Data across industries and years extracted from Annual Survey Industries (ASI) 1973-74-2003-04, EPW Research Foundation Compact Disc and ASI reports
Drawing cues from above patterns, wages have a direct but weak relationship with productivity in the short run in organised manufacturing. Moreover, wage rate appears to be weakly influenced by capital labour ratio (see Appendix 6). These findings indicate how persistent the wage-productivity relation is. While a school of scholars sees this situation emanating from lack flexibility in labour market due to archaic labour laws, the opposing school views that Indian labour market as hugely flexible that manifests itself in the enormity of informal sector in India (Bino, 2013). It can be inferred that wage-productivity relations are driven by both product and process innovation if we view industrial relations more than as a source for keeping nominal wages low. Determinants of Wage The human capital theory of labour supply expresses wage as a function of age, and years of schooling. Extending this function, we relate wage with educational attainment, technical qualification, vocational training, social category, gender, area of residence, type of employment, and occupation. As shown in Table 2, close to a half of employed have attained not more than seven years of schooling while 90 per cent of them do not have any technical qualification. Moreover, only 7 per cent have attained formal vocational training. Socially disadvantaged social groups - scheduled tribe, scheduled
92

6Wages and Labour Productivity in Indian Manufacturing / Bino Paul
caste and other backward class - form 57 per cent of employment, while women are just one-tenth of workforce. Only 27 per cent of the workforce stays in rural areas. Nearly two-thirds of the workforce is in informal employment that does not entitle employees to any social security. A whopping 90 per cent of workforce belongs to the occupational category ‘workmen’. In summary, two features are to be highlighted: (a) the absorption of persons having technical qualification/vocational qualification or tertiary education in manufacturing industry appears to be quite limited that may pause critical challenges, in particular in the context of increasing capital labour ratio, and (b) manufacturing is yet to emerge as a gender inclusive work system.
Table 2: Characteristics of Workforce in Indian Manufacturing 2009-10
Educational Attainment Percent Social Group Percent
Not Literate 8.4 Scheduled Tribe 2.4
Just Literate 6.2 Scheduled Caste 16.2
Primary 14.7 Other Backward class 38.6
Middle 20.0 Others 42.8
Secondary 19.3 Total 100.0
Higher Secondary/Diploma 15.6 Gender Percent
Graduate 12.4 Male 90.4
Post Graduate 3.4 Female 9.6
Total 100.0 Total 100.0
Technical Qualification Percent Area Percent
Graduate 1.8 Rural 27.3
Diploma 6.3 Urban 72..7
PG Diploma 1.7 Total 100.0
No Technical Qualification 90.2 Type of Employment Valid Percent
Total 100.0 Informal 66.7
Vocational Training Percent Formal 33.3
Formal Vocational Training 7.4 Total 100.0
Informal Vocational Training 18.8 Occupation Valid Percent
No Vocational Training 73.8 Workmen 89.1
Total 100.0 Managerial Staff 10.9
Total 100.0
Source: Computed from National Sample Survey 66th Round Unit Records
93

7 Manufacturing
Figure 4 depicts Lorenz curve of wage distribution in Indian manufacturing that combines both managerial and workmen categories. While lowest 20 per cent gets just 5 per cent of wages, lowest 40 per cent, 60 per cent and 80 per cent get 13 per cent 25 per cent and 45 per cent of cumulative wage, respectively.
Figure 4: Lorenz Curve of Weekly Wage in Indian Manufacturing (Male + Female; age 15-64), (Usual Principal Status), 2009-10
Vertical Axis (Cumulative share of wages) and Horizontal Axis (Cumulative share of employed persons from lowest to highest wage (N=5454) Source: Computed from National Sample Survey (NSS) 66th Round Unit Records
As shown in Figure 4, the departure of cumulative wage from the 45 degree line of absolute equality evokes questions concerning the sources of wage differential in the labour market. To assess the wage differential, we cross tabulate wages with respect to variables listed in Table 2. We compute median wage for each category since we found that arithmetic mean of wage was sensitive to the outliers.7 The median weekly wage tends to go up with educational attainment. While the post graduate earns the highest weekly median wage i.e. Rs 3670, median weekly wages for graduates and holders of higher secondary/diploma certificates are Rs 2800 and Rs 1500, respectively. This is quite consistent with the human capital theory.8 Further, graduates in technical disciplines earn Rupees 5000, significantly higher than the apex earning by post graduates in the general education stream. However, compared to post graduates and technical graduates, persons who have attained formal vocational training earn much lesser wage i.e. Rs. 2000. Presumably, this differential emanates
94
7 Either too large or too small values that impact the mean.8 Human capital theory posits positive relation between earning and years of schooling.

8Wages and Labour Productivity in Indian Manufacturing / Bino Paul
from occupational differences since persons having tertiary education are more likely to be absorbed in better paid managerial/supervisory roles than persons with vocational training. It appears persons with formal vocational training earn more than persons who do not have formal vocational training. Characteristics that lead to higher wage include person being of forward caste, male, located in urban areas, employed as formal workers, and belonging to managerial and supervisory occupations (see Appendix 7 for multivariate analysis of wage function).
Table 3: Characteristics of Workforce and Median Weekly Wages (Indian Rupees) in Indian Manufacturing 2009-10 (Age group 15-64)
Educational Attainment Median Weekly Wage
Social Categories Median Weekly Wage
Not Literate 700.00 Scheduled Tribe 1,006.00
Just Literate 750.00 Scheduled Caste 802.50
Primary 800.00 Other Backward class 1,000.00
Middle 900.00 Others 1,400.00
Secondary 1,055.00 Total 1,050.00
Higher Secondary/Diploma 1,500.00 Gender Median Weekly Wage
Graduate 2,800.00 Male 1,100.00
Post Graduate 3,670.00 Female 666.00
Technical education Median Weekly Wage Total 1,050.00
Graduate 5,000.00 Area Median Weekly Wage
Diploma 2,500.00 Rural 881.00
Post Graduate Diploma 3,896.00 Urban 1,169.00
No Technical Education 1,000.00 Total 1,050.00
Total 1,050.00 Type of employment Median Weekly Wage
Vocational Education Median Weekly Wage Informal 840.00
Formal 2,000.00 Formal 2,000.00
Informal 1,000.00 Total 1,050.00
No Vocational Training 1,025.00 Occupation Median Weekly Wage
Total 1,050.00 Workmen 1,000.00
Managerial and Super-visory
3,000.00
Total 1,050.00
Source: Computed from National Sample Survey 66th Round Unit Records
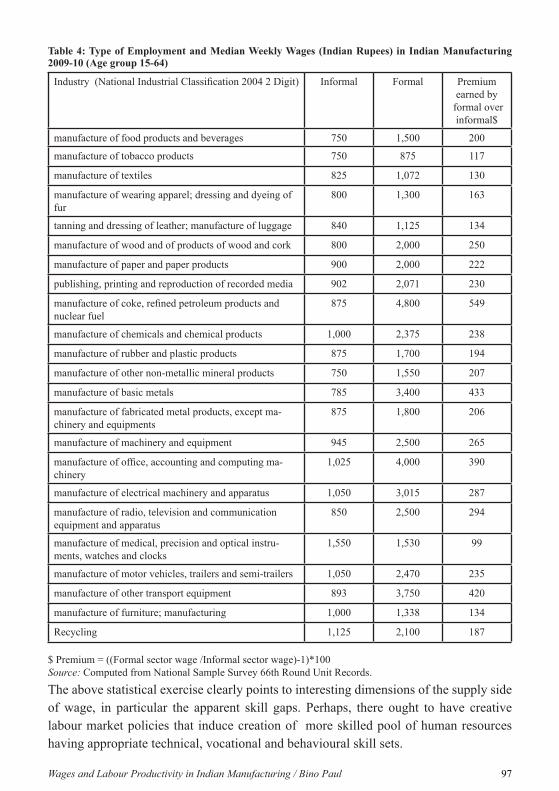
Combining perceptible advantages that generate wage premium in manufacturing, we pick type of employment as a representative case to see if the differential varies across
95

9 Manufacturing
industries. Quite important, type of employment, a nominal variable that is made of formal and informal employment, is in fact a combination of multiple scenarios. For example, a person who is, in formal employment that generates higher wage and social security, is likely to have attained more educational attainment and has higher chances to be in managerial and supervisory category, and so on, while informal employment represents the opposite case. As shown in Table 6, premium earned by formal work over informal work varies between 99 per cent and 549 per cent. As shown by Muralidharan et al (2013), the wage structure in manufacturing is characterised by visible gap in trend growth rates of wage rate between managerial and supervisory occupation and workmen; the median ratio of growth rates in respects of former and latter is 2.5. Perhaps, this wage structure that is embedded in perceptible differentials may have its roots in lack of occupational mobility at the shop floor and inadequate on-the-job training to enhance human capital formation. Further, they point to the insensitivity of minimum wages to skill acquisition in India, showing abysmal wage premium for the skill being offered by minimum wage legislation.
96
10Wages and Labour Productivity in Indian Manufacturing / Bino Paul
Table 4: Type of Employment and Median Weekly Wages (Indian Rupees) in Indian Manufacturing 2009-10 (Age group 15-64)
Industry (National Industrial Classification 2004 2 Digit) Informal Formal Premium earned by
formal over informal$
manufacture of food products and beverages 750 1,500 200
manufacture of tobacco products 750 875 117
manufacture of textiles 825 1,072 130
manufacture of wearing apparel; dressing and dyeing of fur
800 1,300 163
tanning and dressing of leather; manufacture of luggage 840 1,125 134
manufacture of wood and of products of wood and cork 800 2,000 250
manufacture of paper and paper products 900 2,000 222
publishing, printing and reproduction of recorded media 902 2,071 230
manufacture of coke, refined petroleum products and nuclear fuel
875 4,800 549
manufacture of chemicals and chemical products 1,000 2,375 238
manufacture of rubber and plastic products 875 1,700 194
manufacture of other non-metallic mineral products 750 1,550 207
manufacture of basic metals 785 3,400 433
manufacture of fabricated metal products, except ma-chinery and equipments
875 1,800 206
manufacture of machinery and equipment 945 2,500 265
manufacture of office, accounting and computing ma-chinery
1,025 4,000 390
manufacture of electrical machinery and apparatus 1,050 3,015 287
manufacture of radio, television and communication equipment and apparatus
850 2,500 294
manufacture of medical, precision and optical instru-ments, watches and clocks
1,550 1,530 99
manufacture of motor vehicles, trailers and semi-trailers 1,050 2,470 235
manufacture of other transport equipment 893 3,750 420
manufacture of furniture; manufacturing 1,000 1,338 134
Recycling 1,125 2,100 187
$ Premium = ((Formal sector wage /Informal sector wage)-1)*100Source: Computed from National Sample Survey 66th Round Unit Records.
The above statistical exercise clearly points to interesting dimensions of the supply side of wage, in particular the apparent skill gaps. Perhaps, there ought to have creative labour market policies that induce creation of more skilled pool of human resources having appropriate technical, vocational and behavioural skill sets.
97

11 Manufacturing
Conclusive RemarksWhile it is almost a stylised fact that there exists direct relation between wage rate and productivity in Indian manufacturing, it is important to argue that there ought to have been stronger relation between wage and productivity. Perhaps, the inertia that interrupts conversion of productivity to wage emanates from both institutions of labour market such as archaic labour law and ineffective enforcement systems, and firms’ apathetic strategising of human capital formation in factories. Combing all these contexts, the manufacturing labour market is far from being a space that allows free matching of employers’ and labour’s expectation. Moreover, it is evident from data that Indian manufacturing work systems continue to be highly homogenous, defying the emerging human resource management paradigms that are built around employee engagement, sustainable performance, gender diversity, career growth and trust.
Appendix 1 In the short run, π = pq-wl. π = Profit, p = unit price, q = output, w = wage rate, l= labour. Specifying q =f(l), q is expressed as l a. So, π = pl a-wl. Differentiating π with respect to l , apl a-1 – w = 0 and this implies ap(q/l) = w. Converting this equation to a statistical model with parameters, we get w = α + β q/l + u . While α and β are parameters, u is a stochastic variable that captures the noise. However, in the long run both capital (k) and (l) do vary. Then, π=pq-(wl+rk). r and k are compensation to capital and capital, respectively. Q is a function of k and l; q = f(k,l). This function may be expressed as k al 1-a. So, π = p k al 1-a – (wl + r k). Differentiating π with respect to k and l setting respective derivatives equal to zero, r =ap q/k and w = (1-a) p q/l, and w = (1-a)/a r k/l . Transforming this into a statistical model, w = α + β k/l + u 9 .
9 In both the short run and the long run scenarios, a priori β > 0.
98

12Wages and Labour Productivity in Indian Manufacturing / Bino Paul 99

13 Manufacturing100

14Wages and Labour Productivity in Indian Manufacturing / Bino Paul 101

15 Manufacturing102

16Wages and Labour Productivity in Indian Manufacturing / Bino Paul 103

17 Manufacturing
Appendix 6: Regression EstimatesIt is important to note that wage-productivity relation may be sensitive to the type of industry and the year. In view of variation that stems from the type of industry and the year, it is unsure if a regression that uses pooled data across industries and years, without absorbing heterogeneities such as type of industries and years, provides a valid estimate. There are two alternatives. First, an option is to absorb type of industries in regression, called fixed effect panel regression. Second option is to combine error with the constant, called random effect model. Before exploring these options, we ran four models. First, we pooled the whole data across years and type of industry, and ran a regression between real wage rate and productivity. In the second model, we regressed real wage rate on dummies for the type of industry and productivity. The third posits real wage rate as a function of productivity and dummies for years. The fourth model puts real wage rate is dependent on productivity and dummies for both the type of industry and the year. Assessing these four regressions, while coefficient of productivity and most of dummies for the type of industries were significant, most of coefficients in respect of time turned out to be insignificant. Statistically significant coefficients that represent the relation between real wage rate and average productivity for first, second, third and fourth models are 0.46, 0.27, 0.45 and 0.16, respectively. Instead of using real output put per person as average productivity, we may use real net value added10 per workers in all the four models, coefficients are 0.35, 0.13, 0.52 and 0.10 respectively while dummies in respect of the type of industry and years exhibit almost same pattern that was shown by regressions involving real output per employee. Our panel model, whether fixed or random effect, is a bi-variate one, not having other explanatory variables. Between fixed and random effect specification, using Hausman test, we choose fixed effect model since the null hypothesis of difference in coefficients not systematic is rejected (Table 1). The magnitude of relation between real wage rate and productivity is captured by the coefficient that measures proportionate change in real value of output per worker divided by proportionate change in real wage per worker. The value of coefficient is 0.27 which is the elasticity of wage rate to productivity. The estimate points to a weak productivity-real wage relation in Indian manufacturing. However, when we substitute output by net value added, fixed effect does not turn out to be more appropriate than random effect while both generate same values of elasticity i.e. 0.13. Moreover, as depicted in Appendix 3, across industries, real wage rate appears to be discernibly less dynamic, rather more static during 1993-94-2007-08.
104

18Wages and Labour Productivity in Indian Manufacturing / Bino Paul
Table 1: Wage Productivity Relationship in Indian Manufacturing
Dependent variable = Logarithm of real emolument per person
Fixed Effect Model(N=845, 57 Industries, 1993-94 to 2007-08, Unbalanced panel)
Random Effect Model(N=845,57 Industries, 1993-94 to 2007-08, Unbalanced panel)
Coefficient Robust Standard
error
P>|t|
Coefficient Robust Standard
error
P>|t|
Logarithm of real value of output per person
0.27 0.05 0.00 0.28 0.05 0.00
Constant 0.26 0.11 0.02 0.29 0.13 0.03
R square (fixed effect model) = 0.45, R square (random effect model) = 0.44, Between fixed effect and random effect models, using Hausman test, we accept the first one since the null hypothesis of difference in coefficients not systematic is rejected.
Source: Estimated from data extracted from Annual Survey Industries (ASI) 1973-74-2003-04, EPW Research Foundation and Annual Survey of India reports
As we did for wage productivity relation, we use steps of estimation. For the pooled regression, we specify log of real emolument per person as a function of logarithm of real value of capital per person. Second, we add dummies for industries to the equation. Third, instead of industries, we have dummies time. Fourth, we add both dummies in respect of industries and time. Values of coefficients in respect of these models are 0.34, 0.21, 0.36 and 0.15. Then, we posit this relation in fixed effect and random effect contexts. We get more or less same coefficients from fixed and random effect models i.e. 0.21 (Table 2). Albeit a direct relation as predicted by the micro economic theory, sensitivity of real wage appears to be less elastic to capital labour ratio.
Table 2: Relationship between Capital Labour Ratio and Wage Rate in Indian Manufacturing
Dependent variable = Logarithm of real emolument per person
Fixed Effect Model(N=845, 57 Industries, 1993-94 to 2007-08, Unbalanced panel)
Random Effect Model(N=845,57 Industries, 1993-94 to 2007-08, Unbalanced panel)
Coefficient Robust Standard
error
P>|t|
Coefficient Robust Standard
error
P>|t|
Logarithm of real value of output per person
0.21 0.05 0.00 0.22 0.04 0.00
Constant -0.69 0.06 0.00 -0.69 0.06 0.00
R square (fixed effect model) = 0.51, R square (random effect model) = 0.50, Between fixed effect and random effect models, using Hausman test, we accept the first one since the null hypothesis of difference in coefficients not systematic is rejected.
Source: Estimated from data extracted from Annual Survey Industries (ASI) 1973-74-2003-04, EPW Research Foundation and Annual Survey of India reports.10 Net value added refers to output net of value raw material consumption.
105
19 Manufacturing
Drawing cues from above patterns and inferences, in a short run profit maximising scenario, wages show direct but weak relationship productivity in Indian organised manufacturing. Moreover, wage rate appears to be weakly influenced by capital labour ratio. These findings indicate how tenacious wage-productivity relation in organised manufacturing is. While a school of scholars sees this situation emanating from lack flexibility in labour market due to archaic labour laws, the opposing school views that Indian labour market is hugely flexible that is quite manifest in the enormity of informal sector in India. If we see industrial relation as merely a source of nominal economies, then wage productivity relation entails to be driven by both process and product innovation.
Appendix 7: Wage FunctionWe posit the following model to assess determinants of wage:
Logarithm of wage = f(age, square of age, educational attainment, technical qualification, vocational education, social category, gender, area of
residence, type of employment,Occupation, industry, state, error)
Table 1 shows that wage increases with age, but increases at a decreasing rate since coefficients of age is positive while sign of age square is negative. Compared to the base category not literates, coefficient tends to increase as level of educational attainment increases. It appears as the level of technical education increases, wage differential tends to go up. As given in table, compared to the reference category ‘technical graduate’, coefficients bear negative sign. Further, persons without any technical training report the lowest coefficient compared to other categories. However, there appears to be no significant wage differential for vocational training. Sources positive wage differential include the social category ‘others’, male, living in urban area, formal employment, and managerial occupation.
106

20Wages and Labour Productivity in Indian Manufacturing / Bino Paul
Table 1: Determinants of Wage for Regular Salaried/Wage Employees in Manufacturing 2009-10, (Age 15-64)
Dependent Variable = Logarithm of wage
Coefficient Robust Standard Error
t P>|t|
Age 0.0382033 0.004926 7.76 0.000
Age Squared -0.0002861 0.0000689 -4.15 0.000
Educational Attainment (Reference Category = Not Literate)
Just Literate 0.0644919 0.0400898 1.61 0.108
Primary Education 0.0854343 0.0331014 2.58 0.010
Upper Primary 0.178376 0.031914 5.59 0.000
Secondary 0.2977441 0.0323352 9.21 0.000
Higher Secondary/Diploma 0.3824941 0.036784 10.4 0.000
Graduate 0.6676822 0.0400201 16.68 0.000
Post Graduate 0.8477288 0.0533556 15.89 0.000
Technical Qualification (Reference Category=Technical Graduate)
Diploma -0.3329134 0.0773981 -4.3 0.000
PG Diploma -0.2862034 0.0921537 -3.11 0.002
No Technical education -0.5107059 0.0714217 -7.15 0.000
Vocational Training (Reference Category=Formal vocational Training)
Informal Vocational Training 0.0241092 0.0429095 0.56 0.574
No Vocational Training -0.0187112 0.0391441 -0.48 0.633
Social category (reference category = Scheduled Tribe)
Scheduled Caste -0.0104568 0.0531904 -0.2 0.844
Other Backward Classes -0.0187041 0.0519066 -0.36 0.719
Others 0.1194542 0.0512017 2.33 0.020
Gender (1=Male, 0=Female) 0.368341 0.0298171 12.35 0.000
Area (1=Rural, 0=Urban) -0.1108009 0.0181011 -6.12 0.000
Type of Employment (1=Formal, 0=Informal)
0.3984922 0.0201451 19.78 0.000
Occupation (1=Managerial staff, 0=Workmen)
0.3341947 0.0303136 11.02 0.000
Industry Dummy (NIC 2 Digit)
Yes
State Dummy Yes
N = 5366, F( 78, 5287) = 92.21, Prob > F = 0.0000, R-squared = 0.5617, Root MSE = .55388
Source: Computed from National Sample Survey 66th Round Unit Records.
107
21 Manufacturing
References
Banga, Rashmi (2008). ‘Impact of liberalisation on wages and employment in Indian manufacturing industries,’ Working Paper 153, Indian Council of Research on International Economic Relations.
Bino Paul G D (2013). ‘Exploring the link between labour market, business environment and technology: insights from India’ in Sharit Bhowmik (ed.) The State of Labour: The Global Financial Crisis and its Impact,: Routledge, New Delhi pp 83-10T.
Dadi M M (1970), ‘Wage rate and relative share of workers in manufacturing industries’, Economic and Political Weekly 5, 17, pp 711-715.
Daugherty Sean M, Richard Herd and Thomas Chalaux (2009). ‘What is holding back productivity growth in India? Recent micro evidences,’ OECD Journal: Economic Studies, 2009, pp 1-22.
Hajra S (1963), .’Cost price relationship in Indian manufacturing industry’, Economic Weekly, 1629-1636 Johri C K and Agarwal N C (1966). ‘Inter-industry wage structure in India 1950-61: an analysis’, Indian Journal of Industrial Relations, 1, 4, pp 377-414.
Lal Deepak (1979). ‘Theories of industrial wage structures: a review’, Indian Journal of Industrial Relations, 15,2, pp 167-195.
Muralidharan T, Bino Paul, Ashutosh Murti (2013). ‘Should wages go up in Indian Manufacturing?’, Discussion Paper 20, Labour Market Research Facility, Tata Institute of Social Sciences, Mumbai http://atlmri.org/index.php/downloads/doc_download/44-lmrf-discussion-paper-20.
National Sample Survey Organisation (NSSO) (2013). Economic characteristics of unincorporated enterprises in India, 67th Round, Report No 549, Ministry of Statistics and Programme and Implementation, Government of India.
Schultz, T W. (1961). ‘Investment in Human Capital’, American Economic Review, Vol. 51, No. 1, pp. 1-17.
Sen Swapan Kumar (1985). ‘Inter-industry differences in growth of real earning: some implications for wage policy,’ Economic and Political Weekly, 20, 13, pp 556-561.
Trivedi Pushpa, L. Lakshmanan, Rajeev Jain, and Yogesh Kumar Gupta (2011). ‘Productivity, efficiency, and competitiveness of the Indian manufacturing Sector’, Development Research Group, Department of Economic Analysis and Policy Research, Reserve Bank of India, Mumbai.
Verma Pramod C (1972). ‘Wage determination in Indian Manufacturing 1950-64’, Economic and Political Weekly, 7, 22, pp M91-M95.
Author
Bino Paul G.D is a professor at School of management and Labour studies, Tata Institute of Social Sciences (TISS), Mumbai, India. He pursues research in two areas: Indian Labour Market and Social Networks. Email: [email protected].
108

22Wages and Labour Productivity in Indian Manufacturing / Bino Paul

23 Manufacturing

24Wages and Labour Productivity in Indian Manufacturing / Bino Paul

25 Manufacturing