laboratory facilities used to test energy flexibility in buildings · laboratory facilities used to...
TRANSCRIPT

Laboratory facilities used to test
energy flexibility in buildings
A technical report from IEA EBC Annex 67 Energy Flexible Buildings

2
Laboratory facilities used to test
energy flexibility in buildings
Editors
Thibault Péan and Jaume Salom, Catalonia Institute for Energy Research (IREC), Spain
Contributors
Francesco Goia, NTNU/SINTEF, Norway
Ala Hasan and Simo Kilpeläinen, VTT/Aalto University, Finland
Michaël Kummert, Polytechnique Montréal, Canada
Glenn Reynders, KU Leuven, Belgium
Gerard del Rosario, Catalonia Institute for Energy Research (IREC), Spain
Søren Østergaard Jensen, Danish Technological Institute (DTI), Denmark
First Edition October, 2017

3
Preface
The increasing global energy demand, the foreseen reduction of available fossil fuels and the
increasing evidence off global warming during the last decades have generated a high interest
in renewable energy sources. However, renewable energy sources, such as wind and solar
power, have an intrinsic variability that can seriously affect the stability of the energy system
if they account for a high percentage of the total generation.
The Energy Flexibility of buildings is commonly suggested as part of the solution to alleviate
some of the upcoming challenges in the future demand-respond energy systems (electrical,
district heating and gas grids). Buildings can supply flexibility services in different ways, e.g.
utilization of thermal mass, adjustability of HVAC system use (e.g. heat-
ing/cooling/ventilation), charging of electric vehicles, and shifting of plug-loads. However,
there is currently no overview or insight into how much Energy Flexibility different building
may be able to offer to the future energy systems in the sense of avoiding excess energy pro-
duction, increase the stability of the energy networks, minimize congestion problems, en-
hance the efficiency and cost effectiveness of the future energy networks. Therefore, there is a
need for increasing knowledge on and demonstration of the Energy Flexibility buildings can
provide to energy networks. At the same time, there is a need for identifying critical aspects
and possible solutions to manage this Energy Flexibility, while maintaining the comfort of the
occupants and minimizing the use of non-renewable energy.
In this context IEA EBC Annex 67 Energy Flexible Buildings was started in 2015 with the
aim of gaining increased knowledge on the benefits and services the utilization of the Energy
Flexibility in buildings may provide to the future energy networks. The present report is one
among several outputs from IEA EBC Annex 67. For further information, please visit
http://www.iea-ebc.org/projects/ongoing-projects/ebc-annex-67/.
Published by Thibault Q. Péan and Jaume Salom, IREC – Catalonia Institute for Energy Re-
search, Barcelona, Spain.
Disclaimer Notice: The report is not an official IEA EBC report. Although this publication is
part of the work conducted within IEA EBC Annex 67 Energy Flexible Buildings, the publi-
cation only reflects the viewpoints of the authors. The EBC Contracting Parties (of the Inter-
national Energy Agency Technology Collaboration Programme of Research and Develop-
ment on Energy in Buildings and Communities) make any representation as to the adequacy
or accuracy of the information contained herein, or as to its suitability for any particular ap-
plication, and accept no responsibility or liability arising out of the use of this publication.
The information contained herein does not supersede the requirements given in any national
codes, regulations or standards, and should not be regarded as a substitute for the need to
obtain specific professional advice for any particular application.

4
Contents Preface ....................................................................................................................................... 3
Contents ..................................................................................................................................... 4
List of Figures ........................................................................................................................... 6
1. Introduction ....................................................................................................................... 8
2. Semi-virtual Energy Integration Laboratory (SEILAB) - IREC ....................................... 9
2.1. General presentation ................................................................................................ 10
2.2. Description of the test facility ................................................................................. 10
2.3. Examples of previous studies .................................................................................. 14
2.4. Maintenance and collaborations .............................................................................. 16
2.5. Additional information ............................................................................................ 16
2.6. Relevant publications .............................................................................................. 16
3. Energy Smart Lab - IREC ............................................................................................... 17
3.1. General presentation ................................................................................................ 18
3.2. Description of the test facility ................................................................................. 18
3.3. Example of previous studies .................................................................................... 21
3.4. Maintenance and collaborations .............................................................................. 23
3.5. Additional information ............................................................................................ 23
3.6. Relevant publications .............................................................................................. 23
4. Nearly-zero Energy Building Emulator – Aalto University ............................................ 24
4.1. General presentation ................................................................................................ 25
4.2. Description of the test facility ................................................................................. 25
4.3. Example of previous studies .................................................................................... 30
4.4. Maintenance and collaborations .............................................................................. 31
4.5. Relevant publications .............................................................................................. 31
5. Labs in EnergyVille ......................................................................................................... 32
5.1. General presentation ................................................................................................ 33
5.2. Description of the test facility - Battery Testing Lab .............................................. 33
5.3. Description of the test facility – Home Lab ............................................................ 35
5.4. Description of the test facility – Smart Grid Infrastructure ..................................... 36
5.5. Description of the test facility – Polyline Medium-Voltage Smart Energy Lab ..... 38
5.6. Description of the test facility – Matrix Lab ........................................................... 39
5.7. Description of the test facility – Thermo-technical Lab .......................................... 40
5.8. Maintenance and collaborations .............................................................................. 41
5.9. Additional information ............................................................................................ 41
5.10. Relevant publications .......................................................................................... 41

5
6. The OPSYS test rig - DTI ............................................................................................... 43
6.1. General presentation ................................................................................................ 44
6.2. Description of the test facility ................................................................................. 44
6.3. Example of previous studies .................................................................................... 49
6.4. Maintenance and collaborations .............................................................................. 50
6.5. Additional information ............................................................................................ 50
6.6. Relevant publications .............................................................................................. 51
7. ZEB Living Laboratory - NTNU / SINTEF .................................................................... 52
7.1. General presentation ................................................................................................ 53
7.2. Description of the test facility ................................................................................. 53
7.3. Example of previous studies .................................................................................... 60
7.4. Maintenance and collaborations .............................................................................. 61
7.5. Additional information ............................................................................................ 61
7.6. Relevant publications .............................................................................................. 61
8. Semi-virtual Laboratory – Polytechnique Montréal ........................................................ 62
8.1. General presentation ................................................................................................ 63
8.2. Description of the test facility ................................................................................. 63
8.3. Examples of previous studies .................................................................................. 67
8.4. Maintenance and collaborations .............................................................................. 69
8.5. Additional information ............................................................................................ 69
8.6. Relevant publications .............................................................................................. 70

6
List of Figures Figure 1. General concept of the semi-virtual testing. ............................................................ 11
Figure 2. Picture of the SEILAB climate chamber. ................................................................. 11
Figure 3. PV equipment on the roof of SEILAB. .................................................................... 12
Figure 4. Screenshot of the Labview interface. ....................................................................... 13
Figure 5. Experimental setup (a) and corresponding diagram (b). .......................................... 14
Figure 6. Experimental setup (a) and graph showing the COP and EER in function of the part-
load ratio (PLR) (b). ................................................................................................................ 14
Figure 7. Scheme of the experimental setup for the mCHP test. ............................................. 15
Figure 8. General concept of the IREC Energy Smart Lab testing facilities. .......................... 19
Figure 9. Energy storage systems: flywheel (left), Li-ion battery (middle) and ultracaps
(right). ...................................................................................................................................... 19
Figure 10. Overview of the microgrid: microgrid emulators (back), electric vehicle (right) and
data acquisition and control system (front). ............................................................................ 20
Figure 11. Grid emulator. ........................................................................................................ 20
Figure 12. Data acquisition, control and communications architecture of the microgrid. ...... 21
Figure 13. (a) Experimental setup for the implementation of the test grid including (b) a
generator emulator, (c) a Li-ion battery pack, and (d) a load emulator. .................................. 22
Figure 14. Active power measurements during flexibility delivery at customer’s premises. . 22
Figure 15. Operation and basic component diagram of the emulator platform. ...................... 26
Figure 16. PV panels and microwind turbine on the roof of the K4 building. ........................ 26
Figure 17. PV and island network inverters. ........................................................................... 27
Figure 18. Flat-plate solar collectors on the roof of the K4 building. ..................................... 27
Figure 19. Ground source heat pump. ..................................................................................... 28
Figure 20. One of the hot water tanks, and schematic of the storage tank connections. ......... 28
Figure 21. Screenshot of the Labview interface. ..................................................................... 29
Figure 22. Monthly average matching indices OEFe and OEMe at different time averaging
intervals. .................................................................................................................................. 30
Figure 23. Illustration of battery testing. ................................................................................. 33
Figure 24. HomeLab. ............................................................................................................... 35
Figure 25. Polyline Medium Voltage Smart Energy Lab. ....................................................... 38
Figure 26. Thermo-technical lab. ............................................................................................ 40
Figure 27. Principle sketch of experimental setup. ................................................................. 44
Figure 28. General concept of the semi-virtual OPSYS test rig. ............................................. 45
Figure 29. The heat exchangers emulating the heat emitters in a heating system (left). The
actuators of the heating system (right). ................................................................................... 46
Figure 30. The connections between the test rig, the simulation PC and the data logger. ...... 47
Figure 31. Screenshot of the BMS interface showing the heat emitting system. .................... 48
Figure 32. Results from simulation of the efficiency of a heat pump dependent on the forward
temperature and fluctuation of the flow rate though the heating system (Jensen, Olesen and
Paulsen, 2014). ........................................................................................................................ 50
Figure 33. Plan and vertical section of the Living Laboratory (1: entrance; 2: living room; 3:
kitchen; 4: studio room; 5,6: bedroom; 7: bathroom; 8: technical room). Original Figure in
Goia et al. 2015. ...................................................................................................................... 54
Figure 34. Thermal and electrical energy/power flow in the Living Laboratory; technologies
and devices for energy conversion and storage and associated monitoring system. Original
figure in Goia et al. 2015. ........................................................................................................ 56

7
Figure 35. Semi-virtual testing at Polytechnique Montréal. .................................................... 63
Figure 36. Hydronic loops of the Semi-Virtual Laboratory. ................................................... 65
Figure 37. Screenshot of the Labview interface. ..................................................................... 67
Figure 38. Principle of the LabVIEW interaction with TRNSYS. .......................................... 67
Figure 39. PCM tank viewed from the inlet, including 1) perforated plate, 2) capsule support
and 3) PCM capsules. .............................................................................................................. 68
Figure 40. Position of the instrumented PCM capsule in the tank as viewed from the outlet. 68
Figure 41. Example of results for a test with a fixed temperature change rate at the inlet of the
tank. ......................................................................................................................................... 68
Figure 42. Example of results for a cooling step test. ............................................................. 68
Figure 43. PCM tank in a hydronic heating loop for semi-virtual testing. .............................. 69

8
1. Introduction The International Energy Agency (IEA) manages several research programmes, among which
the Energy in Buildings and Communities (EBC) programme. The Annex 67 of the IEA EBC
focuses on the energy flexibility of buildings, its potential and how to harness it. Sixteen
countries have joined this Annex to gather the research efforts towards a better characteriza-
tion and understanding of energy flexibility in buildings.
The first subtask of the Annex (Subtask A) relates to the definitions, terminology, methodol-
ogies for characterization and market analysis of energy flexibility. As for Subtask B, it fo-
cuses on implementing flexibility strategies and verifying their performance. In this way, the
theoretical flexibility potential can be evaluated against experimental data. Activity B.3. espe-
cially consists in laboratory tests of components, systems and control strategies. In this
framework, several partners have made their laboratory facilities available for the needs of the
Annex 67 as well for the scientific community and the industry. The names and the location
of the laboratories included in this report are summarized in the following table:
Name Managed by Location
SEILAB IREC - Catalonia Institute for Energy Research Tarragona, Spain
Energy Smart Lab IREC - Catalonia Institute for Energy Research Barcelona, Spain
NZEB Emulator VTT / Aalto University Espoo, Finland
EnergyVille labs EnergyVille (VITO, KU Leuven, IMEC) Genk, Belgium
OPSYS test rig Danish Technological Institute (DTI) Taastrup, Denmark
ZEB Living Lab NTNU / SINTEF Trondheim, Norway
Semi-Virtual Laboratory Polytechnique Montréal Montréal, Canada
In order to better understand the capabilities and specificities offered by the available labora-
tories, the present report draws a description of each test facility. For each one, a general
presentation of the lab enables to quickly understand the purpose of the facility. The interest-
ed reader then has access to a more detailed description, with the technical specifications of
the installation and illustrations. Some examples of previous tests performed in these labs are
also presented, along with references to the corresponding publications. The final objective of
the report is to provide a clear overview of the potential offered by the testing facilities in the
network of Annex 67. In this way, any interested stakeholder, within or without this network,
can contact directly the responsible entity in order to perform experimental testing in these
facilities.
9
2. Semi-virtual Energy Integration Laboratory (SEILAB) - IREC
Institution / Department
IREC – Catalonia Institute for Energy Research
Energy Efficiency in Systems, Buildings and Communities
Thermal Energy and Buildings Performance Group
Location of the test facility
Campus de Sescelades, edifici N5
Marcel·lí Domingo, s/n
43007 TARRAGONA (Spain)
Tel. +34 977 202 444
Contact persons
Dr. Jaume Salom
Head of Research Group
Tel. +34 933 562 615 Ext. 240
Dra. Elena Fuentes
Head of SEILAB
Tel. +34 977 297 926

10
2.1. General presentation
The Semi-Virtual Energy Integration Laboratory (SEILAB) provides advanced expertise to
assess the development and integration of renewable energy solutions and innovative thermal
and electrical equipment that are designed to improve energy efficiency in buildings and en-
ergy systems. The laboratory is provided with cutting-edge technology comprising systems
for energy generation, heat and cool storage and state-of-the-art facilities for testing HVAC
equipment and the interaction of energy systems with the grid. The laboratory operation is
based on a semi-virtual testing approach, which allows for real equipment to be operated as a
function of the behaviour of a dynamic virtual model. The laboratory is pioneer in addressing
the smart integration of electrical and thermal components and aims to become a leading ex-
perimental facility for improving the development of Net Zero Energy Buildings and Flexible
Energy buildings.
2.2. Description of the test facility
2.2.1. General principle and testing possibilities
General testing principles
The general concept of the semi-virtual testing is presented in Figure 1. A real physical device
is placed in the lab, where it is studied under specific conditions that are simulated and im-
plemented in the virtual environment. The overall principles are as follows:
Testing the performance of components or complex energy systems under defined
building and environmental conditions
Development and integration of innovative sustainable, renewable building energy
supply systems.
Analysis of equipment behaviour at particular transitory phases
Detailed testing principles
Experimental testing of thermal and electrical equipment performance under real-life
dynamic conditions, addressing a range of climate zones and thermal building behav-
iour scenarios.
Comparison on the performance of equipment provided with particular innovative
control concepts to ensure adequate system reliability in real applications.
Assessment and improvement of innovative efficient energy technologies, such as
energy storage systems, photovoltaic and thermal solar systems, nanofluids for
HVAC equipment and micro-cogeneration.
Development of novel measurement methodologies and test protocols to assess realis-
tically the energy performance of thermal and electrical equipment beyond testing
methods established in current international standards, including analysis of the Sea-
sonal Performance Factor.
Optimisation of operation for multiple energy sources and loads for matching energy
generation and demand, including microgrid interaction.
Development of detailed and/or simplified models for use in system simulation soft-
ware and of learning-method predictive techniques for thermal components perfor-
mance that are validated using test bench experimental data.

11
Research on the integration and effects of local building components in smart energy
systems to achieve Zero and Positive Energy Buildings.
Research on control systems for flexible buildings, including renewables.
Environmental testing of building components and electrical equipment under realis-
tic climatic conditions in a room-sized climate chamber.
Figure 1. General concept of the semi-virtual testing.
2.2.2. Equipment available and specifications
Climate chamber
The laboratory counts with a walk-
in climate chamber (shown in Figure
2) for testing different devices. The
climate chamber generates the envi-
ronmental air characteristics (tem-
perature and humidity) according to
the climate conditions in the stand-
ards. The chamber is provided with
a set of 24PT100 sensors, 2 pressure
sensors, 4 humidity sensors and 10
hot wire anemometers for air veloci-
ty measurement, which are regularly
Figure 2. Picture of the SEILAB climate chamber.

12
maintained and calibrated. The climate chamber has a volume of 45 m3, with the fol-
lowing range for temperature, humidity and air flow control:
temperature range: -30 to +60°C
RH: 15-98%
air flow: 8000-10000 m3/h
maximum power of condenser: 46.8 kW
Hydraulic thermal test benches
The laboratory counts with a set of thermal test benches for emulating the heat and load
source, as specified in standards EN14511, EN16147 and EN14528. The thermal test benches
consist of a set of hydraulic loops which are equipped with hydraulic components such as
flow meters and motorized valves to control the flow and temperature to the heating/cooling
unit under testing. Water circulation is achieved by means of circulating pumps equipped with
frequency inverters and high speed modulating control valves provided with magnetic actua-
tors. The hydraulic circuits include expansion vessels and security valves that are installed as
standard with piping isolated by means of 30 mm synthetic rubber material. The water used in
the installations generally is decalcified and mechanically filtrated. Temperatures are meas-
ured with Pt100 in 3 wired circuit sensors with terminal head form B tolerance class A (EN
60 751). Calibration is performed regularly on the flow meters and temperature sensors. Hy-
draulic pressure is measured in every test bench with digital pressure meters.
Along with measurement systems, the test benches are provided with the following control
elements:
2 magnetive-inductive flowmeters Endress & Hauser per test bench for volume flow
measurement
2 precision control valves for flow and temperature control per test bench.
The available thermal test benches have the following characteristic in terms of heating per-
formance:
water temperature range: -7ºC – 150ºC
water flow range: 3.5-9 m3/h
maximum heating power per sample: 30kW
maximum cooling power per sample: air-to-water 15 kW, water-to-water 30kW
Temperature, flow and pressure measurements in the thermal test benches fulfil requirements
specified in the EN14511, EN14528 and EN16147 standards. The instrumentation in the la-
boratory allows for a very fast control of temperatures and water flows to emulate loads,
which allows its application both for emulating steady-state and transient dynamic profiles.
An additional test bench for emulating data centre cooling is also present in the lab.
PV system
A PV system is installed on the roof, summing
up to an installed capacity of 3.5 kWp. A photo
of the equipment is presented on Figure 3.
Figure 3. PV equipment on the roof of SEILAB.

13
Other equipment
Several other devices are available in the lab:
1 heat pump air-to-water Buderus (7.4 kW heating, 8 kW cooling)
1 heat pump water-to-water Dynaciat (40 kW heating, 34 kW cooling)
Water storage tanks of 1500, 1000 and 300 liters
Micro data centre of 1.2 kW partially water cooled
Gas boiler Saunier Duval Themafast 25-A
2 electrical test benches (emulated power 5.5 kVA, max generation connected 10
kVA, max consumption connected 10 kVA)
2.2.3. Data acquisition and control
The tests are performed by means of a control system created in the laboratory. The software
allows for visualising the operation of the laboratory equipment, controlling the test perfor-
mance and performing data acquisition. Communications are based on Modbus TCP and
RTU industrial protocols, with the laboratory software communicating with actuators and
sensors via automatic controllers and data acquisition modules through RS485 connections.
A Labview interface (Figure 4) enables to communicate with the different elements being
tested in the lab. This interface can be connected to transient simulation software TRNSYS,
where building models can be implemented to simulate the heating or cooling loads of a
building or the performance of the virtual part of the system. Other software than TRNSYS,
such as Energy Plus or IDA-ICE can be connected with the Labview interface. Remote visu-
alisation of experiments in real time is possible for external collaborators.
In addition, a weather station is placed on the roof and connected to the lab interface. It
measures the ambient air temperature, the wind velocity, the relative humidity and the global
and diffuse radiation.
Figure 4. Screenshot of the Labview interface.
14
2.3. Examples of previous studies
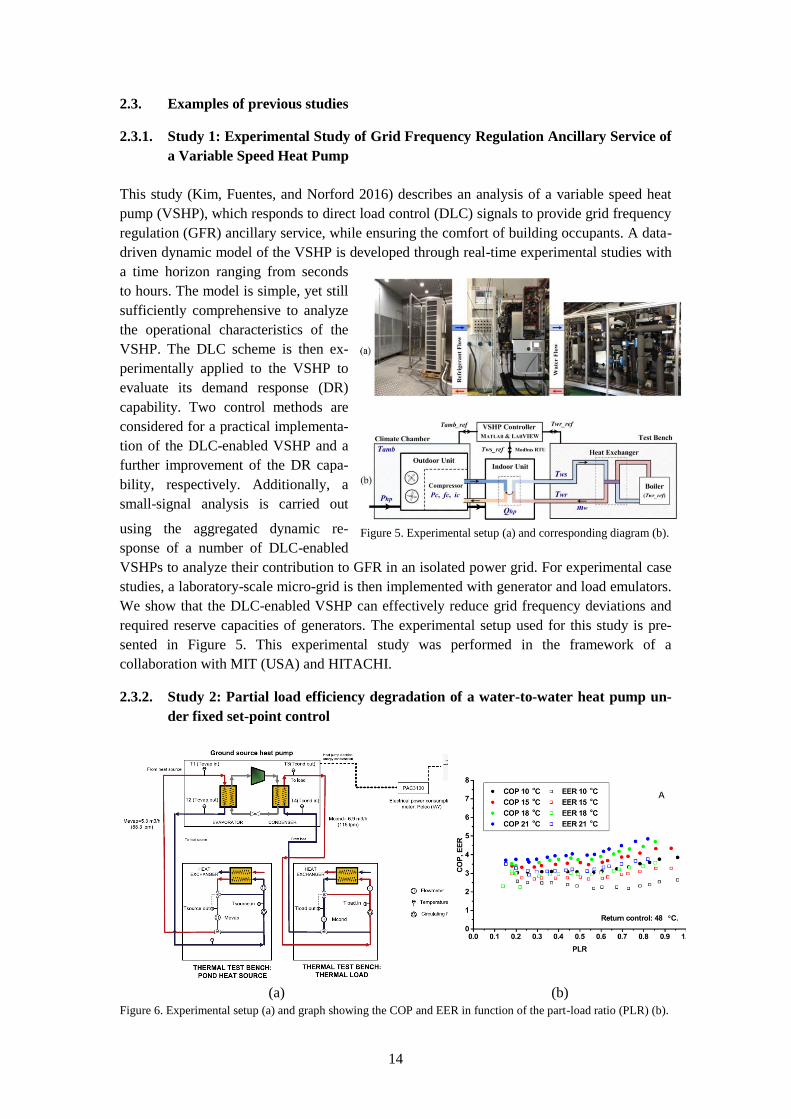
2.3.1. Study 1: Experimental Study of Grid Frequency Regulation Ancillary Service of
a Variable Speed Heat Pump
This study (Kim, Fuentes, and Norford 2016) describes an analysis of a variable speed heat
pump (VSHP), which responds to direct load control (DLC) signals to provide grid frequency
regulation (GFR) ancillary service, while ensuring the comfort of building occupants. A data-
driven dynamic model of the VSHP is developed through real-time experimental studies with
a time horizon ranging from seconds
to hours. The model is simple, yet still
sufficiently comprehensive to analyze
the operational characteristics of the
VSHP. The DLC scheme is then ex-
perimentally applied to the VSHP to
evaluate its demand response (DR)
capability. Two control methods are
considered for a practical implementa-
tion of the DLC-enabled VSHP and a
further improvement of the DR capa-
bility, respectively. Additionally, a
small-signal analysis is carried out
using the aggregated dynamic re-
sponse of a number of DLC-enabled
VSHPs to analyze their contribution to GFR in an isolated power grid. For experimental case
studies, a laboratory-scale micro-grid is then implemented with generator and load emulators.
We show that the DLC-enabled VSHP can effectively reduce grid frequency deviations and
required reserve capacities of generators. The experimental setup used for this study is pre-
sented in Figure 5. This experimental study was performed in the framework of a
collaboration with MIT (USA) and HITACHI.
2.3.2. Study 2: Partial load efficiency degradation of a water-to-water heat pump un-
der fixed set-point control
(a) (b)
Figure 6. Experimental setup (a) and graph showing the COP and EER in function of the part-load ratio (PLR) (b).
Figure 5. Experimental setup (a) and corresponding diagram (b).

15
This laboratory study (Waddicor et al. 2016) was conducted to evaluate the influence of fixed
set-point control strategies on the partial load behaviour of a water-to-water heat pump of
40.5 kW heating capacity. Experimental results indicate that the control configuration is high-
ly influential on the heat pump cycling response and efficiency degradation at part load. Dete-
rioration of energy performance occurred mainly during system start-up, with additional effi-
ciency loss caused by short cycling for supply temperature control at low loads. It was con-
cluded that a minimum of 20 min compressor run time is necessary to reduce degradation
effects, suggesting that installers and heat pump manufacturers should ensure minimum oper-
ation times to improve systems efficiency. Comparison of models and experiments indicate
that it is important to adequately account for both stand-by and start-up efficiency losses for
improving predictions of part load performance by steady-state heat pump models. The exper-
imental setup as well as one result graph are shown in Figure 6. This project has been done in
the framework of EU project TRIBUTE (http://www.tribute-fp7.eu/).
2.3.3. Study 3. Testing of a novel micro-CHP unit for buildings
Figure 7. Scheme of the experimental setup for the mCHP test.
The objective of the testing at IREC´s laboratory consists of the determination of the thermal
and electrical performance of the MTT micro-turbine CHP under dynamic conditions by
means of semi-virtual testing.
This virtual system created with the software TRNSYS has been integrated together with the
electrical and thermal test benches configuration in the laboratory to emulate the thermal
loads of the building in order to make the mCHP unit to operate as if it was installed in the
actual building. The MTT EnerTwin micro turbine-CHP (m-CHP) was installed in the
IREC´s test laboratory, which is provided with 164 m2 surface and a 549.73 m3 room volume
(ambient temperature between 18 and 24C). The heat and electrical energy production from
the m-CHP are measured and controlled by means of high precision measurement and control
elements installed in a set of thermal and electrical test benches. The thermal energy from the
m-CHP will be used to charge a 1000 l buffer tank, which delivers heat to provide the DHW
(Domestic Hot Water) and space heating according to the implemented consumption profiles
from a building model. Inlet air to the microCHP is previously conditioned for temperature

16
and humidity control in the climate chamber, which is placed at about 12 m pipe length from
the system. The experimental tests consisted of the operation of the microCHP unit under
dynamic conditions during 24 h for selected days of the year, in which heating space and do-
mestic hot water consumption were emulated for a hotel building in the BCN and Zurich cli-
mates. For the test, the hot water tank was directly connected to a thermal test bench for
DHW demand emulation and a second test bench for space heating emulation. A third test
bench was employed to emulate the recirculation circuit for DHW. For the conditions in
which the thermal energy from the m-CHP is not sufficient to cover the heat demand from the
building, a virtual auxiliary heater is implemented in the DHW and heating space circuits,
which is emulated with the required heating loops.
The experimental setup is shown in Figure 7. These tests have been supported by KIC
InnoEnergy.
2.4. Maintenance and collaborations
The SEILAB laboratory is run and managed by IREC, the Catalonia Institute for Energy Re-
search, which headquarters are situated in Barcelona, Spain. The SEILAB facilities are situat-
ed in a branch of IREC in Tarragona. Around five full-time employees are maintaining, or-
ganizing and using the lab facilities.
The SEILAB is collaborating in numerous projects with different partners:
Direct contracts for equipment testing, development of technical solutions, improve-
ment of systems, etc.
Partnership for national / international R&D projects: EU, KIC-EIT, Horizon 2020
Donation of equipment for expanding the laboratory structure
Shared developments for new products
2.5. Additional information
Additional information can be found at www.irec.cat or on demand.
2.6. Relevant publications
Y.J. Kim, E. Fuentes and L.K. Norford. 2016. “Experimental Study of Grid Frequency Regulation
Ancillary Service of a Variable Speed Heat Pump.” IEEE Transactions on Power Systems
31(4):3090–99.-
D.A. Waddicor, E. Fuentes, M. Azar and J.Salom. 2016. “Partial Load Efficiency Degradation of a
Water-to-Water Heat Pump under Fixed Set-Point Control.” Applied Thermal Engineering
106:275–85. Retrieved (http://dx.doi.org/10.1016/j.applthermaleng.2016.05.193).
E. Fuentes, D. Schaefer and J. Salom. 2014. On the impact of realistic domestic hot water demand
profiles on thermal storage stratification and energy efficiency. Eurotherm seminar 99. 28-30
May 2014, Lleida, Spain.
E. Oró, A. Garcia and J. Salom. 2016. “Experimental and Numerical Analysis of the Air Management
in a Data Centre in Spain.” Energy and Buildings 116:553–61. Retrieved
(http://dx.doi.org/10.1016/j.enbuild.2016.01.037).
17
3. Energy Smart Lab - IREC
Institution / Department
IREC – Catalonia Institute for Energy Research
Energy Efficiency in Systems, Buildings and
Communities - Electric Engineering Area
Location of the test facility
IREC BARCELONA
Jardins de les Dones de Negre, 1, Floor 2
08930 SANT ADRIÀ DE BESÒS (Spain)
Tel. +34 933 562 615
Contact persons
Mr. Manel Sanmartí
Head of Electric Engineering Area
Tel. +34 933 562 615 Ext. 222
Dr. Cristina Corchero
Head of Energy Systems Analytics Group
Tel. +34 933 562 615 Ext. 103
18
3.1. General presentation
The Energy Smart Lab is an infrastructure conceived as a flexible and versatile platform for
innovative technological developments for both industry and competitive R+D projects. The
areas of expertise of this laboratory pivot around the following technologies:
– Power Electronics for the integration and control of the elements within a building or
community: Renewable Energy Sources (RES), Energy Storage Systems and Electric
Vehicles (EV)
– ICT Platform for smart communications and energy management of systems, build-
ing, networks and communities.
– Energy System Integration technologies for smart and flexible buildings and grids in-
cluding RES and EV
The laboratory operation is based on the hardware emulation approach, which allows for real
physical equipment to be operated under a broad range of scenarios without depending on the
real occurrence of the boundary conditions suitable for the experimental validation. The la-
boratory is pioneer in addressing the concept and implementation of Microgrids and aims to
become a leading experimental facility for improving the optimal development of Flexible
Energy Buildings and Flexibility Aggregation at community level.
3.2. Description of the test facility
3.2.1. General principle and testing possibilities
General testing principles
The Energy Smart Lab test facility is composed of an electricity network which interfaces a
set of real devices that inject or withdraw energy to/from it. All such devices include control
hardware able to communicate with a centralized system called Building Management Sys-
tem (BMS). The BMS is responsible for the coordination of the power injected/withdrawn
into/from the electrical grid in order to ensure power balance at the point of common coupling
with the grid supply. The BMS includes an interface with the virtual system, which completes
the experimental setup. Virtual components are aimed to provide this facility with the capabil-
ity to implement a significant number of different testing scenarios, as it includes the follow-
ing functionalities:
– Building simulation model: thermal inertia and thermal loads of a building or com-
munity can be co-simulated with a building model.
– System Operator and Aggregator simulation models: the interaction with remote con-
trol actions carried out by electricity System Operators or flexibility Aggregators can
be simulated as well.
– Grid simulation model: the physical interaction of the building with the grid power
supply can be simulated enabling the experimental validation of flexibility services to
the network.
The general concept of the testing facility is summarized in Figure 8.

19
Figure 8. General concept of the IREC Energy Smart Lab testing facilities.
3.2.2. Equipment available and specifications
Energy storage systems
Different energy storage technologies are available in the laboratory, as presented in Figure 9.
They are used to conduct experimental research on storage integration in buildings, communi-
ties and power grids.
Figure 9. Energy storage systems: flywheel (left), Li-ion battery (middle) and ultracaps (right).
The main specifications are summarized as follows:
– Flywheel: maximum stored energy 15 Wh, rated power 5,5 kW, maximum speed
3000 rpm, motor technology permanent magnet synchronous machine, efficiency 85-
90%
Energy
storage
systems
Grid power
supply
Microgrid
emulators
Building simulation
model
Grid emulator
Grid
simulation
model
System Operator and
Aggregator simulation models
Building Management
System
Virtual system Real system Electricity Communications
Power
converters

20
– SAFT Li-ion battery: maximum stored energy 20000 Wh, rated power 150 kW, rated
discharge current 200 A, rated charge current 34 A, operating voltage 189 V – 227 V
– 254 V, capacity 82 Ah
– Ultracapacitors: maximum stored energy 57 Wh, rated power 10 kW, rated current 20
A, peak current (<1s) 200 Apk, operating voltage 250 V – 500 V, capacity 1,65 F
– Electric vehicle second life battery: maximum stored energy 23300 Wh, rated power
40 kW, rated current 150 A, operating voltage 240 V – 400 V, capacity 32 Ah
Power converters / Microgrid emulators
It is possible to emulate the electrical behavior of different Renewable Energy Sources and
building or community demands through the so-called Microgrid emulators (see Figure 10).
Emulation is the ability to reproduce power profiles with the aim of obtaining the same output
than the real element, such as PV units, electric vehicle charge events or household applianc-
es. Microgrid emulators are power converters with the following specifications:
– Total available Microgrid emulators: 5 cabinets
– Rated power: 4 kVA
– Configuration: back-to-back converters, bi-directional power flow
– Operation mode: active and reactive power set point following
Figure 10. Overview of the microgrid: microgrid emu-
lators (back), electric vehicle (right) and data acquisi-
tion and control system (front).
Figure 11. Grid emulator.
Grid emulator
The Microgrid elements can be directly connected to the laboratory power supply or to the so-
called Grid emulator (see Figure 11). This device is a configurable voltage source used to
emulate a set of power network conditions impacting on the building or community. In par-
ticular, it can be configured to simulate rural networks (weak grids) as well as different power
quality issues including frequency excursions or voltage harmonics (non-exhaustive list). The
main technical specifications are summarized as follows:
– Rated power: 200 kVA
– Rated current per phase: 350 A
– Rated current per neutral conductor: 35 A
Other equipment
Other devices are available in the lab:
– One 9-phase motor-generator test bench (30 kVA)

21
– Three 3-phase motor-generator test benches (3 x 5 kVA) of different generator tech-
nologies: permanent magnet synchronous generator, doubly-fed induction generator
and squirrel cage generator.
3.2.3. Data acquisition and control
The control and communications architecture of the microgrid is composed of three layers, as
can be observes in Figure 12. In the top one, called service layer, the microgrid can interact
with high-level control and management systems, either locally or remotely. In the middle
layer, the low-level control takes place in the so-called local concentrators. Such concentra-
tors are data gateways to enable operability of storage systems and emulators with the service
layer. Finally, the bottom layer, called configuration layer, aims at providing a means to con-
figure and monitor all devices before and during the execution of tests.
Figure 12. Data acquisition, control and communications architecture of the microgrid.
3.3. Example of previous studies
3.3.1. Study 1: Analysis and Experimental Implementation of Grid Frequency Regula-
tion using Behind-the-Meter Batteries Compensating for Fast Load Demand Variations
This study (Kim, Del-Rosario-Calaf, Norford 2017) proposes a new grid frequency regulation
(GFR) scheme using behind-the-meter battery energy storage systems (BESSs). The fast dy-
namic responses of the electrical BESSs enable buildings to compensate for the high-
frequency components of load demand variations, through direct load control (DLC). An
electrical system in a building, along with its building-level and device-level controllers, is
considered to address the difficulties in the application of DLC, especially in communicating
with several small-scale BESSs. A small-signal analysis is carried out using the aggregated
responses of the generators and the DLC-enabled buildings to investigate the proposed GFR
scheme, particularly with respect to the feedback controllers for the buildings. Simulation
studies are performed using a test grid for various penetrations of the DLC-enabled buildings,
and the test grid is implemented using a laboratory-scale microgrid. The proposed GFR is
Local Concentrators
Ethernet Switch operation
192.168.0.x
Ethernet Switch configuration
182.168.0.x
Ethernet Switch IREC
172.26.x.x
Modbus TCP-IP
Modbus TCP-IP
Ethernet Switch ADSL
192.168.42.x
SCADA
SCADAEMS Aggregator / Grid emulatorCyber Attacker
Grid emulator
200kVA, 350A per phase
Weatherforecast
Energy price
Emulated systems
Real systems
MYD3
Armari – 2 uxarxa
Emulation cabinet
4kVA
Armari – 7 uxarxa
MYD4
Emulation cabinet
4kVA
Armari – 6 uxarxa
MYD1
Emulation cabinet
4kVA
Armari – 4 uxarxa
MYD2
Emulation cabinet
4kVA
Armari – 5 uxarxa
MYD?
Emulation cabinet
4kVA
MYD?
Armari – 8 uxarxa
Ultracapacitor cabinet
57Wh; 10kW; 200Apk
2LBG
- +
2n Life Battery
2nd life Lithium battery
32Ah; 23kWh; 40kW
MYD?
Armari – 3 uxarxa
Lithium battery
82Ah; 20kWh; 150kW
- +
Central concentrator
Central concentrator
Data concentrators and gateways
CAN, Modbus RTU à Modbus TCP
Microgrid scenarios configuration
Load profile generation for the emulation cabinets
Start / Stop EMS, Agregator and Local Concentrator.
Forecast module
Grid emulator
Microgrid scenarios configuration
Programmable Configuration and management
Concentrator, Bridges and services

22
effective in reducing the frequency deviations and required reserve capacity of the generators,
which is achieved by making small variations in the state-of-charge of the behind-the-meter
battery. The experimental setup utilized in this study is presented in Figure 13.
Figure 13. (a) Experimental setup for the implementation of the test grid including (b) a generator emulator, (c) a
Li-ion battery pack, and (d) a load emulator.
3.3.2. Study 2: A Real-Time Commercial Aggregator for Distributed Energy Re-
sources Flexibility Management
The paper (Lipari, Del-Rosario-Calaf, Corchero, Ponci, Monti, in press) describes the imple-
mentation of a real-time Commercial
Aggregator, that pools the generation
and/or consumption flexibility of-
fered by its customers to provide
energy and services to actors within
the system. Results of the emulations
carried out in the scope of the FP7
European project IDE4L are present-
ed, highlighting the effects of the
participation of DERs and Microgrids
to the congestion management by
offering flexibility products through
the involvement of the Commercial
Aggregator (CA). Figure 14. Active power measurements during flexibility delivery
at customer’s premises.

23
3.4. Maintenance and collaborations
The Energy Smart Lab is run and managed by IREC, the Catalonia Institute for Energy Re-
search and its facilities are located in Barcelona, Spain. Seven full-time employees are main-
taining, organizing and using the lab facilities on average.
The Energy Smart Lab is collaborating in numerous projects with different partners:
– Direct contracts for equipment testing, development of technical solutions, improve-
ment of systems, etc. Example: pre-certification tests of Electric Vehicle charging in-
frastructure
– Partnership for national / international R&D projects: EU, KIC Innoenergy -EIT,
Horizon 2020. Example: laboratory-scale tests for the validation of ICT platforms for
the optimal management of Microgrids
– Donation of equipment for expanding the laboratory structure. Example: integration
of a Second Life Electric Vehicle Battery for stationary applications in the Microgrid
– Experimental test site for researchers. Example: development of a proof-of-concept
setup for novel applications of Flywheels to expand Wind Power Plant capabilities
– Joint research with other laboratories. Example: development of tests in coordination
with SEILAB laboratory to validate Building and Aggregator control implementa-
tions.
3.5. Additional information
Multimedia
A video presenting the lab can be found at the following address:
https://vimeo.com/111393514
More details can be found at the following address:
http://www.futured.es/en/capability/?prettyUrl=irec
3.6. Relevant publications
Y.J. Kim, G. Del-Rosario-Calaf and L.K. Norford. 2017. “Analysis and Experimental Implementation
of Grid Frequency Regulation using Behind-the-Meter Batteries Compensating for Fast Load
Demand Variations” IEEE Transactions on Power Systems, vol.32, no.1, pp.484-498.
G. Lipari, G. Del-Rosario-Calaf, C. Corchero, A. Monti and F. Ponci. In press. “A Real-Time
Commercial Aggregator for Distributed Energy Resources Flexibility Management”, in
Sustainable Energy Grids and Networks.
L. Igualada, C. Corchero, M. Cruz-Zambrano and F.J. Heredia. 2014.” Optimal Energy Management
for a Residential Microgrid Including a Vehicle-to-Grid System” IEEE Transactions On Smart
Grid, vol. 5, no. 4, pp. 2163-2172.
G. Del-Rosario-Calaf, M. Cruz-Zambrano, C. Corchero and R. Gumara-Ferret, "Distribution network
congestion management by means of electric vehicle smart charging within a multi-microgrid
environment," Electric Vehicle Conference (IEVC), 2014 IEEE International, Florence, 2014,
pp. 1-8.

24
4. Nearly-zero Energy Building Emulator – Aalto University
Institution / Department
Aalto University
School of Engineering
Department of Mechanical Engineering
Laboratory of Energy Efficiency and Systems
Location of the test facility
Aalto University, building K4
Sähkömiehentie 4M
02150 ESPOO (Finland)
Contact persons
Dr. Ala Hasan
Senior Scientist,
VTT Technical Research Centre of Finland
Dr. Simo Kilpeläinen
Laboratory Manager,
Aalto University

25
4.1. General presentation
The nearly-zero energy building (nZEB) emulator is a platform for studying the performance
of a building with different renewable energy production and storage equipment fitted into a
fully functional system operating in Finnish climate conditions. The platform is based on a
semi-virtual approach comprising of real components for energy generation, conversion and
storage connected with a simulated building and a ground source heat pump borehole. This
arrangement makes the system very flexible as different types and sizes of buildings may be
studied by simply changing the simulation model. The system is also equipped with an energy
management system (EMS) developed at VTT which can direct energy flows in an optimal
way by assessing the current and future energy status as well as the availability of renewable
sources (sun, wind). The nZEB emulator platform is a unique facility for assessing the real-
time performance of advanced energy solutions and investigating the energy-flexibility in
buildings towards achieving set targets in the building and requirements by the grid.
4.2. Description of the test facility
4.2.1. General principle and testing possibilities
General operation principles
The general operation concept of the nZEB emulator is presented in Figure 15. The platform
is designed to resemble a single-family house with respect to component sizing but the opera-
tion can be scaled to match different building types. The actual building is a TRNSYS simula-
tion running in a computer and the physical devices are operated according to electricity and
heating demands given by the simulation at six minute (changeable) intervals. The physical
part of the system is operated in real-time and according to real weather conditions as there is
no weather chamber. The platform is equipped with an energy management system (EMS)
which optimizes the energy use and flows by assessing the energy prices and weather. The
general uses for the platform are as follows:
Analysis of local energy matching in buildings
Performance evaluation of different control strategies for achieving optimal use of
energy resources
Gathering of high-resolution data from the various components for validating compo-
nent models used in simulations and optimizations
Examples of research possibilities
Experimental testing of novel energy solutions related to local production and storage
of electricity and heat such as PV panels, solar thermal collectors, microwind tur-
bines, heat pumps, batteries and heat storages
Development and testing of new control strategies for energy systems in smart build-
ings
Monitoring and recording the behaviour of different components present in the sys-
tem
Using the data to calibrate the models for building simulation tools

26
Optimization of energy flows in order to improve energy generation/demand match-
ing and interactions with bidirectional future hybrid smart grids of electricity and
heating
Evaluation of modelled electric/hydrogen vehicle as a part of the nZEB concept
Evaluation of the energy flexibility performance of building’s energy systems e.g. for
minimizing operating energy costs, environmental impacts or responding to grid re-
quirements.
Figure 15. Operation and basic component diagram of the emulator platform.
4.2.2. Equipment available and specifications
PV panels
Figure 16. PV panels and microwind turbine on the roof of the K4 building.
Heat
pump
Electric
grid
+/-
Solar-
thermal
Micro-
wind
PV
Local
weather
station
Roof-mounted
components
Electrical loads Domestic
hot
water
Hot water
tank
Computer
simulation
of the building
Heat
exchanger
DHW
profile
Space heating
system
performance
Heating circuit
Electricity
consumption
profile
Emulation of the
building’s thermal
and electrical
performance
Battery
Heat
exchanger

27
A PV plant consisting of 18 panels in two rows is installed on the roof of the lab (Figure 16).
The panels have a nominal capacity of 240 Wp each, totalling 4.32 kWp. Both panel rows are
equipped with separate SMA Sunny Boy 2000 HF inverters, and the production is monitored
at one minute resolution via a Bluetooth interface.
Microwind turbine
In addition to PV panels, a Finnwind Tuule E200 microwind turbine with a rated capacity of
4 kW has been installed onto the roof (Figure 16). The turbine is located at the top of a 9 me-
ter high steel mast, accounting for a 25 meter total distance from the ground level. The turbine
automatically rotates towards the wind direction and is equipped with storm protection which
turns it away from the wind if the gusts become too powerful. The wind plant is equipped
with an SMA Windy Boy 3600 TL inverter which, like its PV counterparts, is monitored at
one minute resolution via Bluetooth.
Island electricity network
The PV panels and the wind turbine are connected to an island electricity network via an
SMA Sunny Island 6.0H inverter (Figure 17). The island network is equipped with a 48 V,
200 Ah battery (four 12 V 200Ah lead acid batteries in series), and also contains ten 600 W
electric heaters which emulate the electricity loads of a house according to the simulation’s
load profiles. The battery state-of-charge is monitored by the inverter and communicated to a
computer via an Ethernet cable.
Figure 17. PV and island network inverters. Figure 18. Flat-plate solar collectors on the roof of the
K4 building.
Solar thermal collectors
For heat production, two sets of four solar thermal collectors have been installed on the roof
(Figure 18). One of the sets consists of Oilon Solarpro flat-plate collectors whereas the other
one contains AMK-Solac OWR 12 evacuated tube collectors. Each set has a capacity of ~4
kW at typical Finnish summer conditions and is equipped with a Sonnenkraft SKSC3+ con-
troller/pumping station which controls the brine flow rate in the circuit.
Ground source heat pump (GSHP)
The other method for heat production in the platform is an Oilon Geopro GT 5 ground source
heat pump with a nominal capacity of 5 kW (Figure 19). There is no real ground borehole so
a hydraulic circuit including a 500 liter buffer tank filled with brine is used as a heat source

28
for the GSHP. The brine flowrate and return
temperature are emulated according to the
borehole output results from the TRNSYS
simulation. The buffer tank is heated up by
the rejected heat from the system that would
normally be used for the space heating of
the building.
Hot water storage
The emulator platform is equipped with three Akvaterm Akva Solar hot water storage tanks
(Figure 20). Two of the tanks have a capacity of 500 liters while the third is slightly smaller at
300 liters. Each tank is equipped with three heating coils (solar thermal, DHW pre-heating,
DHW heating). There is a plate with a small opening in the middle of the tank for separating
the top and bottom parts from each other. The temperature stratification is monitored by five
thermocouples placed inside the tank at different elevations. One of the 500 liters tanks is
equipped with a 6 kW electric heater and the 300 liters tank is prepared for the future imple-
mentation of phase-change materials as a heat storage. The storage tanks have flexible con-
nections so it is possible to have them in a series or a parallel configuration, or a combination
of the two.
Figure 20. One of the hot water tanks, and schematic of the storage tank connections.
Other equipment
- Vaisala AWS330 weather station for measuring temperature, humidity, wind
speed/direction and solar irradiance
- Water-to-air heat exchanger on the roof for emulating export of excess solar thermal
heat into district heating network
Figure 19. Ground source heat pump.

29
4.2.3. Data acquisition and control
The majority of the components in the emulator platform are controlled by a Labview-based
software developed at Aalto University (Figure 21). This software is also used for data acqui-
sition from the roughly 100 thermocouples, resistance temperature detectors (RTDs) and flow
sensors the system is equipped with. The sensor data is collected mainly via National Instru-
ments DAQ modules connected to the computer via USB ports.
The production facilities (PV, wind turbine, solar thermal collectors) are operated by their
own factory-supplied controllers and their data is acquired via dedicated software, written
into CSV files and then read into the Labview main program.
The rest of the system is controlled with PID and on/off controllers written into the Labview
program. For supplying control voltage (0-10V) to the various actuators, pumps etc., Meas-
urement Computing USB analog voltage modules are used.
Besides acting as the data acquisition and control hub of the system, the Labview program
also acts as an user interface for operating the system, and communicates with the simulation
software (TRNSYS) containing the building and the GSHP borehole as well as with the ener-
gy management
system which
gives decisions
on how to direct
the different
energy flows in
the system. The
communication
between Lab-
view and the
other software is
done via text
files.
Figure 21. Screenshot of the Labview interface.
The heat and electricity demands of the building under investigation are calculated at fixed
time intervals (currently six minutes) by the TRNSYS simulation program and then supplied
to the physical part of the system via Labview. While the simulation calculates the heating
demands and the space heating water return conditions, it uses typical profiles for the house-
hold electricity consumption and domestic hot water DHW, along with the prevalent weather
conditions. In addition to providing energy demands, TRNSYS also simulates the GSHP
borehole and gives Labview the temperature of the brine returning from the ground to the
heat pump.
The energy management system (EMS) is a Matlab-based program which optimizes the ener-
gy flows in the system based on a successive linear programming (SLP) approach (Ruusu et
al., 2016). While nonlinear methods are generally preferable, this approach works well here
since the problem set is mostly linear and the real-time operation of the system calls for a fast
algorithm. With the help of real-time and forecast energy pricing and weather data, EMS can

30
instruct the system on how to deal with locally produced and imported energy i.e. to cover the
demand, convert or store the energy in the same or another form (e.g. electricity to heat), or to
export/import to/from the connected networks. The EMS is connected to the online Nordpool
spot electricity pricing database as well as to online weather forecast from the Finnish Metro-
logical Institute. In its current iteration, EMS manages the temperature set points for the
GSHP, electric heater and excess solar heat export, as well as decides when and at what por-
tion to import/export/store electricity in the batteries.
4.3. Example of previous studies
The first task of the emulator platform is to provide experimental data for a joint Aalto/VTT
Finnish Academy project dealing with nearly-zero energy buildings and supply/demand
matching. In this project, the emulated building is a 150 m2 well-insulated Finnish single-
family house with four occupants. The emulator is operated for two full calendar years with
the first one having finished in spring 2016 and the second one to finish in late 2017.
In the first year, the system was run with its original components and settings, and the results
were analysed both to study the operation and performance of the different components, and
to come up with ideas of improvement for the second year of operation. In general, the system
performed reasonably well. There were a couple of issues with the most notable one being the
poor performance of the batteries in the PV/wind system. To give an example of the data
analysis, Figure 22 shows the monthly onsite energy fraction (OEF) and onsite energy match-
ing (OEM) indices for electricity during a six-month period from Sep 2015 to Feb 2016. The
OEF (demand cover factor) is the portion of the total electricity consumption covered by local
production whereas the OEM (supply cover factor) is the portion of self-consumption from
the total local electricity generation. As can be seen from the figure, OEF is high during au-
tumn when there is still PV generation whereas OEM is better in winter when the constant
electricity demand due to heating is high.
Figure 22. Monthly average matching indices OEFe and OEMe at different time averaging intervals.
After year one was finished, some modifications and additions were made for the second year
during a maintenance break lasting several weeks. The most notable changes were the addi-
tions of the intelligent EMS software as a master controller of the system (done in early
2017), and a heat exchanger on the roof for emulating heat export from the solar thermal sys-
tem to the district heating grid. The batteries of the PV and wind plants were replaced as the
original ones had reached the end of their lifetime. On the simulation side, TRNSYS was set

31
to use real-time weather data from the weather station instead of a weather profile from the
past.
The extensive analysis of the data from year two will be done later but the preliminary results
show that the issues that were present in the first-year data are resolved. The EMS seems to
be performing according to expectations although it won’t be put into a real test until summer
2017 when it has more options to consider.
4.4. Maintenance and collaborations
The nZEB emulator is run and maintained by the Laboratory of Energy Efficiency and Sys-
tems at Aalto University. Currently, the operation is mainly handled by Dr. Kilpeläinen, with
a laboratory technician helping with maintenance and new hardware installations
Currently, the emulator is operated year-round for providing data to a Finnish Academy re-
search project dealing with nearly-zero energy buildings and supply/demand matching. In the
future, research projects in collaboration with companies developing new technology for re-
newables and/or control systems, as well as international partners dealing with similar topics
can be expected.
4.5. Relevant publications
R. Ruusu, S. Cao, A. Hasan, J. Kortelainen and T. Karhela. 2016. “Developing an Energy Management
System for Optimizing the Interaction of a Residential Building with the Electrical and
Thermal Grids”. CLIMA 2016 – Proceedings of the 12th REHVA World Congress: Vol 10
(2016).

32
5. Labs in EnergyVille
Institution
EnergyVille
KU Leuven – VITO – IMEC
http://www.energyville.be
Locations
Campus EnergyVille
Thor Park 8310
Be-3600 Genk (Belgium)
Tel +32 (0)14 33 59 10
E-mail: [email protected]
Contact person
Marcel Stevens

33
5.1. General presentation
The EnergyVille laboratory facility provides a modern, high-end environment for testing and
developing solutions for renewable energy integration in electrical and thermal systems. The
EnergyVille laboratory facility consists of 5dedicated laboratories which are linked to specific
domains of expertise: Battery Testing Lab, Home Lab, Polyline Medium-Voltage Smart En-
ergy System Lab, Matrix Lab and Thermo-technical Lab.
Each of the laboratories is equipped with state-of-the-art measurement equipment and data-
acquisition systems to facilitate high-end research in the specific sub-domains. Moreover, all
laboratories are physically interconnected to enable the integrated testing of innovative tech-
nologies for electrical and thermal systems. As such the entire EnergyVille building with its
laboratories and offices can act as an integrated test facility.
5.2. Description of the test facility - Battery Testing Lab
5.2.1. General principle and testing possibilities
EnergyVille has one of the most extensive
battery testing labs in Flanders, consisting
of multiple battery and cell testers and a
flexible setup. EnergyVille uses its infra-
structure to evaluate ultra-capacitors, bat-
tery cells, battery components and materi-
als. Also, systems using batteries or bat-
tery management systems can be evaluat-
ed.
Figure 23. Illustration of battery testing.
General testing possibilities
Batteries and ultra-capacitors exist in many types. Selecting the optimal one for an application
is a complex matter, moreover since within each chemistry type (Lithium-Ion, Nickel-metal
hydride...) exist several subtypes. The actual performance and lifetime of a specific applica-
tion can only be determined by testing.
EnergyVille can perform tests according to any customer specified profile. We have elaborate
experience in developing custom efficiency test procedures that are equivalent to actual appli-
cation cycles (electric vehicles, solar batteries…).
EnergyVille offers performance and lifetime tests according to international standards:
Static capacity tests at various discharge currents
Constant power discharge tests
Hybrid pulse power characterisation tests
Self-discharge tests
Cold cranking tests
Thermal performance tests
Energy-efficiency tests
Charge sustaining cycle life tests
Charge depleting cycle life tests

34
Calendar life tests
Each of these tests can be performed at various temperature profiles. Batteries and battery
components can also be subjected to several current ripple profiles.
5.2.2. Equipment available and specifications
2 PEC SBT8050 battery testers (36kW)
o 24 channels in total
o maximum voltage: 80V per channel
o maximum current: 600A, max. 12 channels of 50A each
2 PEC SBT0550 cell testers (6kW)
o 48 channels in total
o maximum voltage: 5V per channel
o maximum current: 600A, max 12 channels of 50A each
1 PEC ACT0550 cell tester (16kW)
o 40 channels in total
o Maximum voltage: 5V per channel
o Maximum current: 250A, max. 5 channels of 50A each
Triphase 75kW inverter
o maximum voltage: 700V
o maximum current: 160A nominal, 200A peak
Triphase 30kW inverter
o maximum voltage: 700V
o maximum current: 96A nominal, 144A peak
1 VMP3 from Biologic with 8 independent potentiostat/galvanostat channels in-
cluding electrochemical impedance spectroscopy (EIS) measurement.
o Current ranging from 10 μA up to 5A with a resolution of 0.0033% of FSR
o Voltage ranging from 0 to 10V with a resolution of 0.0033% of FSR
o Frequency range 1 MHz to 10 μHz (accuracy: 1%, 1°)
Amplitude potentio: 1 mVpp to 1 Vpp
galvano: 0.1% to 50% of the current range
Associated temperature chambers
o temperature range: -20°C – +55°C
5.2.3. Data acquisition and control
Data-acquisition is performed by the battery and cell testers. The voltage-, current- & temper-
ature measurements of each individual test channel are logged on 1 second base. The Battery
Testers are periodically calibrated according to the ISO 9001 Quality Management System.

35
5.3. Description of the test facility – Home Lab
5.3.1. General principle and testing possibilities
The EnergyVille Home Lab is a
real life test infrastructure for home
energy management systems, resi-
dential demand response technolo-
gies and in home communication
systems. Specifically, the Home
Lab enables the testing of residen-
tial energy management systems,
communication systems, novel
optimization algorithms etc. in real
life conditions.
Figure 24. HomeLab.
For example, the demand response technologies which were developed in the Linear project
were first tested in our Home Lab before integrating them in the participants’ houses. Busi-
ness cases such as maximization of self-consumption, peak shaving, wind balancing and Time
Of Use tariffs, etc. were tested.
General testing possibilities
There are two electrical distribution boards, each representing one residential house. A flexi-
ble connection system facilitates the configuration of the available appliances, such as a smart
washing, a dishwasher, a tumble dryer, a domestic hot water heater etc., in these two houses.
Apart from this, there is also the possibility to connect solar panels through a residential PV
invertor but also devices from all the other labs in the building can be physically connected to
a house in our Home Lab through our Smart Test Grid. This way we are able to integrate a
smart charging station, a smart heat pump, microCHP,, batteries etc. For example a small LV
distribution grid can be set up in which the charging of electrical cars is coordinated, on a
parking lot with smart charging stations, based on the production of a central PV station in
combination with battery storage. This gives us the opportunity to test systems on the distri-
bution level but also test power quality problems, voltage droop control, etc.
5.3.2. Equipment available and specifications
The EnergyVille Home Lab enables the integrated testing of products and services that are
key to the implementation of Smart Grids, such as home energy management systems, resi-
dential demand response technology and in-house communication technology.
Peripherals:
a programmable load (10kW) with a dedicated interface that allows for easy configu-
ration of consumption profiles
a PV inverter simulator (2.5 kW)
a PV panel simulator (2 kW)

36
multiple types of smart meters, energy management systems, smart plugs
multiple smart appliances, including state of the art smart washing machines, dish-
washers, tumble dryers, air-conditioning and domestic hot water (DHW) buffers
various battery packs
Inter-lab connections:
The Home Lab can be connected to the smart grid infrastructure to set up low voltage
distribution grid tests.
The Home Lab can be connected to the Thermo Technical Lab in order to include
(smart) heat pumps, μCHPs and thermal storage components.
5.3.3. Data acquisition and control
The energy consumption of the individual loads is measured with dedicated power meters.
The active/reactive power, voltage, current, cosΦ,… are logged.
5.3.4. Example of previous studies
The Linear research project examined various methods to tailor a household's energy con-
sumption in function of the available wind and solar energy. These methods included new
technologies and user interfaces. The major research questions were:
- How does a change in behaviour benefit both households and the industry?
- How are the costs and benefits distributed among the parties involved?
- Which solutions result in sufficient motivation and convenience to prompt a change in
behaviour?
- To what extent are households willing and able to adjust their behaviour?
More info:
http://www.linear-smartgrid.be
5.4.Description of the test facility – Smart Grid Infrastructure
5.4.1. General principle and testing possibilities
In the Smart Grid Infrastructure Lab, our highly experienced team executes tests and vali-
dates:
power line communication systems in distorted grids.
long-term automated cycling of Li-ion batteries and reference performance tests.
research on low voltage distribution grids with a high amount of renewable energy
sources
development & test of VITO Intelligator®: an agent based control algorithm to match
supply and demand of energy.
power quality: voltage dips, phase unbalance, harmonic distortions.
voltage droop control: taking grid constraints into account by power adjustments.
37
inverter control algorithms for unbalanced grid conditions.
data analysis:
different energy flows (V, I, cosφ ,..) are logged in a dedicated SCADA system.
accurate high speed PQ measurements according to EN 50160.
5.4.2. Equipment available and specifications
The EnergyVille Smart Grid Infrastructure consists of:
a 150 kVA low voltage AC-grid , connected to:
o the EnergyVille Home Lab with test facilities for energy management sys-
tems and smart domestic appliances.
o the EnergyVille Thermo Technical Lab with test facilities for heat pumps,
μCHP and thermal storage.
o extra cable loops.
o PV systems & simulation equipment
o EnergyVille’s Battery Testing Lab.
charging station for plug-in hybrids, electric vehicles & electric scooters
dedicated programmable inverter and converter equipment:
o 70 kVA inverter as three-phase grid connected inverter, with or without neu-
tral line.
o inverter as grid independent voltage source that reproduces volt-
age/frequency.
o deviations and harmonic distortions.
o two dedicated 100 A DC-DC converters.
reconfigurable programmable inverter and converter equipment.
possible configurations:
o two 11 kW grid-connected inverters with neutral line
o three three-phase 11 kW grid-connected inverters
o one 11 kW grid-connected inverter with three 32 A DC-DC converters
a 700 V low-voltage DC-grid connected to:
o a DC-DC converter with battery storage and/or supercapacitor storage.
o DC-sources such as fuel-cells and PV.
a 150kW bidirectional DC module, useful to simulate batteries or PV installations as
source or batteries or other DC devices as load.
5.4.3. Data acquisition and control
The branches in the test grid are equipped with current and voltage sensors which are con-
nected to a high speed data-acquisition system.

38
5.5. Description of the test facility – Polyline Medium-Voltage Smart Energy Lab
5.5.1. General principle and testing possibilities
This facility enables to test medium-
voltage smart-grid equipment in a
three-phase synthetic grid up to the
50th harmonic in realistic condition.
Figure 25. Polyline Medium Voltage Smart Energy Lab.
General testing possibilities
In the EnergyVille Medium-Voltage Smart Energy System Lab, our experienced team offers:
measurement of voltage and selected current levels on a 36kV 3-phase / 100 kV 1-
phase installation
surge voltage measurements
partial discharge measurements of components (AC + DC)
custom measurements and experimental configurations for cases of out of the ordi-
nary use
pre-certification testing to the applicable standards
The PolyLine system consists of two synergetic facilities:
a traditional, single-phase AC (50/60 Hz, 100 kV)/DC (100 kV) + impulse (200 kV)
facility
a three-phase synthetic grid up to 36 kV/1000A (5kVA per phase for voltage and cur-
rent injection), with wide bandwidth (25Hz to 5 kHz) to capture complex system
transient and non-ideal behaviours unavailable in traditional testing facilities. It al-
lows equipment, sensors, and protection devices to be exposed to fully user-
programmable situations of: unbalance, harmonics, transients, reproduction of rec-
orded grid faults, fluctuations in fundamental frequency, interaction with simulations,
etc.
5.5.2. Equipment available and specifications
Equipment
two mono-phase, partially discharge-free, Haefely transformers of 220V/100kV,
5kVA and 9kVA
wide-band voltage transformer, 3*36kV/5kVA, separate cores, 25 Hz – 5 kHz
wide-band current-injection transformers, 1000A, isolated to 36 kV, 5 kVA/core, 25
Hz – 5 kHz (3X)

39
power amplifier, tri-phase, 10 Hz - 5 kHz bandwidth, 110 V output
Marx multiplier for creation of surge voltages up to 200kV
Saturn Flat isolated measurement system for multi-channel, wide-band registration of
low-voltage sensor signals in the high-voltage section
DMI 551 for measurement of DC, AC and peak voltages
partial discharge measurement equipment (AC + DC, 3-phase multiplexed capability)
wide selection of ancillary measurements, such as temperature, current, etc.
the system can be fed from a local generator, offering exceptionally clean 50/60 Hz
wave forms
Extra features
The EnergyVille Medium-Voltage Lab can be connected to EnergyVille’s Matrix Lab, Smart
Grid Infrastructure Lab, Home Lab and Thermo Technical lab.
5.6.Description of the test facility – Matrix Lab
5.6.1. General principle and testing possibilities
The Matrix Lab enables to measure the electrical and mechanical characteristics of electro-
technical equipment, power electronic devices and solar panels.
General testing possibilities
In the EnergyVille Matrix lab, our experienced team executes tests on and validates:
solar panels and their ancillaries, in controlled climate and irradiation conditions.
electrical motor, transformer or generator behaviour and efficiency that is subject to
variable power and load curves
measurements on power electronic devices and converters
interaction between multiple devices and energy modalities
calibration of power meters
customised experiments and measurements
5.6.2. Equipment available and specifications
Multiple, multi-modal sources and loads can be interconnected as desired
Standard, industrial power available up to 45kW/100kW
Atlas SolarClimatic Test Cabinet Type SC 2000 MHG
Test benches for electric motors/generators from 500W to 45/90kW
Various AC and DC generators
Controllable sources to generate outputs 0-400V at 64A / 200A
Various bi-directional, programmable power electronic sources
Various resistive loads
Power calibration table with precise three-phase voltage and current control (up to
600A)
Precision voltage, current, torque, speed, temperature and power measurements
Remote-controllable using local Ethernet or over the Internet
Many more capabilities at user’s request

40
5.7.Description of the test facility – Thermo-technical Lab
5.7.1. General principle and testing possibilities
The Thermo-Technical Lab is one of the
major research facilities of the EnergyVille
knowledge center. It is a multi-functional
laboratory infrastructure in which static and
dynamic tests on thermal systems (heating
and cooling) can be performed.
Figure 26. Thermo-technical lab.
Testing possibilities
highly accurate measurements of:
relevant emissions
energetic performance
fast response dynamic measurements
dynamic tests of:
boilers, burners, control systems, hot tap water appliances...
cogeneration units: engines, turbines, μCHP’s, ORC's,...
heat pump systems
thermal energy storage systems (both sensible and latent heat)
combinations of systems: heat pumps and thermal energy storage, combined heat and
power and thermal energy storage, distributed thermal energy storage, sorption sys-
tems
energy system combination: f.i. a boiler combined with cogeneration and a storage
tank
including renewable energy sources
including gas, oil, biogas and electricity
5.7.2. Equipment available and specifications
thermal power up to 1000 kW
electrical feed-in power to 500 kW (such as CHP, Turbine)
temperature from 3 °C to 90 °C
temperature 1/10th DIN 3 point calibration certificate (4-20 mA)
connection gas or gas mixture through own gas station
high-end electromagnetic flow measurements with 3 point calibration certificate (4-
20 mA)
logging of all measuring points and control parameters can be set individually (abs,
avg, ...)
both fixed set points as a dynamic profile to 200 ms selectable

41
direct coupling with external datasets or dynamic simulation software
electrical connection of devices with other laboratories using their own lowvoltage
test grid
a modular construction for easy monitoring and control can be added
5.7.3. Data acquisition and control
The laboratory is controlled and measured by an industrial PLC infrastructure, linked to a
SCADA package. The devices can be connected directly to the EnergyVille Smart Grid Infra-
structure Lab.
5.7.4. Example of previous studies
Lab testing as part of national and European research projects (FP7 E-hub, Linear,
etc.)
Efficiency testing of gas heaters
Energy performance testing of micro-turbines
Boiler characterization
Comparative testing of latent energy storage
Intelligent control of heat pump for smart grid peak shaving
Intelligent distributed thermal energy storage
5.8. Maintenance and collaborations
The EnergyVille laboratories are available for our own experts to conduct experiments for
you, or you can get in contact with EnergyVille experts to rent (a part of) the laboratory facili-
ties for your project.
Access to the EnergyVille Laboratories can only be obtained when an EnergyVille repre-
sentative is present. Access is also limited to persons familiar with the infrastructure. The
required test and set-up will always be designed in collaboration with an EnergyVille expert.
5.9. Additional information
Additional information on the EnergyVille laboratory facilities as well as related projects can
be found at the EnergyVille website:
www.EnergyVille.be
5.10. Relevant publications
Linear consortium. (2014). LINEAR - Demand Response for Families. Genk. Retrieved from
http://www.linear-smartgrid.be
Vanhoudt, D., Geysen, D., Claessens, B., Leemans, F., Jespers, L., & Van Bael, J. (2014). An actively
controlled residential heat pump: Potential on peak shaving and maximization of self-
consumption of renewable energy. Renewable Energy, 63, 531–543.
http://doi.org/10.1016/j.renene.2013.10.021

42
Beerten J. 2013. Modeling and Control of DC Grids (Modellering en controle van DC netten). PhD
Dissertation, KU Leuven, Department of Electrical Engineering, Belmans R. (supervisor)Title
of Chapter
Costanzo, G. T., Iacovella, S., Ruelens, F., Leurs, T., & Claessens, B. J. (2016). Experimental analysis
of data-driven control for a building heating system. Sustainable Energy, Grids and Networks,
6, 81–90. http://doi.org/10.1016/j.segan.2016.02.002

43
6. The OPSYS test rig - DTI
Institution / Department
Danish Technological Institute
Energy and Climate
Refrigeration and Heat Pump Technology
Location of the test facility
Danish Technological Institute
Gregersensvej 2
2630 Taastrup (Denmark)
Tel. +45 72 20 20 00
Contact persons
M.Sc. Søren Østergaard Jensen
Tel. +45 7220 2488

44
6.1. General presentation
The OPSYS test rig emulates a house with an underfloor heating system to which a ground
source heat pump can be connected. Figure 27 shows a principle sketch of the system. The
system has two main elements denominated the hot side and the cold side, seen from the heat
pumps point of view (cold side = evaporator side, hot side = condenser side).
The hot side emulates the underfloor heating system (can also emulate a radiator system) with
the possibility of using a buffer tank. The underfloor heating system is emulated via a series
of parallel-connected heat exchanges resembling each room in the house. Hot water draw off
may also be emulated, but this is at the moment not part of the test setup.
The heat consumption is programmable in order to simulate different sized rooms of a house
with different load conditions. The controller of the experimental setup is running a simula-
tion program that calculates the heat consumption of the rooms and provides an emulated
room temperature and an emulated return temperature of the water from each “room” as input
to the control of the manifold. In this way it is on one hand possible to control an underfloor
heating system like in an ordinary home while on the other hand different more advanced
control strategies may also be tested. The size and function of the “rooms” can easily be
changed by changing the load pattern and heat loss of the “rooms” in the simulation program.
The cold side of the experimental setup (see Figure 27) emulates a heat source, e.g. the
ground. This is an electric heater, which is controlled in order to obtain a brine temperature
defined by the simulation program. With this method, seasonal variations of the ground tem-
perature and different length of tubes in the earth can be emulated as well.
Figure 27. Principle sketch of experimental setup.
6.2. Description of the test facility
6.2.1. General principle and testing possibilities
General testing principles
The general concept of the semi-virtual test rig is presented in Figure 28. A real physical de-
vice (heat pump or control of the thermostats in the heating system) is placed in test rig,
where it is studied under specific conditions that are simulated and implemented in the virtual
environment. The overall principles are as follows:

45
• Test of the components under defined building and environmental conditions
• Development and integration of innovative control of heating systems.
• Analysis of equipment behavior at particular transitory phases for performance im-
provement.
Figure 28. General concept of the semi-virtual OPSYS test rig.
Detailed testing principles
Experimental testing of control of the forward temperature of a heat pump.
Experimental testing of control of the water flow through a heat pump and through
the different circuits of a heat emitting system.
Demonstration of optimal combined control of a heat pump and the heat emitting sys-
tem in a house.
Demonstration of advanced control of a heat pump and the heat emitting system in a
house for optimization of the efficiency of the complete system and/or for providing
energy flexibility to the surrounding grid.
6.2.2. Equipment available and specifications
Heat emitting system
The heat emitting system consists of four heat exchangers emulating the heat demand of the
house – see Figure 29. If necessary, more heat exchangers may be added to the test rig.
The virtual heat load on each heat exchanger is simulated by a house model developed in
Dymola (Modelica) and embedded in the control system of the test rig as an FMU (Functional
Mock-up Unit). The physical heat loads on the heat exchangers are created by the central

46
cooling system at Danish Technological Institute, Energy and Climate Division. The flow rate
of the cooling water is for each heat exchanger determined by the return temperature of the
warm water leaving the underfloor heating simulated by the house model
The hot water flows in the heat exchangers are controlled by traditional actuators for under-
floor heating systems consisting of a valve controlled by a wax motor – see Figure 29. When
heating the wax with an electric current the valves open. The valves close again when the
current is turned off. The valves may either be on/off controlled or be kept partly open by
pulsing the current through the wax motors. The position of the actuators is determined by the
simulated room temperature and the implemented control algorithms for controlling the ac-
tuators.
The test rig is developed in a Danish project with the aim of increasing the Seasonal Perfor-
mance Factor of heat pumps by optimization of the forward temperature from the heat pump
and the flow rate through the heat pump (Jensen et al, 2017). However, as the control of the
system is on the PC of the test rig, many different control options may be tested. One option
being controlling the heat pump according to the need of the surrounding power grid in the
terms of providing energy flexibility. Traditionally energy flexibility of heat pumps have been
tested by switching the heat pump on and off, however, increased energy flexibility may be
achieved by pre-heating the building within the comfort limits of the room temperature before
the heat pump is switched off due to a period with limited power in the grid. This demands
for more advanced control including forecast of the future power level in the grid and heat
demand of the house. As the control of the test rig is implemented on the controlling PC very
advanced control scenarios may be tested in the test rig and following transferred to commer-
cial control devices.
Figure 29. The heat exchangers emulating the heat emitters in a heating system (left). The actuators of the heating
system (right).
the heat exchangers are Reci PHE-TYPE: LP80Tx40 with a capacity of 8 kW
the actuators are from Uponor. Running time from fully closed to fully open and vice
versa is 300 seconds
actuators
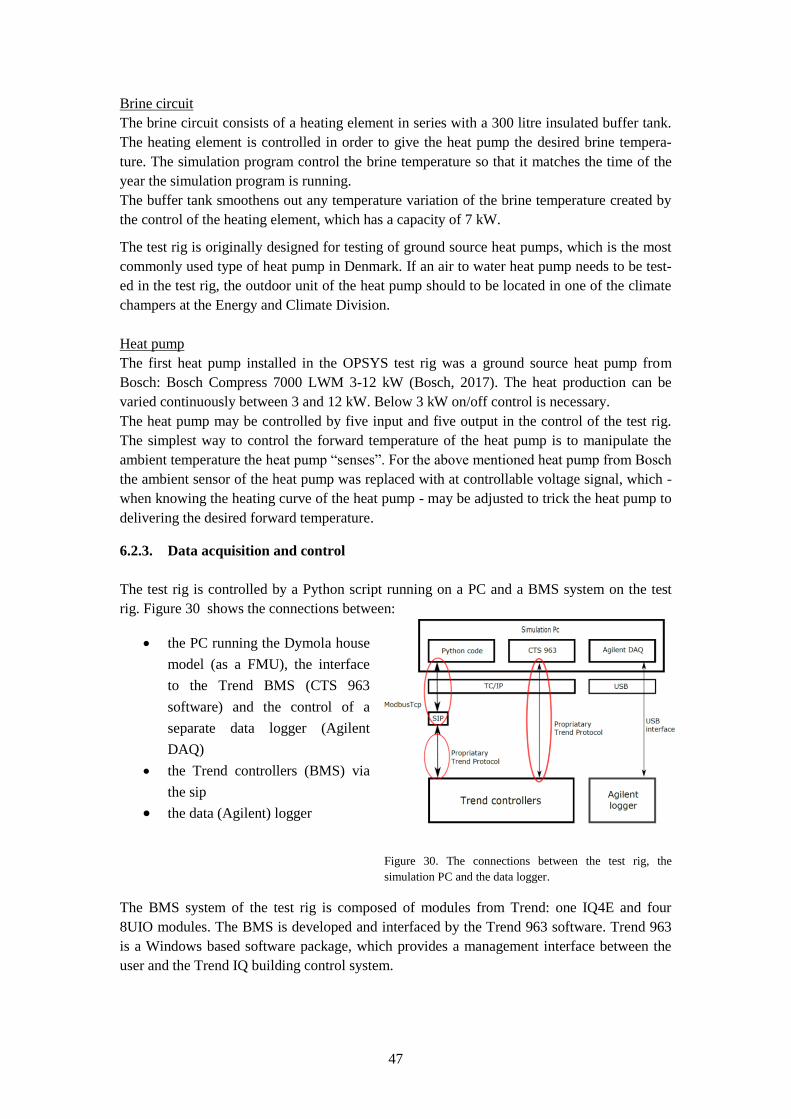
47
Brine circuit
The brine circuit consists of a heating element in series with a 300 litre insulated buffer tank.
The heating element is controlled in order to give the heat pump the desired brine tempera-
ture. The simulation program control the brine temperature so that it matches the time of the
year the simulation program is running.
The buffer tank smoothens out any temperature variation of the brine temperature created by
the control of the heating element, which has a capacity of 7 kW.
The test rig is originally designed for testing of ground source heat pumps, which is the most
commonly used type of heat pump in Denmark. If an air to water heat pump needs to be test-
ed in the test rig, the outdoor unit of the heat pump should to be located in one of the climate
champers at the Energy and Climate Division.
Heat pump
The first heat pump installed in the OPSYS test rig was a ground source heat pump from
Bosch: Bosch Compress 7000 LWM 3-12 kW (Bosch, 2017). The heat production can be
varied continuously between 3 and 12 kW. Below 3 kW on/off control is necessary.
The heat pump may be controlled by five input and five output in the control of the test rig.
The simplest way to control the forward temperature of the heat pump is to manipulate the
ambient temperature the heat pump “senses”. For the above mentioned heat pump from Bosch
the ambient sensor of the heat pump was replaced with at controllable voltage signal, which -
when knowing the heating curve of the heat pump - may be adjusted to trick the heat pump to
delivering the desired forward temperature.
6.2.3. Data acquisition and control
The test rig is controlled by a Python script running on a PC and a BMS system on the test
rig. Figure 30 shows the connections between:
the PC running the Dymola house
model (as a FMU), the interface
to the Trend BMS (CTS 963
software) and the control of a
separate data logger (Agilent
DAQ)
the Trend controllers (BMS) via
the sip
the data (Agilent) logger
Figure 30. The connections between the test rig, the
simulation PC and the data logger.
The BMS system of the test rig is composed of modules from Trend: one IQ4E and four
8UIO modules. The BMS is developed and interfaced by the Trend 963 software. Trend 963
is a Windows based software package, which provides a management interface between the
user and the Trend IQ building control system.

48
The Trend BMS modules communicate with the components of the test rig via a sip Mod-
Bus/vIQ module. The sip is an interface between the BMS and the components of the test rig
using the serial ModBus protocol.
The heart of the virtual part of the test rig is the FMU running a simulation of the heat de-
mand of a typical Danish house. Three typical Danish houses from four time periods has been
developed (Jensen et al, 2017):
a house from the 70’s
a house build according to the Danish Building Regulation 2010
a house build according to the Danish Building Regulation 2015
The house models contain typical free gains from persons, appliances and solar radiation. The
house models are using typical Danish weather conditions and an annual profile for the tem-
perature of the brine to a ground source heat pump.
The parameters and values of the house models may be changed to reflect other building
types and weather conditions.
The house models simulate the heat demand of the rooms of the house and transfer the room
temperatures and return temperature of the underfloor heating system of the rooms to the
control script also running on the PC.
Figure 31 shows a screenshot of the interface of the BMS showing the four heat emitting sys-
tems. The test rig can either be controlled by the Python control script running on the PC or
manually – the latter for e.g. performing step response tests.
Figure 31. Screenshot of the BMS interface showing the heat emitting system.
The test rig is equipped with several physical and virtual sensors measuring temperature,
flow, energy and actuator positions – please refer to (Jensen et al, 2017) for a description of
the applied sensors. The measurements is collected by the BMS, the data logger and the house
model and transferred to a database on the PC running the test rig.

49
Special purpose Python scripts have been developed for extracting and aligning the measured
data from the database.
6.3. Example of previous studies
6.3.1. Study 1: Underfloor heating and heat pump optimization
The OPSYS test rig has been developed as a central part of the Danish research project: Un-
derfloor heating and heat pump optimization (Jensen et al, 2017). The project will run until
September 2017.
The purpose of the project was to minimize the gap between the accredited efficiency of do-
mestic heat pumps and the actual efficiency when installed in a house. Unfortunately, meas-
urements on existing heat pump installations has shown Seasonal Performance factors (SPF:
mean annual efficiency) well below expectations as the heat pump and the heat emitting sys-
tem are rarely properly adjusted at the installation of the heat pumps, and the operating pa-
rameters are not continuously adjusted according to the actual operating conditions. The sup-
ply temperature is e.g. often set too high in order to guarantee sufficient space heating. A
supply temperature higher than needed results in a lower SPF.
Typically, an increase of 1°C in the temperature difference between the cold and hot side of a
heat pump leads to a decrease of 2-3% in the COP (instant efficiency of the heat pump). For
most heat pumps, the only control and means of reducing the supply temperature is a simple
ambient temperature correction, which, however, rarely leads to an optimal supply tempera-
ture. A too high supply temperature also has consequences for the heat emitting system. The
volume flow through the system fluctuates due to uncoordinated opening and closing of
valves in the system, e.g. manifold valves for an underfloor heating system. The higher the
supply temperature is above the minimum required supply temperature, the more the ampli-
tude of the fluctuations increases. The fluctuating flow causes the heat pump to fluctuate in
produced heat power resulting in a reduced COP compared to the optimal COP at the actual
temperature level. The larger fluctuations, the higher decrease in efficiency.
The aim of the project was to minimize the above problems, so that end users receive the
expected efficiency from their heat pump installations. This has been done by developing
integrated controllers for the heat pumps and the heat emitting systems in order to reduce the
supply temperature and volume flow fluctuations.
Preliminary results from a study financed by the Strategic Research Centre on Zero Emission
Buildings (Jensen, Olesen and Paulsen, 2014) indicated a theoretical potential for improving
the COP of an installed heat pump by approx. 15 % by optimizing the volume flow. The
study showed an equal large improvement when keeping the forward temperature as low as
possible. A detailed theoretical study including tests in the OPSYS test rig will be reported by
the end of 2017 (Jensen et al, 2017).

50
Figure 32. Results from simulation of the efficiency of a heat pump dependent on the forward temperature and
fluctuation of the flow rate though the heating system (Jensen, Olesen and Paulsen, 2014).
With on/off correction: the heat pump is frequency controlle except for below 30% of the nominal
heating power, where is is on/off controlled.
x Without on/off correction: frequency controlled in the whole area of the heat production.
6.3.2. Study 2.
A first study with a simple control in order to obtain energy flexibility to support grid opera-
tion is aimed to be conducted during the second half of 2017. The results of simulations and
tests in the OPSYS test rig will be reported in (Jensen et al, 2017).
6.4. Maintenance and collaborations
The OPSYS test rig is run and managed by Refrigeration and Heat Pump Technology at the
Danish Technological Institute. Refrigeration and Heat Pump Technology has laboratories in
both Taastrup and Aarhus, Denmark. The OPSYS test rig situated in Taastrup. Around 30
full-time employees are maintaining, organizing and using the lab facilities in Taastrup and
Aarhus.
Refrigeration and Heat Pump Technology performs:
• certified tests according to international standards on refrigeration and heat pumps
systems
• research and development in the fields of not only refrigeration and heat pumps but
also in the areas of solar energy, energy demand of buildings and smart grids
6.5. Additional information
Danish Technological Institute offers lab testing services in the area Eco design (Directive
2009/125/EC) and energy labelling (Directive 2010/31/EU) in the following categories;
Commercial refrigerated cabinets, condensing units, domestic ovens and hobs, electronics for
household, office and professional use, heat pumps, household refrigerating appliances, elec-
tric motors and drives, water pumps and circulators, fans, ventilation units - RVU/NRVU,
range hoods. Cross-product services include testing of sound and acoustics.
For further information: www.dti.dk/testing/ecodesign-and-energy-labelling/37224.
3.0
3.5
4.0
4.5
0 1 2 3 4 5 6 7
CO
P
ΔT = Tsupply - Tmin,supply [°C]
With on/off correction Without on/off correction
decrease due to high fluctuation in the heating system
decrease due to too high forwardtemperature

51
6.6. Relevant publications
Bosch, 2017. http://dk.documents.bosch-climate.com/download/pdf/file/6720813696.pdf
S.Ø. Jensen et al. 2017. “Combined optimization of heat pumps and heat emitting systems". Danish
Technological Institute and Aalborg University. December 2017. In process.
Jensen, Olesen and Paulsen, 2014. “Lightweight underfloor heating system and the impact on the
efficiency of heat pumps (partly in Danish, however, not the part containing Figure 32)”.
Danish Technological Insitute, February 2014. ISBN: 978-87-93250-01-7.

52
7. ZEB Living Laboratory - NTNU / SINTEF
Institution / Department
Norwegian University of Science and Technology,
NTNU
Department of Architecture and Technology
SINTEF Building and Infrastructure
Location of the test facility
NTNU Gløshaugen Campus,
Richard Birkelands vei 4
7034 Trondheim
Contact persons
Prof. Arild Gustavsen
Director of the Research Centre on
Zero Emission Buildings
Tel. +47 735 95 065
Dr. Terje Jacobsen
ZEB Centre User Liaison
Tel. +47 416 64 331

53
7.1. General presentation
The ZEB Living Laboratory test facility is a single family house with a gross volume of ap-
proximately 500 m3 and a heated surface (floor area) of approximately 100 m2. The building
is realized with state-of-the-art technologies for energy conservation measurements and re-
newable energy source exploitation, and was designed to carry out experimental investiga-
tions at different levels, ranging from envelope to building equipment components, from ven-
tilation strategies to action research on lifestyles and technologies, where interactions between
users and low (zero) energy buildings are studied. The building is equipped with different,
redundant energy systems and monitoring technologies, and is controlled by an on-purpose
developed system, which allow different types of tests to be conducted, among them tests on
energy flexibility in buildings.
7.2. Description of the test facility
7.2.1. Architecture and building technology
The Living Laboratory is a single family house with a gross volume of approximately 500 m3
and a heated surface (floor area) of approximately 100 m2. It is realized with state-of-the-art
technologies for energy conservation measurements and renewable energy source exploita-
tion. The plan of the Living Lab (Figure 33) is organized in two main zones: a living area
facing south and a working/sleeping area towards the north. The entrance is located in the
southwest corner, and through a filter space, that hosts a wardrobe, the user gets access to the
living room. The kitchen is located at the opposite end of the living room. An automated dou-
ble skin (ventilated) window is installed in the living room, covering the largest part of the
south facade. At the centre of the north zone, there is a shared studio area, equipped with a
long writing desk and with an automated window.
Two bedrooms (one facing east and one facing west) are located at the two sides of the studio
room. The technical room (accessible from outside the building), bathroom (accessible from
the studio room) and the kitchen are placed all along the central spine of the building in order
to optimize the distribution of the technical equipment. A small mezzanine is placed above
the west bedroom, and it is equipped as sleeping area for guests or as play area for children.
The building construction has been optimized through a set of preliminary simulations, and
resulted into a highly insulated envelope characterized by a glass ratio of around 20%. Walls,
floors and roofs are made out of a conventional wooden-frame structure with a double layer
of rock wool insulation for a total of 40, 40, and 45 cm respectively (and a U-value of 0.11,
0.10 and 0.11 W/m2K, respectively). All the windows are characterized by low u-value (in a
range from 0.65 W/m2K – south window – up to 1.00 W/m2K – for the roof windows).

54
Figure 33. Plan and vertical section of the Living Laboratory (1: entrance; 2: living room; 3: kitchen; 4: studio
room; 5,6: bedroom; 7: bathroom; 8: technical room). Original Figure in Goia et al. 2015.
7.2.2. Building equipment
The Living Lab is designed to minimize energy demand for its operation and to harvest solar
energy to such an extent that converted solar energy (both through passive measures and ac-
tive technologies) is larger, on a yearly basis, than the building energy demand, and even
compensate embodied emissions in the constructions by avoiding greenhouse gasses emis-
sions during the life of the building. The energy flow within the building plant, including on-
site renewable energy supply, is schematically illustrated in Figure 34.
The thermal energy necessary to cover heating, ventilation and domestic hot water demands is
primarily planned to be obtained by a fix speed scroll compressor ground source heat pump
(GSHP in Figure 34), which is connected to a surface collector field (total length of the ap-
proximately 150 m) located in the back-yard (north of the building side) of the Living La-
boratory. The heat pump has a nominal output of 3.2 kW (with B0W35) and a nominal COP
of 3.7. In case of thermal output at a higher temperature level (55 °C), the nominal COP is 3.0
(B0W55) and the nominal thermal power is 2.6 kW. The heat pump has a very simple control

55
logic, which turns on the compressor full power when a heating (thermal output at 35 °C) or
domestic hot water (thermal output at 55 °C) load is received by the controller, and turns it off
when the load signal is over. Control of the signals for heating or domestic hot water load is
achieved through the building level control system, integrated in the building monitoring and
control system.
The plant-side of the heat pump is connected to an integrated tank (IWT in Figure 34) that
combines a buffer tank (BT) for the heating circuit (160 l) and a domestic hot water tank of
240 l (DHTW). The lower, buffer tank, has with two coils: one connected to the thermal panel
circuit, and the other connected to the domestic hot water circuit for preheating of the sanitary
water. After flowing in the coil of the lower tank, the domestic hot water is stored in the upper
tank, equipped with a coil connected to the heat pump output. Two auxiliary electric coils (3
kW each) are installed in the integrated water tank, one for each of the two vessels.
For research purpose, two different terminal units for the heating system are available in the
building and planned to be operated independently: a floor heating system and one, 2kW
high-temperature (55 °C) radiator. Underfloor heating panels are located under the entrance,
the living room, the kitchen, the studio room, the bedrooms, and the bathroom. The sole ra-
diator is instead installed in the living room, approximately at the centre of the building. It is
also possible to use a combination of these two systems (e.g. the radiator can be used in com-
bination with the floor heating in the bathroom).
Heating through ventilation air (ventilative heating) can be also exploited to cover heating
demand in combination with fresh air supply need. In this case, underfloor heating in bath-
room is expected to operate in combination with the overheated fresh air supply.
The building is equipped with a balanced mechanical ventilation plant with nominal air flow
of 120 m3/h, and possibility to regulate the airflow up to 360 m³/h. Air diffusers are evenly
distributed in the building (living room, studio room and two bedrooms), while extract takes
place in the kitchen (to a small extent) and in the bathroom (to a larger extent). Fresh air sup-
ply is managed by a compact air handling unit that integrates a heat recovery system with
rotatory wheel. The nominal efficiency (with a flow rate of 250 m³/h) of this system is 85%.
The unit is equipped with an electric coil (1.2 kW) capable of heating up the supply air up to
40 °C (for ventilative heating purpose). A water coil (2 kW) is also available for post-heating
of supply air and it is connected to the buffer tank. The unit can effectively control only the
sensible temperature, while active control of relative humidity is not possible.
The air handling unit has an integrated controller that handles the equipment independently
by the centralized control/monitoring system. The unit is however connected to the (upper)
building level control system, which can therefore manage the unit. Hybrid ventilation strate-
gies (combination of mechanical and natural ventilation) can also be exploited thanks to the
possibility offered by some of the windows in the building, which are equipped with electric
driver to allow automated opening.
The artificial lighting plant of the Living Laboratory is based on an extensive use of LED
strips and LED luminaires. Conventional LED strips (12 V DC) with nominal power input of
4.8 W/m, 9.6 W/m and 14.4 W/m are installed according to locations and the required lumi-
nous flux.
Floor lamps and a pendant lamp above the dining table complete the lighting plant. All the
luminaires are controlled by the building level control system and can be dimmed from 0 to
100% of the power through both both physical (pulse switches) and virtual (on touch screen)
interfaces. The central building control system records the status of the physical and virtual
signals and consequently acts on 24 fast-response solid state relays to manage the LED stripes

56
and lamps. Total installed power (including outdoor lighting) of the lighting plan is 1.2 kW
(DC side). The AC to DC conversion is assured by a transformer with an efficiency of 87%.
Technologies for onsite renewable energy harvesting
Two façade-integrated solar thermal panels are installed on the south-facing façade of the
building. They cover a total area of little more than 4 m2, have optical efficiency of 0.82, and
are connected to the buffer tank and to the GSUH-SCF circuit. A series of dedicated valves
can change the direction of the flow of the heat carrier fluids in these circuits and different
paths are therefore possible.
A total of 48 PV modules are installed on the two roof slopes of the building, 24 modules for
each slope. Each PV module has a nominal power (values at STC) of 260 W, and the effi-
ciency is just below 16%. The total installed power (DC) is thus approximately 12.5 kWP for
both the roofs. Each PV roof is connected to a power inverter with a nominal AC rated power
output of 4.6 kW (single-phase, 230 V line), with an efficiency (European weighted efficien-
cy) of 96.5%. An electric battery is not installed at the moment, it is planned to add a battery
with a capacity of around 20 kWh.
Figure 34. Thermal and electrical energy/power flow in the Living Laboratory; technologies and devices for ener-
gy conversion and storage and associated monitoring system. Original figure in Goia et al. 2015.
7.2.3. Monitoring and control systems
Aim and requisites of the monitoring system
The monitoring system in the Living Laboratory has been developed in order:
- to monitor the most relevant environmental quantities, both indoor and outdoor;
- to record users patterns and occupants’ habits;
- to measure energy use for heating, ventilation, domestic hot water, artificial lighting,
appliances and other uses;

57
- to quantify solar energy exploitation and energy from the grid; and
- to assess efficiency in conversion and storage of energy for different uses, as well as
energy flexibility.
Starting from these aims, the requirements for the selection of the components of the monitor-
ing system were set considering that:
- a compromise between accuracy, number and type of the sensors should be found – i.e.
to reach the same measurement accuracy as in a laboratory test facility was out of the
scope;
- sensors should be integrated in the building as it would be in a real house, and they
should be chosen among those that can be installed in a conventional application;
- though, for research reasons, more sensors can be installed than in a conventional
building, the number and location of the sensors should be as close as possible to that
which would occur in a real, occupied building;
- the measurement system should be very flexible and allow a following upgrade to be
easily realized;
- the characteristics of the sensors should be so that measurements and data analysis can
be performed according to the relevant technical standards for energy and comfort as-
sessment (e.g. EN 15251, IEC 62053).
Sensors and transducers
The building is equipped with a weather station that integrates sensors for measurements of
outdoor air temperature (Pt 100; accuracy: ±0.3 °C), relative humidity (thin film capacitive
sensor%; accuracy: ±3%), barometric pressure (piezoresistive sensor, accuracy: 50 Pa), wind
velocity (ultrasonic sensor, two axes; accuracy speed: ±3%; accuracy direction: ±2 deg),
global solar irradiance on the horizontal plane (thermopile; accuracy: II class pyranometer).
The weather station is installed above the roof of the building. A luxmeter is installed on the
roof to record global (direct, diffuse, reflected) illuminance ln the horizontal plane (thermo-
pile; accuracy: ±5%). Global solar irradiance measured in two other locations as well: on the
roof slope plan and on the south façade, both by means of thermopiles (raccuracy: II class
pyranometer).
Outdoor air temperature is also recorded by means of two additional sensors located on the
south- and north-exposed façade (Pt 100; accuracy: ±0.1 °C). Both sensors are suitable pro-
tected from the influence of direct solar irradiation.
Indoor air temperature values are measured in every room of the Living Laboratory, at the
height of 1.6 m from the floor. In the living room and in the studio room temperature stratifi-
cation is also measured at 5 levels (0.1, 0.8, 1.6, 2.4, 3.2 m from the floor) by means of a wall
mounted sensors with PT100 probe (accuracy: ±0.1 °C). Relative humidity is recorded thanks
to a wall mounted capacitive probe (accuracy: ±3%) integrated in a multi-sensor element, in
all the room of the building. The relative humidity sensor comes in combination with a tem-
perature sensor (Si band-gap; accuracy: ±0.8 °C) which is used as temperature signal for the
controller.
Air temperature and relative humidity values are also measured near each diffuser of the ven-
tilation plant (i.e. living room, kitchen, studio room and two bedrooms) though duct sensors
that integrate a band-gap temperature sensing elements (accuracy: ±0.8 °C) and a capacitance
probe for relative humidity measurement (accuracy: ±3%).

58
CO2 concentration values are recorded by means of a non-dispersive infrared sensor (accura-
cy: ±70 ppm + 5% MV), one sensor in each room, located close to the correspondent tem-
perature sensor.
A combined ceiling mounted sensor measures in each room diffuse illuminance level and
people presence. The sensor contains a probe for light intensity (digital sensor for illumi-
nance; accuracy: ±5%) and a sensing element for motion detection (infrared sensor). Users’
behaviour is also monitored by recording position (open/closed) of all the windows (both
automated windows and manually-operated windows) by means of a simple magnetic contact
sensor, as well as artificial light use down to every single LED luminaire.
Thermal energy demand for heating purpose is measured for two independent terminal con-
figurations (high temperature radiator, TEM8 in Figure 34, and low temperature underfloor
heating panel, TEM9 in Figure 34). For both the circuits, a thermal energy meter calculator is
used in combination with PT500 temperature probes and ultrasonic flow meters, resulting in
an accuracy of 2%. Monitoring of energy demand when underfloor heating panels are in use
is split in three different zones: living room, kitchen and studio; bedrooms; and bathroom.
Energy demand for domestic hot water (TEM11 in Figure 34) and waterborne energy demand
for ventilation (when the water coil is activated, TEM7 in Figure 34) are also monitored by
means of similar configuration. Sensors used to monitor thermal energy use are different from
those used to control the plant.
Airborne thermal energy demand for ventilation (TEM10 in Figure 34) is calculated from
measurement of air speed, of temperature and of relative humidity in ventilation ducts. For
this purpose, two sensors that integrates a PT100 probe (accuracy: ±0.3 °C) and a capacitive
probe (accuracy: ±3%) are installed, one in the supply main duct and one in the extract main
duct. Air speed is measured by means of one hot-wire sensor (range: 0.1…30 m/s; accuracy:
10%) in each of the two main ducts.
Electric energy use for heating ventilation and domestic hot water is monitored by means of
several electric energy meter located on the (single-phase) lines that powers different building
equipment components, all having a resolution of 1 Wh and an accuracy of 2%.
Electrical energy use in the building that is not related to heating, ventilation and domestic hot
water can be grouped in five categories: energy use for lighting (EEM10 in Figure 34), for
appliances (EEM9), general electricity for other uses (EEM8), energy use for use and control
of automated windows and shading systems (EEM7) and energy use for monitoring and con-
trol of the building (EEM6).
The electric energy monitoring system measures 25 power lines independently monitored
(single-phase energy meter with 1 Wh resolution and 2% accuracy), and allows a high level
of detail to be achieved, being able to discriminate electrical energy use a single appliance
(i.e. fridge; hob; oven; extraction hood; dishwasher; washing machine; tumble dryer), for
groups of sockets (i.e. sockets in living room and entrance; sockets in kitchen; sockets in stu-
dio room; sockets in bedrooms and sockets in bathroom), for line to power shading devices,
for line to power automated windows and their controllers. The power line for lighting is in-
dependently monitored and, as previously mentioned, through data post-processing based on
control signals counters it is possible to assess lighting energy use down to luminaire level.
Energy for auxiliaries is also monitored so that components are coherently grouped. Several
power lines related to electric coils or to the heat pump, as well as auxiliary lines for power in
the technical room and for the DAQ are monitored too.
Power converted by means of PV roofs is monitored both by means of two energy meters
(EEM1; resolution: 1 Wh; accuracy: 2%.), one for each PV roof, and by means of data re-
trieved from the inverters. Among others, data retrieved from power inverter include: operat-

59
ing hours; DC current input and voltage; DC power input; AC voltage and current output; AC
active, reactive and apparent power.
Three-phase electrical energy/power supply from the grid is monitored by means of a power
meter (63rd harmonic, 128 samples per cycle), which records, for each phase, current (accu-
racy: ±0.5%), voltage (accuracy: ±0.2%), power factor (accuracy: ±0.002), active power (ac-
curacy: ±0.2%), frequency (accuracy: ±0.01 Hz), active and reactive energy (accuracy: IEC
62053-23 Class 2 and IEC 62053-23 Class 0.5, respectively). The meter is designated with
the code PEM1 in Figure 34.
Thermal energy/power output from the solar thermal panels is calculated starting from meas-
urement of heat carrier fluid (water-glycol) flow rate (electromagnetic flow meter; accuracy:
±5%) and temperature (of flow and return), the latter one by means of PT100 probes (accura-
cy: ± 0.1 °C). Due to flexible use of solar thermal converted energy, this thermal output can
be diverted to the surface collector field (TEM2 in Figure 34) for ground regeneration, or to
the heat pump (TEM3) or to the buffer tank (TEM4).
Similarly to the solar thermal panel circuit, thermal energy/power extracted from the surface
collector field (TEM1 in Figure 34) is calculated starting from monitoring of flow rate and
temperature of flow and return. Flow rate is measured by means of an electromagnetic flow
meter (accuracy: ±5%) and temperatures with PT100 probes (accuracy: ± 0.1 °C).
Additional temperature and humidity measurements are also performed in several other loca-
tions of the plant for different purposes (e.g. control, energy conservation equation, in-depth
analysis of components). In general, temperature measurements in water or water-glycol heat
carrier fluids are carried out by means of PT100 class I probes, while J/T type thermocouples
(accuracy: ± 0.5 °C) are used to perform additional temperature measurements in air or on
surfaces. Relative humidity measurements are done through capacitive sensors with accuracy
± 3%.
Data acquisition and control system
Acquisition of signals from sensors and transducers is carried out by a National Instrument
system based on the CompactRIO platform. This is a modular structure, where controllers,
expansion chasses, input/output modules can be freely combined in order to suit the require-
ment of the measurement layout. One of the main advantages of this system is that future
expansion and modifications of the measurement system can be realized in a relatively easy
way.
The chosen starting configuration for the Living Laboratory includes one controller and two
expansion chassis. A total of 19 different input/output signal modules are installed, ranging
from current to voltage signals, from resistance to digital signals. Modbus communication
protocol is widely used to connect transducers and components with serial communication
features.
Signals sourcing for building equipment control are generated by data acquisition hardware.
Most common control signals are 0…10 V, digital signals (24 V logic) and Modbus serial
communication.
The integrated data acquisition system and control system is controlled by means of the Na-
tional Instrument LabVIEW programming code. This is a graphical programming environ-
ment specifically developed for sophisticated measurement and tests. User interfaces will be
developed to allow users controlling (some) of the features of the building. One of the main
advantages of this system is that the degree of control that is handed out to the users can be
relatively easily changed from one experiment to the other. Dedicated user interface will be
developed for each experiment in order to allow occupants to control only some of the fea-

60
tures of the building. A more comprehensive user interface handling the whole building com-
ponents is developed and is used by researchers to control the building when not occupied.
It is worth mentioning that, due to its configuration and particular features, such as centralized
management of the entire building equipment, including control of power lines, actuators,
artificial lighting, windows and shading system, the building can be completely operated
without users living in it, using schedules so that ideal occupancy can be also experimented.
7.3. Example of previous studies
7.3.1. Study 1: Making a home in Living Lab: the limitations and potentials associated
with living in a research laboratory.
The first qualitative experiment in Living Laboratory (Woods et al., 2016) took place from
September 2015 to April 2016, when six different resident groups comprising of two to four
people, lived in the Living Laboratory as if it were their home for a period twenty-five days
each. The resident groups were chosen because they are associated with three basic demo-
graphic categories; students under 30 who are already cohabiting, families with small children
and couples around the age of sixty. During the resident periods, the Living laboratory func-
tioned as a home outside their actual homes for each of the six groups. The insight gathered in
Living Laboratory provided an understanding of how a concept of home is established within
a highly technical setting, and the implications this has for the use of the technology being
tested in Living Laboratory.
7.3.2. Study 2: Daylighting availability in a living laboratory single family house and
implication on electric lighting energy demand
The aim of this study (Lobaccaro et al. 2017) was to analyse the correlation between natural
light availability and use of artificial light in a residential building located in the Nordic cli-
mate. Experimental data and numerical simulations were used to compare the use of artificial
light (and the correlated electric energy demand) against the daylighting availability, in Liv-
ing Laboratory, considering the six groups of resident involved in the experiment previously
described. During the building occupation by the 6 different groups of people, electrical ener-
gy use for artificial lighting was continuously recorded, together with outdoor environment
conditions (irradiance and illuminance on the horizontal plan). Through advanced daylighting
simulations carried out with DIVA-for-Rhino, the availability of daylight (illuminance level)
during the periods of occupancy has been reconstructed, using as input data the outdoor envi-
ronmental variable recorded during the experimental analysis. The results, based on the anal-
ysis of the outcomes of five groups, show that the coefficient of correlation between daylight
availability and energy saving (measured thorough the artificial light energy demand) is low,
and it appears that the use of artificial lighting is little dependent on the availability of natural
light.
7.3.3. Study 3: Energy performance assessment of a semi-integrated PV system in a
zero emission building through periodic linear regression method
The aim of this study (Goia and Gustavsen, 2017) was to assess the performance of the pho-
tovoltaic (PV) system installed on the Living Laboratory.The building has a semi-integrated
PV plant installed over two slopes of the building’s roofs. The total installed power (DC) is
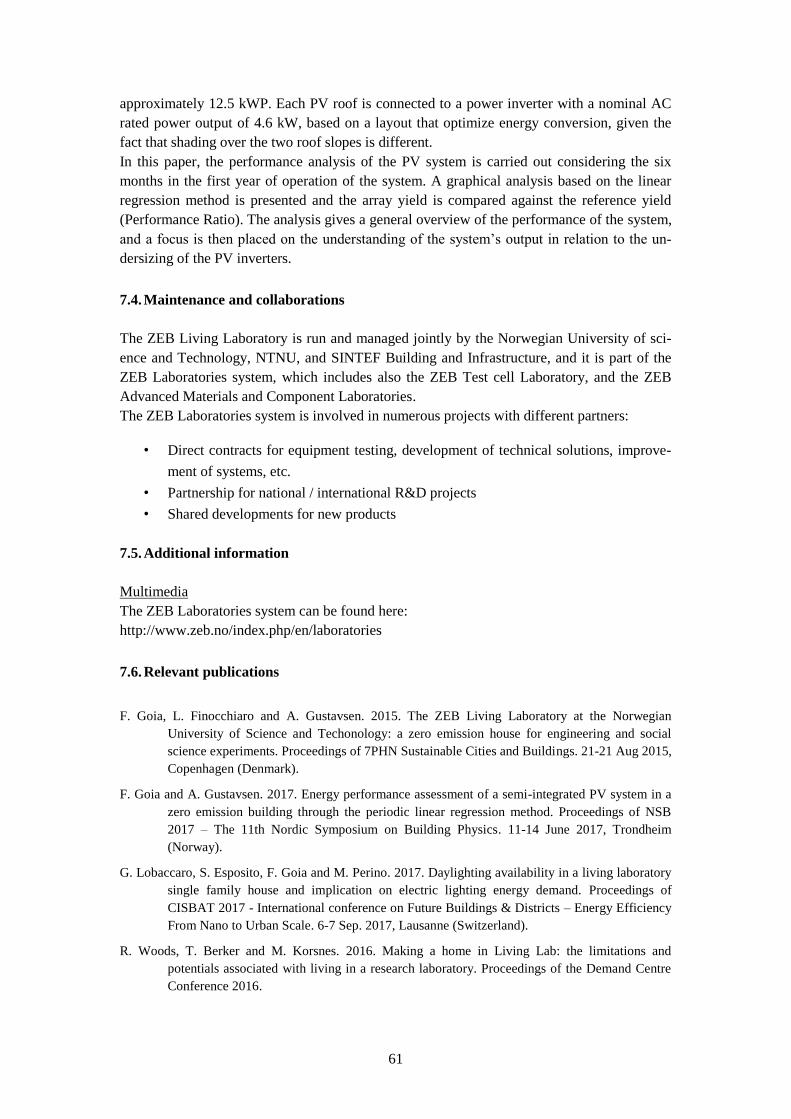
61
approximately 12.5 kWP. Each PV roof is connected to a power inverter with a nominal AC
rated power output of 4.6 kW, based on a layout that optimize energy conversion, given the
fact that shading over the two roof slopes is different.
In this paper, the performance analysis of the PV system is carried out considering the six
months in the first year of operation of the system. A graphical analysis based on the linear
regression method is presented and the array yield is compared against the reference yield
(Performance Ratio). The analysis gives a general overview of the performance of the system,
and a focus is then placed on the understanding of the system’s output in relation to the un-
dersizing of the PV inverters.
7.4. Maintenance and collaborations
The ZEB Living Laboratory is run and managed jointly by the Norwegian University of sci-
ence and Technology, NTNU, and SINTEF Building and Infrastructure, and it is part of the
ZEB Laboratories system, which includes also the ZEB Test cell Laboratory, and the ZEB
Advanced Materials and Component Laboratories.
The ZEB Laboratories system is involved in numerous projects with different partners:
• Direct contracts for equipment testing, development of technical solutions, improve-
ment of systems, etc.
• Partnership for national / international R&D projects
• Shared developments for new products
7.5. Additional information
Multimedia
The ZEB Laboratories system can be found here:
http://www.zeb.no/index.php/en/laboratories
7.6. Relevant publications
F. Goia, L. Finocchiaro and A. Gustavsen. 2015. The ZEB Living Laboratory at the Norwegian
University of Science and Techonology: a zero emission house for engineering and social
science experiments. Proceedings of 7PHN Sustainable Cities and Buildings. 21-21 Aug 2015,
Copenhagen (Denmark).
F. Goia and A. Gustavsen. 2017. Energy performance assessment of a semi-integrated PV system in a
zero emission building through the periodic linear regression method. Proceedings of NSB
2017 – The 11th Nordic Symposium on Building Physics. 11-14 June 2017, Trondheim
(Norway).
G. Lobaccaro, S. Esposito, F. Goia and M. Perino. 2017. Daylighting availability in a living laboratory
single family house and implication on electric lighting energy demand. Proceedings of
CISBAT 2017 - International conference on Future Buildings & Districts – Energy Efficiency
From Nano to Urban Scale. 6-7 Sep. 2017, Lausanne (Switzerland).
R. Woods, T. Berker and M. Korsnes. 2016. Making a home in Living Lab: the limitations and
potentials associated with living in a research laboratory. Proceedings of the Demand Centre
Conference 2016.

62
8. Semi-virtual Laboratory – Polytechnique Montréal
Institution / Department
Polytechnique Montréal
Department of Mechanical Engineering
Building Energy Efficiency (BEE) Research Group
Location of the test facility
Campus de l'Université de Montréal
2900, boul. Édouard-Montpetit
2500, chemin de Polytechnique
Montréal QC H3T 1J4
Canada
Contact
Michaël Kummert
Tel. +1 514 340 4711

63
8.1. General presentation
The Semi-Virtual Laboratory at Polytechnique Montréal allows to test hydronic (water-side)
heating and cooling equipment in highly dynamic conditions. Active (e.g. heat pumps) and
passive (e.g. storage tanks) equipment can be tested thanks to auxiliary loops capable of pro-
ducing and rejecting up to 100 kW of heat simultaneously. A key feature of the Semi-Virtual
Lab is to perform Hardware-In-the-Loop testing, where HVAC equipment is tested in realistic
operating conditions provided by a full system dynamic simulation with the TRNSYS pro-
gram. The 2-way data exchange between LabVIEW and TRNSYS is performed at every time
step through shared variables, allowing direct feedback from the experimental performance
on the simulation results and vice-versa.
The objective of the Semi-Virtual Lab is to develop and validate detailed dynamic models of
HVAC equipment including detailed controls, and to test new prototypes or existing equip-
ment in realistic dynamic conditions to improve their design and standard testing methods.
8.2. Description of the test facility
The concept of semi-virtual testing for a water-to-water heat pump is represented in Figure
35.
Figure 35. Semi-virtual testing at Polytechnique Montréal.
TRNSYS simulations predict system performance, calculating the flowrates and temperatures
of the fluid streams entering HVAC equipment under test, which are used as actuator control
signals in the Laboratory. The equipment’s response to these operating conditions is sensed in
the laboratory and imposed back on the building simulation.
Dynamic operating conditions are imposed on the tested equipment (e.g. a heat pump, as in
the figure) based on a full system simulation. Measured outlet conditions (in this case temper-
ature and flowrate on the source and load sides) at a given time step are sent to the simulation,
which then calculates the inlet conditions for the next time step.
LabView
Hydronic test bench Virtual environment

64
Testing possibilities
The flexibility of the Semi-Virtual Laboratory allows to perform different types of experi-
mental tests:
• Standard tests imposing predefined (possibly highly dynamic) inlet conditions on
HVAC equipment to assess its performance and to develop or validate numerical
simulation models.
• Semi-Virtual tests where HVAC equipment is integrated within a full system simula-
tion, therefore testing the equipment as if it was in a real system. This allows as-
sessing the equipment performance in these conditions, and developing or validating
models adapted to them.
• Semi-virtual tests also allow testing the response of the equipment’s embedded con-
trols to realistic operating conditions, therefore allowing to understand and model
these controls realistically. This is especially important for recently introduced varia-
ble capacity devices (e.g. variable speed heat pumps, and Variable Refrigerant Flow
devices) which often include proprietary and undocumented control strategies for
which developing accurate models is a challenging task.
• Detailed testing and performance assessment for prototypes, in order to develop them
and improve their performance for realistic operating conditions in addition to prede-
fined standard tests.
• Assessment of the difference between the seasonal or yearly performance extrapolat-
ed from standard steady-state tests and the seasonal or yearly performance obtained
from models validated in highly dynamic, realistic operating conditions. These stud-
ies can also inform standard certification bodies and help them develop new, more
accurate standards methods of testing.
8.2.1. Equipment specifications
The 4 hydronic loops of the laboratory are shown in Figure 36. Two auxiliary loops (blue and
red) can produce water at temperatures between -10 °C (with glycol solution) and +85 °C.
Although the two loops are both connected to the heat production and heat rejection devices,
for the sake of this explanation the blue loop will be considered as the cold loop and the red
loop will be considered as the warm loop. These auxiliary loops are hydraulically isolated
from the test loops (yellow and green) by plate heat exchangers equipped with 3-way valves.
These heat exchangers and their control valves are used to impose the desired inlet conditions
(optionally calculated from the full system TRNSYS simulation) on the tested equipment.

65
Figure 36. Hydronic loops of the Semi-Virtual Laboratory.
The hydronic loops piping has a diameter of 2.5” (62.5 mm) to allow relatively large
flowrates, and adapters (with specific flowmeters) are available to reduce the test loops to a
diameter better suited to smaller equipment (e.g. residential heat pumps). Operating tempera-
ture limits are between -10 °C and +85 °C depending on the fluid (up to 30 % glycol) and the
equipment used.
The nomenclature in Figure 36 uses the first digit to represent the hydronic loop: “0” and “1”
to denote the auxiliary loops, “2” and “3” to denote the testing loops. CV001 for example
would be the first control valve (“01”) in the “cold” auxiliary loop (“0”).
The main components are described below:
• CVnnn: 3-way valves, centrally controlled. CV103 is a special constant-pressure con-
trol valve located in the university chilled water network, allowing to obtain a con-
stant flowrate independently of the chilled water loop operation.

66
• EB: electric boiler (54 kW thermal, compatible with up to 30 % glycol)
• HxEPM: heat exchanger with the university (École Polytechnique de Montréal)
chilled water network. The heat exchanger capacity is sized to reject 100 kW with a
Δ𝑇 of 7 °C
• BT0 and BT1: storage tanks (974 L each)
• Hx01: heat exchanger between the two auxiliary loops (“0” and “1”). Standard tests
imposing predefined (but possibly highly dynamic) inlet conditions on HVAC
equipment to assess its performance and to develop or validate numerical simulation
models. It is sized to exchange 100 kW with a Δ𝑇 of 4.5 °C.
• HP: variable capacity water-to-water heat pump (can be used as part of the auxiliary
loops, or as the tested equipment). Operating limits: -10 °C on the evaporator side
(with glycol), 55 °C on the condenser side (note that when bypassing the heat pump,
the electric boiler can heat the auxiliary loops up to 85 °C).
• P0 and P1: Variable speed pumps for the auxiliary loops. The design maximum
flowrate in the loops is 4.7 L/s (75 GPM). The actual maximum flowrate depends on
operating conditions because of pressure limits (e.g. with the “HP” heat pump in ser-
vice, the maximum flowrate is about 3.8 L/s (60 GPM).
• Hx02 and Hx13: heat exchangers between the auxiliary loops and the test loops.
These exchangers are designed to transfer 100 kW with a Δ𝑇 of 3 °C.
• P2 and P3: Variable speed pumps for the test loops. The design maximum flowrate in
the loops (depending on the configuration because of minimum and maximum pres-
sure limits) is 4.7 L/s (75 GPM).
8.2.2. Sensors, data acquisition and control
The laboratory is equipped with high accuracy temperature sensors and flowmeters, as well as
power transducers:
• Pt 100 with 1/10 DIN accuracy in the test loop and Pt100 with 1/3 DIN accuracy in
the auxiliary loops. In addition, various thermopiles can be fitted to the test loops to
measure temperature difference with a very high accuracy.
• Flowmeters with traceable calibration reports with an accuracy better than 1 % of
reading in their full operating range. Standard range is 1 L/s to 11 L/s (15 to 180
GPM), optional smaller flowmeters for test loops have a range of 0.06 L/s to 0.6 L/s
(1 to 10 GPM).
• Power transducers with an accuracy (for voltage, current and power) better than
0.5 % of full scale are available in 1-phase and 3-phase, for 120 V to 600 V and rated
current between 5 A and 100 A. These transducers output voltage, current, VA, RMS
power and power factor.
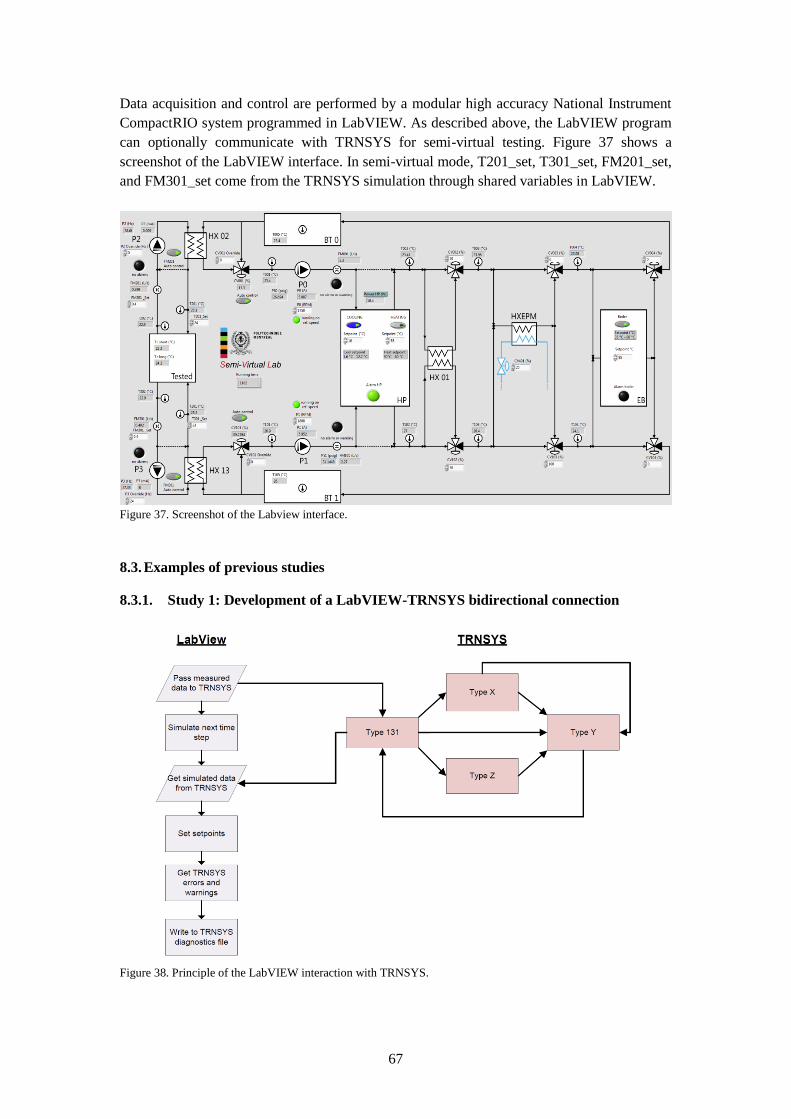
67
Data acquisition and control are performed by a modular high accuracy National Instrument
CompactRIO system programmed in LabVIEW. As described above, the LabVIEW program
can optionally communicate with TRNSYS for semi-virtual testing. Figure 37 shows a
screenshot of the LabVIEW interface. In semi-virtual mode, T201_set, T301_set, FM201_set,
and FM301_set come from the TRNSYS simulation through shared variables in LabVIEW.
Figure 37. Screenshot of the Labview interface.
8.3. Examples of previous studies
8.3.1. Study 1: Development of a LabVIEW-TRNSYS bidirectional connection
Figure 38. Principle of the LabVIEW interaction with TRNSYS.

68
In this project (Macdonald et al., 2014), a novel communication methodology was developed
to allow rapid data exchange between the Data Acquisition software LabVIEW and the ener-
gy simulation program TRNSYS. The developed method uses data exchange through shared
variables between the TRNSYS DLL and the LabVIEW executable, and does not require
writing or reading data files. A procedure to properly initialize the simulation and the labora-
tory equipment was also developed and implemented. Changes to the TRNSYS code source
are encapsulated in a newly developed component, named Type 131. The principle of the
communication between the two programs is described in Figure 38.
8.3.2. Study 2: Experimental Study of a Phase-Change Material storage tank
Figure 39. PCM tank viewed from the inlet, including
1) perforated plate, 2) capsule support and 3) PCM
capsules.
Figure 40. Position of the instrumented PCM capsule in
the tank as viewed from the outlet.
Figure 41. Example of results for a test with a fixed
temperature change rate at the inlet of the tank.
Figure 42. Example of results for a cooling step test.
This project aimed at designing a storage tank with Phase-Change Materials (PCM) and to
test it in realistic operating conditions (D’Avignon and Kummert, 2013; D’Avignon and
Kummert, 2016). The first objective was to integrate the newly designed PCM tank into the
lab and adapt the data acquisition environment to allow its detailed monitoring. A first series
of tests was performed using predefined procedures, therefore without using the communica-

69
tion with TRNSYS. But the dynamic capabilities of the Semi-Virtual Laboratory were used to
impose changing conditions to the tank and fully validate its detailed model.
Figure 39 to Figure 42 show the PCM tanks and some examples of results (Tin and Tout are
the inlet and outlet temperatures of the tank, Tpcm,l and Tpcm,s are the PCM mass tempera-
ture at 2 different locations).
In a second step, the PCM tank was tested in a semi-virtual environment. A TRNSYS simula-
tion model was developed to represent a building with its heating system, and the PCM tank
was used to reduce the building peak demand and operating costs by shifting demand from
on-peak to off-peak periods.
Figure 43. PCM tank in a hydronic heating loop for semi-virtual testing.
More details on the study are available in D’avignon (2015) and Lessard (2016). The Semi-
Virtual environment allowed to further validate the developed model component in TRNSYS
and demonstrate the usefulness of the laboratory to assess the storage tank behaviour in realis-
tic operating conditions.
8.4. Maintenance and collaborations
The Semi-Virtual Laboratory at Polytechnique Montréal was funded through a partnership
with the Canada Foundation for Innovation (CFI), and is now run by the graduate students
and staff at Polytechnique Montréal. The CFI also provides a maintenance budget that can
help adapting the laboratory to the different requirements of new research projects. The PCM
tank is currently being replaced by water-to-water heat pumps (commercially available mod-
els and in-house developed prototypes). Projects can be performed in partnership with other
research institutions, manufacturers, utilities, or government agencies interested in developing
standard testing procedures.
8.5. Additional information
Research team website:
http://www.polymtl.ca

70
8.6. Relevant publications
K. D’Avignon and M. Kummert. 2013. ‘Comparison of system-level simulation and detailed models
For storage tanks with phase change materials’, in Proceedings of Building Simulation
2013:13th Conference of International Building Performance Simulation Association,
Chambéry, FRA, August 26-28, pp. 2940–2948.
K. D’Avignon and M. Kummert. 2016. ‘Experimental assessment of a phase change material storage
tank’, Applied Thermal Engineering, 99, pp. 880–891. doi:
10.1016/j.applthermaleng.2016.01.083.
K. D’Avignon. 2015. ‘Modeling and experimental validation of the performance of phase change
material storage tanks in buildings’. PhD thesis, Montréal, QC, CAN: Polytechnique
Montréal, Dept. of Mechanical Engineering.
D. Lessard. 2016. ‘Essais du Laboratoire Semi-Virtuel d’Équipements CVAC’. MEng thesis, Montréal,
QC, CAN: Polytechnique Montréal, Dept. of Mechanical Engineering.
F. Macdonald, K. D’Avignon, M. Kummert and A. Daoud. 2014. ‘A TRNSYS-LabVIEW bi-
directional connection for HVAC equipment testing using hardware-in-the-loop simulation’,
in Proceedings of SSB 2014: the 9th International Conference on System Simulation in
Buildings, Dec 10-12. Liège, BEL, p. P65.1-P65.15.