laboratory experiments experiment no 2 density and specific weight estimation...
TRANSCRIPT

Laboratory experiments
Experiment no 2 – Density and specific weight estimation for
the liquids and solid materials.
1. Theory Density is a physical property shared by all forms of matter (solids, liquids, and gases).
In this lab investigation, we are mainly concerned with determining the density of solid objects; both regular-shaped and irregular-shaped. In general regular-shaped solid objects are those that have straight sides that can be measured using a metric ruler. These shapes include but are not limited to cubes and rectangular prisms. In general, irregular-shaped solid objects are those that do not have straight sides that cannot be measured with a metric ruler or slide caliper. The density of a material is defined as its mass per unit volume. The symbol of density is ρ (the Greek letter rho).
3m
kg
V
m (1)
The specific weight (also known as the unit weight) is the weight per unit volume of a material. The symbol of specific weight is γ (the Greek letter Gamma).
3m
N
V
W (2)
On the surface of the Earth, the weight W of an object is related to its mass m by: W = m · g, (3)
where g is the acceleration due to the Earth's gravity, equal to about 9.81 ms-2. Using eq. 1, 2 and 3 we will obtain dependence between specific weight of the body and its density:
g (4) Apparatus:
Vernier caliper, balance with specific gravity platform (additional table in our case), 250 ml graduate beaker.
Unknowns:
a) Various solid samples (regular and irregular shaped)
b) Light liquid sample (alcohol-water mixture) or heavy liquid sample (salt-water mixture).
c) Distillated water.

2. Density and specific weight estimation for the regular shaped solid objects.
The simplest way how to estimate specific weight and density is to weigh and measure all dimensions in order to obtain volume of the solid. Then we can easily calculated density and specific weight according equations 1 and 2, respectively. Procedure: 1.) Measure the mass and volume (by measurement) of each regular-shaped object. Record these values in Table 1 of the Data & Results section of this lab to the nearest tenth. 2.) Calculate the density and specific weight of each object using the following mathematical formula: equation 1 and equation 3. Note: Record your values for density in Table 1 of this lab to the nearest tenth. TABLE 1. Density and specific weight estimation for the regular shaped solid objects
OBJECT
Mass
m
Dimensions of the solid
(according shape)
volume
V
density
Specific weight
[kg] Length
[m]
Width
[m]
Height
[m] [m3]
3m
kg
3m
N
3. Density and specific weight estimation for the irregular shaped solid objects.
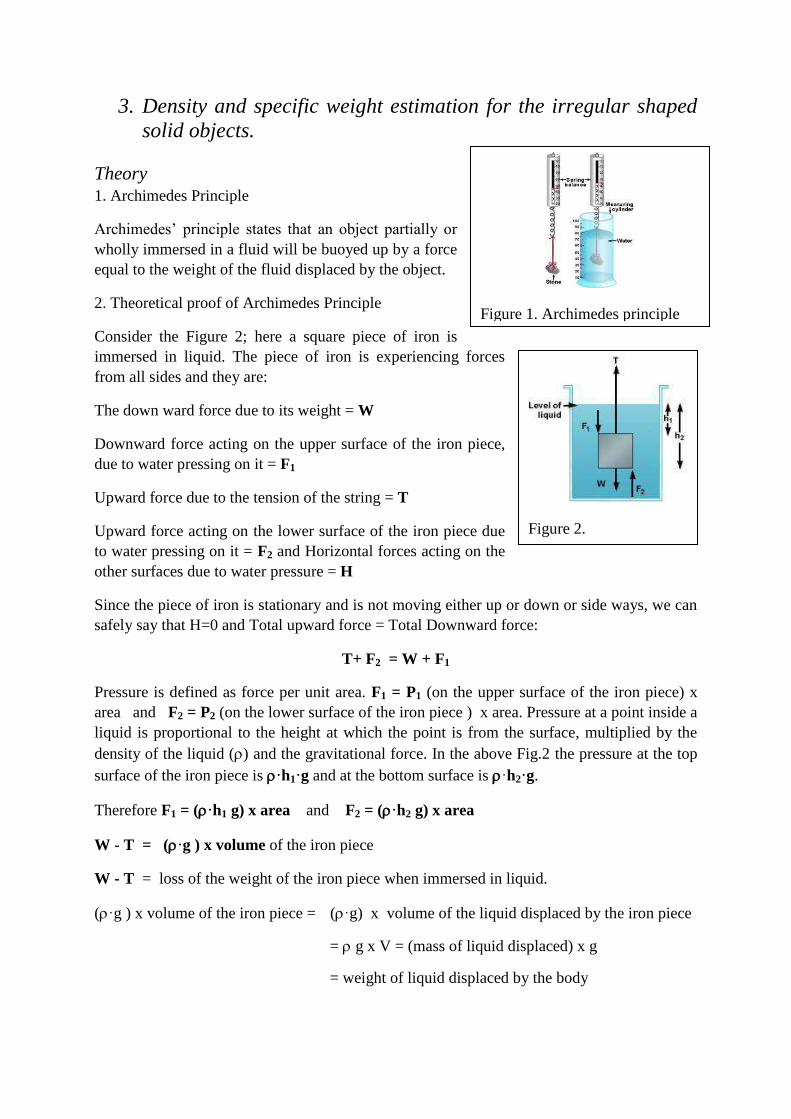
Theory 1. Archimedes Principle
Archimedes’ principle states that an object partially or wholly immersed in a fluid will be buoyed up by a force equal to the weight of the fluid displaced by the object.
2. Theoretical proof of Archimedes Principle
Consider the Figure 2; here a square piece of iron is immersed in liquid. The piece of iron is experiencing forces from all sides and they are:
The down ward force due to its weight = W
Downward force acting on the upper surface of the iron piece, due to water pressing on it = F1
Upward force due to the tension of the string = T
Upward force acting on the lower surface of the iron piece due to water pressing on it = F2 and Horizontal forces acting on the other surfaces due to water pressure = H
Since the piece of iron is stationary and is not moving either up or down or side ways, we can safely say that H=0 and Total upward force = Total Downward force:
T+ F2 = W + F1
Pressure is defined as force per unit area. F1 = P1 (on the upper surface of the iron piece) x area and F2 = P2 (on the lower surface of the iron piece ) x area. Pressure at a point inside a liquid is proportional to the height at which the point is from the surface, multiplied by the density of the liquid () and the gravitational force. In the above Fig.2 the pressure at the top surface of the iron piece is ·h1·g and at the bottom surface is ·h2·g.
Therefore F1 = (·h1 g) x area and F2 = (·h2 g) x area
W - T = (·g ) x volume of the iron piece
W - T = loss of the weight of the iron piece when immersed in liquid.
(·g ) x volume of the iron piece = (·g) x volume of the liquid displaced by the iron piece
= g x V = (mass of liquid displaced) x g
= weight of liquid displaced by the body
Figure 1. Archimedes principle
Figure 2.
Hence we can conclude that the loss of weight of a body in a liquid is equal to the weight of the liquid displace by the body.
The Archimedes principle holds good for irregular as well as regular bodies and any liquids.
The upward force experienced by the immersed body is also known as upthrust or buoyancy.
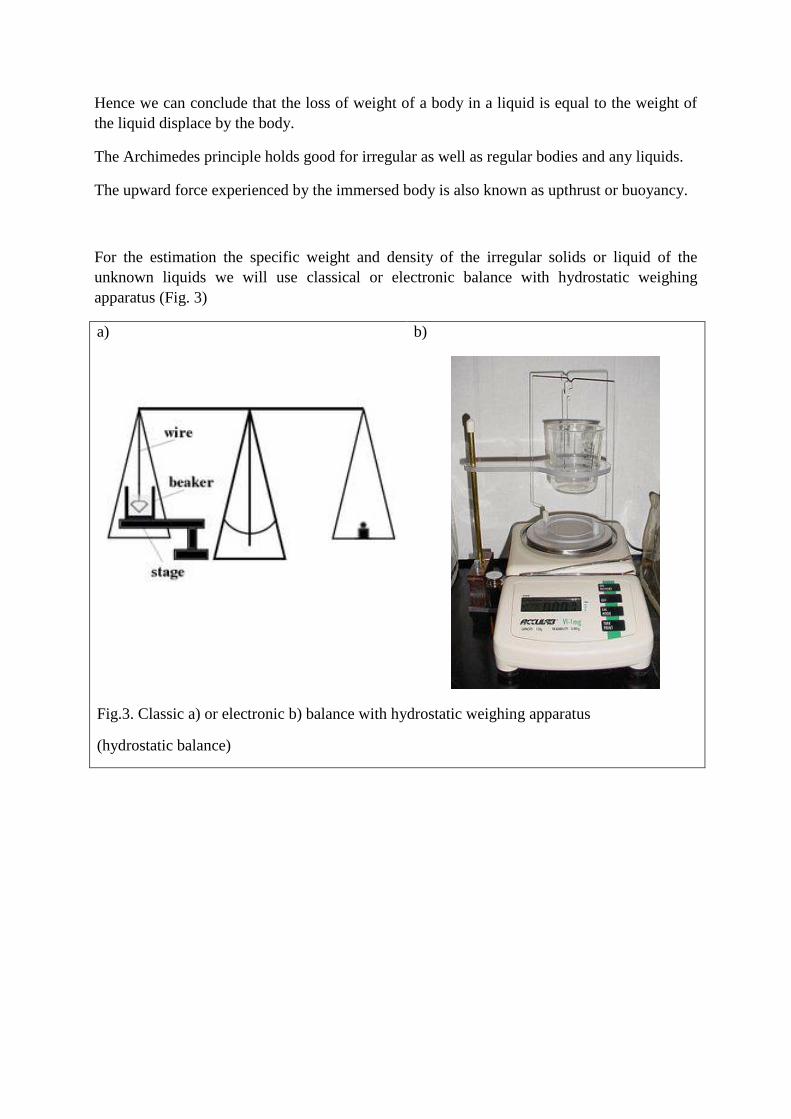
For the estimation the specific weight and density of the irregular solids or liquid of the unknown liquids we will use classical or electronic balance with hydrostatic weighing apparatus (Fig. 3)
a)
b)
Fig.3. Classic a) or electronic b) balance with hydrostatic weighing apparatus
(hydrostatic balance)

In order to perform measurements first we have to hang irregular solid on the hook which is on he left arm in the case of the classic balance or just on the hook which is part of the weighting apparatus in the case of the electronic balance. We will read out weight of all solids suspended in air (W1). When all solids are weighted in air then we have to place baker filled up with liquid on the special stage and we will read out weights of all solids once again; weights in water first (W2) then in unknown liquid (W3). (Figure. 4).
First consider an object suspended at rest by a string in air as shown in figure 5(a), the tension in the string, T, is equal to the weight of the object, W. Consider, then a submerged object, suspended by a string, as shown in Figure 5 (b) If T is the tension in the string, W is the weight of the object (equals m ·g) and FB is the buoyant force on the object, then in equilibrium, T = W - FB
T is commonly (though incorrectly) called the “weight of the object when submerged”, since it is the downward pull of the string on the balance.
In this experiment the measurements made using the force sensor are in Newton’s. The weight, W, of the object is first made when the object is freely suspended in air as shown in Figure 5(a). Later when the object is submersed into the liquid the measurement will represent the tension in the string, T. The difference between these two measurements results in the buoyant force supplied by the liquid, FB. From equations 1-4 the weight of the object is
W = ·g·V, (5) Thus, according to Archimedes’ principle, the buoyant force, FB, on an object submerged in a liquid
FB = weight of liquid displaced = L· g ·V, (6) Then we have for the solids suspended in air W1 = S·g·V, (7) for the solids suspended in water W2 = W1 - FBW = W1 - W· g ·V (8) for the solids suspended in liquid W3 = W1 - FBL = W1 - L· g ·V (9) Consider that the volume of the water displaced is equal to the volume of the submersed object. By examining equations (6), (7) and (8) we will obtain that the volume V is equal:
g
WW
g
FV
WW
B
21 ; (10)
where W is a density of water.
Figure .4.
Figure 5.

According equation (3) we can express W1 and W2 as:
W1 = mS·g, and W2 = mW· g;
where mS – is the mass obtained for the solid weighted in air and mW is a mass obtained for the solid weighted in water. Then substituting them into equation (10) we will obtain that:
W
WS mmV
(11)
By substituting eq.11 into eq.1 we will obtain equation for the density of the irregular solid:
WWS
SS mm
m
(12)
By using hydrostatic balance we can also estimate density and specific weight of any liquid in the assumption that we have foe example water, which density is known. In order to obtain required data we have to just weight our solid in this unknown liquid. As it was mentioned above (eq. 9) we will obtain:
W3 = W1 - FBL = W1 - L· g ·V; Where W3 is a resultant of the weight of the object (W1 = mS ·g) and FBL is the buoyant force on the object in the unknown liquid. The buoyant force in the unknown liquid according eq. 9 is equal FBL = L· g ·V = mL·V, when L is a density of the unknown liquid, and mL is a mass of the solid weighted in unknown liquid:
V
mm
gV
WW LSL
31 (13)
Substituting eq. (11) into eq. (13) we will obtain that density of the unknown liquid can be calculated according below equation:
WWS
LSL mm
mm
(14)
Procedure: 1) Measure masses in the air (mS) (by using balance without special stage !!! ) of each
irregular-shaped object. . In order to perform measurements first we have to hang irregular solid on the hook which is on he left arm in the case of the classic balance or just on the hook which is part of the weighting apparatus in the case of the electronic balance. Record these values in Table 2 of the Data & Results section of this lab to the nearest tenth.
2) Measure masses in the water (mW) of each irregular-shaped object When all solids are weighted in air then we have to place baker filled up with liquid on the special stage and we will read out weights of all solids once again; masses in water first (mW) then in unknown liquid (mL) Record these values in Table 2 of the Data & Results section of this lab to the nearest tenth.
3) Calculate the density (S) and specific weight (S) of each solid using equation (12) and the density (L) and specific weight (L )of the unknown liquid by using equation (14).
Note: Record your values in Table 2 of this lab to the nearest tenth.

TABLE 2. Density and specific weight estimation for the irregular shaped solid objects and unknown liquid.
OBJECT
mass in the
air
mS
mass in the water
mW
mass in the
unknown liquid
mL
Density of the water
W
Density of the solid
S
Specific weight of the solid
S
Density of the
unknown liquid
L
Specific weight of the
unknown liquid L
[kg]
[kg]
[kg]
3m
kg
3m
kg
3m
N
3m
kg
3m
N
1x10³
1x10³
1x10³

Parts of a vernier caliper: 1. Outside jaws: used to measure external diameter or width of an object 2. Inside jaws: used to measure internal diameter of an object 3. Depth probe: used to measure depths of an object or a hole 4. Main scale: gives measurements of up to one decimal place(in cm). 5. Main scale: gives measurements in fraction(in inch) 6. Vernier gives measurements up to two decimal places(in cm) 7. Vernier gives measurements in fraction(in inch) 8. Retainer: used to block movable part to allow the easy transferring a measurement

Laboratory experimentsExperiment no 7
Investigations of the liquid �owthrough horizontal pipes
dr Janusz Mi±kiewicz
17 pa¹dziernika 2007
1 Experiment objectives• Qualitatively investigate Bernoulli's equation.
• Observe the hydrodynamical paradox
• Observe that water do not ful�l ideal liquid requirements
2 TheoryThe following knowledge should be acquired:
• Ideal liquid properties
• Continuity equation
• Bernoullie's equation
• Parameters describing �uid state
• Pascal law
2.1 Fluid state parametersFluid is characterised by the following parameters: Density of the material ρ = m
V
(mass of the homogeneous material divided by volume) � usually we assume that theliquid is uniform so the density remain constant during the experiment.Pressure p = F
S� force value over the area of the surface on which the force is acting.
1

By the Pascal law we know that: Pressure applied to an enclosed �uid istransmitted undiminished to every portion of the �uid and the wall of thecontaining vessel. The hydrostatic pressure of the liquid can be calculated bythe equation: p = ρgh, where ρ, g, h are density, acceleration due to gravity, depthrespectively.
2.2 Ideal liquid• The �uid is incompressible; its density remain constant.
• The �uid do not have frictional e�ect � it is nonviscous.
• The �ow is streamline, not turbulent
• The velocity of the �uid does not change during the period of observation (steady-state assumption).
2.3 Continuity equationThe mass of a moving �uid does'n change as it �ows. If we assume that the density isconstant than the later statement can be reformulated as: the volume of a moving �uiddoes not change as it �ows. Additionally assuming that the �uid speed is constantthat we can write the continuity equation in the form:
S1v1 = S2v2
The product Sv is volume �ow rate. The above equation should be understood: letchoose any two surfaces perpendicular to the liquid �ow and denote them by number 1and 2. Than the product of the surface area and velocity of liquid should be the samefor all of the chosen surfaces. The important observation is if the tube is narrowingthe �uid velocity is growing.
2.4 Bernoulli's equationThe Bernoulli's equation can be derived from energy considerations. It say that thepressure plus the total mechanical energy per unit volume p + ρgh + 1
2ρv2,
is the same everywhere in a �ow tube.
3 The experimentIn this experiment we are using the tube with the part signi�cantly narrower than themain part of the tube. We measure the di�erence between the pressure p1 − p2 at thenarrow and standard part of the tube. The pressure di�erence is measured by mercurymanometer. The fraction of pipe's radius is r1
r2
= 0.1.During the experiment we measure the volume �ow rate and the di�erence between
pressure measured by manometer.
2
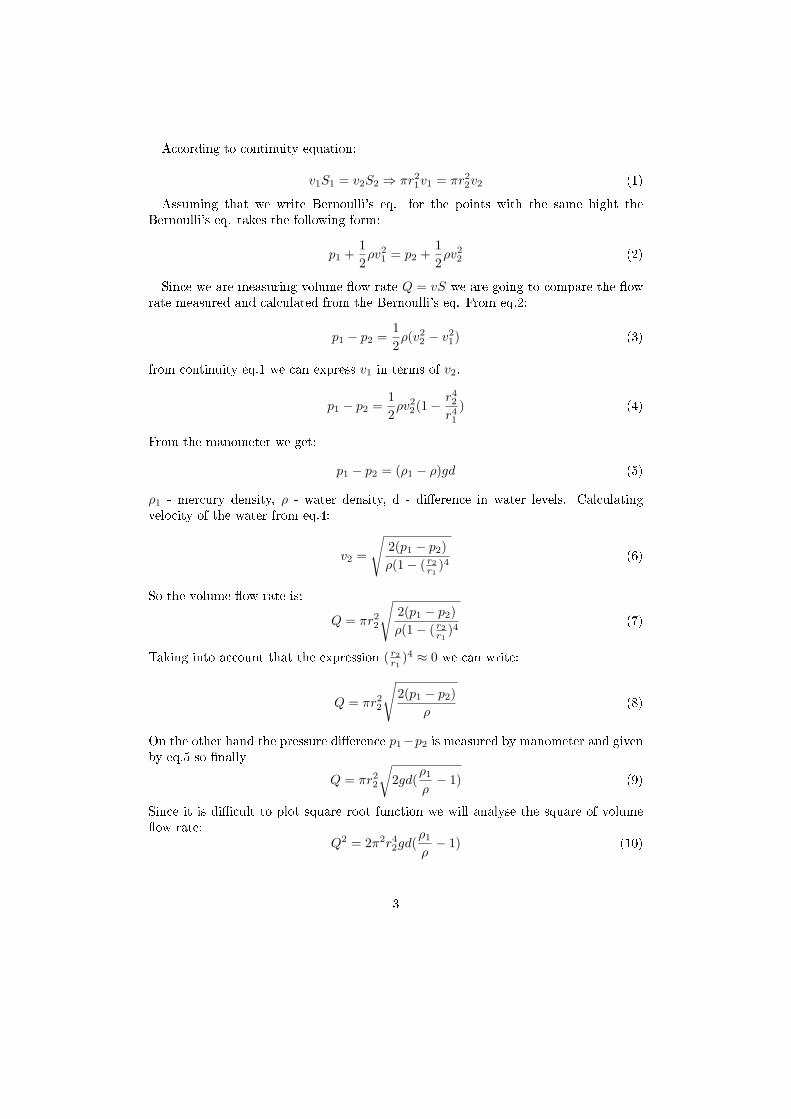
According to continuity equation:
v1S1 = v2S2 ⇒ πr2
1v1 = πr2
2v2 (1)
Assuming that we write Bernoulli's eq. for the points with the same hight theBernoulli's eq. takes the following form:
p1 +1
2ρv2
1= p2 +
1
2ρv2
2(2)
Since we are measuring volume �ow rate Q = vS we are going to compare the �owrate measured and calculated from the Bernoulli's eq. From eq.2:
p1 − p2 =1
2ρ(v2
2− v2
1) (3)
from continuity eq.1 we can express v1 in terms of v2.
p1 − p2 =1
2ρv2
2(1 −
r4
2
r4
1
) (4)
From the manometer we get:
p1 − p2 = (ρ1 − ρ)gd (5)
ρ1 - mercury density, ρ - water density, d - di�erence in water levels. Calculatingvelocity of the water from eq.4:
v2 =
√
2(p1 − p2)
ρ(1 − ( r2
r1
)4(6)
So the volume �ow rate is:
Q = πr2
2
√
2(p1 − p2)
ρ(1 − ( r2
r1
)4(7)
Taking into account that the expression ( r2
r1
)4 ≈ 0 we can write:
Q = πr2
2
√
2(p1 − p2)
ρ(8)
On the other hand the pressure di�erence p1−p2 is measured by manometer and givenby eq.5 so �nally
Q = πr2
2
√
2gd(ρ1
ρ− 1) (9)
Since it is di�cult to plot square root function we will analyse the square of volume�ow rate:
Q2 = 2π2r4
2gd(
ρ1
ρ− 1) (10)
3

d V t Qo Q v1 v2
m s m3 m3
sm3
sms
ms
let denote k = 2π2r4
2g(ρ1
ρ− 1) we get
Q2 = kd
We have received the linear dependence of the square of volume �ow rate as a functionof the di�erence mercury levels.
4 Data analysisResults should be expressed in the form of plot. On the same page we are plottingthe measured square of the volume �ow rate as a function of mercury level Q2
o(d) andsquare of the volume �ow rate calculated from equation 10.If the experiment was held properly we should be able to �t a stride line to the
�theoretical� and experimental data. The di�erence between these two lines should beincreasing with the pressure di�erence.The data of the experiment should be collected in the following table:Additionally the following parameters should be noted:
r1, r2, ρ, ρ1.
4

Laboratory experimentsExperiment no 10
Humidity measurementdr Janusz Mi±kiewicz
November 4, 2007
1 Experiment objectivesThe main target of the experiment is to measure air humidity. Observe andunderstand the relationship between air humidity and temperature.
2 TheoryHumidity is feature which describe the amount of water vapour in a sampleof air. Humidity can be described by the following parameters: absolutehumidity, relative humidity and maximum humidity. The de�nitions are asfollows:
Absolute humidity is the quantity of water in a particular volume of air.SI units are kilograms per cubic meter [ kg
m3 ]. In short density of watervapour.
Wb =mw
Va
Wb , mw , Va are absolute humidity, water mass, air volume respectively.It does not change with temperature except when the air cools belowdewpoint. However, absolute humidity changes as air pressure changes.
Maximum humidity is the maximum amount of water vapour the air canhold at any speci�c temperature. In short - the maximum density ofwater vapour which can the water hold at the given temperature.
Relative humidity is denoted as the ratio of the partial pressure of watervapour in a gaseous mixture of air and water vapour to the saturated
1
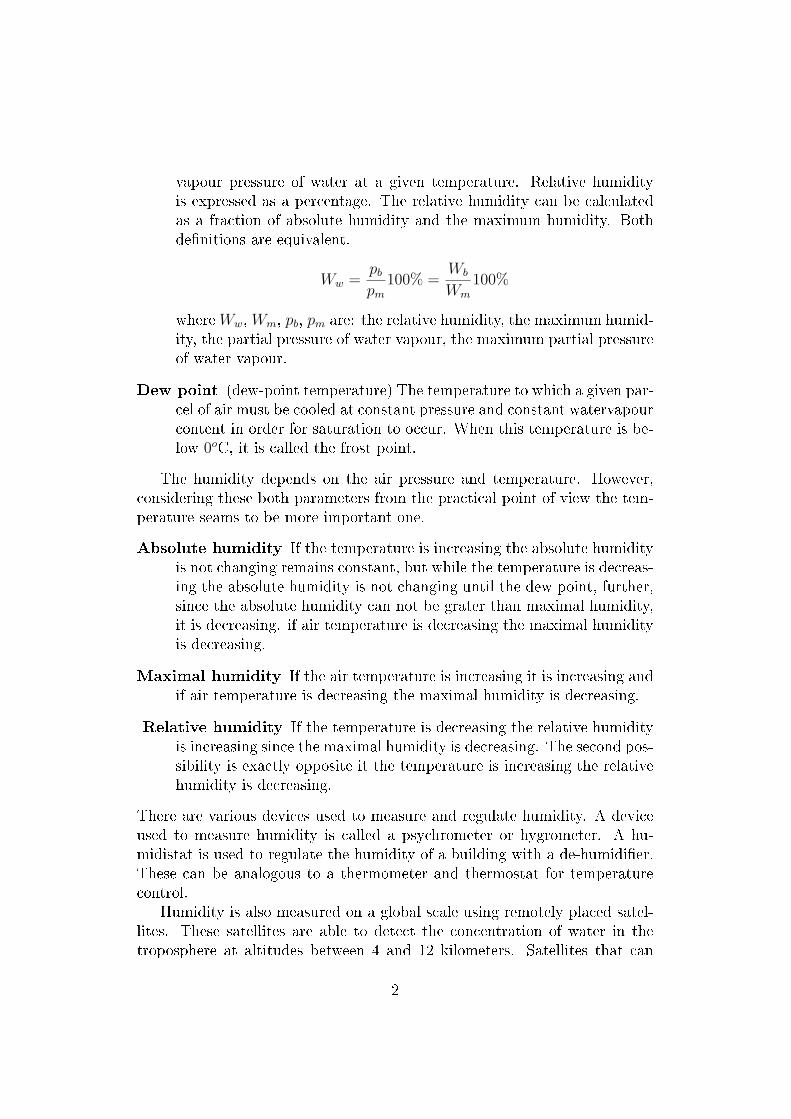
vapour pressure of water at a given temperature. Relative humidityis expressed as a percentage. The relative humidity can be calculatedas a fraction of absolute humidity and the maximum humidity. Bothde�nitions are equivalent.
Ww =pb
pm
100% =Wb
Wm
100%
where Ww, Wm, pb, pm are: the relative humidity, the maximum humid-ity, the partial pressure of water vapour, the maximum partial pressureof water vapour.
Dew point (dew-point temperature) The temperature to which a given par-cel of air must be cooled at constant pressure and constant watervapourcontent in order for saturation to occur. When this temperature is be-low 0oC, it is called the frost point.
The humidity depends on the air pressure and temperature. However,considering these both parameters from the practical point of view the tem-perature seams to be more important one.
Absolute humidity If the temperature is increasing the absolute humidityis not changing remains constant, but while the temperature is decreas-ing the absolute humidity is not changing until the dew point, further,since the absolute humidity can not be grater than maximal humidity,it is decreasing. if air temperature is decreasing the maximal humidityis decreasing.
Maximal humidity If the air temperature is increasing it is increasing andif air temperature is decreasing the maximal humidity is decreasing.
Relative humidity If the temperature is decreasing the relative humidityis increasing since the maximal humidity is decreasing. The second pos-sibility is exactly opposite it the temperature is increasing the relativehumidity is decreasing.
There are various devices used to measure and regulate humidity. A deviceused to measure humidity is called a psychrometer or hygrometer. A hu-midistat is used to regulate the humidity of a building with a de-humidi�er.These can be analogous to a thermometer and thermostat for temperaturecontrol.
Humidity is also measured on a global scale using remotely placed satel-lites. These satellites are able to detect the concentration of water in thetroposphere at altitudes between 4 and 12 kilometers. Satellites that can
2

measure water vapour have sensors that are sensitive to infrared radiation.Water vapour speci�cally absorbs and re-radiates radiation in this spectralband. Satellite water vapour imagery plays an important role in monitoringclimate conditions (like the formation of thunderstorms) and in the develop-ment of future weather forecasts.
In�uence on human body:The human body sheds heat by a combination of evaporation of perspira-tion, heat convection to the surrounding air, and thermal radiation. Underconditions of high humidity, the evaporation of sweat from the skin is de-creased and the body's e�orts to maintain an acceptable body temperaturemay be signi�cantly impaired. Also, if the atmosphere is as warm as orwarmer than the skin during times of high humidity, blood brought to thebody surface cannot shed heat by conduction to the air, and a conditioncalled hyperpyrexia results. With so much blood going to the external sur-face of the body, relatively less goes to the active muscles, the brain, andother internal organs. Physical strength declines and fatigue occurs soonerthan it would otherwise. Alertness and mental capacity also may be a�ected.This resulting condition is called heat stroke or hyperthermia.
3 ExperimentThe humidity will be measured by two methods:
• Dew point method
• Assman psychrometer
Both methods should not caused signi�cant di�culties. The dew pointsmethods is based on the dew point e�ect. If we cool the air the maximalhumidity is decreasing. We do not observe any e�ect until the momentwhen the absolute humidity become equal maximal humidity. Than furtherdecreasing of the temperature result in fog, which is observed on the mirror.Then we notice the temperature of the mirror and repeat experiment byheating the mirror. The measured temperature allows us to nd the maximalhumidity at the temperature of the dew point which is equal to the absolutehumidity. In order to calculate the remaining parameters we have to measurethe temperature of the air (from the second experimental set) and nd it inhumidity tables. In this experiment you are measuring temperature using thethermoelectric e�ect. In short thermoelectric e�ect, is the direct conversionof thermal di�erentials to electric voltage and vice versa. There is a linear
3
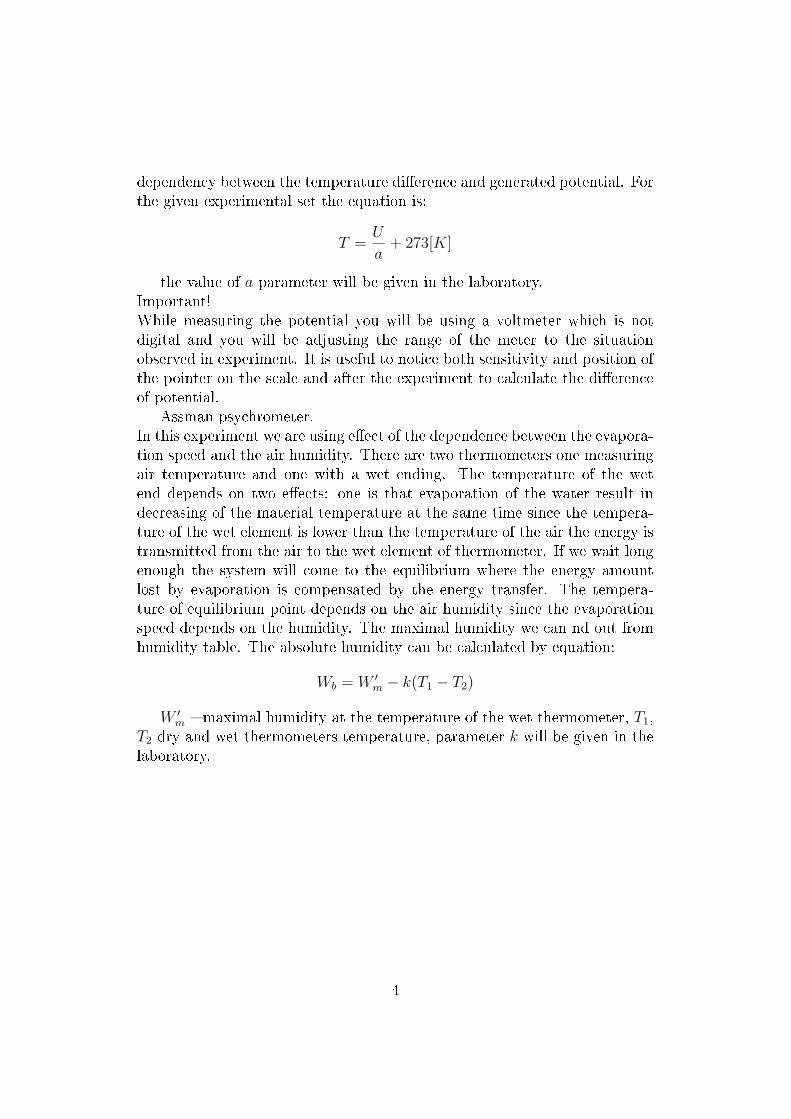
dependency between the temperature di�erence and generated potential. Forthe given experimental set the equation is:
T =U
a+ 273[K]
the value of a parameter will be given in the laboratory.Important!While measuring the potential you will be using a voltmeter which is notdigital and you will be adjusting the range of the meter to the situationobserved in experiment. It is useful to notice both sensitivity and position ofthe pointer on the scale and after the experiment to calculate the di�erenceof potential.
Assman psychrometer.In this experiment we are using e�ect of the dependence between the evapora-tion speed and the air humidity. There are two thermometers one measuringair temperature and one with a wet ending. The temperature of the wetend depends on two e�ects: one is that evaporation of the water result indecreasing of the material temperature at the same time since the tempera-ture of the wet element is lower than the temperature of the air the energy istransmitted from the air to the wet element of thermometer. If we wait longenough the system will come to the equilibrium where the energy amountlost by evaporation is compensated by the energy transfer. The tempera-ture of equilibrium point depends on the air humidity since the evaporationspeed depends on the humidity. The maximal humidity we can nd out fromhumidity table. The absolute humidity can be calculated by equation:
Wb = W ′
m − k(T1 − T2)
W ′
m � maximal humidity at the temperature of the wet thermometer, T1,T2 dry and wet thermometers temperature, parameter k will be given in thelaboratory.
4
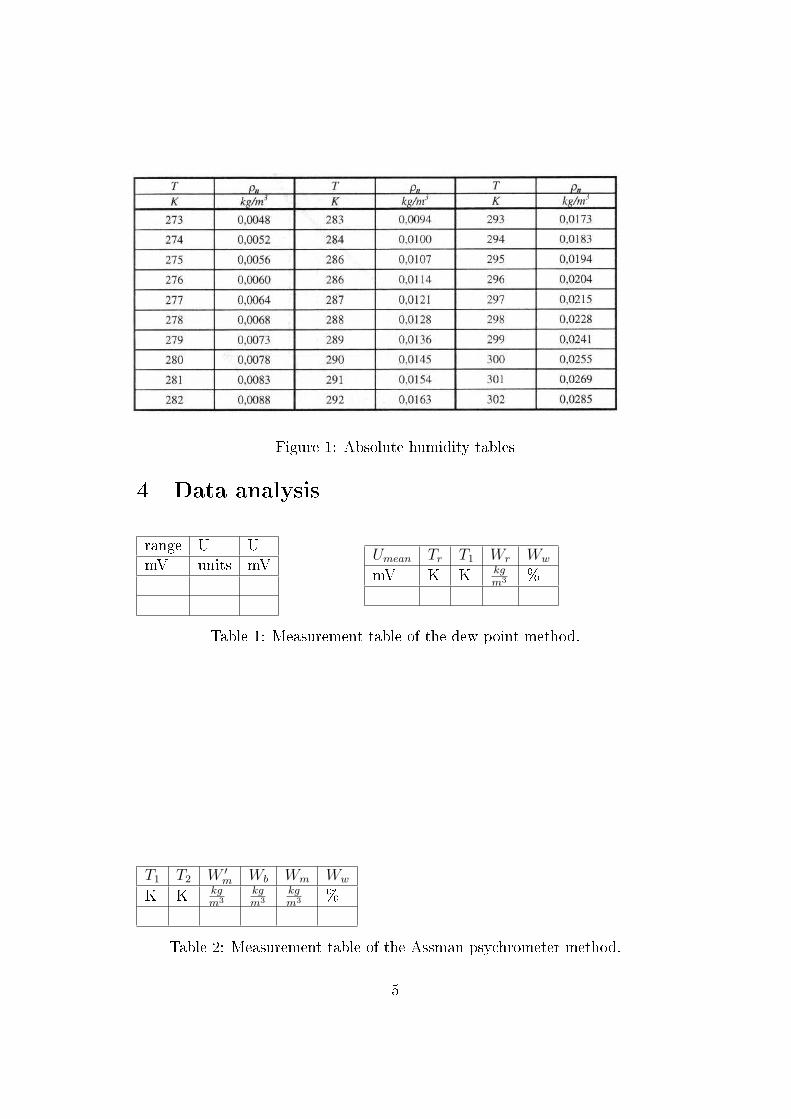
Figure 1: Absolute humidity tables
4 Data analysis
range U UmV units mV Umean Tr T1 Wr Ww
mV K K kg
m3 %
Table 1: Measurement table of the dew point method.
T1 T2 W ′
m Wb Wm Ww
K K kg
m3
kg
m3
kg
m3 %
Table 2: Measurement table of the Assman psychrometer method.
5

EXPERIMENT NR. 11
SUBJECT: Surface tension of a liquid.
INTRODUCTION TO SURFACE PHENOMENA
Why do some insects succeed in skating on water instead of sinking? Why in some cases, does the water sprinkled on a glass surface collect into drops and in other cases spread like a thin film? Why does water climb up a thin tube? Why can you make bubbles with soapy water and not with tap water? For reasons we will see later on, the surface of a substance has special properties. These surface properties are what allow these strange phenomena. Not only that, but the surface is also the place of contact among different substances. In short, the properties of surfaces are so special and important that there is a branch of science, the physics of
surfaces, devoted to the study of surface phenomena.
SURFACE TENSION
A molecule of a liquid attracts (cohesion) the molecules which surround it and in its turn it is attracted by them (Figure 1). For the molecules which are inside a liquid, the result of all these forces is neutral and all them are in equilibrium by reacting with each other. When these molecules are on the surface, they are attracted by the molecules below and by the lateral ones, but not toward the outside. The resultant is a force directed inside the liquid. In its turn, the cohesion among the molecules supplies a force tangential to the surface. So, a fluid surface behaves like an elastic membrane which wraps and compresses the below liquid. The surface tension expresses the force with which the surface molecules attract each other. A way to see the surface tension in action is to observe the efforts of a bug to climb out of the water. On the contrary, other insects, like the marsh treaders and the water striders, exploit the surface tension to skate on the water without sinking. It is also what causes the surface portion of liquid to be attracted to another surface, such as that of another portion of liquid (as in connecting bits of water or as in a drop of mercury that forms a cohesive ball).
Fig.1. Scheme of the attractive forces among the molecules of a liquid. The inner molecules of surface do not balanced upward and form this originates an inward compression. Besides, the cohesion among the molecules determinates a tension tangential to the surface. So surface of a fluid behaves like an elastic membrane.
Surface tension has the dimension of force per unit length (eq.1), or of energy per unit area (eq.2). The two are equivalent—but when referring to energy per unit of area, people use the term surface energy—which is a more general term in the sense that it applies also to solids and not just liquids.
(1)
(2)
Surface tension is responsible for the shape of liquid droplets. Although easily deformed, droplets of water tend to be pulled into a spherical shape by the cohesive forces of the surface layer. Another way to view it is that a molecule in contact with a neighbor is in a lower state of energy than if it was not in contact with a neighbor. The interior molecules all have as many neighbors as they can possibly have. But the boundary molecules have fewer neighbors than interior molecules and are therefore in a higher state of energy. For the liquid to minimize its energy state, it must minimize its number of boundary molecules and must therefore minimize its surface area.
Surface tension strongly depends of the kind of a liquid, it’s contamination and temperature. Higher the temperature lower the surface tension.
Notions connected with a surface tension phenomenon:
Cohesion (n. lat. cohaerere "stick or stay together") or cohesive attraction or cohesive force is a physical property of a substance, caused by the intermolecular attraction between like-molecules within a body or substance that acts to unite them.
Adhesion is the tendency of certain dissimilar molecules to cling together due to attractive forces. In contrast, cohesion takes place between similar molecules.
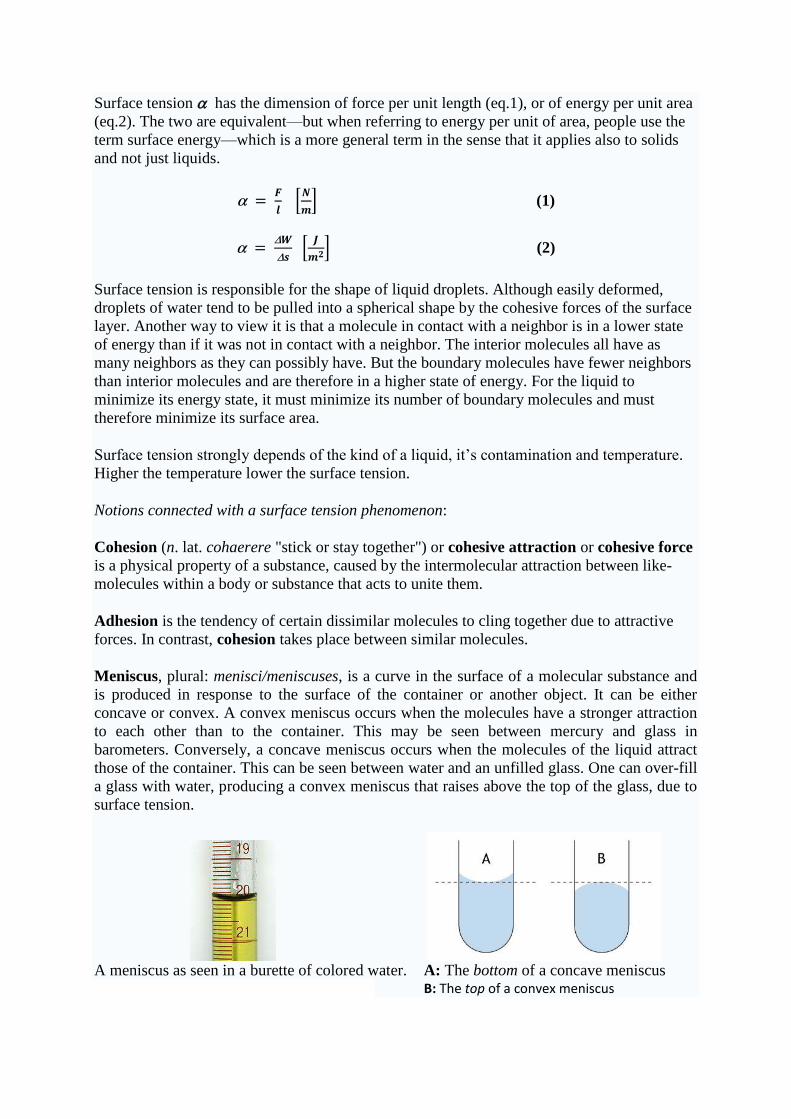
Meniscus, plural: menisci/meniscuses, is a curve in the surface of a molecular substance and is produced in response to the surface of the container or another object. It can be either concave or convex. A convex meniscus occurs when the molecules have a stronger attraction to each other than to the container. This may be seen between mercury and glass in barometers. Conversely, a concave meniscus occurs when the molecules of the liquid attract those of the container. This can be seen between water and an unfilled glass. One can over-fill a glass with water, producing a convex meniscus that raises above the top of the glass, due to surface tension.
A meniscus as seen in a burette of colored water. A: The bottom of a concave meniscus
B: The top of a convex meniscus

Capillary action or capillarity, refers to certain phenomena associated with the behavior of liquids in thin tubes or in porous materials. Liquids, such as water, will tend to move "up-hill" (against the force of gravity) which does not normally occur in large containers. Capillary action acts on concave menisci to pull the liquid up, increasing the amount of energetically favorable contact area between liquid and container, and on convex menisci to pull the liquid down, reducing the amount of contact area (Fig.2). This phenomenon is important in transpirational pull in plants. When a tube of a narrow bore, often called a capillary tube, is
dipped into a liquid and the liquid “wets” the tube (with zero contact angle ), the liquid surface inside the tube forms a concave meniscus, which is a virtually spherical surface
having the same radius, r, as the inside of the tube. The tube experiences a downward force of magnitude. When reading a scale on the side of a container filled with liquid, the meniscus must be taken into account in order to obtain a precise measurement. Capillary action occurs when the adhesion to the walls is stronger than the cohesive forces between the liquid molecules. The height to which capillary action will
take water in a uniform circular tube is limited by surface tension. Acting
around the circumference, the upward force is Fupword = 2r.
The height h to which capillary action will lift water depends upon the weight of water which the surface tension will lift:
(3)
The height to which the liquid can be lifted is given by:
(4)
After transformation eq.(4) surface tension is given by:
(5)
Fupword = 2r

Methods for the surface tension estimations
11.1. Detach method
This method is based on the Hooke’s law. Hooke's law of elasticity is an approximation that states that the extension of a spring is in direct proportion with the load added to it as long as this load does not exceed the elastic limit. Materials for which Hooke's law is a useful approximation are known as linear-elastic or "Hookean" materials. Hooke's law in simple terms says that strain is directly proportional to stress. Mathematically, Hooke's law states that
(5)
where
x - is the displacement of the end of the spring from its equilibrium position;
FR - is the restoring force exerted by the material; and k is the force constant (or spring constant) in SI units kg/s2
First a very light ring we will place on the surface of the water then we will detach this ring using the restoring force of the spring. The moment when ring will detached water surface refers to equality of two forces, the restoring force FR and the surface force F (Fig.3). Appying eq.1 we will obtain:
FR = F
kx = l
,
where x is an elongation of the spring when we observe detach of the ring. Because we will
measure several time this elongation x will change notation to laverage.
So the final equation from which we will calculate surface tension is given by:
(6)
Δlavg =l avg – l0 and r and R is the inner and outer radius of the ring.
FR
F

Manual of actions:
1. Check the position of the indicator of the spring scales l0, 2. Put the weight m on the scales’ plate and check the position lk of the indicator, 3. Calculate the spring constant k:
where Δlk =lk – l0
4. Remove the weight from the plate and put the container filled with water under the ring attached to the scales so the ring touches the water (but is not fully immersed).
5. Slowly move the container with water down until the ring detaches from the water. Put down the position l of the scales’ indicator exactly at the moment in which the ring was detaching.
6. The measurement described in the above point should be repeated at least five times. 7. Calculate average lavg of all measurements of the position l and having it calculate the
surface tension coefficient:
where Δlavg =lavg – l0 and r and R is the inner and outer radius of the ring (respectively), values of which are given in the table below
Table 11.1.
r R l0 lk Δlk m k l lavg Δlavg α m m m m m kg N/m m m m N/m
1.76 ·10-2
1.82· 10-2
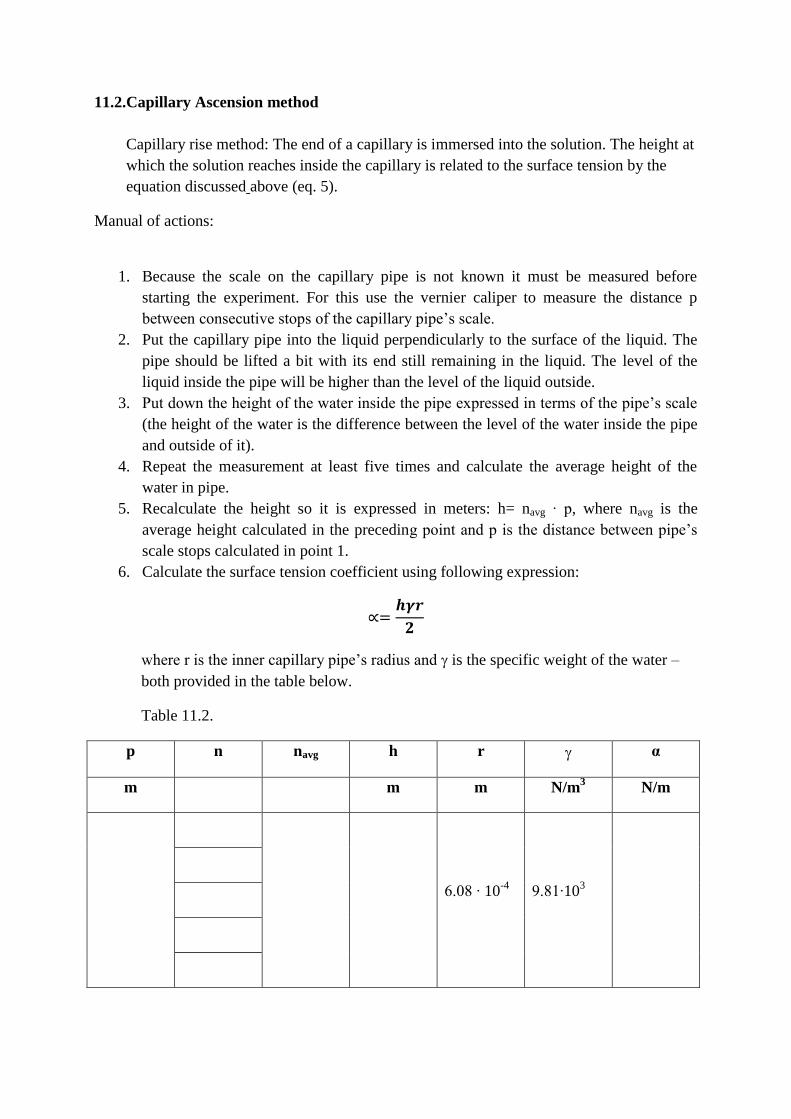
11.2.Capillary Ascension method Capillary rise method: The end of a capillary is immersed into the solution. The height at which the solution reaches inside the capillary is related to the surface tension by the equation discussed above (eq. 5).
Manual of actions:
1. Because the scale on the capillary pipe is not known it must be measured before
starting the experiment. For this use the vernier caliper to measure the distance p between consecutive stops of the capillary pipe’s scale.
2. Put the capillary pipe into the liquid perpendicularly to the surface of the liquid. The pipe should be lifted a bit with its end still remaining in the liquid. The level of the liquid inside the pipe will be higher than the level of the liquid outside.
3. Put down the height of the water inside the pipe expressed in terms of the pipe’s scale (the height of the water is the difference between the level of the water inside the pipe and outside of it).
4. Repeat the measurement at least five times and calculate the average height of the water in pipe.
5. Recalculate the height so it is expressed in meters: h= navg · p, where navg is the average height calculated in the preceding point and p is the distance between pipe’s scale stops calculated in point 1.
6. Calculate the surface tension coefficient using following expression:
where r is the inner capillary pipe’s radius and is the specific weight of the water – both provided in the table below.
Table 11.2.
p n navg h r α
m m m N/m3 N/m
6.08 · 10-4
9.81·103

NAME:
DATE:
SURNAME:
Hour of the classes
Experiment no 11 – REPORT
Surface tension of a liquid
11.1. Detach method
r R l0 lk Δlk m k l lavg Δlavg α m m m m m kg N/m m m m N/m
1.76 ·10-2
1.82· 10-2
Calculate average lavg of all measurements of the position l and having it calculate the surface tension coefficient:
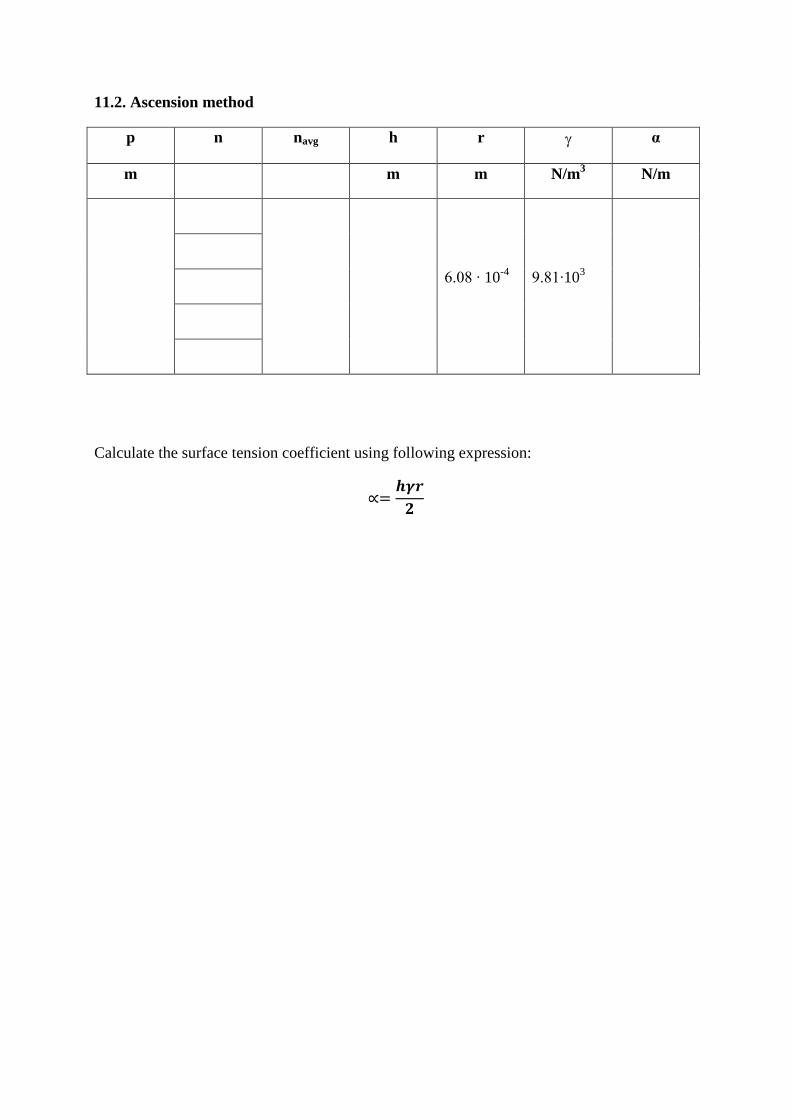
11.2. Ascension method
p n navg h r α
m m m N/m3 N/m
6.08 · 10-4
9.81·103
Calculate the surface tension coefficient using following expression:

Laboratory experimentsExperiment no 14
Viscositydr Janusz Mi±kiewicz
November 4, 2007
1 Experiment objectivesThe main target of the experiment is to measure viscosity of liquids.
2 TheoryViscosity is a friction caused by liquids. The viscosity force in a simple casecan be de�ned by Newton's law:
F = ηS∆v
∆y,
where η is the proportionality constant called viscosity, S is the surface areaof the plate, ∆v
∆y- gradient of the velocity calculated in the perpendicular
direction to the velocity of the moving surface S.The viscosity force depends on the object velocity (if the object is moving
faster the force is greater), the surface and the viscosity coe�cient η, whichdepends on the type of liquid, temperature, density.
2.1 Laminar �ow in tubeThe �rst method uses the dependency between viscosity force and the tubeparameters, which is described by the Poisseuille's equation:
V
t=
πr4∆p
8ηl(1)
1

Vt� �ow rate (volume per time),
r � radius of the tube (given in the laboratory),∆p � hydrostatic pressure,l � the tube length.
In this experiment the Mariot's bottle is used in order to provide theconstant liquid pressure during the experiment.
∆p = hρg
Substituting it to the eq.1 we get:
η =πr4hρ2gt
8lm
2.2 Movement in liquidThis method is based on the movement of a ball in a liquid. If we consideran object in a liquid than there are the �owing forces acting on this object:
• gravitation force G = mg = ρoV g
• buoyant force Fb = ρbV g
• viscosity force Fη = 6πηrv � in the case of a ball
ρo � density of an object, ρb � dencity of the liquid, V � volume of the ball,v � ball velocity.
The equation of motion from the II dynamic principle:
ma = ρoV g − ρbV g − 6πηrv (2)
from the de�nition of acceleration a = dvdt
we have:
mdv
dt= ρoV g − ρbV g − 6πηrv
the solution is:
v(t) = v0 exp(−6πηr
mt) +
V g
6πηr(ρo − ρb)
The velocity of the ball is decreasing until the constant movement.The same conclusion can be drown from the analysis of the eq.2. If
Fη +Fb < G, than the gravitation force is greater and the ball will accelerate,but if its speed will increase than the viscosity force will increase. The processwill continue until the system will be in equilibrium and the ball will be in
2
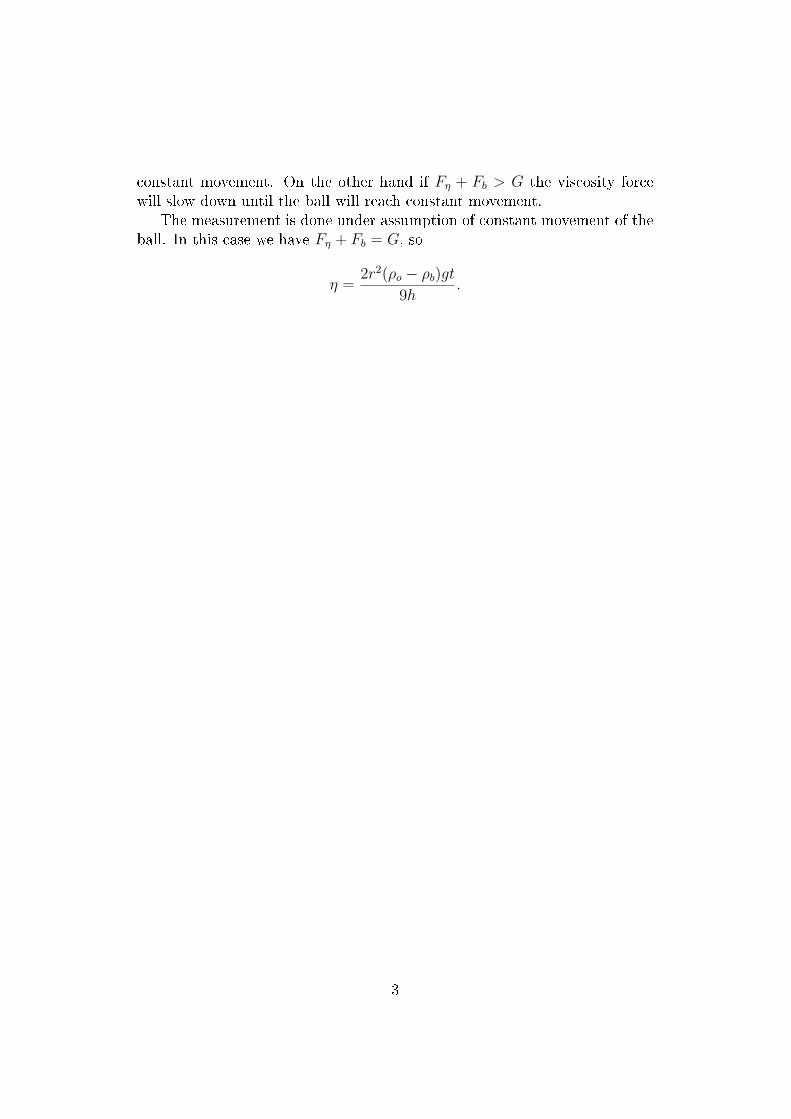
constant movement. On the other hand if Fη + Fb > G the viscosity forcewill slow down until the ball will reach constant movement.
The measurement is done under assumption of constant movement of theball. In this case we have Fη + Fb = G, so
η =2r2(ρo − ρb)gt
9h.
3

Laboratory experiments
Experiment no 16
Checking Hooke's law and determination of the Young's modulus
Janina Gabrielska, Teresa Kral
1 Experiment objectives
• Qualitatively investigate Hook's law• Quantitatively determinate of the Young’s modulus• Observe a wire under tensile stress, being stretched by forces acting at its
ends• A method for measuring small deformations - micrometer
2 Theory
The following knowledge should be acquired:• Tensile and compressive stress and strain and elastic moduli• Elasticity and plasticity• Typical stress-strain dependence for a ductile metal under tension • Hooke’s low equation and Young’s modulus
There are relation between the forces and deformation of body when forces are
applied. It is important to study the effects of forces on the body in terms of different
types of stress: tensile stress, bulk stress and shear stress. For example: a cord or
a wire under tensile stress, being stretched by forces acting at its ends; a fish under
bulk stress, being squeezed from all sides by forces due to water pressure; a tape or
a ribbon under shear stress, being deformed and eventually cut by forces exerted by
the scissors. For each kind of deformation it can be introduce a quantity called
stress that characterizes the strength of the forces causing the deformation, on a
force per unit area basis. Another quantity, strain, describes the resulting
deformation. When the stress and the strain are small enough, it can be find that the
two are directly proportional, and be call the proportionality constant an elastic
modulus. The general pattern that emerges can be formulated as: study the relation
between forces and relative deformation.
Between the molecules of substances act intermolecular forces of attraction and repulsion.
In solids those forces are significant and they act strongly on short distances but their
dependence on the distance between molecules works in different manner.
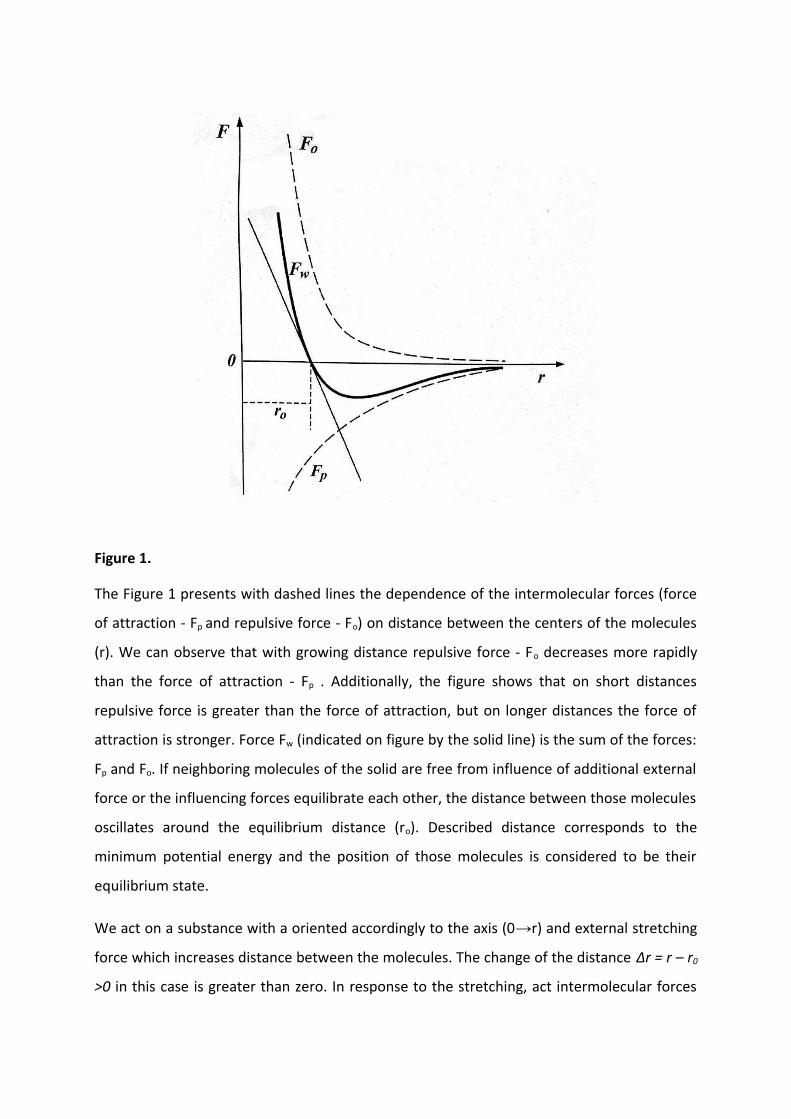
Figure 1.
The Figure 1 presents with dashed lines the dependence of the intermolecular forces (force
of attraction - Fp and repulsive force - Fo) on distance between the centers of the molecules
(r). We can observe that with growing distance repulsive force - Fo decreases more rapidly
than the force of attraction - Fp . Additionally, the figure shows that on short distances
repulsive force is greater than the force of attraction, but on longer distances the force of
attraction is stronger. Force Fw (indicated on figure by the solid line) is the sum of the forces:
Fp and Fo. If neighboring molecules of the solid are free from influence of additional external
force or the influencing forces equilibrate each other, the distance between those molecules
oscillates around the equilibrium distance (ro). Described distance corresponds to the
minimum potential energy and the position of those molecules is considered to be their
equilibrium state.
We act on a substance with a oriented accordingly to the axis (0→r) and external stretching
force which increases distance between the molecules. The change of the distance Δr = r – r0
>0 in this case is greater than zero. In response to the stretching, act intermolecular forces

(represented by symbol Fw) which cause attraction between the molecules. Direction of the
described forces is opposite to the direction of the acting external stretching force.
Analogously, we can also reduce the distance between the molecules Δr = r – r0 <0 by
influencing the solid with an external compressive force. Intermolecular forces counteracting
the compression causes the repulsion of the molecules. Correspondingly to the previous
case the direction of the counteracting forces is opposite to the external compressive force.
Dependency of the sum of the reacting intermolecular forces on the distance r can be
presented on a graph which can be approximated by a linear function, providing that r is
close to the equilibrium distance r0 (on the Figure 1 presented by a line tangent to the curve
Fw in point r0).
We can overcome intermolecular forces by reacting on the solid with some outside force. If,
after the removal of external force the body returns to its original shape and volume, such
deformation is called elastic (or perfectly elastic). Beyond a certain limit the solid do not
return to it’s previous form and it deforms permanently.
Fundamental law (experimental) for the elastic deformations formulated Hook. He showed
that if the limit of the elasticity is not exceeded, then in the case of elastic elongation
pointed accordingly to direction of the acting force, for example wire, the relative elongation
is proportional to pressure of acting force F:
0l
lE
S
F (1)
where:
E - proportionality factor, called the Young's modulus
S - wire cross-section
l0 - primary length
Δ l – elongation
or:
0l
lE
(2)
Based on the equation (1), we can write
lkll
sEF
0
where 0l
sEk (3)
As it is apparent from this equation the force acting on the wire is proportional to the
elongation; k is a factor of proportionality. This relationship is illustrated on Figure 1 by line
tangent to the curve Fw at point ro.
On the basis of equation (3) the following formula can be obtained, used to calculate Young's
modulus:
S
lkE
0 (4)
3. The experiment.
The aim of exercise is:A. Verification of Hooke's law, that is, determine whether the experimentally
obtained dependence F = f(Δl) will be presented on the graph as a straight lineB. Calculating Young's modulus (E)
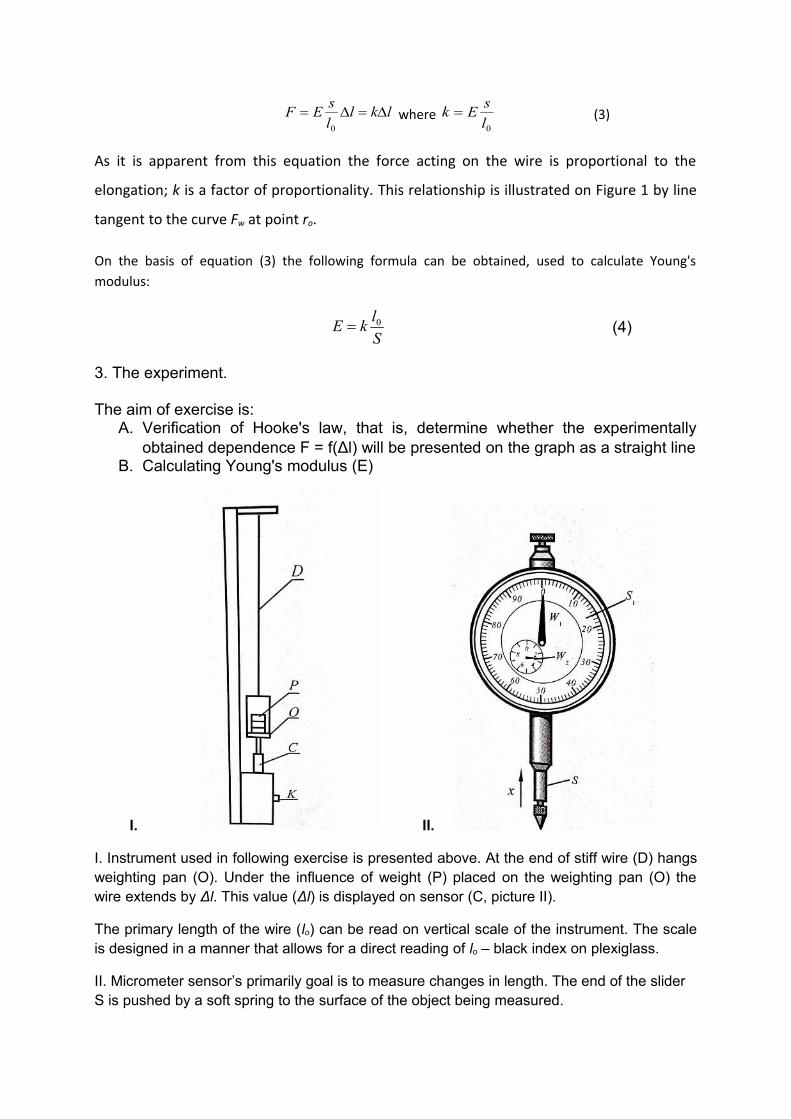
I. II.
I. Instrument used in following exercise is presented above. At the end of stiff wire (D) hangs
weighting pan (O). Under the influence of weight (P) placed on the weighting pan (O) the
wire extends by Δl. This value (Δl) is displayed on sensor (C, picture II).
The primary length of the wire (lo) can be read on vertical scale of the instrument. The scale
is designed in a manner that allows for a direct reading of lo – black index on plexiglass.
II. Micrometer sensor’s primarily goal is to measure changes in length. The end of the slider
S is pushed by a soft spring to the surface of the object being measured.

Offset of slider S in the x direction using gears is transferred into two indexes W1 and W2, of
which one (W1) makes a full rotation with slider offset of 1 mm (or 0,5 mm), and the second
(W2) with slider offset of 10 mm (or 5 mm). The spring pushes the slider to the bottom
position.The circuit of sensor target is divide into 100 (or 50) steps and Δl can be measured to the
nearest 0,01 mm. Scale S1 can be rotated, changing the position of point zero.
4. Curse of the exercise
1. Measure with a micrometer the diameter of wire (2r) in five different places. Calculatethe average diameter and cross-sectional area S
2. Measure the primary length (lo) of the wire 3. Use the knob (K) in order to make the sensor (C) touch the weighting pan (O) and
large Index to point the zero value. To set the smaller index on the zero value rotatethe movable transparent part of the sensor’s casing
4. Load the weighting pan (O) with a weight (P) m = 500 g and note the indication of thesensor (Δl).
5. Repeat the measurements for 8 different weights by adding next weights6. Calculate the gravity force F using equation F = m·g7. Based on results make a figure representing F = f(Δl) 8. Using the figure F = f(Δl) determine the slope of the straight line (k - proportionality
factor)9. Calculate Young's modulus using equation:
S
lkE
o :
The data of the experiment should be collected in the following table:
2r
[m]
raver
[m]
S
[m2]
l0
[m]
m
[kg]
F
[N]
Δl
[m]
E
[Pa]


Laboratory experimentsExperiment no 18
Measurement of the elastic modulus of bonesdr Janusz Mi±kiewicz
October 22, 2007
1 Experiment objectivesThe main target of the experiment is to observe the relation between forcesand deformation and measure elastic modulus.
2 TheoryThe main form of deformation are: Tensile stress � the body is widen byforces acting at its ends as showned at �g.1.
Bulk stress � the body is squeezed from all sides by forces, e.g. a body inthe water, �g.2. Shear stress � while cutting, �g.3.
For each kind of deformation can be introduced appropriate quantitycalled stress that characterises the strength of the forces causing the defor-mation. another quantity, strain, describesthe resulting deformation. Whenthe stress and strain are small enough they are directly proportional. Wecall the proportionality constant an elastic modulus.
The proportionality of stress and strain is called Hook's law:stressstrain = elastic modulus.
Figure 1: Tensile stress
1

Figure 2: Bulk stress
Figure 3: Shear stress
The Hook's law in the above form is obeyed in all possible form of stress(the only problem is to de�ne correctly the stress).
2.1 Tensile and compressive stress and strainThe simplest elastic behaviour is the stretching of a bar, rod, or wire whenits ends are pulled (�g.1). We restrict the Hook's law analysis to the case oftensile and compressive stress. Figure 4 shows an object that initially hasuniform cross-sectional area A and length l0. Then the forces F⊥ are appliedof equal magnitudes but opposite directions at the ends. The tensile stressis de�ned:
tensile stress =F⊥
A
This is a scalar quantity and is measured in pascals Pa = Nm2 .
Tensile strain is de�ned as a relative elongation of the object:
tensile strain =l − l0
l0
So putting the de�ned above values into Hook's law we get:
Y =F⊥l0
A∆l
Y � Young's modulus Remark: very often Young's modulus is denoted bythe letter E.
The case of the compressive stress is described in similar way.
2
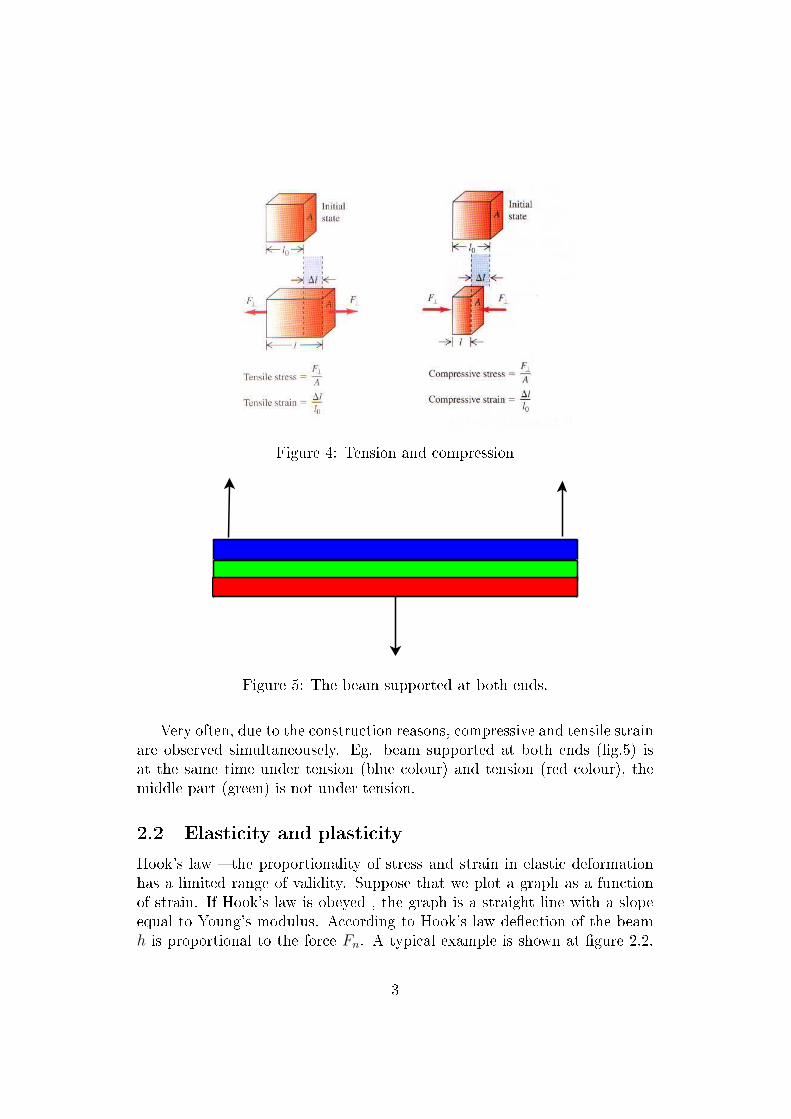
Figure 4: Tension and compression
Figure 5: The beam supported at both ends.
Very often, due to the construction reasons, compressive and tensile strainare observed simultaneousely. Eg. beam supported at both ends (�g.5) isat the same time under tension (blue colour) and tension (red colour), themiddle part (green) is not under tension.
2.2 Elasticity and plasticityHook's law � the proportionality of stress and strain in elastic deformationhas a limited range of validity. Suppose that we plot a graph as a functionof strain. If Hook's law is obeyed , the graph is a straight line with a slopeequal to Young's modulus. According to Hook's law de�ection of the beamh is proportional to the force Fn. A typical example is shown at �gure 2.2.
3

The �rst portion is a straight line, but it ends at point �a�; the stress at thispoint is called the proportional limit.
From �a� to �b�, stress and strain are not longer proportional, and Hook'slaw is not obeyed. If the load is gradually removed, starting at any pointbetween O and b, the curve is retraced until the material returns to itsoriginal length. The deformation is reversible � the material shows elasticbehaviour. Point �b� is called the yield point and the stress at this point iselastic limit.
When we increase the stress beyond point b, the strain continues to in-crease. But when the load is removed the material is not returning to itsoriginal length. Instead it follows the red line. The material has undergonean irreversible and acquired a permanent set. Further increase of load beyond�c� produce a large increase in strain for a relatively small increase in stress,until a point d is reached at which fracture takes place.The behaviour fromb to d is called plastic deformation. A plastic deformation is irreversible.
Microscopic point of view. Every material is made of atoms. The solidstate exists because these atoms interacts. If you use a force than strain seenfrom the atomic level is observed as a shift of atoms. However the shift issmall and the force is proportional to displacement. When we increase stressbeyond elastic limit than the shift of atoms is so big that atoms start tochange its location (in respect to the neighbouring particles) in the material.In results when the stress is removed the particles remain in its new positionso the shape of the material has been changed. From this point of view itshould be clear why relatively small increase of stress result in signi�cantincrease of strain � because at this limit atoms are very likely to changeits position. Of course if we increase the stress too much than the dispal-cement mechanism is not possible to compensate the stress and the materialis broken.
3 ExperimentIn the experiment you will measure a bone, which can be considered as abeam - �g.6.
h = kFn, (1)where k is the proportionality coe�cient, which depend on the size and
shape of the section of the beam. In the case of the tube, which is anapproximation of the bone empty inside it is:
k =l3
12π(R4− r4)
Y (2)
4

5

Figure 6: Experimental set
Figure 7: Experimental set
R and r are radius and inner radius of the bone.In order to apply a force you will be using a single-arm lever. The system
is presented in the �g.7. O - pivot point, A - place of bone, B - gravitationalforce. The force acting on the bone can be calculated as:
Fn = wFg, where w =OB
OA
In the case of the used experimental set w ≈ 3.
4 Data analysis1. Measure distances OA, OB and calculate w = OB
OA.
2. Measure bone length. Measurement repeat 5 times.
3. Place the dial micrometer. Measure de�ection of the bone using 7di�erent loads.
4. Measure 10 times bone diameter (D) and 3 times inner diameter (e).
5. We make the plot of the de�ection as a function of the load.
6

6. From the plot calculate linear coe�cient k - equation 1 and use it tocalculate elastic modulus from equation 2.
Data tables
l lm w Fg Fn h D Dm e em dm r R 1/Ym m N N m m m m m m m m m2
N
h Fn
m N
7

Exercise no19
Determining the heat of solids
Janina Gabrielska, TeresaKral
Temperature (T) and heat (Q) are physical quantities which are related to the internal energy of
bodies or body circuits. The temperature is a value proportional to the size of the average kinetic
energy of the thermal motion of the molecules located in a body. In the SI system the temperature is
expressed in Kelvin degrees but in practice unit called Celsius degrees is also frequently used. The
relationship between these units can be presented by: T [K] = t [oC] +273,15.
Heat is a physical quantity equal to the change of internal energy in body or a circuit which is caused
by change in the temperature. As a result of collecting and giving away the heat by the bodies, due to
changes in their internal energy, the changes in temperature or phase transformation occur or both
processes take place at the same time. Heat exchanged by a homogeneous body with an
environment (collected or given away by the body) depends on different parameters such as: body’s
weight, type of material or the difference in the temperature existing between the body and its
surroundings. Described heat can be represented by equation:
(1)
Where: c - specific heat, which characterize type of material.
Specific heat of a homogeneous body can be defined by the following equation:
(2)
Where: Q - describes using number the quantity of heat required to warm up a body of mass m from
temperature T1 to temperature T2 or heat separated from the body during cooling. Specific heat c is
a quantity of heat required to warm up a body of weight equal 1 kg by 1 Kelvin and it is characterized
by: J/(kg·K).
When the case of the heat exchange do not refer to a body but a heterogeneous system, such as eg.
Calorimeter, the equation takes following form:
When the case of the heat exchange do not refer to a body but a heterogeneous system, such as eg.
calorimeter, the equation (1) takes following form:
Q=P·ΔT (3)
Where P is the heat capacity of the calorimeter and can takes the form:
K
J
T
QP (4)
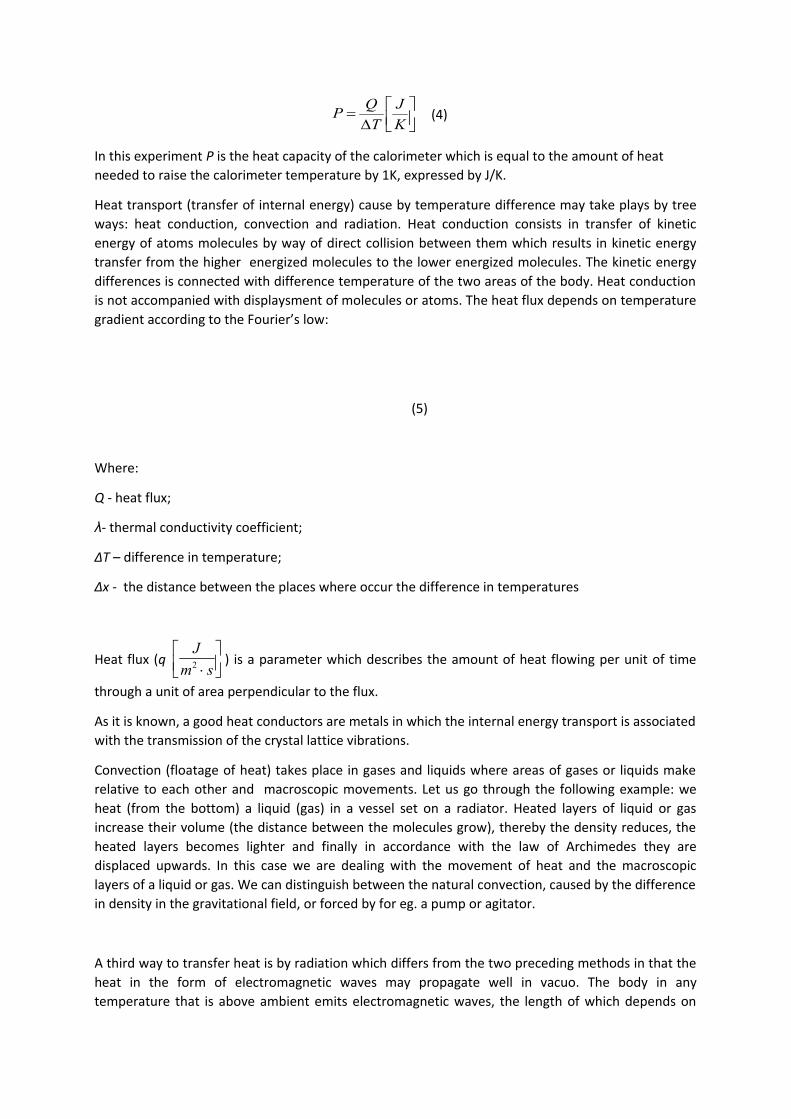
In this experiment P is the heat capacity of the calorimeter which is equal to the amount of heat
needed to raise the calorimeter temperature by 1K, expressed by J/K.
Heat transport (transfer of internal energy) cause by temperature difference may take plays by tree
ways: heat conduction, convection and radiation. Heat conduction consists in transfer of kinetic
energy of atoms molecules by way of direct collision between them which results in kinetic energy
transfer from the higher energized molecules to the lower energized molecules. The kinetic energy
differences is connected with difference temperature of the two areas of the body. Heat conduction
is not accompanied with displaysment of molecules or atoms. The heat flux depends on temperature
gradient according to the Fourier’s low:
(5)
Where:
Q - heat flux;
λ- thermal conductivity coefficient;
ΔT – difference in temperature;
Δx - the distance between the places where occur the difference in temperatures
Heat flux (q
sm
J2 ) is a parameter which describes the amount of heat flowing per unit of time
through a unit of area perpendicular to the flux.
As it is known, a good heat conductors are metals in which the internal energy transport is associated
with the transmission of the crystal lattice vibrations.
Convection (floatage of heat) takes place in gases and liquids where areas of gases or liquids make
relative to each other and macroscopic movements. Let us go through the following example: we
heat (from the bottom) a liquid (gas) in a vessel set on a radiator. Heated layers of liquid or gas
increase their volume (the distance between the molecules grow), thereby the density reduces, the
heated layers becomes lighter and finally in accordance with the law of Archimedes they are
displaced upwards. In this case we are dealing with the movement of heat and the macroscopic
layers of a liquid or gas. We can distinguish between the natural convection, caused by the difference
in density in the gravitational field, or forced by for eg. a pump or agitator.
A third way to transfer heat is by radiation which differs from the two preceding methods in that the
heat in the form of electromagnetic waves may propagate well in vacuo. The body in any
temperature that is above ambient emits electromagnetic waves, the length of which depends on
the temperature. Bodies possessing different temperatures can radiate ultraviolet, visible and
infrared radiation. Body that emits radiation, if not supplied with power from other sources, loses
energy and cools itself. If losses are aligned, the temperature do not change and we have the case of
radiation called sustainable. Values characteristic for bodies in terms of temperature radiation (also
called thermal) are: ability to emit Re and ability to absorb Ra. Ability to emit determines the amount
of energy radiated by the body in a unit of body’s area per unit of time while the ability to absorb is
defined by the ratio of the energy absorbed by the body to the energy falling on it. These parameters
depend on both the size of the wavelength (λ) of the emitted and absorbed radiation, as well as on
the absolute temperature of the body.
Ability to emit and ability to absorb are associated with each other with dependency resulting from
Kirchhoff's law:
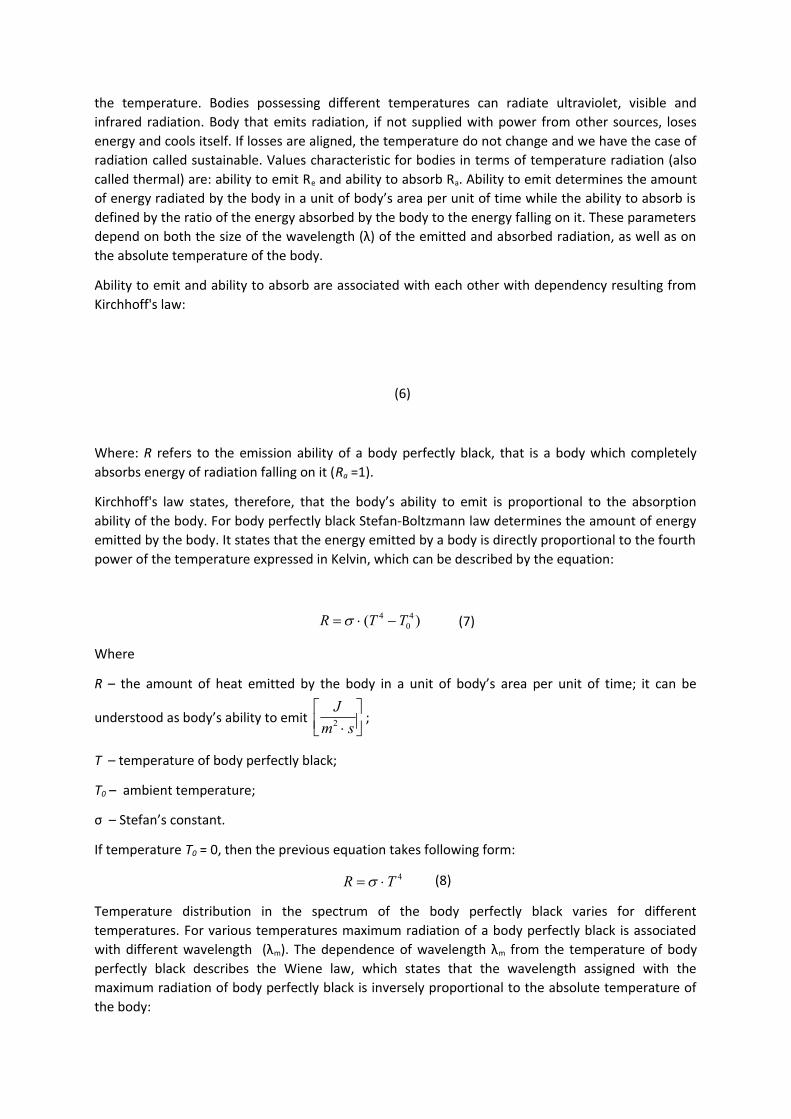
(6)
Where: R refers to the emission ability of a body perfectly black, that is a body which completely
absorbs energy of radiation falling on it (Ra =1).
Kirchhoff's law states, therefore, that the body’s ability to emit is proportional to the absorption
ability of the body. For body perfectly black Stefan-Boltzmann law determines the amount of energy
emitted by the body. It states that the energy emitted by a body is directly proportional to the fourth
power of the temperature expressed in Kelvin, which can be described by the equation:
)( 4
0
4 TTR (7)
Where
R – the amount of heat emitted by the body in a unit of body’s area per unit of time; it can be
understood as body’s ability to emit
sm
J2 ;
T – temperature of body perfectly black;
T0 – ambient temperature;
σ – Stefan’s constant.
If temperature T0 = 0, then the previous equation takes following form:
4TR (8)
Temperature distribution in the spectrum of the body perfectly black varies for different
temperatures. For various temperatures maximum radiation of a body perfectly black is associated
with different wavelength (λm). The dependence of wavelength λm from the temperature of body
perfectly black describes the Wiene law, which states that the wavelength assigned with the
maximum radiation of body perfectly black is inversely proportional to the absolute temperature of
the body:

T
bm (9)
Where: b – Wiene constant. As it is apparent, the lower the temperature of a body, the longer the
wavelength λm. From Wiene's law, we can eg. approximately calculate (for body that is imperfectly
black) the wavelength λm of the radiation emitted from the human body, assuming that it has
temperature equal 310 K (37o C), it is about 9 μm and it corresponds to radiation lying in the near
infrared.
As follows from the above, the internal energy of the body (thermodynamic system) can change in
the way of the heat. It is also known that the internal energy may be changed through the work done
on the system or by the system. The possibility of changes in internal energy of the system is
described by the first law of thermodynamics, which states that the change in internal energy ΔU of a
system in any process is the sum of the work W done on the system, or by the system and the
amount of heat taken or returned by the system in a given process. Following can be written:
ΔU = W + Q (10)
We assume the change in energy is positive in cases where there is an increase in energy, ie. when
the work is done on the system and the heat is provided to the system. If a drop of internal energy is
observed, we presume the change is negative, which takes place when the system finishes work or
gives away the heat to the ambient. Of course, the energy does not change ΔU = 0 if, for example,
the work is done on the system and the system gives the environment the amount of heat equal to
the amount of work.
We determine the specific heat with a calorimeter, which consists of the following parts:
1) Drewar vessel, designed to maximize reduction of heat loss; it
is a bubble shaped container made of glass with silver-plated
walls between which there is a vacuum;
2) a thermometer for measuring the temperature
(thermocouple);
3) stirrers.
We heat a body (the one for which we want to determine specific
heat) in a sealed tube immersed in a pan of boiling water. In this way,
the body is heated in dry air to a temperature T0 equal to the
temperature of boiling water. After some time, when the body warms
up evenly, we put it quickly to the calorimeter which contains water
of mass mw, temperature Tw, and specific heat cw. We close
calorimeter with a stopper. Examined body cools down, releasing
heat to water and calorimeter. In this case the amount of heat given away describes the equation:
)( 0 kTTcmQ (11)
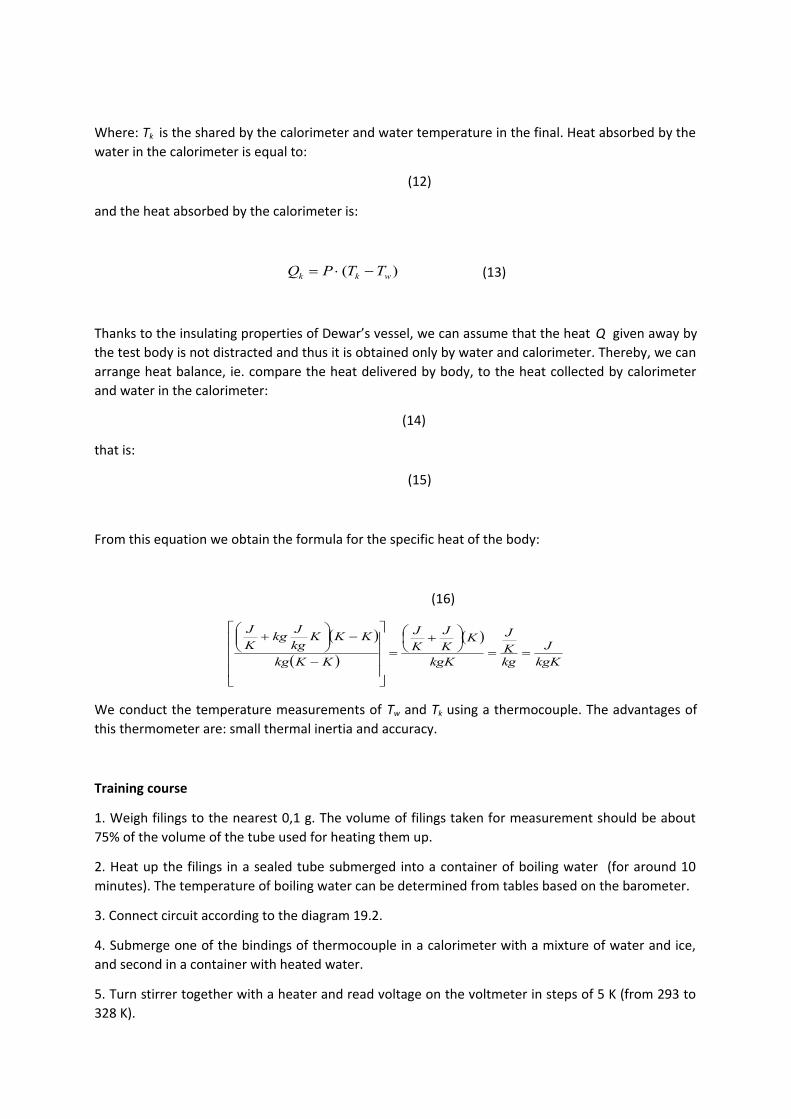
Where: Tk is the shared by the calorimeter and water temperature in the final. Heat absorbed by the
water in the calorimeter is equal to:
(12)
and the heat absorbed by the calorimeter is:
)( wkk TTPQ (13)
Thanks to the insulating properties of Dewar’s vessel, we can assume that the heat Q given away by
the test body is not distracted and thus it is obtained only by water and calorimeter. Thereby, we can
arrange heat balance, ie. compare the heat delivered by body, to the heat collected by calorimeter
and water in the calorimeter:
(14)
that is:
(15)
From this equation we obtain the formula for the specific heat of the body:
(16)
kgK
J
kgK
J
kgK
KK
J
K
J
KKkg
KKKkg
Jkg
K
J
We conduct the temperature measurements of Tw and Tk using a thermocouple. The advantages of
this thermometer are: small thermal inertia and accuracy.
Training course
1. Weigh filings to the nearest 0,1 g. The volume of filings taken for measurement should be about
75% of the volume of the tube used for heating them up.
2. Heat up the filings in a sealed tube submerged into a container of boiling water (for around 10
minutes). The temperature of boiling water can be determined from tables based on the barometer.
3. Connect circuit according to the diagram 19.2.
4. Submerge one of the bindings of thermocouple in a calorimeter with a mixture of water and ice,
and second in a container with heated water.
5. Turn stirrer together with a heater and read voltage on the voltmeter in steps of 5 K (from 293 to
328 K).

6. Present chart of the temperature U = U(ΔT).
7. Using chart find temp. constant a from U(ΔT), a = (U2 - U1)(ΔT2 - ΔT1.)
8. Pour 250 ml of water into calorimeter. Submerge one of the bindings of thermocouple and take a
note of voltage UK corresponding to the initial temperature of the water TW.
9. After heating up the filings pours them into the calorimeter.
10. To heat up water faster and even use stirrer, while observing voltmeter.
11. Note maximum value of voltage UK for final temperature of mixture TK. Using previously
calculated temperature const. a calculate TW and TK from formula (T = U/a + 273K)
12. Finally using formula (14) calculate specific heat of the body.
Table of measure value and results of experiments no 19.
P mw m Tp Uw Tw Uk Tk cw c
J/K kg kg K V K V K J/kg·K J/kg·K
Table of thermocouple calibration
ΔT [K] 20 25 30 35 40 45 50 55
U [V]
a [V/K]
Examples of control questions:
1.Discuss heat transport mechanisms and laws that govern them.
2. Using the principle of heat balance, present a formula for the specific heat of the solid.
3. Explain the principle of operation and the application of thermocouple.


Laboratory experimentsExperiment no 21Blood transportdr Janusz Mi±kiewicz
December 2, 2007
1 Experiment objectivesIn this experiment you have to apply the thermodynamic principles in orderto measure �ow rate on the body. Particularly through the hand. The exper-iment is based on the I thermodynamic principle and using heat equation.
From the second thermodynamic principle we know that the energy istransported from a body with higher temperature to the body with lowertemperature. We can calculate the transfered energy knowing initial and �naltemperature as well as mass of the body. Of course the opposite conclusionis also possible: knowing the energy transfered and the di�erence of the �naland initial temperature we can calculate the mas of an object - here blood.
1.1 Experiment ideaIn the experiment take into consideration the following elements: calorimeter,water, hand body, blood transfered through an arm.
Elements accepting energy are: calorimeter, water.Elements providing energy is blood.The body of the hand plays a special role: initially it is providing energy,but after approximately 10 minutes it is accepting energy.The parameter measured are: volume of the hand, mass of the water, tem-perature of water (which is assumed to be identical to the whole system).The main assumption are:
• blood, which is entering hand has the human body temperature (37oC)
• leaving hand has temperature of the water bath.
1

These two assumptions allows us to compare the energy provided by bloodto the system with the mass of blood.
2 TheoryThe �rst law of thermodynamics: The energy of a system can be changed byheat transfer ∆Q or by some work ∆W :
∆U = ∆Q + ∆W
When there the work ∆W = 0 then we can simplify the �rst law ofthermodynamics and write the heat equation. Writing the heat equation wehave to distinguish subsystems which exchange thermal energy. In the caseof two subsystem the heat equation takes the form:
∆Q1 = ∆Q2
m1c1(T1 − Tf ) = m2c2(Tf − T2) (1)where: m1,m2, c1, c2, T1, T2 � mass, speci�c heat, initial temperature of thebody 1 and 2, Tf �nal temperature of the system.
Eq.(1) is valid when the temperatutures are well de�ned. Unfortunatelyin this experiment the water temperature is constantly changing as well asthe �nal temperature of the blood. So while we can measure the changethe water and calorimeter internal energy and to know how much heat wasprovided be blood to the water it require some caution while calculating themass of the blood. In order to �nd the mass of the blood we have to analysethe process of heat transfer in details - in short time intervals. If we choosevery short time intervals we can neglect the change of the �nal temperatureof blood and write:
∆Q(t + ∆t) = Vodkrckr(37o− T (∆t))∆t
dkr � blood's density, ckr � blood's speci�c heat, Vo � blood �ow rate.Since we know the change of the water energy we have to calculate the totalenergy provided by blood by summing up ∆Q(t + ∆t) from the time 10 minup to 30 min. The �rst moment (10 min) is the time required to cool downthe hand to the temperature of the surrounding water. Of course in order todo the calculation properly we have take the limit ∆t → 0. Finally we get:
∆Q =∫
30min
10minVodkrckr(37o
− T (t))dt
2

rewriting
∆Q = Vodkrckr(20min)(37o−
1
20min
∫30min
10min−T (t)dt (2)
introducing the mean temperature Tm = 1
20min
∫30min10min −T (t)dt we can write
the eq.(2) in simple form:
∆Q = Vodkrckr(20min)(37o− Tm)
The only problem in the above equation is to �nd the mean temperature.Instead of calculating the integral we can measure the surface below the curve(which is equivalent the calculating the integral) and divide it by the timeinterval (here 20min).
On the other hand the change of the energy of the water, calorimeter andhand can be calculated as:
Qp = (Vrdcr + mwcw + Pk)(T30 − T10) (3)
Vr � hand's volume, cr � speci�c heat of human body, mw � mas of the water,cw � speci�c heat of the water, d � human body dencity, Pk � heat capacityof the calorimetry. Comparing eq.(2) and eq.(3) we can �nd out the bloodrate:
Vkr =(Vrdcr + mwcw + Pk)(T30 − T10)
dkrckr(20min)(37o− Tm)
andVo =
Vkr
20min
Knowing the �ow rate Vo, volume of a hart W = 70cm3 and the pulse n wecan calculate the fraction of the blood going through the hand:
p =Vo
Wn100%
3

EXPERIMENT NR. 25
SUBJECT: Resistance measurements.
The electrical resistance of an object is a measure of its opposition to the passage of a steady electric current. An object of uniform cross section will have a resistance proportional to its length and inversely proportional to its cross-sectional area, and proportional to the resistivity of the material.
Discovered by Georg Ohm in 1827 electrical resistance shares some conceptual parallels with the mechanical notion of friction. The SI unit of electrical resistance is the ohm (Ω).
For a wide variety of materials and conditions, the electrical resistance does not depend on the amount of current through or the potential difference (voltage) across the object, meaning that the resistance R is constant for the given temperature and material. Therefore, the resistance of an object can be defined as the ratio of voltage to current, in accordance with Ohm's law:
A solid conductive metal contains mobile, or free, electrons. These electrons are bound
to the metal lattice but not to any individual atom. Even with no external electric field applied, these electrons move about randomly due to thermal energy but, on average, there is zero net current within the metal. Given a plane through which the wire passes, the number of electrons moving from one side to the other in any period of time is on average equal to the number passing in the opposite direction. Thus the interior of a metal is filled up with a large number of unattached electrons that travel aimlessly around like a crowd of displaced persons. When a metal wire is subjected to electric force applied on its opposite ends, these free electrons rush in the direction of the force, thus forming what we call an electric current. For a steady flow, the current I in amperes can be calculated with the following equation:
where Q is the electric charge in coulombs [C] transferred, and t is the time in seconds (s). More generally, electric current can be represented as the time rate of change of charge, or
Direct Current resistance
The resistance R of a conductor of uniform cross section can be computed as
where, l is the length of the conductor, measured in metres [m], A is the cross-sectional area of the current flow, measured in square metres [m²] ρ is the electrical resistivity (also called specific electrical resistance) of the material. The SI unit of electrical resistivity is the ohm
metre [Ω m]. Resistivity is a measure of the material's ability to oppose electric current. For practical reasons, any connections to a real conductor will almost certainly mean the current density is not totally uniform. However, this formula still provides a good approximation for long thin conductors such as wires.
Electrical resistivity (also known as specific electrical resistance or volume resistivity) is a measure of how strongly a material opposes the flow of electric current. A low resistivity indicates a material that readily allows the movement of electrical charge.
Electrical resistivity ρ is defined by,
where, ρ is the static resistivity (measured in volt-metres per ampere, V m/A); E is the magnitude of the electric field (measured in volts per metre, V/m); J is the magnitude of the current density (measured in amperes per square metre, A/m²). The electrical resistivity ρ can also be given by,
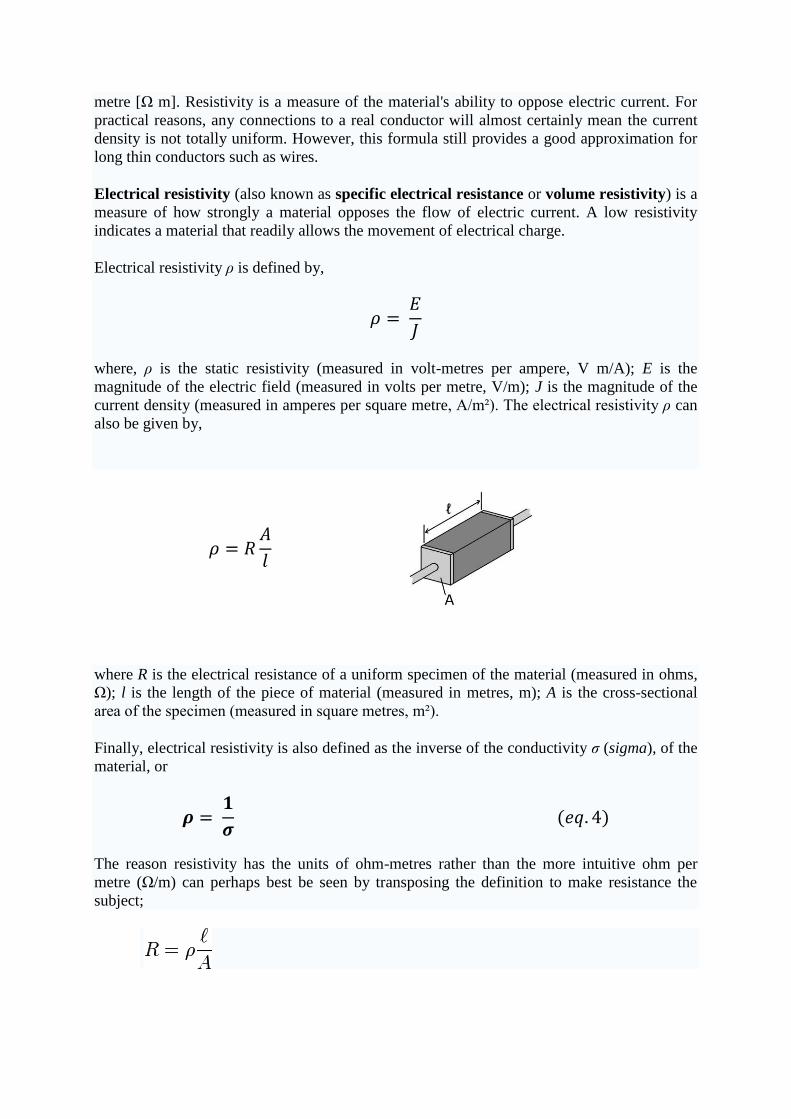
where R is the electrical resistance of a uniform specimen of the material (measured in ohms, Ω); l is the length of the piece of material (measured in metres, m); A is the cross-sectional area of the specimen (measured in square metres, m²).
Finally, electrical resistivity is also defined as the inverse of the conductivity σ (sigma), of the material, or
The reason resistivity has the units of ohm-metres rather than the more intuitive ohm per metre (Ω/m) can perhaps best be seen by transposing the definition to make resistance the subject;
The resistance of a given sample will increase with the length, but decrease with the cross sectional area. Resistance is measured in ohms. Length over Area has units of 1/distance. To end up with ohms, resistivity must be in the units of "ohms × distance" (SI ohm-metre)
The aim of this experiment is to estimate electrical resistance by using two method: 1) less precise called “technical method” 2) more precise Wheatstone bridge.
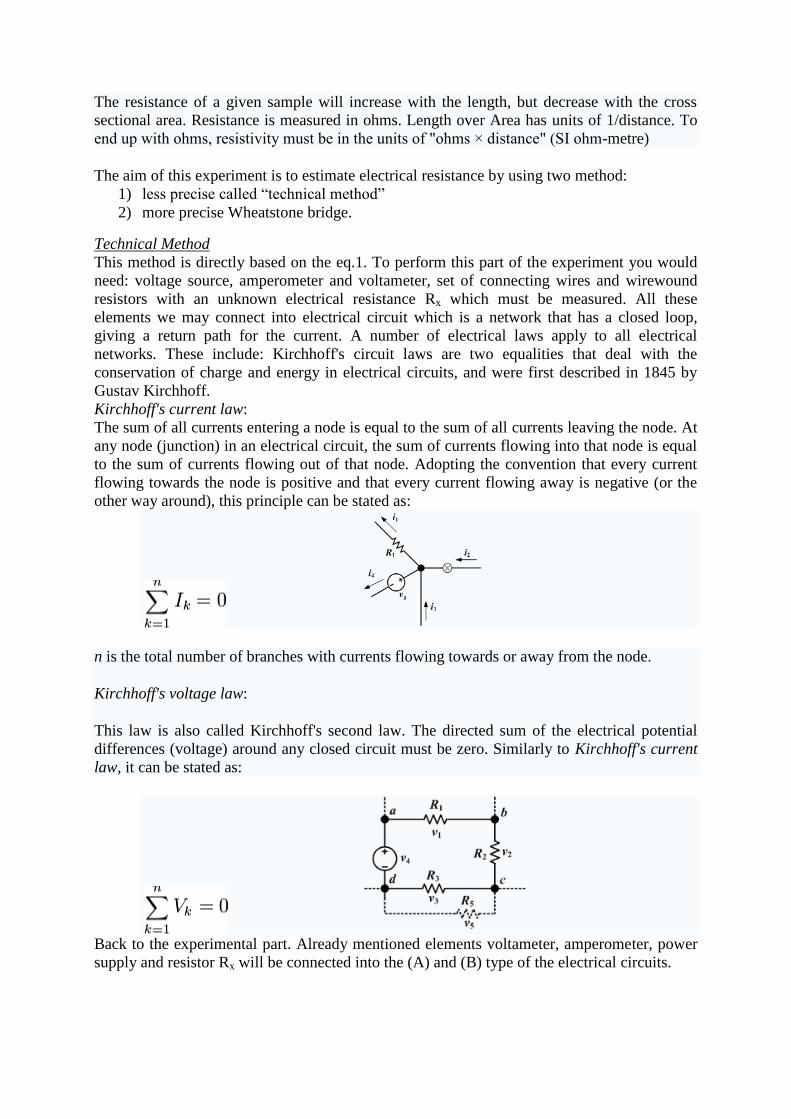
Technical Method This method is directly based on the eq.1. To perform this part of the experiment you would need: voltage source, amperometer and voltameter, set of connecting wires and wirewound resistors with an unknown electrical resistance Rx which must be measured. All these elements we may connect into electrical circuit which is a network that has a closed loop, giving a return path for the current. A number of electrical laws apply to all electrical networks. These include: Kirchhoff's circuit laws are two equalities that deal with the conservation of charge and energy in electrical circuits, and were first described in 1845 by Gustav Kirchhoff. Kirchhoff's current law: The sum of all currents entering a node is equal to the sum of all currents leaving the node. At any node (junction) in an electrical circuit, the sum of currents flowing into that node is equal to the sum of currents flowing out of that node. Adopting the convention that every current flowing towards the node is positive and that every current flowing away is negative (or the other way around), this principle can be stated as:
n is the total number of branches with currents flowing towards or away from the node.
Kirchhoff's voltage law:
This law is also called Kirchhoff's second law. The directed sum of the electrical potential differences (voltage) around any closed circuit must be zero. Similarly to Kirchhoff's current law, it can be stated as:
Back to the experimental part. Already mentioned elements voltameter, amperometer, power supply and resistor Rx will be connected into the (A) and (B) type of the electrical circuits.

In the “technical method A” voltameter shows voltage on the measured Rx, so V = Vx, where V – is a voltage read from the voltameter and Vx - is voltage on the resistor Rx. Amperometer shows current (J) which is the sum of the currents flow both through resistor Rx (Jx) and voltameter (Jv), so according Kirchhoff's current law:
If Rx<< Rv, then according Kirchhoff's voltage law Jx>>J v, so we can assume that:
Finally we will obtain:
In the “technical method B” voltameter indicates not only voltage on the resistor Rx, (Vx) but also drop of the voltage on internal resistor of the amperometer, VA;
So, according eq.1 and assumption that J = Jx we will obtain:
where is an internal resistance of the amperometer.
When Rx>>RA we can neglect RA and calculate Rx from the eq.5.

Tasks for the technical method A and B:
1. Please connect circuit A and B, respectively. 2. Please ask supervising person to check electrical circuit. 3. Then please set voltage values and read values of the currents. Please measure at least
twice for two different values of the voltage. 4. Please calculate Rx from the eq.5.
Important!!! Please take into account if Rx >> RA or Rx << RA Table for the technical method A and B:
Method
number of the
resistor
J V RA Rv Rx
[A]
[V]
[ ]
[ ]
[ ]
A
B
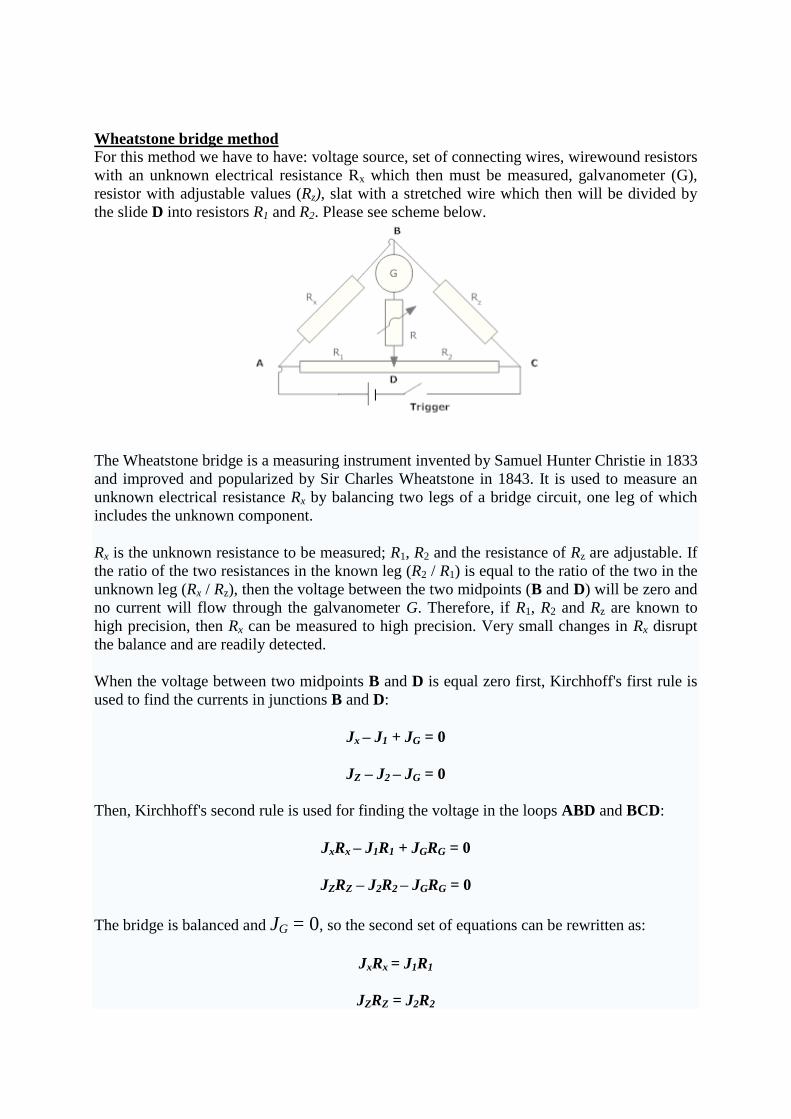
Wheatstone bridge method For this method we have to have: voltage source, set of connecting wires, wirewound resistors with an unknown electrical resistance Rx which then must be measured, galvanometer (G), resistor with adjustable values (Rz), slat with a stretched wire which then will be divided by the slide D into resistors R1 and R2. Please see scheme below.
The Wheatstone bridge is a measuring instrument invented by Samuel Hunter Christie in 1833 and improved and popularized by Sir Charles Wheatstone in 1843. It is used to measure an unknown electrical resistance Rx by balancing two legs of a bridge circuit, one leg of which includes the unknown component.
Rx is the unknown resistance to be measured; R1, R2 and the resistance of Rz are adjustable. If the ratio of the two resistances in the known leg (R2 / R1) is equal to the ratio of the two in the unknown leg (Rx / Rz), then the voltage between the two midpoints (B and D) will be zero and no current will flow through the galvanometer G. Therefore, if R1, R2 and Rz are known to high precision, then Rx can be measured to high precision. Very small changes in Rx disrupt the balance and are readily detected.
When the voltage between two midpoints B and D is equal zero first, Kirchhoff's first rule is used to find the currents in junctions B and D:
Jx – J1 + JG = 0
JZ – J2 – JG = 0
Then, Kirchhoff's second rule is used for finding the voltage in the loops ABD and BCD:
JxRx – J1R1 + JGRG = 0
JZRZ – J2R2 – JGRG = 0
The bridge is balanced and JG = 0, so the second set of equations can be rewritten as:
JxRx = J1R1
JZRZ = J2R2

Then, the equations are divided and rearranged, giving:
From the first rule, Iz = Ix and I1 = I2. The desired value of Rx is now known to be given as:
At the point of balance, the ratio of R1 / R2 = Rx / Rz
Here, resistances R1 and R2 are resistances of pieces of the wire which is stretched on the wooden bar. Using eq. 3 we obtain:
Tasks for the Wheatstone bridge method
1. Please connect circuit. 2. Please ask supervising person to check electrical circuit. 3. From the method A and B please calculate values of the Rx. These values will be then
used to preset the Rz resistance for the Wheatstone bridge method. 4. Then please move slide D to balance the Wheatstone bridge. Please note that
galvanometer has adjustable protective resistor R. To read correct values of l1 and l2 the
potentiometer of the resistor R has to be set at the minimum! 5. Please calculate Rx values using eq. 6.
Number of resistor
l1 l2 RZ RX
[m] [m] [ ] [ ]

Comparison Table:
6. Please calculate percentage deviations according following formula:
Where Rx (WB) is the value of Rx resistance obtain by the Wheatstone bridge method and Rx (A
or B method) is the value of Rx resistance obtain either by A or B technical methods.
Scheme in the technical
method
Number of
resistor
PD
[ ]
[ ]
A
B
A
B
7. Please write a conclusions according result obtained from the comparison both
technical and Wheatstone bridge method.

NAME:
DATE:
SURNAME:
NUMBER of the team:
Experiment no 25
Subject: Resistance measurements
Table of measurements and results – the technical method A and B:
Method
number of the
resistor
J V RA Rv Rx
[A]
[V]
[ ]
[ ]
[ ]
A
B

NAME:
DATE:
SURNAME:
NUMBER of the team:
Experiment no 25
Subject: Resistance measurements
Table of measurements and results – Wheatstone bridge method
Number of resistor
l1 l2 RZ RX
[m] [m] [ ] [ ]
Comparison Table:
Scheme in the technical
method
Number of
resistor
PD
[ ]
[ ]
A
B
A
B
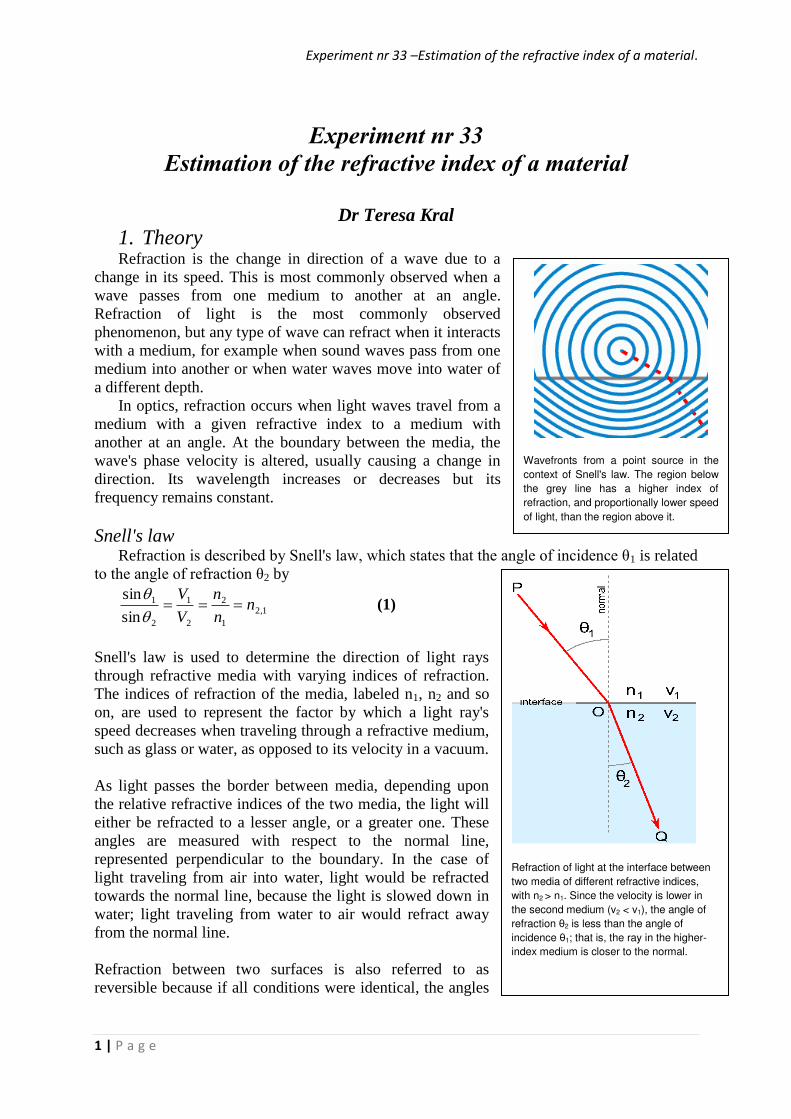
Experiment nr 33 –Estimation of the refractive index of a material.
1 | P a g e
Experiment nr 33
Estimation of the refractive index of a material
Dr Teresa Kral
1. Theory Refraction is the change in direction of a wave due to a
change in its speed. This is most commonly observed when a wave passes from one medium to another at an angle. Refraction of light is the most commonly observed phenomenon, but any type of wave can refract when it interacts with a medium, for example when sound waves pass from one medium into another or when water waves move into water of a different depth.
In optics, refraction occurs when light waves travel from a medium with a given refractive index to a medium with another at an angle. At the boundary between the media, the wave's phase velocity is altered, usually causing a change in direction. Its wavelength increases or decreases but its frequency remains constant. Snell's law
Refraction is described by Snell's law, which states that the angle of incidence θ1 is related to the angle of refraction θ2 by
1,21
2
2
1
2
1
sin
sinn
n
n
V
V
(1)
Snell's law is used to determine the direction of light rays through refractive media with varying indices of refraction. The indices of refraction of the media, labeled n1, n2 and so on, are used to represent the factor by which a light ray's speed decreases when traveling through a refractive medium, such as glass or water, as opposed to its velocity in a vacuum. As light passes the border between media, depending upon the relative refractive indices of the two media, the light will either be refracted to a lesser angle, or a greater one. These angles are measured with respect to the normal line, represented perpendicular to the boundary. In the case of light traveling from air into water, light would be refracted towards the normal line, because the light is slowed down in water; light traveling from water to air would refract away from the normal line. Refraction between two surfaces is also referred to as reversible because if all conditions were identical, the angles
Wavefronts from a point source in the
context of Snell's law. The region below
the grey line has a higher index of
refraction, and proportionally lower speed
of light, than the region above it.
Refraction of light at the interface between
two media of different refractive indices,
with n2 > n1. Since the velocity is lower in
the second medium (v2 < v1), the angle of
refraction θ2 is less than the angle of
incidence θ1; that is, the ray in the higher-
index medium is closer to the normal.

Experiment nr 33 –Estimation of the refractive index of a material.
2 | P a g e
would be the same for light propagating in the opposite direction. Snell's law is generally true only for isotropic or specular media (such as glass). In anisotropic media such as some crystals, birefringence may split the refracted ray into two rays, the ordinary or o-ray which follows Snell's law, and the other extraordinary or e-ray which may not be co-planar with the incident ray. What is light? Light is electromagnetic radiation of a wavelength that is visible to the human eye (in a range from about 380 or 400 nanometres to about 760 or 780 nm). In physics, the term light sometimes refers to electromagnetic radiation of any wavelength, whether visible or not. Five primary properties of light are intensity, frequency or wavelength, polarization, phase and orbital angular momentum. Light, which exists in tiny "packets" called photons, exhibits properties of both waves and particles. This property is referred to as the wave–particle duality. The study of light, known as optics, is an important research area in modern physics. Generally, electromagnetic radiation (the designation 'radiation' excludes static electric and magnetic and near fields) is classified by wavelength into radio, microwave, infrared, the visible region we perceive as light, ultraviolet, X-rays and gamma rays. The behavior of electromagnetic radiation depends on its wavelength. Higher frequencies have shorter wavelengths, and lower frequencies have longer wavelengths. When electromagnetic radiation interacts with single atoms and molecules, its behavior depends on the amount of energy per quantum it carries.
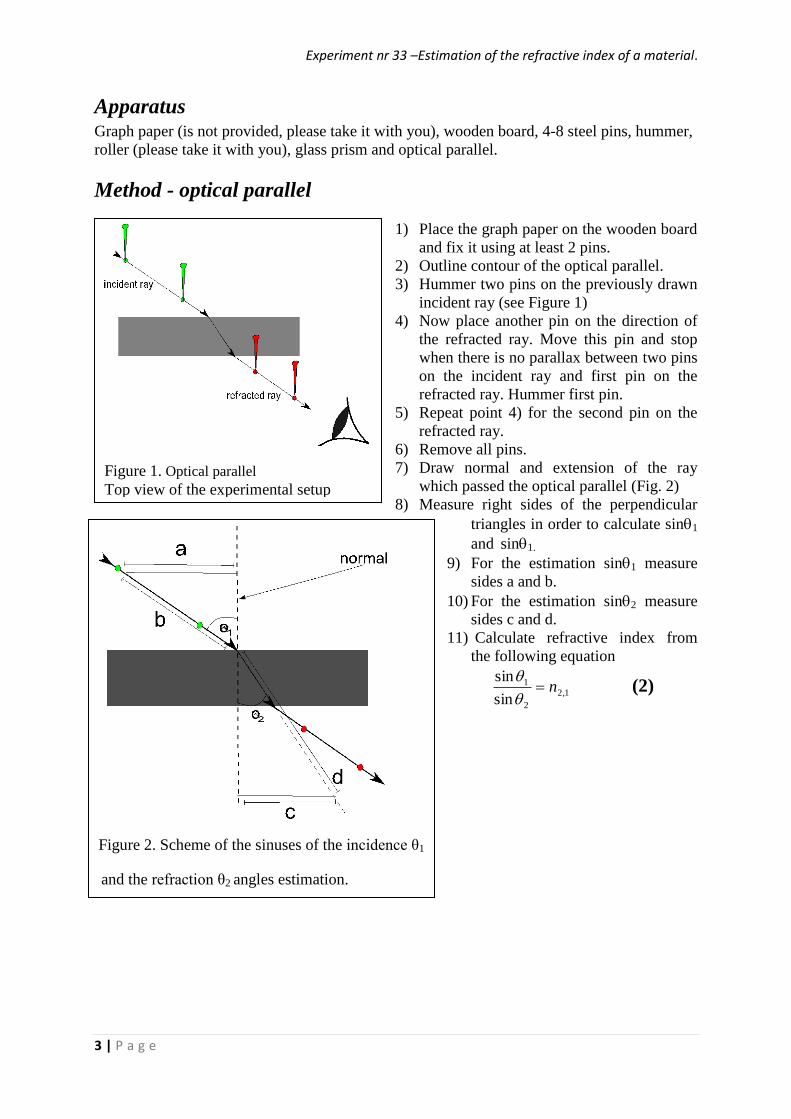
Experiment nr 33 –Estimation of the refractive index of a material.
3 | P a g e
Apparatus Graph paper (is not provided, please take it with you), wooden board, 4-8 steel pins, hummer, roller (please take it with you), glass prism and optical parallel.
Method - optical parallel 1) Place the graph paper on the wooden board
and fix it using at least 2 pins. 2) Outline contour of the optical parallel. 3) Hummer two pins on the previously drawn
incident ray (see Figure 1) 4) Now place another pin on the direction of
the refracted ray. Move this pin and stop when there is no parallax between two pins on the incident ray and first pin on the refracted ray. Hummer first pin.
5) Repeat point 4) for the second pin on the refracted ray.
6) Remove all pins. 7) Draw normal and extension of the ray
which passed the optical parallel (Fig. 2) 8) Measure right sides of the perpendicular
triangles in order to calculate sin1
and sin1. 9) For the estimation sin1 measure
sides a and b. 10) For the estimation sin2 measure
sides c and d. 11) Calculate refractive index from
the following equation
1,22
1
sin
sinn
(2)
Figure 1. Optical parallel Top view of the experimental setup
Figure 2. Scheme of the sinuses of the incidence θ1
and the refraction θ2 angles estimation.
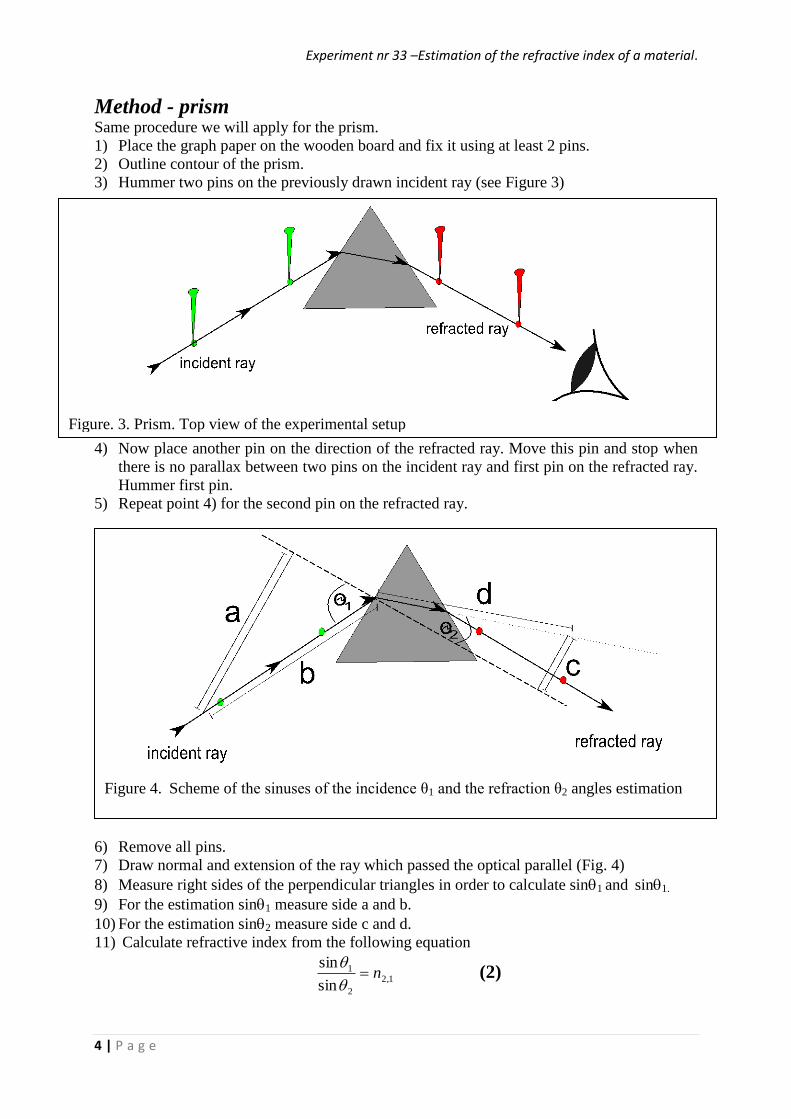
Experiment nr 33 –Estimation of the refractive index of a material.
4 | P a g e
Method - prism Same procedure we will apply for the prism. 1) Place the graph paper on the wooden board and fix it using at least 2 pins. 2) Outline contour of the prism. 3) Hummer two pins on the previously drawn incident ray (see Figure 3)
4) Now place another pin on the direction of the refracted ray. Move this pin and stop when there is no parallax between two pins on the incident ray and first pin on the refracted ray. Hummer first pin.
5) Repeat point 4) for the second pin on the refracted ray.
6) Remove all pins. 7) Draw normal and extension of the ray which passed the optical parallel (Fig. 4) 8) Measure right sides of the perpendicular triangles in order to calculate sin1 and sin1. 9) For the estimation sin1 measure side a and b. 10) For the estimation sin2 measure side c and d. 11) Calculate refractive index from the following equation
1,22
1
sin
sinn
(2)
Figure. 3. Prism. Top view of the experimental setup
Figure 4. Scheme of the sinuses of the incidence θ1 and the refraction θ2 angles estimation

Experiment nr 33 –Estimation of the refractive index of a material.
5 | P a g e
WORK TABLE When you finish your experiment:
1) Please ask teaching professor for checking all data 2) Your experimental data has to be signed by teaching professor. Report without
signature won’t be accepted then. TABLE 1. Refractive index estimation – work table
object
a b sin1 c d sin2 n
(m) (m) (m) (m)
optical parallel
prism

Experiment nr 33 –Estimation of the refractive index of a material.
6 | P a g e
NAME:
DATE of performing the experiment
SURNAME:
Department
Experiment 33 – REPORT
Topic: Refractive index estimation
TABLE 1. Refractive index estimation
object
a b sin1 c d sin2 n
(m) (m) (m) (m)
optical parallel
prism