labor productivity in spain: 1977-2002
TRANSCRIPT

1
Labor productivity in Spain: 1977-2002♦
Rosella Nicolini (Institut d’Anàlis Econòmica, CSIC)
November 2007
Abstract This study examines the evolution of labor productivity across Spanish regions during the period from 1977 to 2002. By applying the kernel technique, we estimate the effects of the Transition process on labor productivity and its main sources. We find that Spanish regions experienced a major convergence process in labor productivity and in human capital in the 1977-1993 period. We also pinpoint the existence of a transition co-movement between labor productivity and human capital. Conversely, the dynamics of investment in physical capital seem unrelated to the transition dynamics of labor productivity. The lack of co-evolution can be addressed as one of the causes of the current slowdown in productivity
Keywords: Labor productivity, employment, human capital, physical capital, Spanish regions.
JEL Classification: J24, N34, N940, O18, O52, R10
1. Introduction In the last three decades two important events have marked Spanish history: the end of General Franco’s dictatorship and the beginning of the transition period (1977) and entry into the European Community (1986). Both events entailed important transformations of Spanish society and, above all, of the economic structure of the country. In 1977, the relative weight of the agricultural sector in the Spanish economy was not at all negligible. Nowadays, Spain is a modern country with a clearly dominant service sector forming the core of the productive structure (see Table 1).
♦ I thank L. Artige, J. Mª Esteban and the participants in the XXXIII Reunión de Estudios Regionales for useful suggestions. I am also grateful to Michael Creel, Javier Valbuena and David Rodriguez for their technical assistance. A few parts of this study are based on the conclusions of a research project financed by the Institut d’Estudis Autònomics. R. Nicolini’s research is supported by a Ramón y Cajal contract and research grants 2005SGR00470 and SEJ2005-01427/ECON are gratefully acknowledged. Any others errors are my own responsibility.

2
Table 1 Distribution of employment and value added across sectors (%) (Source: CRENOS, EUROSTAT, Calculus: author) Employment/Population Value added 1977 1986 1993 2002 1977 1986 1993 2002 Agriculture 6.7 4.0 2.8 0.3 10.3 6.0 4.3 3.6 Industry 35.6 30.3 32.8 40.5 29.6 34.4 29.0 21.3 Services 14.3 16.0 19.6 25.5 59.8 59.6 66.6 75.1 The achievement of these results was made possible by a sequence of different social and economic changes. The modernization process involved important internal territorial dynamics. As discussed in de la Fuente (2002), a major economic convergence process took place across the Spanish regions mainly due to the combination of factor accumulation, technological diffusion and the human capital rate effect. The most prominent effect was a major reduction in regional inequality (measured as output level per employee). The catch-up process allowed Spain to benefit from a growth rate in real GDP terms that was almost always higher than the EU average. However, a striking feature occurs in Spanish development indicators (Table 2). Since 1995, the Spanish economy has experienced a positive growth rate along with a negative labor productivity growth rate. Table 2 Average annual growth rate of real GDP and labor productivity per hour worked (%) (Source: O’Mahony and van Ark, 2003) Real GDP Labor Productivity 1980-90 1990-95 1995-00 2000-02 1980-90 1990-95 1995-00 2000-02 Spain 2.9 1.5 3.8 2.2 3.0 2.3 -0.3 -0.4 EU 15 2.4 1.6 2.7 1.3 2.3 2.6 1.5 0.8 United States 3.2 2.4 4.0 1.3 1.4 1.1 2.0 1.7 This feature seems puzzling. Labor productivity, measured as real GDP per hour worked is the main source of economic growth (as real GDP growth). Over time, the two values should evolve alongside each other but this does not seem to be the case for Spain.1 Productivity gains take place when the production of good and services grows faster than the volume of work dedicated to production. In Spain, the simultaneous existence of a positive growth rate and a negative productive rate (from 1995 on) implies that the volume of work is growing more than production. The persistence of this phenomenon over time indicates that there is no proper justification for this lack of synchronism at this particular stage of the development process. This paper proposes an empirical study of the evolution of labor productivity across Spanish regions from 1977 to 2002. Our idea was to identify similarities or differences in the
1 In the long run, labor productivity is the primary determinent of improvements in the standard of living. In a general standard economic framework, labor productivity is a relatively good proxy for the whole productivity, given that labor makes a major contribution to total production (almost 70% in developed economies). Productivity growth corresponds to a higher GDP growth rate than variation in the hours worked.
3
evolutionary trends of labor productivity across Spanish regions by sector (industry and services) with respect to the corresponding determinants. Knowing that a convergence process took place across Spanish regions, the purpose was to explore the factors that triggered this movement and, eventually, the sector that drove it. The question we would like to ask is whether, by looking back at the historical evolution, the current situation could have been anticipated in some way and, starting from this point, formulate some considerations for the future. The importance of finding the causes for this mismatch between growth and productivity is fundamental for the sustainability of the future growth rate and, hence, for designing the right policies to continue fostering growth. Among the possible methods for suggesting an explanation, we opted to emphasize the historical method as the most suitable for understanding the present situation. We can interpret the present situation as being the progressive accumulation of events and dynamic movements of production factors over time. In line with O’Mahnoy and Van Ark (2003), we explore the possibility that the currently poor records for Spanish labor productivity can be associated to a lack (or a low rate) of investment in physical capital that has not been high enough to evolve properly with the growth rate of employment. In this study, we refer to Spanish regions as the main spatial unit of reference because of the transition dynamics they underwent. In this contribution we propose various novelties with respect to other existing studies. In order to exploit the historical dimension we built an original and homogeneous database by gathering data from 1977 onwards. Since the beginning of the Spanish transition, the country has experienced an evolution in its productive structure, and we consider that most of our attention should focus on the evolution of the labor productivity in each of the main sectors of the economy (namely industry and services). Unlike other studies, we propose an analysis of the evolutionary trends of labor productivity across Spanish regions using an indicator (by sector) of productivity per-hour worked accounting for the effects of the progressive reduction in hours worked experienced in Spanish regions. Finally, we apply the kernel technique to achieve better control of the transition movements over time, specifically the stochastic kernel technique. Stochastic kernel measures the probability of a region with a given productivity in one year achieving any other level of productivity in another (chosen) year. The major advantage of the nonparametric technique is that it does not assume a-priori any specific linear model. A pre-selected parametric model may be too restrictive to properly fit an unknown regression relationship. Our results confirm that there was a convergence of labour productivity across regions during the democratization period (as in Lamo, 2000), but the rate of evolution is different when comparing the transition period (1977-1986) with the two others (1986-1993) and (1995-2002). The analysis of the sources of productivity during the transition suggests that such dynamics are in keeping with the changes in the employment share and, above all, with the evolutionary path of the human capital (both in services and industry) rather than investments in physical capital. The reforms of the labour market that recently came into force helped to reduce the unemployment rate. Unfortunately, they led to the consolidation of the existing regional inequalities, interrupting the convergence process (1995-2002 period). The picture is completed by the neutrality of the effect of the investment in physical capital. The dynamics of this transition seem detached from those of labour productivity in Spain. As a consequence, the low labour productivity growth in Spain can be associated to a combination of the dynamics of its two main components: a high growth rate of human capital that is poorly supported by proper investments in physical capital. The mismatch between the dynamic

4
movements of these two factors had a major influence at the end of the convergence period that led to negative productivity growth rates. Therefore, the source of this negative performance is not precisely the general lack of investment in physical capital (as addressed, for instance, by O’Manhoy and van Ark, 2003), but the lack of investment in the regions that recorded a higher level of growth in human capital. This study is organized as follows. Section 2 focuses on the evolution of labor productivity in Spain in the two main sectors: industry and services. Sector 3 proposes an analysis of the transitional dynamics of a selection of factors related to labor productivity and, finally, Section 4 presents our conclusions.
2. Labor productivity: industry and services In recent times, the study of labor productivity has become the focus of major interest due to one important factor: US productivity is growing at a rapid rate while Europe is failing to reap the same productivity gains as the US. Blanchard (2004) argues that in the US, labor productivity is higher because the average person works more, while in the EU there has been a constant reduction in the number of hours worked. The same problem is discussed in O’Mahony and van Ark (2003) who point out that the lack of investment in the EU along with some specific labor market reforms have affected productivity performances. Reforms aimed at improving the flexibility of the market have deliberately been the creation of jobs (such as part time jobs or temporary contracts) mostly in job-intensive sectors, allowing more unskilled and inexperienced workers to enter the workforce. The combination of all these factors (along with a general reduction in the average hours worked) has decreased the output per worker. Moreover, the rigidity of the European capital market has made investment in physical capital (especially in new technology) less attractive, and hence prevents firms from taking advantage, for instance, of information technologies.2 Martinez Serrano (2004) proposes a decomposition of the different factors affecting the changes in labor productivity (considered productivity per hour worked) in Spain. He provides a study that concentrates on Spanish regions in order to evaluate to what extent each of these are affected by the sluggish productivity. As in Esteban (1994), Martinez Serrano detects a convergence of labor productivity across regions, mostly due to labor mobility. Looking at different sub periods from 1965 to 1998, the trend towards the convergence of labor productivity is principally produced by labor mobility, while an interpretation of the role of physical capital is less clear. In general, the mobility factor in Spain was responsible for the convergences experienced from 1965 to 1975 and 1975 to 1985 but it has not played any role in more recent years.3 We provide empirical evidence of the trend towards convergence in terms of labor productivity by ranking the Spanish regions by their value of labor productivity in 1977 and 2002.
2 This is the same kind of conclusion as that reached in a study by Dew-Becker and Gordon (2006). 3 If labour productivity is associated to other factors, such as, for instance, human capital, a convergence process can be targeted either by mobility of high qualified workers or by improving the regional endowments of human capital.

5
The data is shown in table 3. Unfortunately the two series are not mutually comparable because they were computed according to different sources. However, convergence is indicated by two details. From 1977 to 2002, the order of the classification varies along with the reduction in the standard deviation (more than 10% of the average value in 1977 to less than 10% in 2002). Table 3: Value of Labor productivity per hour worked (Source: CRENOS and EUROSTAT, calculus: author)
1977 pps 2002 € GALICIA 7.0 EXTREMADURA 18.5 EXTREMADURA 7.7 CASTILE-LA MANCHA 19.2 ASTURIAS 9.1 GALICIA 20.1 CASTILE-LEON 9.3 MURCIA (Region of) 20.7 CANTABRIA 9.4 ANDALUSIA 21.2 CASTILE-LA MANCHA 9.4 VALENCIAN COMMUNITY 21.4 MURCIA (Region of) 9.8 CASTILE-LEON 22.1 ANDALUSIA 10.0 ARAGON 22.2 ARAGON 10.0 CANTABRIA 22.4 RIOJA (La) 10.2 RIOJA (La) 22.5 VALENCIAN COMMUNITY 10.3 CANARIES 22.5 CANARIES 10.3 ASTURIAS 23.3 NAVARRE (Ch. Comm. of) 10.9 NAVARRE (Ch. Comm. of) 23.5 CATALONIA 10.9 BALEARIC (Islands) 23.6 BASQUE COUNTRY 11.3 CATALONIA 24.2 BALEARIC (Islands) 12.5 MADRID (Community of) 26.0 MADRID (Community of) 12.9 BASQUE COUNTRY 26.7 Mean 10.6 Mean 22.4 Std. Dev 1.47 Std. Dev 2.16 Min 7.0 Min 18.5 Max 12.9 Max 26.7 Value: Total VA (pps) Value: Total VA (€) constant value (1985=100) constant value (1995=100)
Once we had accounted for the existence of the convergence trend, our first exercise consisted of identifying the contribution of the industry and service sectors to labor productivity growth. We selected the productivity per hour worked as an indicator of labor productivity. We computed it as the ratio between the value added (at constant prices) and the product between the total employment and the average hours worked.4 In this way we are able to control for possible regional effects due to a difference in working time.
4 Since 1994 the statistics for hours worked by region have been published by the Insituto Nacional de Estadistica (INE). Statistics for hours worked from 1977 to 1994 have been calculated on the basis of data included in Carreras (2005).

6
Table 4: Correlation between labor productivity (total, industry and service sectors) (average annual growth) (Source: Eurostat, INE, Crenos database – Calculus authors). 5
| p7786 p8693 p9502 -------------+------------------------------ pi7786 | 0.2114 | 0.4153 | pi8693 | 0.5147** | 0.0345 | pi9502 | -0.3864 | 0.1255 | ps7786 | 0.6268*** | 0.0071 | ps8693 | 0.4711* | 0.0563 ps9502 | 0.1056 | 0.6866
The previous table presents the results of the correlation coefficient (and their statistical significance) for total labor productivity, labor productivity in services and in industry for the three sub-periods. The 1977-1986 period coincides with the transition to democracy, the period from 1986-1993 starts with the entry of Spain into the European Community and the last one (1995 –2002) corresponds to the most recent years. This exercise aims to determine the possible association between the variations in productivity in different sectors. Of course, the simple nature of this exercise prevents us from making any suggestions about the causality among the different variables, but it does provide some interesting insights. There is a clear positive and statistically significant correlation between the growth rate of total labor productivity and labor productivity in services during the transition era. This finding confirms the conclusions addressed in a study by Moluquer de Motes et al. (2005), in which the authors show that during its development, Spain moved directly from being an agricultural to a service economy without passing through the pure industrial phase. This relation was reinforced in the next period when the growth in labor productivity in industry also resulted positive and statistically significant. This result is not surprising if we associate it with Spain’s entry into the European Community (1986), which triggered a general and strong improvement in productivity in Spain.
3. Dynamics of regional productivity in Spain
A highly efficient way of examining variations in labor productivity across regions (at different points in time) is by estimation of univariate kernel density functions.6 Kernel density is a non-parametric technique that makes it possible to compute the density of a
5 Legend: pXXYY : Average annual growth of labor productivity per hour worked during the period from year XX to year YY piXXYY : Average annual growth of labor productivity per hour worked in industry during the period from year XX to year YY psXXYY : Average annual growth of labor productivity per hour worked in services during the period from year XX to year YY In italics: Probabilities from t test on each correlation . ( ***1%, ** 5%, * 10% level of significance). Software: STATA 6 See Appendix for technical details. The univariate kernel density function was computed with Eviews 5.0 software.

7
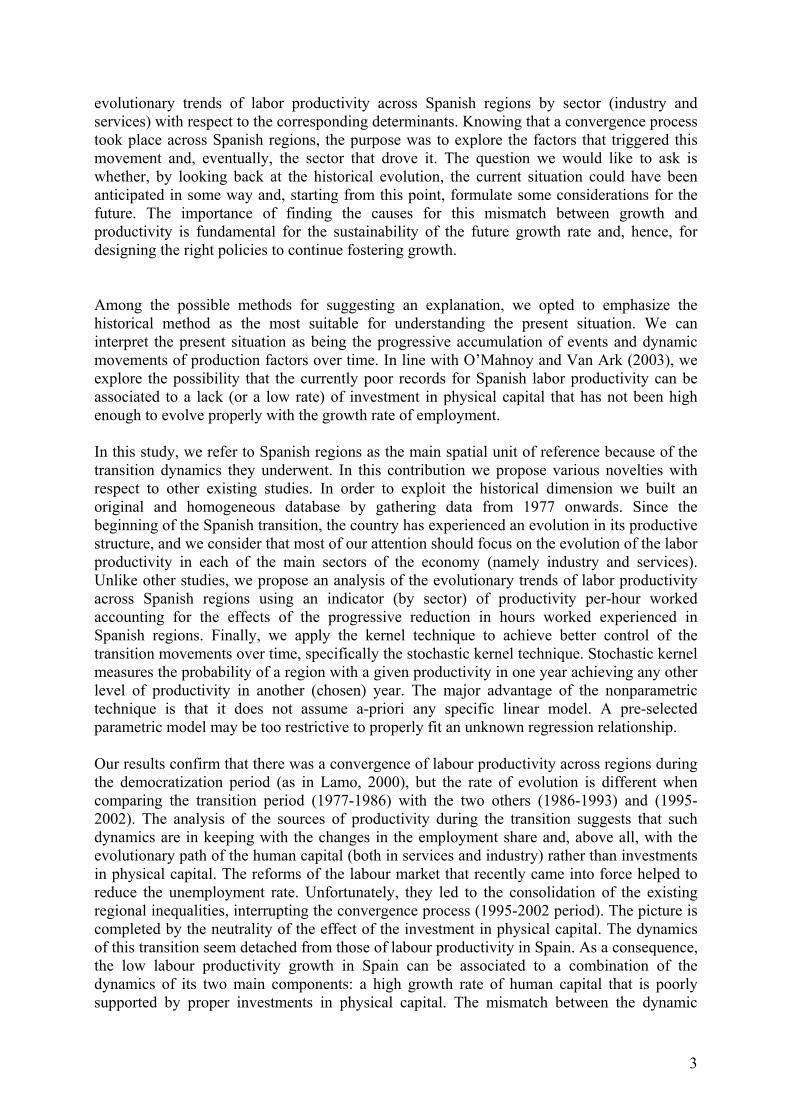
function through the frequency data that appears in a sample. The main advantage of this technique is that it does not build on a pre-defined functional form and works in continuous space. Because of the small sample we had, we computed the kernel density function using the Gaussian kernel function with the Silverman bandwidth selection criterion. This technique makes it possible to perform complete statistics by simultaneously accounting for the evolution of one observation (here regions) in association with the dynamics of the remaining components of the sample. Hence, at a glance, we are able to simultaneously control the transition of the full sample. We compute the kernel density for total labor productivity, labor productivity in industry and in services in 1977 and 2002. In 1977, all the kernel densities exhibited a somewhat unequal level of labour productivity across Spanish regions. In industry, there was a clear polarization at the centre of the distribution (around value 8), while in services there appears to have been a double-peak estimation; the high peak is on the right side of the distribution and the other is at the extreme left. In other words, in 1977, the service sector in Spain was characterized by major inequality, with the most of the regions polarized around the lower level of the distribution. Twenty-five years later, the kernel functions reveal that a convergence process across regions has taken place. The corresponding functions for industry and services are more uniformly distributed than in 1977, even though some residual peaks still persist. 3.1 Stochastic kernel The stochastic kernel technique is complementary to the previous one and is used to control the transition path of a variable from one status to another. As argued by Lamo (2000), the stochastic kernel involves some technical advantages in the case of a cross section matrix. Studying the entire cross section distribution dynamics encodes the standard approaches and overcomes some of the difficulties; it does not suffer from Galton’s fallacy. It does not impose any structure on the data: its robustness does not depend on model specification. It does not require the imposition of any assumption regarding the exterior shape or the moments of the density function from which the data are drawn. The method introduced by Quah (1997 and 2006) is highly intuitive. Let λt be the probability measures (one each year) associated with the cross-section distribution. A simple way of modelling this dynamic is using the following probability model:
)(* ,1 ttt uT −= λλ which is analogous to a first order auto regression model in time series. By ignoring the disturbance and iterating it, it can be written as:
tS
st T λλ *)(=+ As s goes to infinity it is possible to characterize the long run distribution of the variable across the economies. T* maps probability measures into probability measures, for instance, giving information on whether the variables get closer. T* must be estimated from the data. Approximating T* by assuming a discrete state-space is misleading because there is no optimal criterion to define a grid. However, it is possible to construct a time-variant transition matrix by fixing the probability vectors (λt) to be uniform and identical for each point and
8
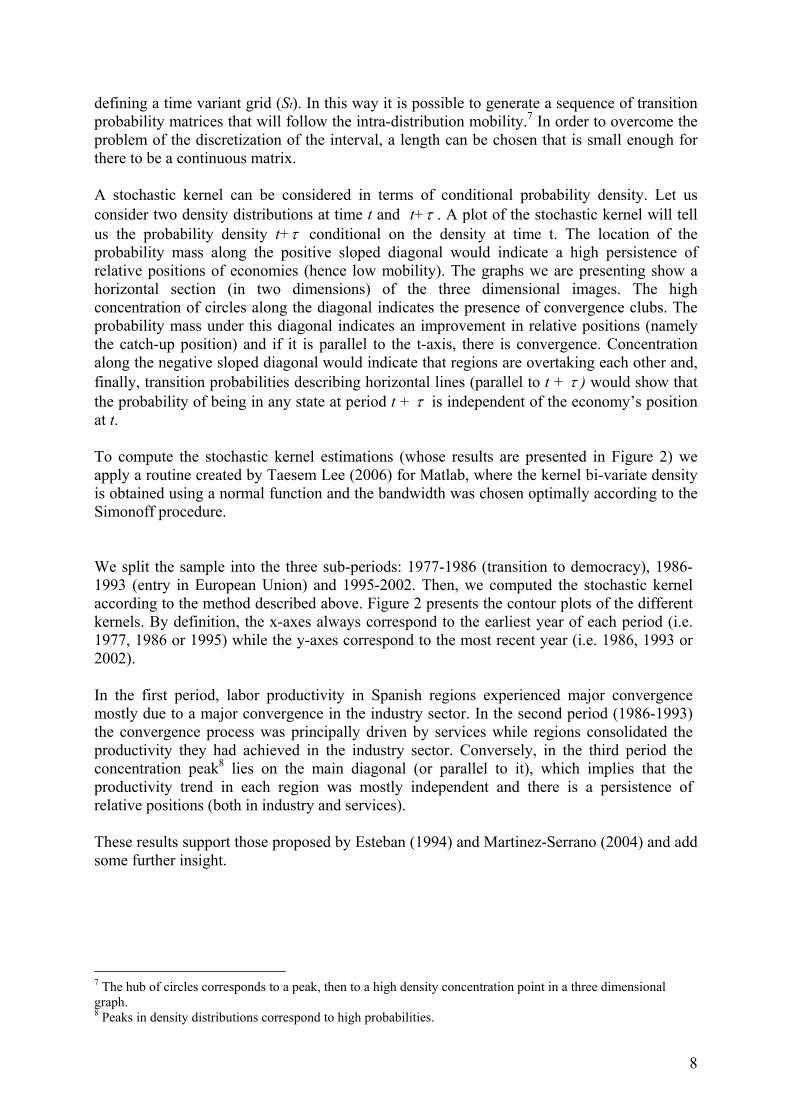
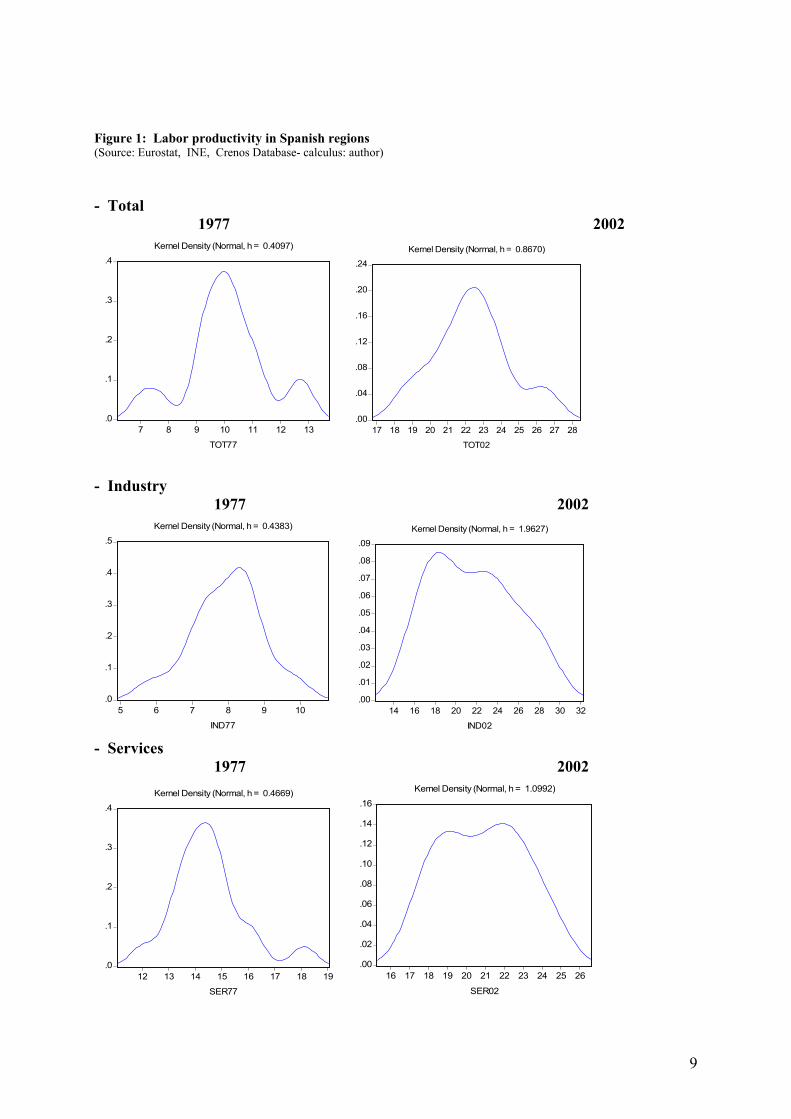
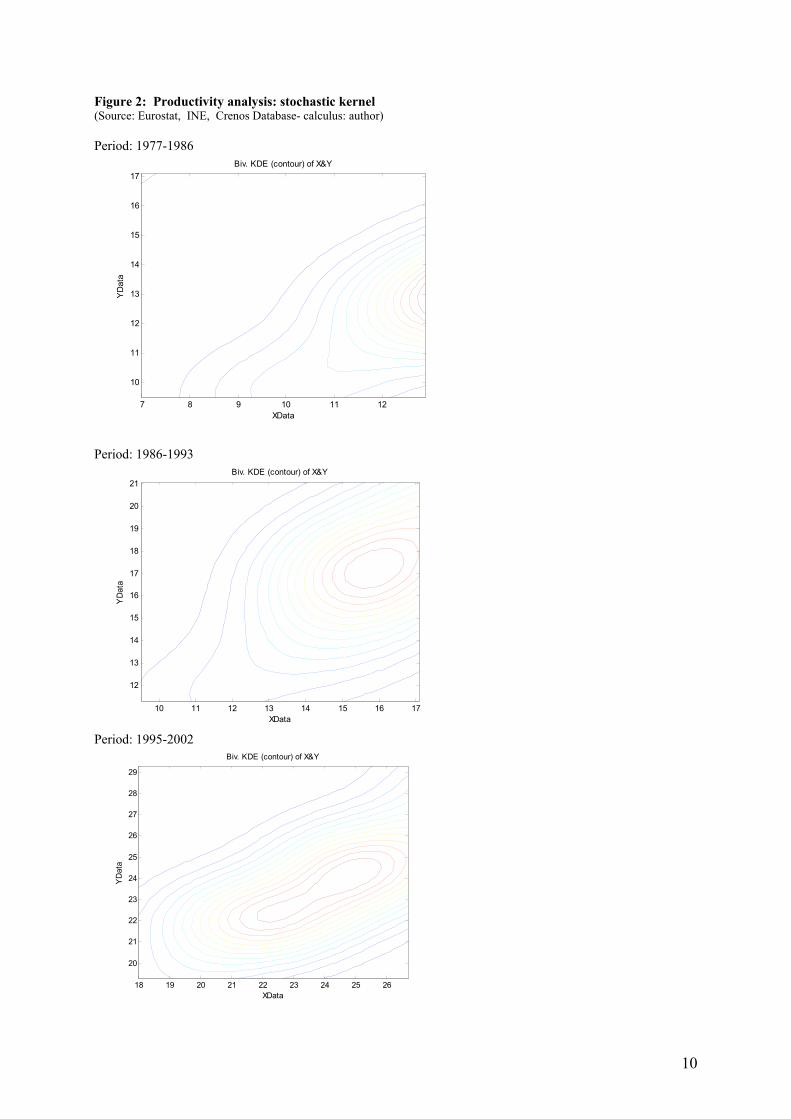
defining a time variant grid (St). In this way it is possible to generate a sequence of transition probability matrices that will follow the intra-distribution mobility.7 In order to overcome the problem of the discretization of the interval, a length can be chosen that is small enough for there to be a continuous matrix. A stochastic kernel can be considered in terms of conditional probability density. Let us consider two density distributions at time t and t+τ . A plot of the stochastic kernel will tell us the probability density t+τ conditional on the density at time t. The location of the probability mass along the positive sloped diagonal would indicate a high persistence of relative positions of economies (hence low mobility). The graphs we are presenting show a horizontal section (in two dimensions) of the three dimensional images. The high concentration of circles along the diagonal indicates the presence of convergence clubs. The probability mass under this diagonal indicates an improvement in relative positions (namely the catch-up position) and if it is parallel to the t-axis, there is convergence. Concentration along the negative sloped diagonal would indicate that regions are overtaking each other and, finally, transition probabilities describing horizontal lines (parallel to t + τ ) would show that the probability of being in any state at period t + τ is independent of the economy’s position at t. To compute the stochastic kernel estimations (whose results are presented in Figure 2) we apply a routine created by Taesem Lee (2006) for Matlab, where the kernel bi-variate density is obtained using a normal function and the bandwidth was chosen optimally according to the Simonoff procedure. We split the sample into the three sub-periods: 1977-1986 (transition to democracy), 1986-1993 (entry in European Union) and 1995-2002. Then, we computed the stochastic kernel according to the method described above. Figure 2 presents the contour plots of the different kernels. By definition, the x-axes always correspond to the earliest year of each period (i.e. 1977, 1986 or 1995) while the y-axes correspond to the most recent year (i.e. 1986, 1993 or 2002). In the first period, labor productivity in Spanish regions experienced major convergence mostly due to a major convergence in the industry sector. In the second period (1986-1993) the convergence process was principally driven by services while regions consolidated the productivity they had achieved in the industry sector. Conversely, in the third period the concentration peak8 lies on the main diagonal (or parallel to it), which implies that the productivity trend in each region was mostly independent and there is a persistence of relative positions (both in industry and services). These results support those proposed by Esteban (1994) and Martinez-Serrano (2004) and add some further insight.
7 The hub of circles corresponds to a peak, then to a high density concentration point in a three dimensional graph. 8 Peaks in density distributions correspond to high probabilities.
9
Figure 1: Labor productivity in Spanish regions (Source: Eurostat, INE, Crenos Database- calculus: author) - Total 1977 2002
.0
.1
.2
.3
.4
7 8 9 10 11 12 13
TOT77
Kernel Density (Normal, h = 0.4097)
.00
.04
.08
.12
.16
.20
.24
17 18 19 20 21 22 23 24 25 26 27 28
TOT02
Kernel Density (Normal, h = 0.8670)
- Industry 1977 2002
.0
.1
.2
.3
.4
.5
5 6 7 8 9 10
IND77
Kernel Density (Normal, h = 0.4383)
.00
.01
.02
.03
.04
.05
.06
.07
.08
.09
14 16 18 20 22 24 26 28 30 32
IND02
Kernel Density (Normal, h = 1.9627)
- Services 1977 2002
.0
.1
.2
.3
.4
12 13 14 15 16 17 18 19
SER77
Kernel Density (Normal, h = 0.4669)
.00
.02
.04
.06
.08
.10
.12
.14
.16
16 17 18 19 20 21 22 23 24 25 26
SER02
Kernel Density (Normal, h = 1.0992)
10
Figure 2: Productivity analysis: stochastic kernel (Source: Eurostat, INE, Crenos Database- calculus: author) Period: 1977-1986
YD
ata
XData
Biv. KDE (contour) of X&Y
7 8 9 10 11 12
10
11
12
13
14
15
16
17
Period: 1986-1993
YD
ata
XData
Biv. KDE (contour) of X&Y
10 11 12 13 14 15 16 17
12
13
14
15
16
17
18
19
20
21
Period: 1995-2002
YD
ata
XData
Biv. KDE (contour) of X&Y
18 19 20 21 22 23 24 25 26
20
21
22
23
24
25
26
27
28
29

11
Figure 3: Productivity analysis in industry: stochastic kernel (Source: Eurostat, INE, Crenos Database- calculus: author) Period: 1977-1986
YD
ata
XData
Biv. KDE (contour) of X&Y
6 6.5 7 7.5 8 8.5 9 9.5
12
13
14
15
16
17
18
Period: 1986-1993
YD
ata
XData
Biv. KDE (contour) of X&Y
12 13 14 15 16 17 18
14
16
18
20
22
24
Period: 1995- 2002
YD
ata
XData
Biv. KDE (contour) of X&Y
16 17 18 19 20 21 22 23 24 25
18
20
22
24
26
28
12
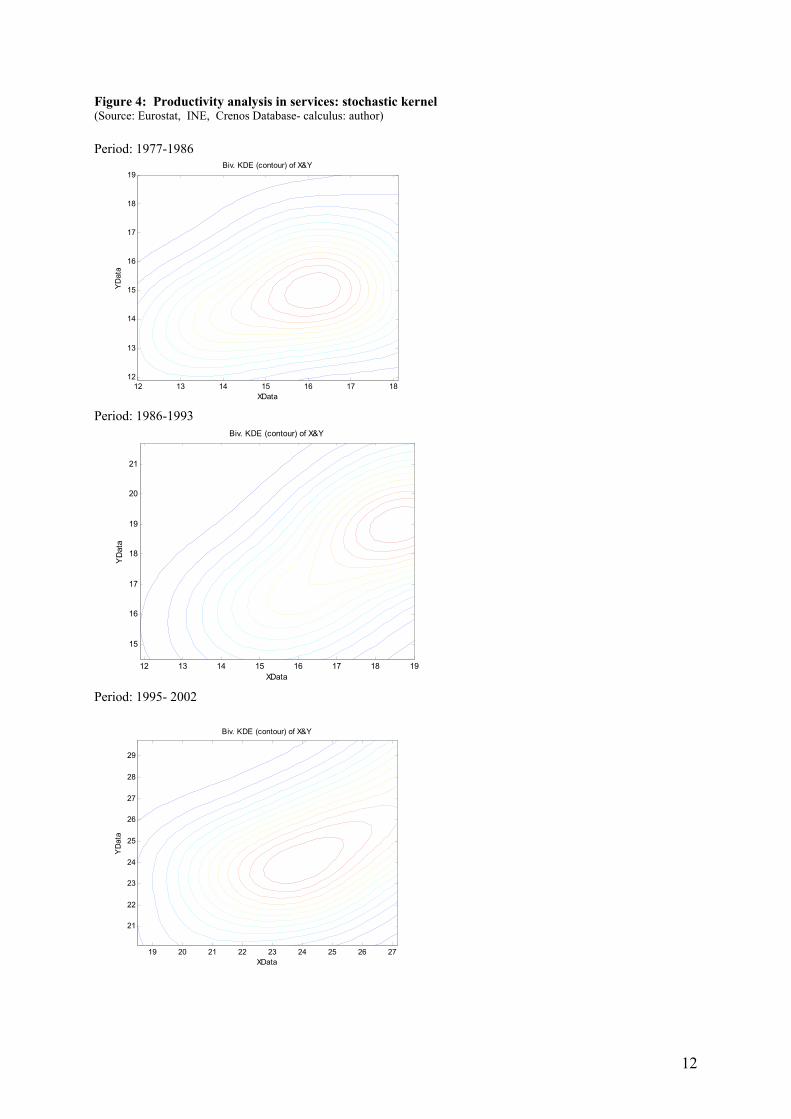
Figure 4: Productivity analysis in services: stochastic kernel (Source: Eurostat, INE, Crenos Database- calculus: author) Period: 1977-1986
YD
ata
XData
Biv. KDE (contour) of X&Y
12 13 14 15 16 17 1812
13
14
15
16
17
18
19
Period: 1986-1993
YD
ata
XData
Biv. KDE (contour) of X&Y
12 13 14 15 16 17 18 19
15
16
17
18
19
20
21
Period: 1995- 2002
YD
ata
XData
Biv. KDE (contour) of X&Y
19 20 21 22 23 24 25 26 27
21
22
23
24
25
26
27
28
29
13
Once this major association had been obtained, our next step was to study whether the same kind of dynamics could be also found in the evolutionary path of factors (like employment and physical capital) that are expected to influence labor productivity. The major convergence in industry during the transition was a consequence of the restructuring process of the productive system fostered by the tendency to transform into an open market economy The main effect was a more equal spread of industrial activities across regions and, then, a corresponding reduction in the polarized distribution in the 70s. It was only after having completed this redistribution process that productivity in industry exerted a statistically significant impact on the total level of productivity. Conversely, the convergence in services seems to have been delayed. Services are activities with major territorial linkages and are mostly non-tradable goods. The convergence phase coincided with Spain’s accession to the European Economic Community (EEC). It was mostly boosted by the need to meet the standard requirements fixed by the EEC and this entailed a process of making services more dynamic across the Spanish territory. 4. The productivity components In the standard economic literature, it is a common practice to assume a Cobb-Douglas function as the aggregate production function. In this form, the regional output is obtained as a weighted combination of different production factors such as employment, physical capital and human capital. In this type of setting, labor productivity (per hour worked) is computed as the ratio between the regional output and the product of the regional employment by the total hours worked (yearly) by employees. The productivity of labor increases when the labor force acquires new skills (investment in human capital). The productivity of physical capital increases with the quantity and the quality of capital. The complementarity between human capital and physical capital is often essential to yield improvements in efficiency. To that end, we will proceed by analyzing separately the transition dynamics of employment, physical and human capital in services and industry. Then, we will compare them with the dynamics of labor productivity by sector. 4.1 Physical capital The complementarity between human capital and physical capital is essential for economic growth (Boldrin and Canova, 2001), and thus productivity. In recent years, the growth rate of GFCF (gross fixed capital formation) per unit of employment (excluding construction) has been significantly high in Spain with respect to other EU countries (see Table 9). This confirms a certain effort deployed by Spanish entrepreneurs to better the available technology to (finally) improve productivity

14
Table 5: GFCF per unit per of employment: growth rate (%) (Source: EUROSTAT – Calculus: author)
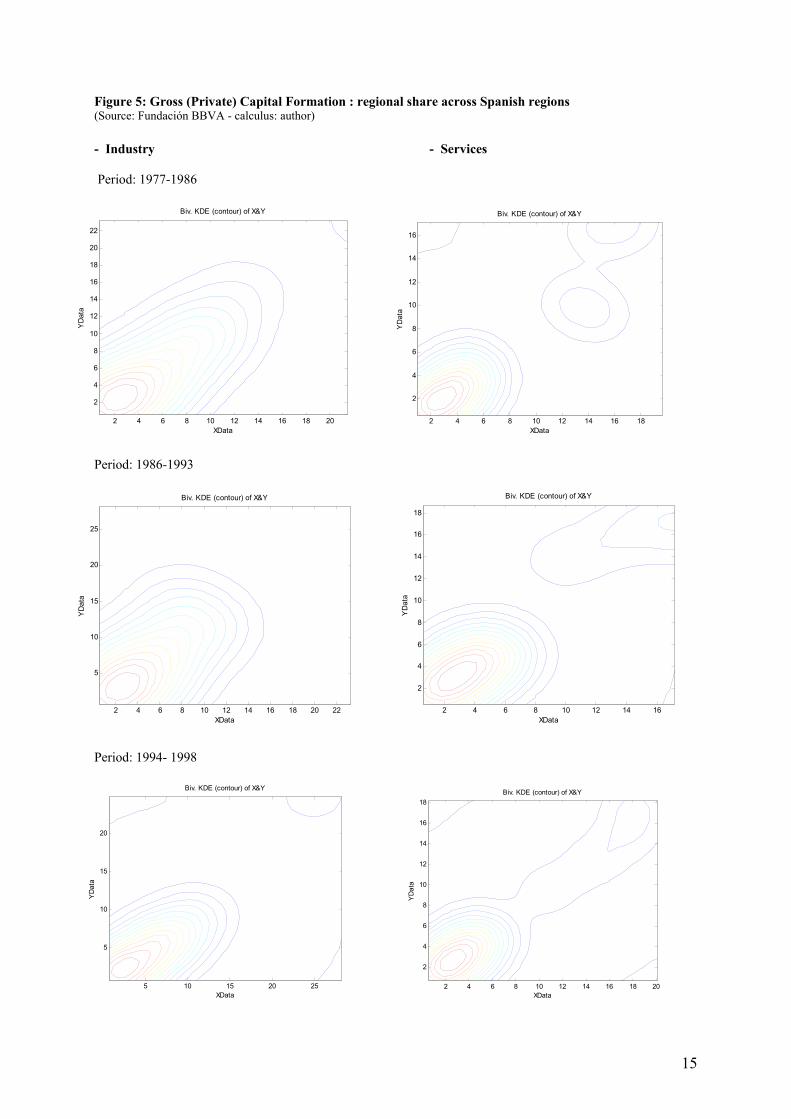
A highly crucial point is to assess whether these investments either helped fill the gap across regions (in terms of productivity) or enhanced polarization. We replicate the stochastic kernel exercise with data on private investment (provided by the Fundación BBVA, Banco Bilbao Vizcaya Argentaria). We consider the formation of private capital stock in industry and services in the three available sub-periods: 1977-1986, 1986-1993 and 1994-1998 (Figure 5). Throughout the period, private investment has been heavily polarized both in services and industry. The transition dynamics in industry show a single peak along the main diagonal, hence a regional dynamic that mostly reinforces the given positions. In services, the shape of the kernel distribution emphasizes the existence of a double peak function that persists over time, since the transition dynamics show that the two peaks always settle along the main diagonal.
Average Annual Growth
(1995-2002) (%)
Spain 3,7 France 2.2 Germany -1.5 Italy 5.5
15
Figure 5: Gross (Private) Capital Formation : regional share across Spanish regions (Source: Fundación BBVA - calculus: author)
- Industry - Services Period: 1977-1986
YD
ata
XData
Biv. KDE (contour) of X&Y
2 4 6 8 10 12 14 16 18 20
2
4
6
8
10
12
14
16
18
20
22
YD
ata
XData
Biv. KDE (contour) of X&Y
2 4 6 8 10 12 14 16 18
2
4
6
8
10
12
14
16
Period: 1986-1993
YD
ata
XData
Biv. KDE (contour) of X&Y
2 4 6 8 10 12 14 16 18 20 22
5
10
15
20
25
YD
ata
XData
Biv. KDE (contour) of X&Y
2 4 6 8 10 12 14 16
2
4
6
8
10
12
14
16
18
Period: 1994- 1998
YD
ata
XData
Biv. KDE (contour) of X&Y
5 10 15 20 25
5
10
15
20
YD
ata
XData
Biv. KDE (contour) of X&Y
2 4 6 8 10 12 14 16 18 20
2
4
6
8
10
12
14
16
18

16
By comparing the transition dynamics of physical capital with those of productivity, it is possible to conclude that the evolution of the investment in physical capital follows the same path in industry and services but is quite independent from the evolution of labor productivity across Spanish regions. Put differently, the convergence process experienced by labor productivity in the sub-periods 1977-1986 and 1986-1993 cannot be found in the transition dynamics of physical capital as a source of it. 4.2 Employment and human capital There is a general consensus in considering human capital (meaning the share of employment with a higher education degree) to be the most important factor to have an impact on the evolution of labor productivity in Spain (see for instance de la Fuente (2002)). Table 6: Average annual growth rate in employment by sector (%) (Source: EUROSTAT – calculus: author)
Industry
Services
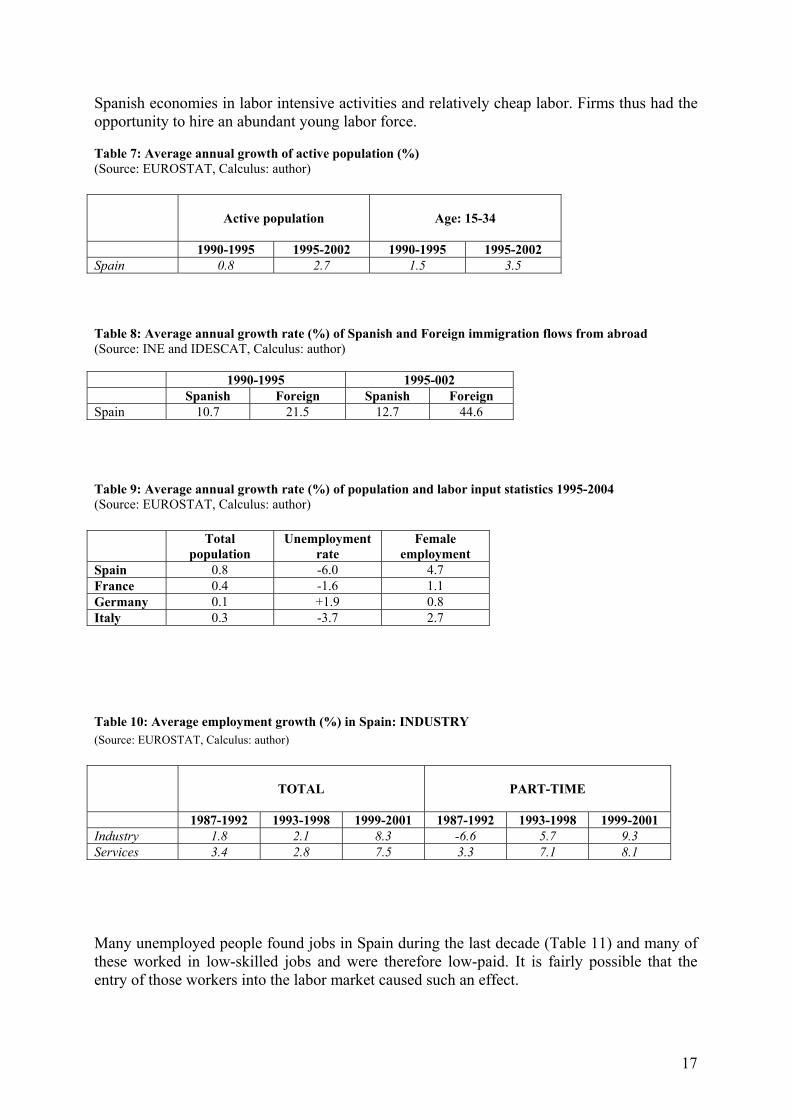
1990-1995 1995-2001 1990-1995 1995-2001 Spain -2.9 5.4 1.2 5.0 This hypothesis is backed by the concomitance of three important circumstances. In the mid 1970s, a liberalization process took place in the Spanish labor market. Yet, between 1975 and 1985, Spain experienced a wave of job destruction induced by the economic transition process. In 1986, the employment rate started growing at a high pace and between 1991 and 1996 Spain again suffered from a period of job destruction until 1996. From 1996 onwards, employment has risen sharply. As far as the distribution of the employment across the four largest sectors (agriculture, industry, construction and services) is concerned, employment in industry and in construction never dominate the level of employment of the other sectors. This implies that Spain moved directly from agriculture to services without passing through the pure industrial phase (Moluquer de Motes and Llonch, 2005). Throughout these years, the Spanish government implemented two important reforms. In 1984 part-time contracts were introduced to foster job creation. A second important reform of the labor market came into force in 1994. This reform introduced the possibility of exploiting part time contracts in a more flexible way by admitting fewer limitations on the maximum number of working hours (Moluquer de Motes and Llonch, 2005). This new type of contract reduced the average length of the working day. This was due to the major increase in the number of part-time workers, and the service sector experienced the biggest reduction. (Sanso Frago et al., 2004) In the 1990s, as shown in Table 6, Table 7, Table 8, Table 9 and Table 10, Spain recorded a peculiar demographic growth rate in relation to the European average. The growth of its active population, driven by the entry of many young cohorts, women and foreign workers into the labor market, was much higher than in its European neighbors and explains why its labor market was much more dynamic. The final circumstance was the specialization of
17
Spanish economies in labor intensive activities and relatively cheap labor. Firms thus had the opportunity to hire an abundant young labor force. Table 7: Average annual growth of active population (%) (Source: EUROSTAT, Calculus: author)
Active population
Age: 15-34
1990-1995 1995-2002 1990-1995 1995-2002 Spain 0.8 2.7 1.5 3.5 Table 8: Average annual growth rate (%) of Spanish and Foreign immigration flows from abroad (Source: INE and IDESCAT, Calculus: author) 1990-1995 1995-002 Spanish Foreign Spanish Foreign Spain 10.7 21.5 12.7 44.6 Table 9: Average annual growth rate (%) of population and labor input statistics 1995-2004 (Source: EUROSTAT, Calculus: author) Total
population Unemployment
rate Female
employment Spain 0.8 -6.0 4.7 France 0.4 -1.6 1.1 Germany 0.1 +1.9 0.8 Italy 0.3 -3.7 2.7
Table 10: Average employment growth (%) in Spain: INDUSTRY (Source: EUROSTAT, Calculus: author)
TOTAL
PART-TIME
1987-1992 1993-1998 1999-2001 1987-1992 1993-1998 1999-2001 Industry 1.8 2.1 8.3 -6.6 5.7 9.3 Services 3.4 2.8 7.5 3.3 7.1 8.1 Many unemployed people found jobs in Spain during the last decade (Table 11) and many of these worked in low-skilled jobs and were therefore low-paid. It is fairly possible that the entry of those workers into the labor market caused such an effect.

18
Table 11 Unemployment rate (%) (Source: EUROSTAT – calculus: author)
Unemployment rate
Variation in unemployment rate (%)
1990 1995 2002 1990-1995 1995-2002 Spain 16.4 22.8 11.5 6.6 -9.8 As one would expect from the analysis of these stylized facts, there is a clear trend of negative (when statistically significant) correlation between labor productivity and the share of employment both in services and in industry (Table 12). This is precisely what is shown in Table 12. The expected negative correlation is statistically significant in recent times in industry while in services they are statistically significant both in the transition period (1977-1986) and in the final period (1995-2002). Table 12: Correlation between labor productivity and share of employment in industry and services (Source: Eurostat, Crenos Database – Calculus author). 9
Industry | pi7786 pi8693 pi9502 ------------+----------------------------- | ei7786 | -0.2420 | 0.3494 | ei8693 | -0.7868*** 0.0002 | ei9502 | -0.7706*** | 0.0003 Services | ps7786 ps8693 ps9502 -------------+----------------------------- | es7786 | -0.6636** | 0.0037 | es8693 | -0.1361 | 0.6025 | es9502 | -0.5582** | 0.0199
9 Legend: piXXYY : Average annual growth of labor productivity per hour worked in industry during the period from year XX to year YY eiXXYY : Average annual growth of share of employment in industry during the period from year XX to year YY psXXYY : Average annual growth of labor productivity per hour worked in services during the period from year XX to year YY esXXYY : Average annual growth of share of employment in services during the period from year XX to year YY In italics: Probabilities from t test on each correlation . ( ***1%, ** 5%, * 10% level of significance) Software: STATA

19
These results are confirmed by the kernel statistics. The univariate kernel concerning the distribution of employment across sectors (Figure 6) indicates a progressive reduction in the share of employment in industry and an increase in services (as in Moluquer de Motes et al. 2005). The shape of the kernel function in industry was more uniform in 2002 than it was in 1977, while that of services maintains major polarization to the left of the distribution. The inequality across regions in terms of the share of employment in services persists over time. This factor unveils an underpinning asymmetry in the two sectors. Therefore, one could reasonably expect such a difference to have driven to some extent the difference in the evolutionary paths of employment in the two sectors across regions. Figure 6 : Share of employment in Spanish regions (Source: Eurostat, INE, Crenos Database- calculus: author) - Industry 1977 2002
.00
.01
.02
.03
.04
.05
20 30 40 50 60
EMPLIN77
Kernel Density (Normal, h = 3.8682)
.00
.01
.02
.03
.04
.05
.06
.07
.08
.09
20 24 28 32 36 40
EMPLIN02
Kernel Density (Normal, h = 2.2631)
- Services 1977 2002
.00
.01
.02
.03
.04
.05
.06
.07
25 30 35 40 45 50 55 60 65
EMPLSER77
Kernel Density (Normal, h = 2.7154)
.00
.01
.02
.03
.04
.05
.06
.07
44 48 52 56 60 64 68 72 76 80
EMPLSER02
Kernel Density (Normal, h = 2.3686)

20
Figure 7: Employment share: stochastic kernel (Source: Eurostat, INE, Crenos Database- calculus: author)
- Industry - Services Period: 1977-1986
YD
ata
XData
Biv. KDE (contour) of X&Y
25 30 35 40 45 50 55
20
25
30
35
40
45
YD
ata
XData
Biv. KDE (contour) of X&Y
30 35 40 45 50 55
40
45
50
55
60
65
70
Period: 1986-1993
YD
ata
XData
Biv. KDE (contour) of X&Y
20 25 30 35 40 45
20
25
30
35
40
YD
ata
XData
Biv. KDE (contour) of X&Y
40 45 50 55 60 65 70
50
55
60
65
70
75
Period: 1995- 2002
YD
ata
XData
Biv. KDE (contour) of X&Y
18 20 22 24 26 28 30 32 34
24
26
28
30
32
34
YD
ata
XData
Biv. KDE (contour) of X&Y
45 50 55 60 65 7045
50
55
60
65
70
75

21
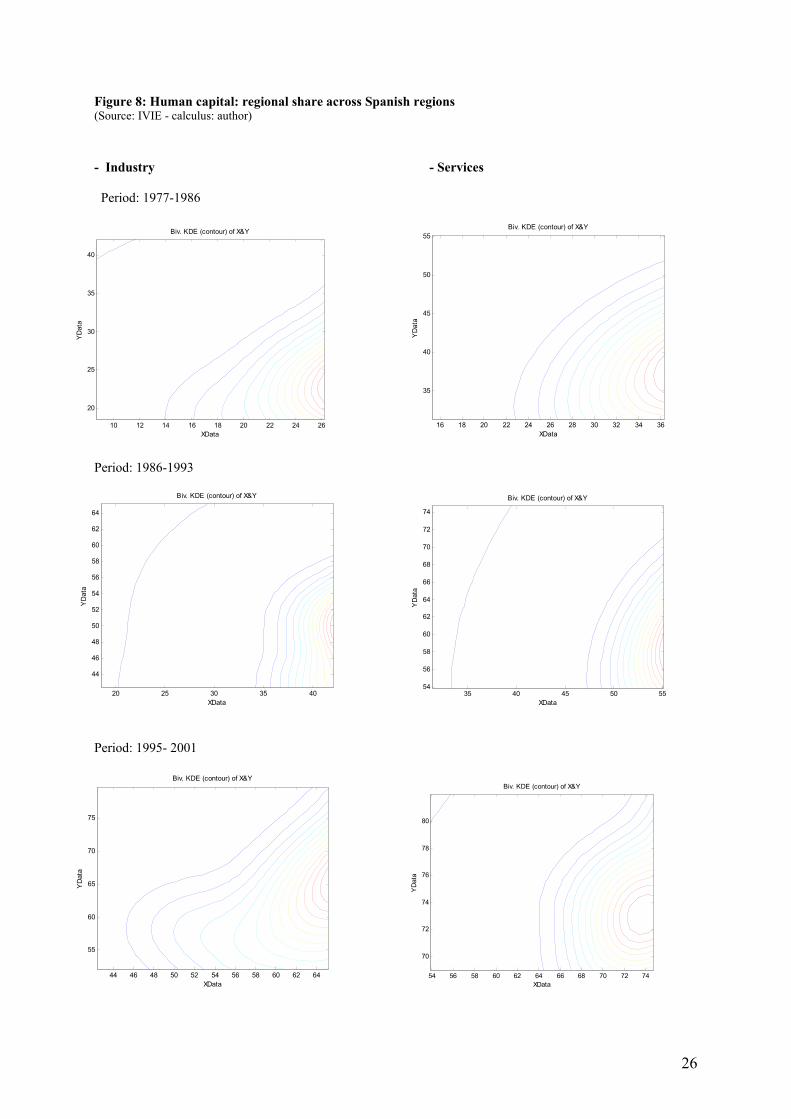
The stochastic kernels focusing on the transition of the share of employment in the three sub-periods (chosen using the same criterion as before) stress two tendencies (Figure 7): i) The evolution of the share of employment in industry follows a path in which each region maintains its relative position in time (the concentration peak lies on the main diagonal or is close to it) by creating a large convergence club. ii) The transition of the share of employment in services is mostly independent from the initial status for Spanish regions in the period between 1977-1993, while two convergence clubs appear in the most recent period. Once again, our results appear to be comparable with the findings of Esteban (1994, 1996), Martínez Serrano (2004) and Lamo (2000). They all support the idea that labour mobility was mostly responsible for the convergence process until 1985, while nowadays it does not play any role. However, our analysis refines this outcome: this dynamic holds for the industry sector, while in services there is no clear-cut pattern that can be taken as a reference. 4.2.2 Human capital Human capital is generally considered to be one of the engines of economic growth and productivity. It is one of the mechanisms that fosters convergence between regions or countries. Boldrin and Canova (2001) widely discuss the dynamic causation: education and training (of workers) raise labor productivity and help to create a more skilled labor force. The increase in labor productivity (especially in poor regions) attracts private investments, fosters job creation and increases the level of GDP per capita in the long run. During the Franco era the educational level of the Spanish population decreased due to a decreasing share of people receiving primary education. In the first ten years of the Franco regime, there was a clear tendency to neglect compulsory elementary education and foster higher education. This policy has had long-term effects since it is now widely admitted in human capital literature that the economic impact of elementary education is much stronger than higher education. This policy also led to important regional differences in education levels in Spain which were only recently reduced by internal migration flows. Regions hosting less immigration (such as Andalusia and Extremadura) experienced minor changes in the stock of human capital, while others such as Catalonia enjoyed major positive effects from migration (Nuñez, 2005). Nowadays, if we compare the Spanish level of education with the other EU countries, its human capital is unequally composed. There is still a large number of people with a higher education degree although the average level of education remains low. To analyze the transition dynamics of human capital in Spain, we use the stochastic kernel instrument and apply it to the evolution of the employment share with high-medium degrees in industry and services. We focus on the stock of human capital in every Spanish region for the three periods (1977-1986, 1986-1993, and 1995-2001) (Figures 16). We use data published by the IVIE (Instituto Valenciano de Investigaciones Economicas). We compute the corresponding share of skilled employment. Then, we carry out the standard stochastic kernel exercise and plot the corresponding contour. According to our results, the stock of human capital has grown impressively both in industry and services, in which the first period corresponds to a transition dynamic featuring a catch-up process (hence, redistribution of the share of human capital across regions) among regions

22
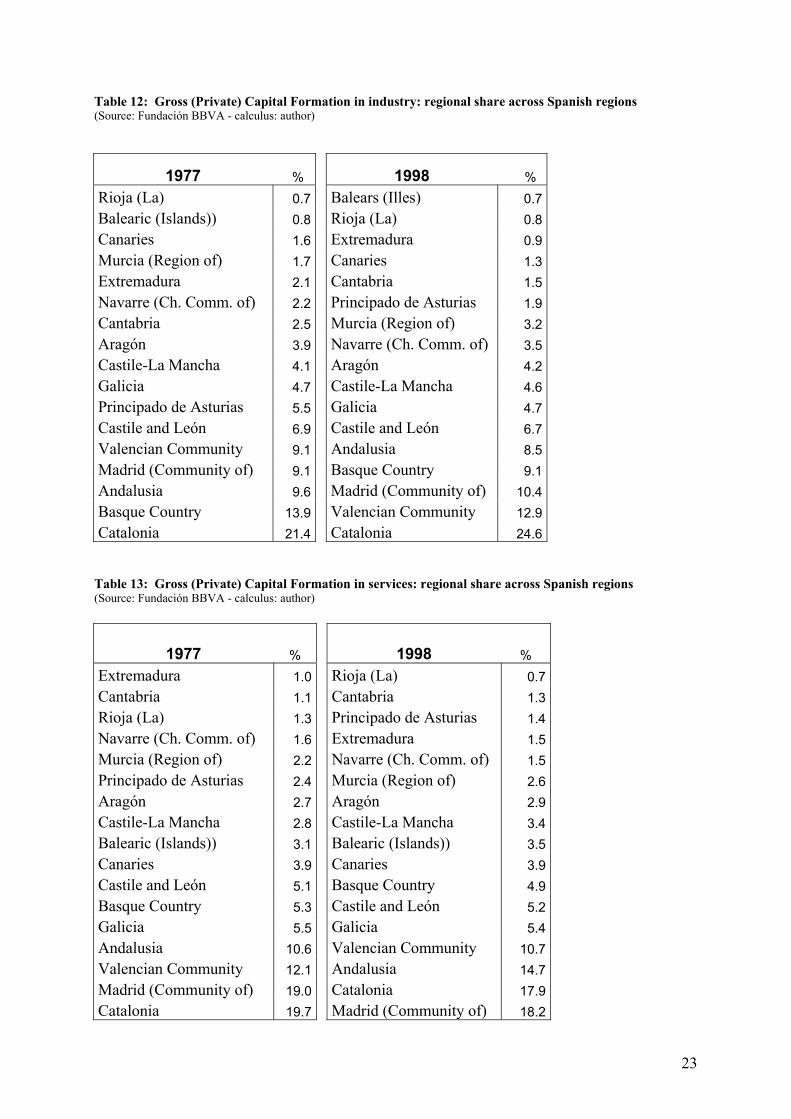
(the concentration peak lies on the negative diagonal), while in recent years a convergence process is still active. Once again the transition dynamics of this productivity factor across regions is similar in both of the sectors. The movement of human capital in industry and services was so important (in the first part of the period we are considering) that it drove (in industry) or reinforced (in services) the process of converging labor productivity across Spanish regions. However, in recent years, the magnitude of this effect has smoothed along with the imprint produced on the convergence movement, allowing for the consolidation of the existing inequalities (in labor productivity) across regions. Finally, once the dynamics of all the selected factors have been analyzed, we are able to address a fairly clear conclusion. From 1977 to 1993, Spanish regions experienced a convergence process in labor productivity both in industry and in services that has been exhausted in recent years. By comparing the regional transition dynamics of labor productivity with that of its principal factors, we are able to detect a strong association between the convergence of labor productivity across Spanish regions with that of the share of employment and the stock of human capital. Conversely, the dynamics of physical capital are somewhat different. The evolution of labor productivity across regions seems to be independent from the evolution of physical capital. This dissociation could entail some consequences as discussed in O’Mahony and van Ark (2003) for the sustainability of the labor productivity and growth tendency in the long run. However, further insights appear that require further interpretation. In Section 1, we mentioned the existence of an apparent puzzle concerning Spanish labor productivity. The mismatch between the evolution of the two factors influencing labor productivity presents a way of interpreting the puzzle. The convergence process of labor productivity entailed a process of redistributing resources across Spanish regions. The regional human capital catch-up process fuels convergence. Yet, the dynamic of investment in physical capital did not occur in parallel with that of human capital. Considering the complementarity between physical and human capital (such as that presented in a Cobb Douglas function of aggregate production), they both need to grow simultaneously to guarantee positive returns in the output (namely, labor productivity). From this viewpoint, the Spanish mismatch may not simply be due to the general lack of investment in physical capital but to the lack (or low rate) of investment in productive activities in the regions that experienced a sustained rate of human capital growth. In this respect, the following tables draw an interesting picture by looking at the ranking of regions according to the formation of physical and human capital. Looking at the series corresponding to the formation of gross physical capital (both in services and industry) in 1977 and 1998, the two classifications are basically identical, whereas interesting variations appear when comparing those of human capital. There are regions such as the Valencian Community, Cantabria, Castile-la-Mancha, la Rioja or the Region of Murcia that quite substantially improved the proportion of human capital in their areas (both in service and industry) but without a corresponding increase in the formation of gross capital. Then, there is also the situation of regions such as Catalonia, which literally worsened their position in comparison to the rest of Spain.
23
Table 12: Gross (Private) Capital Formation in industry: regional share across Spanish regions (Source: Fundación BBVA - calculus: author)
1977 % 1998 % Rioja (La) 0.7 Balears (Illes) 0.7Balearic (Islands)) 0.8 Rioja (La) 0.8Canaries 1.6 Extremadura 0.9Murcia (Region of) 1.7 Canaries 1.3Extremadura 2.1 Cantabria 1.5Navarre (Ch. Comm. of) 2.2 Principado de Asturias 1.9Cantabria 2.5 Murcia (Region of) 3.2Aragón 3.9 Navarre (Ch. Comm. of) 3.5Castile-La Mancha 4.1 Aragón 4.2Galicia 4.7 Castile-La Mancha 4.6Principado de Asturias 5.5 Galicia 4.7Castile and León 6.9 Castile and León 6.7Valencian Community 9.1 Andalusia 8.5Madrid (Community of) 9.1 Basque Country 9.1Andalusia 9.6 Madrid (Community of) 10.4Basque Country 13.9 Valencian Community 12.9Catalonia 21.4 Catalonia 24.6 Table 13: Gross (Private) Capital Formation in services: regional share across Spanish regions (Source: Fundación BBVA - calculus: author)
1977 % 1998 % Extremadura 1.0 Rioja (La) 0.7Cantabria 1.1 Cantabria 1.3Rioja (La) 1.3 Principado de Asturias 1.4Navarre (Ch. Comm. of) 1.6 Extremadura 1.5Murcia (Region of) 2.2 Navarre (Ch. Comm. of) 1.5Principado de Asturias 2.4 Murcia (Region of) 2.6Aragón 2.7 Aragón 2.9Castile-La Mancha 2.8 Castile-La Mancha 3.4Balearic (Islands)) 3.1 Balearic (Islands)) 3.5Canaries 3.9 Canaries 3.9Castile and León 5.1 Basque Country 4.9Basque Country 5.3 Castile and León 5.2Galicia 5.5 Galicia 5.4Andalusia 10.6 Valencian Community 10.7Valencian Community 12.1 Andalusia 14.7Madrid (Community of) 19.0 Catalonia 17.9Catalonia 19.7 Madrid (Community of) 18.2

24
Table 14: Human capital in industry: regional share across Spanish regions (Source: IVIE - calculus: author)
1977 % 2001 % Extremadura 8.7 Canaries 52.1Castile-La Mancha 8.9 Extremadura 57.7Balearic (Islands)) 9.9 Andalusia 63.1Andalusia 11.4 Castile-La Mancha 64.1Galicia 11.5 Castile and León 64.8Canaries 12.5 Asturias 66.6Valencian Community 12.5 Galicia 66.7Castile and León 13.2 Murcia (Region of) 69.0Rioja (La) 13.6 Balearic (Islands)) 70.5Murcia (Region of) 14.5 Rioja (La) 70.9Cantabria 14.9 Aragón 71.8Aragón 15.5 Basque Country 73.0Asturias 18.3 Catalonia 73.9Catalonia 19.6 Navarre (Ch. Comm. of) 74.3Basque Country 19.6 Cantabria 74.3Navarre (Ch. Comm. of) 24.3 Madrid (Community of) 74.5Madrid (Community of) 26.2 Valencian Community 79.8 Table 15: Human capital in services: regional share across Spanish regions (Source: IVIE - calculus: author)
1977 % 2001 % Extremadura 15.3 Canaries 69.0Castile-La Mancha 15.4 Extremadura 69.2Andalusia 17.6 Andalusia 72.8Castile and León 19.9 Asturias 73.0Rioja (La) 20.2 Galicia 73.1Murcia (Region of) 20.5 Castile and León 73.2Galicia 20.8 Castile-La Mancha 73.2Canaries 22.3 Rioja (La) 73.8Valencian Community 23.7 Murcia (Region of) 76.7Aragón 23.9 Balearic (Islands)) 76.7Asturias 23.9 Aragón 77.8Balearic (Islands)) 24.5 Navarre (Ch. Comm. of) 78.2Cantabria 26.5 Catalonia 79.7Basque Country 31.1 Cantabria 80.3Catalonia 31.9 Basque Country 80.4Navarre (Ch. Comm. of) 32.3 Madrid (Community of) 81.4Madrid (Community of) 36.4 Valencian Community 82.0

25
5. Conclusions We propose the study of the evolution of labour productivity across Spanish regions from 1977 to 2002. As an indicator of productivity, we select the productivity per hour worked in preference to the common productivity per unit of employment as it takes into account the effects of the reduction in working time. By applying the kernel technique, we focus on the transition dynamics of labour productivity and its determinants in industry and services. In both sectors, labor productivity across Spanish regions displays a convergence process in the 1977-1993 period that was principally driven by the movement of human capital. Private investment does not seem to have had any impact on labor productivity while the effect of an increase in the share of employment only matters in services. Moreover, during the decade from 1977-1986, the convergence dynamics across regions mostly took place in industry, while in the 1986-1993 period the same happened to services. Our results are comparable with those of other existing studies (Esteban, 1994, de la Fuente 2002 or Martínez Serrano, 2004), but we are able to better qualify the contribution of the two largest sectors (industry and services) to the changes in the total labor productivity. According to our results, the current problems faced by Spain in terms of the positive rate of productivity growth are more related to historical heritage than temporary coincidence. In this sense, these results are backed by some conclusions of the book by E. Roig (2007). Of course, no responsibility can be charged to any economic agent. The historical perspective makes it possible to identify that the current situation is the result of the unexpected results of the transition process tagged by two important historical events that boosted the convergence process in the industry and service sectors. No action could have been undertaken in advance, because nobody was aware of the dynamics at that time. Now, the convergence process in labor productivity seems stable and some corrections could be introduced by targeting a few selected objectives. Investments in physical capital need to be triggered, especially, in the group of regions that recorded the highest growth rate in human capital. The kernel technique (like all non-parametric techniques) is fairly data demanding. Extending the period of analysis could further refine the results of this study. At the same time, it could also being interesting to increase the number of sectors in order to gather more detailed information on the causes of the productivity trend. Finally, it could be also worth doing the same exercise for a few other European countries (always considering their regional composition), and then comparing them in order to investigate the possible differences or similarities between the sources of productivity within the members of the European Union.
26
Figure 8: Human capital: regional share across Spanish regions (Source: IVIE - calculus: author)
- Industry - Services Period: 1977-1986
YD
ata
XData
Biv. KDE (contour) of X&Y
10 12 14 16 18 20 22 24 26
20
25
30
35
40
YD
ata
XData
Biv. KDE (contour) of X&Y
16 18 20 22 24 26 28 30 32 34 36
35
40
45
50
55
Period: 1986-1993
YD
ata
XData
Biv. KDE (contour) of X&Y
20 25 30 35 40
44
46
48
50
52
54
56
58
60
62
64
YD
ata
XData
Biv. KDE (contour) of X&Y
35 40 45 50 5554
56
58
60
62
64
66
68
70
72
74
Period: 1995- 2001
YD
ata
XData
Biv. KDE (contour) of X&Y
44 46 48 50 52 54 56 58 60 62 64
55
60
65
70
75
YD
ata
XData
Biv. KDE (contour) of X&Y
54 56 58 60 62 64 66 68 70 72 74
70
72
74
76
78
80
27
6. References
Benito. J.M. – Ezcurra, R. (2004): “Disparidades espaciales en productividad en la Unión Europea”, in J.V. Castro (Eds), Competitividad regional en la Unión Europea ampliada, Instituto de Estudios Fiscales. Blanchard, O. (2004): “The Economic Future of Europe”, Journal of Economic Perspective, vol. 18 (4), pp. 3-26. Boldrin, M. - F. Canova (2001): ‘Inequality and convergence in Europe’s regions: reconsidering regional policies’, Economic Policy, vol.16, pp. 207-253. Carreras, A. (2005): ‘Industria’ in ‘Estadíscas históricas de España’, Carreras, A. - X. Tafunell (Ed), Fundación BBVA. Dew-Becker, I. – R.J. Gordon (2006): “The Slowdown in Europe Productivity Growth: A Tale of Tigers, Tortoises and Textbook Labor Economics”, mimeo. Esteban, J. Mª (1996): “Disigualdad y Polarización. Una aplicación a la distribución interprovincial de la renta en España”, Revista de Economía Aplicada, vol. 11 (IV), pp. 5-26. Esteban, J. Mª (1994): “La desigualdad interregional en Europa y en España: descripción y análisis ”, en Crecimiento y convergencia regional en España y Europa , vol. 2, pp. 13-82, Instituto de Análisis Económico- CSIC y Fundación de Economía Analítica, Barcelona. Estevão, Marcello (2004): “Why Is Productivity Growth in the Euro Area So Sluggish?”, IMF Working Paper, 04/200. European Commission (2003): “Drivers of Productivity Growth: An Economy-Wide and Industry Level Perspective”, The EU Economy 2003 Review, Brussels. de la Fuente, Angel (2002): “On the sources of convergence: A close look at the Spanish regions”, European Economic Review, vol.46, pp. 569-599. Härdle, W. (1990): Applied nonparametric regression, Econometric Society Monographs. Lamo, A. (2000): “On convergence empirics: some evidence for Spanish regions”, Investigaciones Económicas, vol. XXIV (3), pp. 681-707, Martínez Serrano, L. (2004): “Factores de crecimiento regional”, in J.V. Castro (Eds), Competitividad regional en la Unión Europea ampliada, Instituto de Estudios Fiscales. Moluquer de Motes, J. – M. Llonch (2005): ‘Trabajo y relaciones laborales’ in ‘Estadíscas históricas de España’, Carreras, A. - X. Tafunell (Ed), Fundación BBVA. Nuñez, C. E. (2005): ‘Educación’, in ‘Estadíscas históricas de España’, Carreras, A. - X. Tafunell (Ed), Fundación BBVA.
28
OECD Manual (2004), “OECD measures of total hours worked”, OECD, Paris OECD Manual (2005a), “International comparisons of labour productivity levels”, OECD, Paris. OECD (2005b), Economic Policy Reforms: Going for Growth, Paris. O’Mahony, M. and B. van Ark (2003): “EU productivity and competitiveness: An industry perspective”, European Commission : Enterprise publications, Quah, D. (1997): “Regional Convergence from Local Isolated Actions : Historical Outcomes,” CEP Discussion Papers 0378, Center for Economic Performance, LSE, Quah, D. (2006): “Growth and Distribution”, mimeo, Roig, E. (2007): “Competitividad, Crecimiento y Capitalización de las regiones españolas”, forthcoming, Fundación BBVA, Sanso Frago, M , García P., - Pueyo, F. (2004): Evolución y perspectivas de la productividad en Aragón, Fundación Economía Aragonesa.
7. Appendix
7.1 Kernel Density: a non parametric technique
A nonparametric technique is a flexible form of estimation. The simplest nonparametric density estimate of a distribution of a series is the histogram, but it is not continuous. The kernel density estimator replaces the “boxes” in a histogram by “bumps” that are smooth. Smoothing is done by putting less weight on observations that are further from the point being evaluated(x). More technically, the kernel density estimate of a series X at a point x is estimated by
∑=
−
=N
i
in h
Xxk
Nhxf
1
1)(
where N is the number of observations, h is the bandwidth (or smoothing parameter) and K( ) is a kernel function that integrates to one. The kernel function K(·) is a weighting function that determines the shape of the bumps. We use the Gaussian kernel function that downs weights on points as the distance from x increases. Unlike most kernel functions, this is unbounded on x and each observation is included in the estimation (Härdle, 1990). Bandwidth h controls the smoothness of the density estimate; the larger the bandwidth, the smoother the estimate. Bandwidth selection is of crucial importance in density estimation. We use the Silverman method: a standard option for the Eviews package.
29
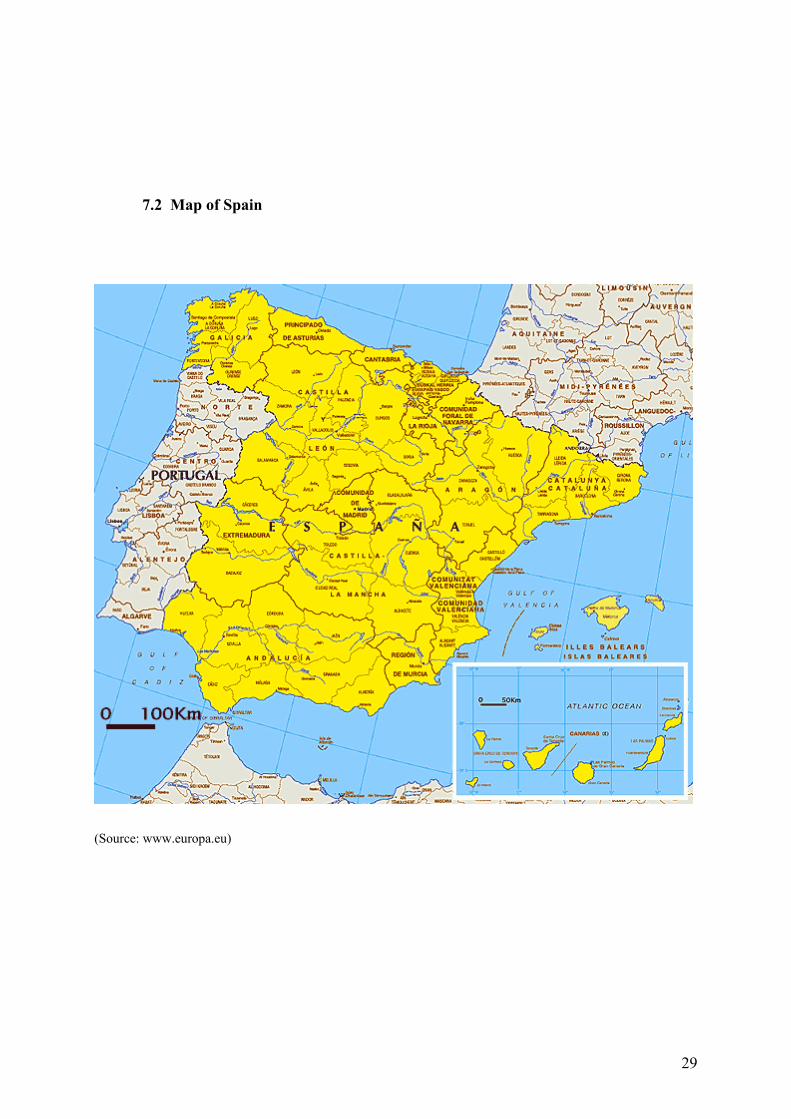
7.2 Map of Spain
(Source: www.europa.eu)