introduction: spanish sustainable urban ... - … · web viewsustainable urban mobility plans. a...
TRANSCRIPT
SUSTAINABLE URBAN MOBILITY PLANSA Comparative Analysis of the Evolution and Current Situation in Spain
Elisa Pozo MenéndezMiguel Ángel de los Mozos Blanco
Rosa Arce RuizNeus Baucells Aletà
Universidad Politécnica de Madrid
1. INTRODUCTION: SPANISH SUSTAINABLE URBAN MOBILITY PLANS
Cities are today the predominant place of residence of the world's population, 54% of the world’s population reside in urban areas (United Nations, 2014). Cities also concentrate a significant proportion of its economic activities and business opportunities and generate more than 80% of global GDP (Dobbs, R. et al., 2011). Although cities may have a different history, culture and geography, they all share a series of similar problems that have both a local impact and repercussions on a global scale; one such problem is their negative impact on the environment due to pollution, as 40% of CO2
emissions come from urban traffic (Mataix González C., 2010). Air pollution and traffic noise cause discomfort and undermine the quality of life in city centres, in addition to representing a cost in time and energy which –quite apart from the impact on the health of the population– also leads to a loss of economic productivity and efficiency. The European economy loses about 100,000 million euros annually due to traffic congestion in cities, a source of pollution, accidents, and productivity and efficiency in enterprises (European Commission, 2007).
To tackle this problem in Europe, in 2001 the European Commission (hereafter EC) published the Transport White Paper –with a mid-term revision 5 years later– in order to set forth a political agenda and a series of strategies and targets aimed at transforming the transport sector towards a more sustainable and efficient model (EC, 2001 and 2006). Two years later, the Green Paper (EC, 2007) stressed the importance of optimising urban transport, and analysed the challenges and possible options for encouraging displacement by means of non-polluting modes and reducing the use of private vehicles, while improving the availability of public and collective transport.
Since then, the European Commission has promoted a range of mechanisms to encourage the transformation towards a model of sustainable city. The Commission has focused its efforts on guiding city councils and technical
© AET 2016 and contributors1

operators to adopt measures that minimise environmental impact, including the creation of an effective and sustainable transport system. The Action Plan on Urban Mobility (EC, 2009) proposed a series of measures that served as a reference to achieve these objectives, including the creation of a sustainable urban mobility policy. In 2013, the publication of the communication entitled “Together towards competitive and resource-efficient urban mobility” was another call to define the concept and content of Sustainable Urban Mobility Plans (EC, 2013), and specified that a mobility plan should consider the balanced development and a better integration of the different urban mobility modes.
At the national level, the measures and objectives in the Spanish Energy Savings and Efficiency Strategy (IDAE, 2003) and the Strategic Infrastructures and Transport Plan (Spanish Ministry of Development, 2005) address a number of issues related to transport and mobility from a sustainable point of view, and define the energy targets to be achieved and the measures and instruments with which to achieve them. The proposed measures include Sustainable Urban Mobility Plans (hereafter, SUMP), and other strategic documents such as Company Mobility Plans, and strategies that promote the introduction of electric vehicles, always within the drive to transform the country's mobility model.
A turning point was the approval of the Sustainable Economy Act (Act 2/2011), which ruled that a SUMP was a prerequisite for access to the public transport subsidies granted by the Spanish Treasury (Government of Spain, 2011). This legislation also defined the minimum content of the SUMP 1, and came into effect in 2014.
In Spain currently, over 300 municipalities have drafted SUMP, most which have already been approved (APTeMUS and Davies et al, 2016).
However, no uniform methodology has been applied in either the drafting or the implementation of the SUMP, making it difficult to assess their effectiveness using a homogeneous criterion. In 2006, the Guía Práctica para el desarrollo e implementación de un PMUS (IDAE, 2006) and the ELTIS guidelines “How to develop a Sustainable Urban Mobility Plan for a polycentric region” (Adell et al., 2014) laid down a number of indications for preparing these documents, although the heterogeneity has persisted. Until 2010 most of the documents failed to define a monitoring plan, despite the European reference documents (Díez Martinez et al., 2014). This lack of
© AET 2016 and contributors2
uniformity today poses problems when attempting to analyse the actual changes in mobility and to compare one city with another.
In 2015, ELTIS, the Urban Mobility Observatory, published an online tool for the self-assessment of mobility plans in the form of a questionnaire that allows users to measure the progress of the implementation of the SUMP (ELTIS, 2015)2. Additionally, the European Commission's guide to “Developing and implementing a sustainable urban mobility plan” (Wefering et al., 2014) contains factsheets with the basic content and the methodology for developing and assessing a SUMP. These documents are among the examples of the lines of work currently underway to assess the degree of efficacy of the implementation of the SUMP within a city’s sustainability policy. However, this is still today a work in progress.
The present study is framed within this context, and is intended to provide an overview of the situation of the SUMP in Spain and an assessment of their features several years after their implementation. A total of 38 cities were selected, and an assessment was made of the degree of development of the SUMP document approved in the municipality. The findings were then compared and contrasted with the results of a survey sent to various agents involved in compiling this document in order to evaluate their perception of the level of implementation of these measures in the city, and the efficacy of the plans.
2. METHODOLOGY
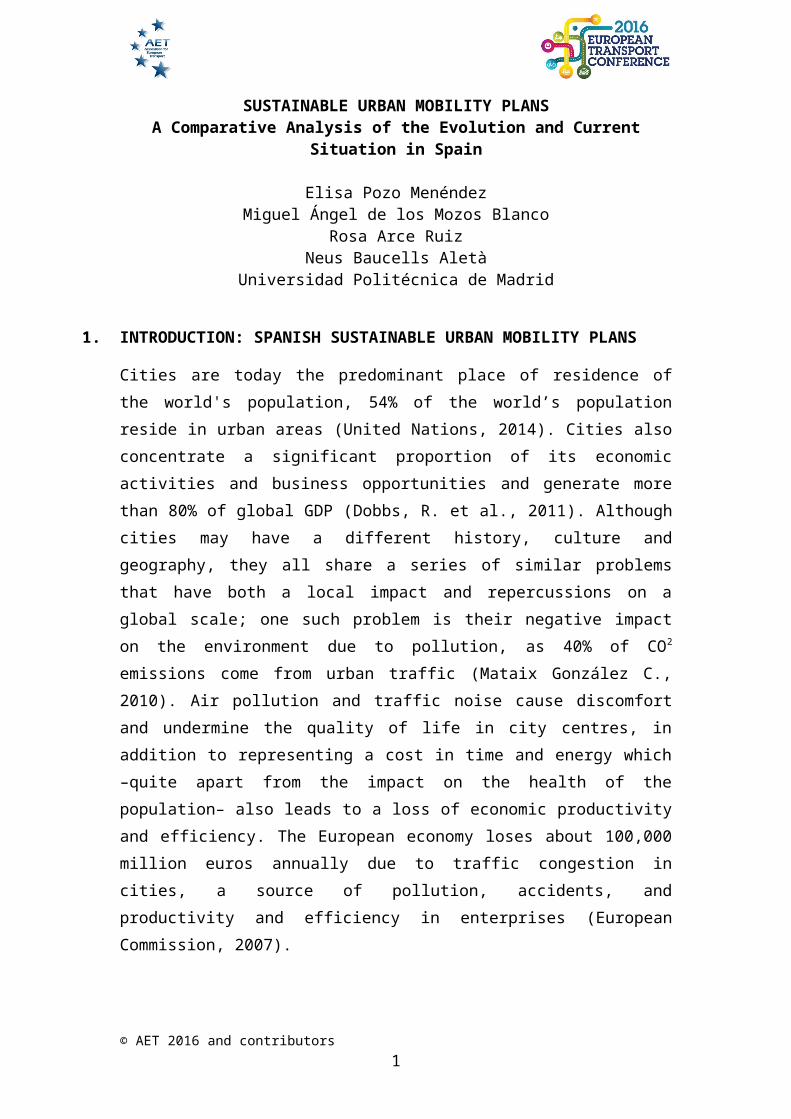
The aim of the present study is to assess the SUMP in Spain in terms of the degree of development and implementation of the measures described in each one. The study is structured in two differentiated phases. First, an assessment is made of the degree of definition and development of the SUMP, and the measures proposed in each one, together with the estimated costs, the associated timelines and the monitoring methodology. The second phase compares and contrasts the results of this assessment with the answers obtained from a survey of several agents who have worked on the SUMP in order to validate our conclusions.
© AET 2016 and contributors3

Figure 1: Diagram of the methodology.
2.1. The Cities
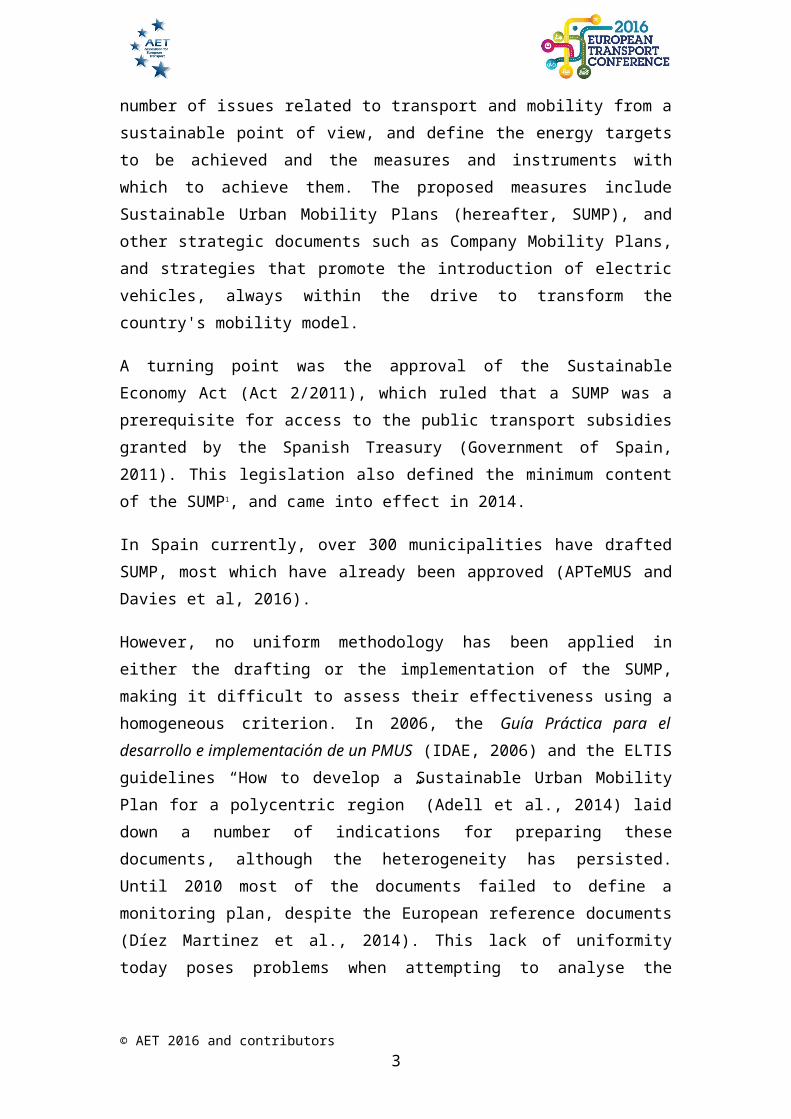
For this first phase of the analysis, a total of 38 cities were selected from the Spanish Smart Cities Network (Red Española de Ciudades Inteligentes - RECI), which had a SUMP in January 2016. The decision to select a set of cities from the RECI as a significant sample is justified by the fact that the cities in this network (65 in total) have demonstrated a commitment to innovation and to providing their cities with a more efficient economic and political model, with the result that they all have strategic plans that are already under way. These cities work on different areas including sustainable mobility, and 70% of the cities in this network have a SUMP. The cities analysed are listed below:
A Coruña Palma de Mallorca Albacete Paterna Alcobendas Rivas Vaciamadrid Alicante Salamanca Barcelona San Cristóbal de la Laguna Castellón de la Plana Sant Cugat del Vallès Ciudad Real Santander Córdoba Santiago de Compostela Getafe Segovia Gijón Sevilla Huelva Tarragona Huesca Toledo Jaén Valencia Logroño Valladolid Lugo Vitoria-Gasteiz Madrid Zaragoza Majadahonda Málaga Móstoles Motril Murcia Oviedo
Figure 2: Location of the cities analysed.
2.2. The Assessment
© AET 2016 and contributors4
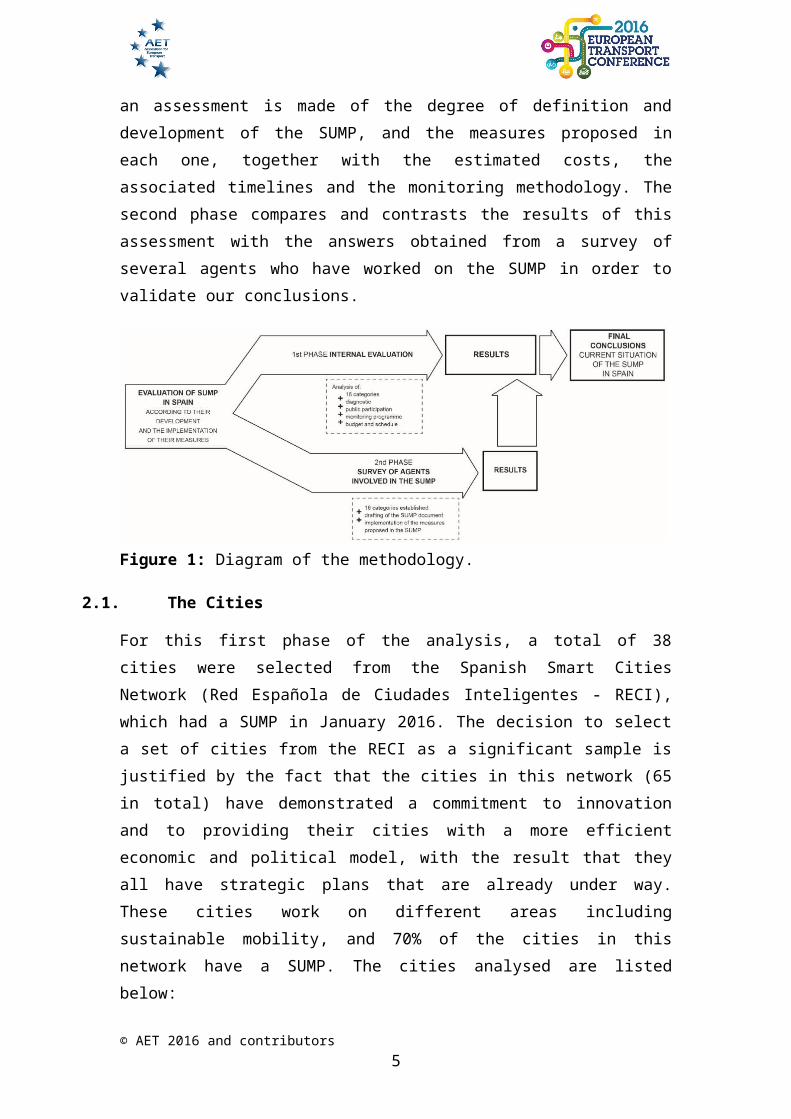
The first phase consists of an analysis of the SUMP, the measures proposed and a comparison between them. Sixteen evaluation criteria were defined based on the indications contained in the Guía Práctica para el desarrollo e implementación de un PMUS (IDAE, 2006). In addition to the proposals and measures specified in the plans, other aspects analysed included the degree of detail of the prior diagnosis and the process of public participation in its preparation and approval. Finally, an analysis was also made of the level of definition of the monitoring programme, the budget and timeline.
Figure 3: Diagram of the assessment process.
First, an analysis was made of the diagnosis of the mobility situation in each location. Each diagnosis was assigned a value of 1 to 3 according to the degree of detail and the accuracy of the analysis contained in the document.
The second stage was to conduct an analysis of the measures in the plan, which are assessed with the following criteria:
CRITERIA Items included in the criterion
1. Highway hierarchy and traffic and circulation
Reorganisation and restructuring of the roads with a view to reducing traffic and congestion and prioritising pedestrian or bicycle mobility.
2. Public transport Measures and actions intended to improve public transport infrastructure and services in the location and the municipality.
This category is in turn divided into eight subdivisions to assess
© AET 2016 and contributors5

separately the measures corresponding to the bus, metro, commuter railway, tram, public bicycle, on-demand transport, trolleybus and BRT networks.
3. Private carAssessment of the measures designed to reduce the use and presence of private cars, and car-sharing initiatives.
4. ParkingActions and measures concerning the regulation of parking, the reduction of the presence and use of cars in public spaces and the creation of new parking areas.
5. Pedestrians
Actions and initiatives to promote displacement on foot and improvements in public spaces for use by pedestrians. Pedestrianisation of streets, widening of pavements, improvements in accessibility –although this is assessed in a specific category– and road safety are among the measures commonly included in many mobility plans.
6. Cycling
Measures to promote the use of the bicycle as a mode of transport in the city, from the creation of bike lanes through to the installation of secure parking. This category also covers the implementation of a bike rental system; although this is discussed independently in the section on public transport, it is an important factor in encouraging cycling mobility.
7. Electric cars Measures considered to encourage the uptake and use of electric cars.
8. Urban goods deliveries
Actions designed to organise the goods transport system in cities, from the regulation and reservation of parking spaces through to the creation of distribution centres.
9. Intermodality
Measures designed to facilitate the transfer from one mode of transport to another, such as “park&ride” initiatives, the creation of common travel passes for all transport modes and the “single ticket” for use on any of several transport modes on a single trip, the synchronisation of the schedules of the different service networks (buses, metro, commuter railway and others), cycle parks in the stations of other services, adaptation of trains or buses to allow users to board with bicycles and so on.
10. Design of the public space
This concerns attention to the detailed design of aspects such as street layout and structure (street sections, materials, type of platforms and so on), elements of urban furniture installed to reduce the use of private vehicles or limit the presence of cars (trees, bollards and others), and the design of urban elements to encourage mobility by pedestrians or cyclists.
11. Accessibility
Initiatives for the adaptation of public spaces and services for people with special mobility needs. This section normally includes initiatives relating to street design, the modification of pedestrian routes to eliminate architectural barriers, and the implementation of systems to facilitate the use of public transport for people with mobility difficulties.
12. Road safety
The initiatives in this category frequently involve the regulation of traffic, primarily signposting, educating the population to heed traffic regulations, and in some cases they also consider aspects of urban design that contribute to ensuring pedestrian safety.
13. Air and noise pollution
Initiatives aimed at reducing atmospheric and acoustic pollution. It was decided to create an independent category to analyse this type of measures, as this is an extremely important environmental factor that is directly linked to problems
© AET 2016 and contributors6
associated with mobility.
14. Regulations
Initiatives that involve the implementation of bylaws, plans or applied urban regulations for regulating traffic, classifying parking areas and circulation on public highways, among others.
15. Public participation
Measures that promote participation by residents, not only in terms of raising awareness and notifying them of activities, but also by actively working with the public to allow and encourage their contributions and ideas while performing an active and ongoing task of educating the public to change their habits.
16. IndicatorsDegree of definition of the indicators associated with each measure in the mobility plan, and an analysis of whether the document establishes a monitoring plan.
Table 1: Criteria used in assessing mobility plans.
Public participation in the process of drafting the plan was also assessed from a qualitative point of view, based on whether it takes the form of active participation on work committees or workshops, or is limited to communications and questionnaires by the local governments. Finally, it was determined whether the document included a monitoring plan, a budget and a timeline.
Compliance with each criterion was assessed on a scale of 1 to 5, as follows:
Value Definition
1 The plan sets a series of general targets.
2 The plan sets general targets and cites generic measures.
3
The plan sets specific targets and measures, but with only rudimentary development. That is, it cites specific measures for application to particular local points with varying degrees of definition, but without actually justifying them and developing them in depth.
4The plan sets specific targets and measures, but they are only partially developed. This implies that the measures considered in the plan have been precisely prepared.
5The plan sets specific targets and measures that are fully developed and completed, including an approximate budget for each action, a detailed timeline for the strategies, and a series of associated indicators to monitor each measure.
Table 2: Scale of values for assessing compliance with the criteria.
2.3. The Survey
The second phase of the study involved an open survey to compare and validate the results obtained. The survey was sent to all the agents who took part in one way or another in preparing any of the phases of the mobility plans (diagnosis, participation, drafting and development, implementation, consulting, assessment and monitoring).
© AET 2016 and contributors7

The survey consisted of a set of qualitative and quantitative questions on the effectiveness of the implementation of the SUMP in each city. The question matrix was prepared from the categories defined in the assessment in the previous phase, so as to be able to compare the opinions of the agents with the previous results.
The survey is structured in three blocks: the first describes the person's profile, their relation with the SUMP, and the phase in which they were involved; the second assesses the proposals in the mobility plan in terms of quality and how well the measures are adapted to the city; and the third refers to the degree of implementation, the quality of the execution and of the services that have been rolled out, based on the original proposals in the plan. The detailed survey is available at https://es.surveymonkey.com/r/PMUS.
The respondents had the option of answering about one or various SUMP.
Figure 4: Structure of the survey.
The survey was sent to municipal operators, town councils, private companies and consultants, engineers, politicians, neighbourhood associations and other NGOs and collectives. 370 answers were received, of which 54% were complete and 8% partial (up to the assessment of the preparation stage of the SUMP).
© AET 2016 and contributors8

The conclusions obtained from each phase of the study offer a more detailed insight into the degree of development of sustainable mobility in Spain.
Finally, the findings suggest several lines of research and analysis for a possible future and more detailed study of this subject, and point to some recommendations for all new SUMP due to be drafted and approved in the coming years.
3. RESULTS
1.
2.
3.
3.1. Analysis of the SUMP
In general, the documents in the SUMP containing the prior analysis and diagnosis are meticulously prepared and have a high level of detail, which does not always match the degree of development of the SUMP itself. One positive result is that all the cities have a thorough knowledge of the base situation before undertaking their SUMP; however, it is worth asking whether the investment involved in carrying out this type of analysis is proportional to the development of the mobility plan itself.
The results for public participation and its presence in the preparation stage of the SUMP –a fundamental aspect when approaching a mobility project– are not always positive. 26% of the cities analysed include a participation process in the form of discussion panels, workshops or public suggestion boxes, while 12% of the cities simply run a communication and awareness campaign. The remaining 42% even completely omit the issue of public participation from their SUMP, making it difficult to determine whether it was taken into account, although it can be assumed a priori not to have been considered.
Almost all the SUMP describe the measures for increasing and improving cyclist and pedestrian mobility at considerable length and in great detail. 71% of the SUMP analysed contain detailed proposals for improving pedestrian mobility (a score of 4 and 5 on the scale), and 69% contain proposals for cycling mobility, with a similar degree of detail in all the plans. The most common actions include traffic calming measures, pedestrianisation
© AET 2016 and contributors9

of central areas in the city, the implementation of bike lanes and secure bike parks, and the promotion of bicycle mobility.
It is worth noting that most of the documents (70%) include a specific proposal for the “Camino Seguro al Cole” (Safe Route to School), a project designed to improve safety and accessibility for children on their way from home to school and enable them to walk or go by bike. However, there is a lack of proposals addressing the design of public spaces from any other than a merely functional point of view. Comfort in a public space is a key factor in encouraging users to modify their mobility routines, but the plans only occasionally include the use of ground floors of buildings, perception of safety, type of street section and displacement times.
The bike rental system is present in 62% of the plans. The degree of development is uneven and tends to be fairly limited, but as an additional measure it can be viewed as an essential complementary means for driving the shift to bicycle mobility.
In the area of public transport, most cities (95%) consider the restructuring of bus lines as the primary action for optimising the existing service, establishing new routes or improving current ones. Other developments include accessibility at public transport stops and in the vehicles, the creation of segregated bus lanes and the use of new technologies to improve the user information service. In 77% of cases, these measures are well defined and have the maximum level of detail.
With the exception of the bicycle rental service, the remaining measures for improving public transport are difficult to assess as a whole, as not all the cities have a metro, commuter railway or tram network. The trolleybus, BRT and on-demand transport only appear in six of the documents analysed.
Nor do the action measures referring to the metro or commuter railway network provide much information for comparison purposes. These are networks that also integrate several municipalities, so the measures included are in most cases limited to references to the issue of accessibility in stations and intermodality with other modes of transport.
85% of the plans specify actions referring to measures for road hierarchisation and traffic reorganisation. Several plans propose the construction or modification of existing infrastructures –in some cases almost certainly inviable– such as burying roundabouts or accesses to the city. However most of the solutions in the plans involve pedestrianising and traffic
© AET 2016 and contributors10

calming in the more central streets, in many cases with changes of direction or speed limitations.
Only 50% of the documents devote a special section to actions involving the design of the public space. However, the plans that do contain measures in this category describe them in considerable detail, and feature proposals for types of street section, including vegetation in the urban fabric, reordering the space dedicated to private vehicles, materials and type solutions for constructive details.
There are a wide range of initiatives and proposals designed to limit the presence and use of private vehicles in cities. Several plans mention car-sharing (60%) –although without defining any specific proposals–, and the incorporation of facilities for electric cars (charging points, parking places and so on), although these measures are rare. It is worth noting that of the SUMP that include measures associated to electric vehicles, 83% date from after 2013, coinciding with the launch of the central government’s Integrated Electric Vehicle Strategy in Spain.
All the plans include a series of measures to tackle the issue of parking, generally with a high degree of detail, although the proposals frequently consist of regulating parking and implementing restricted parking areas (O.R.A.). Some plans propose the creation of new underground or multi-storey car parks to eliminate the presence of parked cars on the streets.
72% of the mobility plans consider the aspect of goods distribution, but in general terms and with only partially developed proposals. Only 13% of the plans outline any solutions in depth. There is a clear distinction between the plans that include a detailed development of this category and offer a variety of exhaustive proposals (urban distribution centres, night distribution and so on), and those where the solutions are limited to regulating loading and unloading hours and reserving parking places.
Intermodality is not always reflected in the proposals, and is only mentioned in 62% of the plans. No plan was found in the selected sampling that provides a detailed breakdown of actions to be carried out to improve this aspect. This may be due to the fact that intermodality is normally seen as an integral part of public transport improvements, and thus does not require its own specific category. However, the plans containing the most detailed measures for intermodality (13%) generally have a greater degree of development in all their proposals.
© AET 2016 and contributors11

The measures relating to accessibility are closely linked to the proposals for pedestrian mobility, public transport and road safety. These actions usually incorporate standard solutions for conflicting points along pedestrian routes (changes in level, crossings, and accessibility in train and bus stations, among others). 33% of the plans cover the issue of accessibility in detail, 49% address it partially and 18% omit it completely, either because it is included (without being clearly defined) in the sections on road safety or pedestrian mobility, or else is not considered at all.
Road safety is present in most of the plans analysed (72%) and is generally oriented towards conducting awareness-raising campaigns and training programmes, and to signposting and speed restrictions. In almost all cases this category is only partially developed.
One of the goals of the mobility plan is to reduce air and noise pollution as a key aspect of the transformation of our cities towards sustainability and environmental equilibrium, and to improve the health of the inhabitants. However, not all the plans analysed include this category, and although it is present in 67% of cases, it is only described in detail in 21%. From the transversal and holistic point of view, this element should feature more predominantly in mobility plans. Although directly linked to other measures (a reduction in displacements by private vehicle implies less traffic and thus less pollution and noise), the differentiation of these measures within a plan signals that efforts are being made to effectively reduce air and noise pollution.
In the category of urban planning regulations, the mobility plans propose the drafting of documents or specific plans to regulate each of the categories in the plan, or bylaws relating to vehicle circulation. In many cases they also propose a review of the General Urban Bylaw Plan (PGOU) and the application of measures to discourage the use of private vehicles, such as the creation of low-emission zones. In general, the action measures are only partially developed, partly due to the more theoretical and legislative requirements for changing or approving a new bylaw or regulation. Most of the plans consider the regulations in their proposals (74%), although in only 18% of cases is this aspect fully developed, whereas in the rest it is only partially developed.
72% of the SUMP analysed contain measures for public participation. The degree of development is much more complete when the public has most actively and fully participated in drafting the mobility plans, through the
© AET 2016 and contributors12
creation of workgroups and workshops with residents and representatives of various associations and sectors. In other plans, the measures proposed are much less detailed and are limited to communication through awareness-raising campaigns, debating forums and information points.
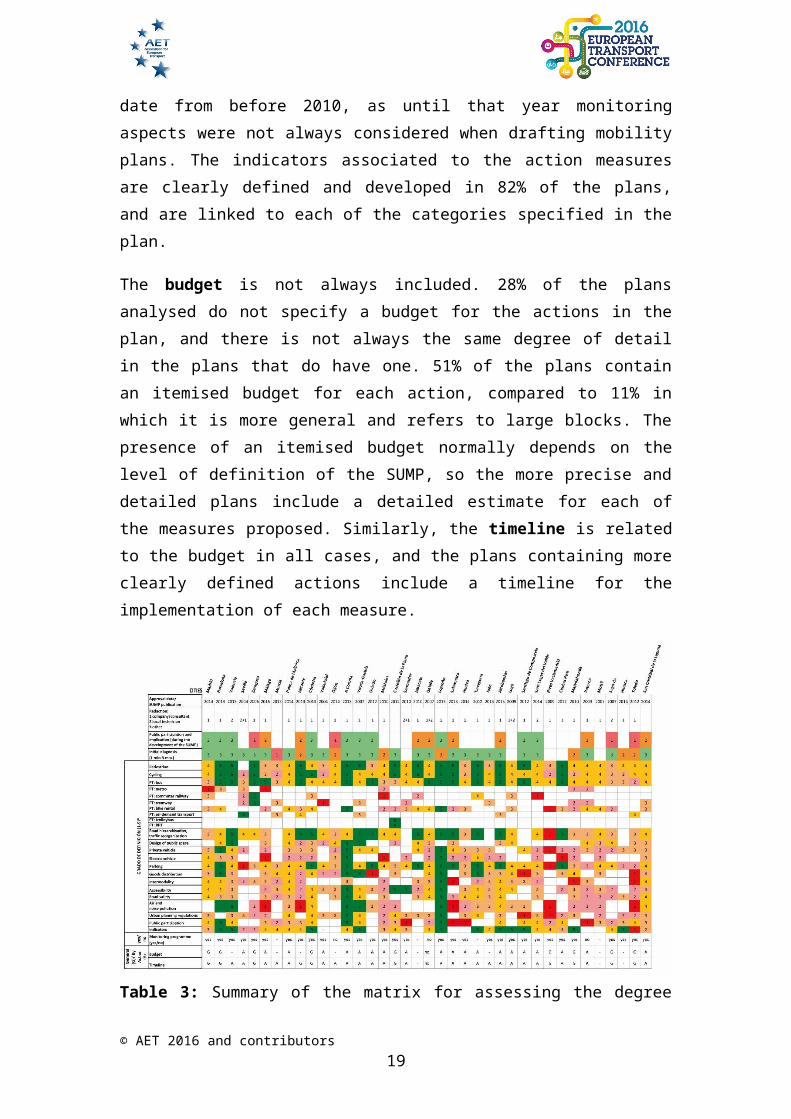
It is crucial for the plans to include a monitoring programme with defined indicators to allow changes in mobility trends to be viewed objectively. Only 10% of the plans analysed lack a monitoring plan and indicators associated to each of the measures described. These plans date from before 2010, as until that year monitoring aspects were not always considered when drafting mobility plans. The indicators associated to the action measures are clearly defined and developed in 82% of the plans, and are linked to each of the categories specified in the plan.
The budget is not always included. 28% of the plans analysed do not specify a budget for the actions in the plan, and there is not always the same degree of detail in the plans that do have one. 51% of the plans contain an itemised budget for each action, compared to 11% in which it is more general and refers to large blocks. The presence of an itemised budget normally depends on the level of definition of the SUMP, so the more precise and detailed plans include a detailed estimate for each of the measures proposed. Similarly, the timeline is related to the budget in all cases, and the plans containing more clearly defined actions include a timeline for the implementation of each measure.
© AET 2016 and contributors13

Table 3: Summary of the matrix for assessing the degree of definition and development of the measures in the SUMP.
3.2. Survey Results
310 of the 370 responses received correspond to the total mobility plans (38) analysed, but the survey was answered by agents who collaborated in other SUMP in some cases, with a total of 66 plans.
Answers were obtained from agents participating in all phases of the plan (diagnosis, drafting, implementation, consulting and participation), with a significant sample for each one (over 70 answers in each case).
The results for the categories of cycling and pedestrian mobility differ from those obtained in the internal evaluation of the SUMP. It was confirmed that 95% of the plans analysed include this type of actions, but with differences in the level of definition and development of each one. Less than half the respondents (47%) say the measures for the improvement of pedestrian mobility have a high degree of detail, while 30% say they are only partially developed and 17% say they are included, but without any precise information. Similar results were obtained for the actions for encouraging and improving bicycle mobility. 49% of respondents consider the measures to have a high degree of definition, while the other half say they have only a limited degree of detail (22%) or are insufficiently or poorly developed (23%). The respondents also consider the implementation and quality of these measures to be inadequate. In both cases, around 35% of the actions are
© AET 2016 and contributors14

considered to adapt to the local environment and to be of good quality, as opposed to 50% of respondents who say they have been only partially implemented or are poorly adapted to the location.
The bicycle loan system is included in 82% of the SUMP analysed, although these measures are unevenly developed. According to the responses obtained, 10% include measures defined in detail, 26% have well developed measures, and 46% have a poor level of definition, with similar results for the implementation of these measures. 9% of the measures carried out were considered to be good quality and adapted to the city. However, most cases (52%) were considered to have only a partial implementation, to be poorly adapted to the needs of the city, or have an unsatisfactory rental system.
The survey results for public transport indicate that these measures are generally poorly developed and adapted to the city. Only 40% of respondents consider them to be precise and well-defined, compared to 53% who say they are poor and insufficient. Opinions on their application also coincide with these results: 35% consider that the measures are appropriate, effectively implemented and with a high level of quality, while 52% give them a negative rating.
Still on the subject of collective transport, the proposals aimed at improving the metro or commuter railway network are present in less than 30%. These actions are generally considered to have been poorly implemented or to represent little improvement on the previous situation, as opposed to tram actions, which have the same percentage of appropriate as deficient ratings.
However, as observed in the analysis of the SUMP, both the prior proposals and the actions for the inclusion of trolleybuses, BRT or on-demand transport are specific measures that cannot be analysed in the present survey, as the sample of respondents is not homogeneous from one city to another.
The results of the measures for road hierarchisation and reorganisation of circulation and traffic show that more than half of respondents (54%) consider that the measures in the documents are poorly defined, as opposed to 38% who say they are well developed. The degree and quality of the implementation of these proposals is rated as poor (53%). Only 23% of the actions are given a positive rating.
The results for the category of design of the public space are similar to those obtained in the internal assessment. 41% of respondents say the plans
© AET 2016 and contributors15
in this category are precisely defined, compared to 25% who say they are poorly developed or not even considered. The results for the implementation of this measure show that its quality and adaptation to the city are not always rated as adequate. Only 23% of respondents consider that the measures implemented are satisfactory, compared to 65% who say they are deficient or poorly implemented.
Measures affecting parking regulations are included in 90% of cases, and are mostly considered to have a limited development (40%), compared to 34% that are rated with a high degree of detail. In the case of the implementation of the actions in this category, 23% of the proposals are considered to adapt to the urban environment and to be satisfactorily implemented, compared to 18% that are negatively rated.
As in the analysis of the plans, the survey also reveals that measures for electric vehicles are not considered to be precisely defined in most plans (41%), while 25% make no mention of them. In the case of the implementation of these measures, the results confirm that this type of initiative has only been included recently, and the measures have not yet been applied (30%), or else the presence of these vehicles is not sufficiently widespread (56%) in cities as to comprise another strategy for sustainable mobility.
The assessment of the development and definition of the goods distribution category in cities is considered to be fairly limited in the mobility plans, similar to the first part of the study. Only 18% of respondents consider the measures of this type to be developed with precision, compared to 61% who say they are defined to only a partial and limited degree. Similarly, these actions are also considered to be poorly implemented, as 63% of respondents say that in cases where these actions are included they have either not been implemented at all, or else the quality of the work is below expectations.
The respondents consider the definition of the measures for improvements in intermodality in the mobility plans to be heterogeneous. An approximately similar number of plans have measures considered to have a high (28%) and low (27%) degree of definition, and a similar percentage (29%) say the actions are only partially developed. The assessment of the quality of the implementation of these actions also receives contrasting ratings: 25% are considered effective and correctly applied, whereas 23% are rated as deficient or have yet to be put into practice.
The results for accessibility measures indicate that this category is considered in most mobility plans. The measures in 38% of these are said to
© AET 2016 and contributors16
contain a precise degree of detail and to be well developed, although a significant number of plans (37%) have measures that are rated as being only partially defined. These values are similar to those obtained in the assessment. The evaluation of the degree of implementation of these measures shows similar results. 29% of the actions carried out are considered appropriate and effective, compared to 35% that are seen as failing to meet the expected quality levels.
The measures corresponding to road safety show similar results to the previous section. 31% concur that the plans include a comprehensive definition of the measures defined, whereas 36% of respondents say they are only partially developed. However, more respondents (44%) rate the implementation of these actions as having a limited effectiveness than those who consider them to be adequate and correctly applied (26%).
24% of the respondents consider the measures in the category for reduction of air and noise pollution to be precisely defined, compared to 54% who consider the proposal to be insufficiently detailed. 61% say the measures are fairly inefficient, whereas only 22% say they have been adequately implemented.
The measures for urban planning regulations receive a negative rating. Only 20% of respondents say these measures are described with a precise and complete level of detail, compared to 61% who say they are partially and poorly developed. 17% of the plans do not even take into account this type of measures. 59% consider that the implementation of the measures in this category is fairly limited and inefficient, while 20% consider them to have been carried out effectively.
Over half the respondents (55%) say the measures for public participation in the SUMP are only partially developed, compared to 35% who say they address the issue in depth and provide very complete solutions. 27% of respondents say the implementation of public participation is satisfactory, whereas over half (61%) say an effective participation strategy has yet to be devised.
Only around 35% of the respondents consider the monitoring programme for the mobility plans and the definition of indicators to be well defined and to contain objective and detailed indicators to allow the monitoring of mobility trends. Around 30% consider them to be only partially developed, while 20% say they lack precision and are limited to general indicators that render the assessment somewhat objective over the years.
© AET 2016 and contributors17
As expected, the budget and the timeline are not always included. This is the case in around 20% of the SUMP, while only 25% of the cases incorporate precise time horizons and detailed and accurate budgets. The rest of the plans define these sections in approximate and general terms, which hinders the objectivity of the analysis during the monitoring phase of the programme.
Finally, most of the respondents agree that the level of application of the measures in the SUMP is still incomplete (74%). Only half consider that the targets and timelines established in the original plan have been partially achieved, compared to 36% who consider that the goals have not been achieved in any way at all.
4. CONCLUSIONS
Sustainable urban mobility plans have a very precise level of definition in most cases. These documents represent a turning point for the paradigms of modal distribution of transport in our cities. However, although a wide range of initiatives have been put in place, there is still a long way to go until the desired targets are achieved.
Although many of the plans analysed were approved several years ago, there is no evidence that the targets have been achieved in any of the Spanish cities. The findings in this study show that in spite of the guidelines stipulated in the mobility plans, the actual implementation of these initiatives has generally been far from effective.
Most mobility plans include measures oriented to improving pedestrian and cycling mobility, but the initiatives and their implementation are uneven in quality, and in over half the cases they are of a poor standard and are insufficiently adapted to the local environment. Bike lanes have yet to be laid out in all the cities in such a way as to form a continuous itinerary with safe routes and satisfactory signposting and state of repair. The public bike loan system is generally included as a measure, but tends to be rated as poorly adapted to the location or with a rental system that could be improved. A single transport ticket would certainly help make this service another alternative to public transport and encourage intermodality.
Although most SUMP include measures for road hierarchisation and circulation and traffic reorganisation, the results show the degree of definition is normally poor, and that these actions tend to be insufficiently
© AET 2016 and contributors18
implemented, if at all. However, experiences in other cities around the world –for example New York– have shown that no major economic investment is required to change road hierarchy and transform a road with numerous lanes into a pedestrian street in the city centre, simply through the use of paint, flower pots, benches and street furniture. Therefore, good design guidelines for public spaces could produce improvements in accessibility, increase displacements on foot or by bicycle, and improve road safety.
Moreover, accessibility and road safety measures are included in independent categories in most mobility plans, implying that particular emphasis is placed on the design and introduction of facilities for uninterrupted and predominantly pedestrian routes.
The parking regulation category features predominantly in most mobility plans, and is designed to regulate and restrict the presence of vehicles in the public space. However, these measures do not always appear to have been implemented according to the needs of the population or applying the most effective solutions. They are also a source of controversy, as the mobility model is still highly dependent on private vehicles, and residents demand parking places in their places of residence, work and leisure. There is a lack of any innovative measures in this category, such as the elimination of parking areas around office buildings or the reduction of parking spaces in residential areas3.
Similarly, there is an absence of specific measures to restrict the use of private vehicles. Car-sharing is still not common practice in Spain, and the use of electric vehicles will require a promotional stimulus before it becomes widespread in cities as another transport option.
On the other hand, goods distribution, intermodality and urban planning regulations are categories of measures that are often poorly and imprecisely defined and implemented. As it has been noticed before, innovative measures could be proposed to change the mobility paradigm in Spanish cities.
The reduction of air and noise pollution is another as yet unresolved issue in mobility plans. Although most mention these types of measures, the survey shows that the development and specification of the initiatives and their implementation have yet to achieve the desired results. It is still notable that many documents fail to include urban green spaces (parks, gardens, flower beds, verges and others) as a design element in cities. The presence of vegetation and uninterrupted green routes in the city are measures that improve not only local environmental quality but also indirectly encourage the
© AET 2016 and contributors19

use of public spaces, as they generate more user-friendly environments for residents.
Public participation continues to be addressed more in theoretical than in practical terms. The results all signal that very few plans contemplate active participation by the public, and are limited to measures for gradual awareness-raising and sensitisation. Many of the comments in the surveys call into doubt the local governments’ real commitment to working with the public on the issue of mobility. The various social, economic, and technical agents must all work together throughout all the phases of the SUMP to ensure its quality.
It is also essential for the monitoring programme and the definition of the indicators to be publicly available and updated on a regular basis in order to assess and renew the engagement with sustainable mobility over the years.
Finally, it should be stressed that the SUMP should be holistic strategies that consider not only mobility but also the quality of life of the residents, the social fabric where each measure is applied, and biodiversity in cities. SUMP are still seen as tools within a theoretical framework. Governments need to be determined to work together with the public in order to implement each of these measures progressively by applying a common strategy that will serve as an essential structure for the city as a whole.
BIBLIOGRAPHY
Adell E., Ljungberg C. (2014) Guidelines. The Poly-SUMP Methodology. How to develop a Sustainable Urban Mobility Plan for a polycentric region, Brussels, 36p.
APTeMUS Asociación Profesional de Técnicos en Movilidad Urbana Sostenible (2016) Inventario de Planes de Movilidad Urbana Sostenible (PMUS) en España. Available at: http://www.aptemus.org/inventario-pmus-espana-marzo-de-2016/
Davies Sala C., Mínquez Alarcón E. (2016) Inventario de Planes de Movilidad Urbana Sostenible en España a marzo de 2016, Asociación Profesional de Técnicos en Movilidad Urbana Sostenible.
Díez Martines JM., López Lambas ME. (2014) Planes de Movilidad Urbana Sostenible en las Ciudades Españolas, Congreso Nacional del Medio Ambiente CONAMA 2014.
© AET 2016 and contributors20

Dobbs, R. et al. (2011). Urban world: Mapping the economic power of cities. Journal of Monetary Economics, 36 (March), p.49.
ELTIS Observatorio de la Movilidad Urbana (2015) Planes de movilidad: herramientas y recursos. Available at: http://www.eltis.org/es/mobility_plans/planes-de-movilidad-herramientas-y-recursos
European Commission (2001) White Paper. European transport policy for 2010: time to decide, Brussels, COM (2001) 370 final.
European Commission (2006) Keep Europe moving -Sustainable mobility for our continent. Mid-term review of the European Commission’s 2001 Transport White Paper, Brussels, COM (2006) 35 final.
European Commission (2007) Green Paper. Towards a new culture for urban mobility, Brussels, COM 551 final.
European Commission (2009) Action Plan on Urban Mobility, Communication from the Commission to the European Parliament, the Council, the European Economic and Social Committee and the Committee of the Regions, Brussels, COM 490 final.
European Commission (2011) White Paper. Roadmap to a Single European Transport Area – Towards a competitive and resource efficient transport system, Brussels, COM 144 final.
European Commission (2013) Together towards competitive and resource-efficient urban mobility, Communication from the Commission to the European Parliament, the Council, the European Economic and Social Committee and the Committee of the Regions, Brussels, COM 913 final.
Government of Spain (2011) Law 2/2011 of Sustainable Economy, BOE nº 55 2011, BOE-A-2011-4117.
IDAE Instituto para la Diversificación y Ahorro de la Energía (2003) Estrategia de Ahorro y Eficiencia Energética en España 2004-2012.
IDAE Instituto para la Diversificación y Ahorro de la Energía (2006): Guía Práctica para el desarrollo e implementación de un PMUS, Ministry of Industry.
Mataix González C. (2010), Movilidad Urbana Sostenible: un reto energético y ambiental, Argumentos para la Cultura, Madrid, 74p.
© AET 2016 and contributors21

Spanish Ministry of Development (2005) PEIT: Plan Estratégico de Infraestructuras y Transporte 2005-2020, Madrid, 182 p. Available at: http://www.fomento.gob.es/mfom/lang_castellano/_especiales/peit/
United Nations (2014) World Urbanization Prospects, Department of Economic and Social, New York. Available at: https://esa.un.org/unpd/wup/Publications/Files/WUP2014-Highlights.pdf
Wefering F., Rupprecht S., Bührmann S., Böhler-Baedeker S. (2014) Guidelines. Developing and Implementing a Sustainable Urban Mobility Plan, Brussels, 151p.
© AET 2016 and contributors22

NOTES
1 The subjects included at least in a Sustainable Mobility Plans are: the diagnosis of the situation, the objectives to be achieved, the adopted measures, the appropriate mechanisms to funded the plan and the procedures for monitoring, evaluation and review and finally an analysis of costs and the economic, social and environmental benefits (BOE no. 55 of 5 March 2011).
2 The questionnaire has 100 questions yes / no. There are 13 questions which are considered essential. A plan to be considered a Sustainable Mobility Urban Plan should answer to all of these fundamental questions “yes”. Survey available in: https://www.mobility-academy.eu/mod/page/view.php?id=936
3 An example, the eco-district Vauban (Freiburg 2006-2014). The parking regulation has a severe limitation of vehicles’ circulation in the project area.
© AET 2016 and contributors23