labor market information training modules · these modules were developed as part of jff’s...
TRANSCRIPT

PATHWAYS TO ECONOMIC OPPORTUNITY
These modules were developed as part of JFF’s GreenforceInitiative in partnership with the National Wildlife Federation.
Please contact Sara Lamback ([email protected]) with any questions regarding the content.
LABOR MARKET INFORMATION TRAINING MODULES

Part I: Analyzing and Applying Labor Market Information
PART 1: LEARNING OBJECTIVES
1. Understand the definition of labor market information (LMI)
2. Understand key terms and concepts related to labor market information research
3. Understand the difference between traditional and real-time LMI (RT LMI)
4. Understand the benefits and limitations of both traditional and RT LMI

LABOR MARKET INFORMATION
Labor Market Information can be defined as the systematic collection, analysis, reporting, and publishing of a broad range of data that describes current economic conditions within a given geographic area.
> Wages/benefits> Unemployment rate> Skill requirements> Career information> Projections> Demographics> Geography> Company downsizing and
expansion> Job opportunities> Industry trends> Demand and growth
WHY IS LABOR MARKET INFORMATION IMPORTANT?
> Labor market information can inform decisions related to workforce and economic development, education and training, and other key policies.
> It is an important tool for a variety of stakeholders, including: – Businesses– Workforce agencies– Researchers– Colleges – Policymakers – Job seekers– Students

6
WHY IS LABOR MARKET INFORMATION USEFUL FOR COLLEGES?
• OUTCOMES: Match and revise program offerings to economic demandDemand Driven Programming
• OUTCOMES: Align learning outcomes to identified skill and qualification requirements
Curriculum Content
• OUTCOMES: Spur and enhance conversations with employersEmployer Engagement
• OUTCOMES: Improve matching for student employment Career Guidance
LMI Also adds significant value to overall strategic and administrative planning

THE IMPORTANCE OF LMI
• Education enrollees• Education completers• Unemployed• Employed
Supply
• New hires• Replacement hires
Demand• Qualified job referrals• Improved placements• Improved employer
relationships• Improved counseling
tools• Sector strategy
alignment
StrategicAlignment
1. Understand the definition of labor market information (LMI)
2. Understand key terms and concepts related to LMI research
3. Understand the difference between traditional and real-time LMI (RT LMI)
4. Understan the benefits and limitations of both traditional and RT LMI
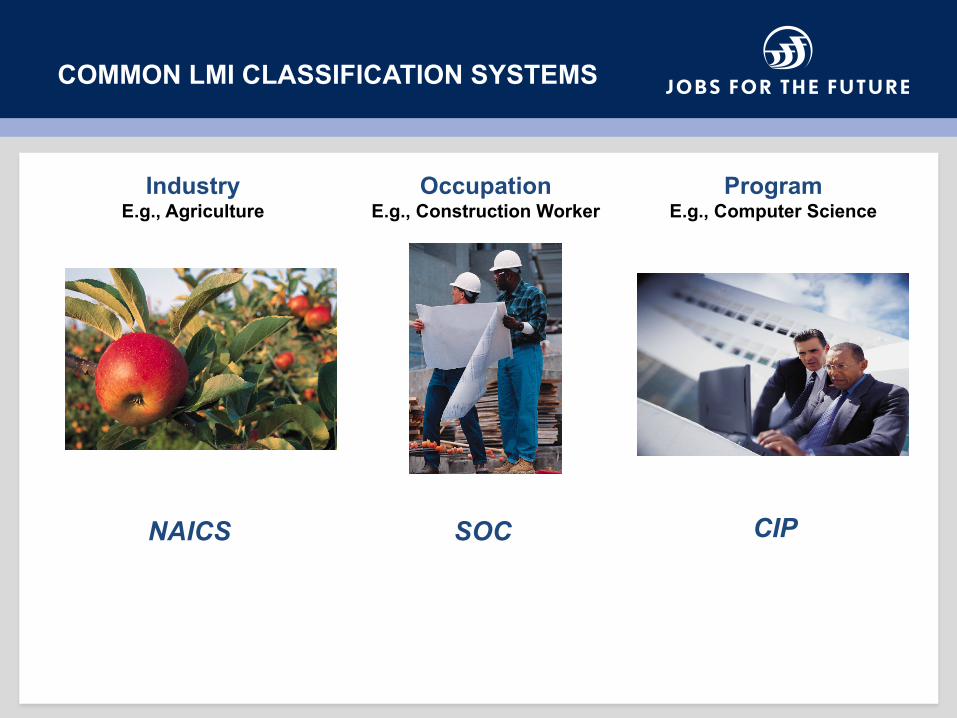
COMMON LMI CLASSIFICATION SYSTEMS
IndustryE.g., Agriculture
OccupationE.g., Construction Worker
ProgramE.g., Computer Science
NAICS SOC CIP
WHAT IS A NAICS CODE?
> North American Industry Classification System (NAICS): These codes are used to classify businesses into 20 industry sectors, according to the type of economic activity in which an establishment is involved (e.g., manufacturing, agriculture)
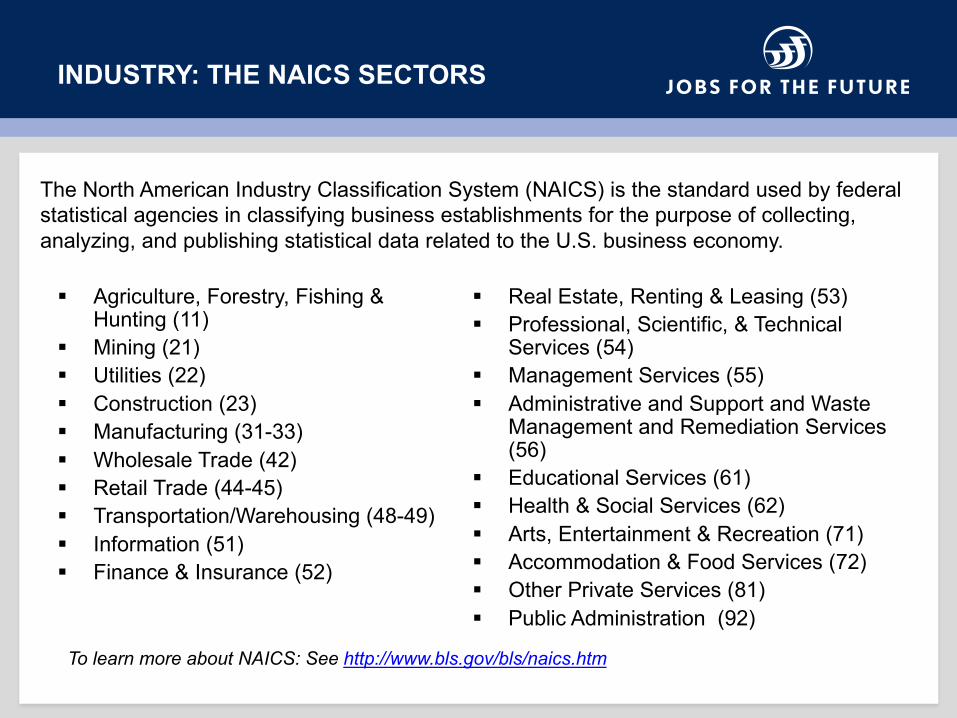
INDUSTRY: THE NAICS SECTORS
§ Agriculture, Forestry, Fishing & Hunting (11)
§ Mining (21)§ Utilities (22)§ Construction (23)§ Manufacturing (31-33)§ Wholesale Trade (42)§ Retail Trade (44-45)§ Transportation/Warehousing (48-49)§ Information (51)§ Finance & Insurance (52)
§ Real Estate, Renting & Leasing (53)§ Professional, Scientific, & Technical
Services (54)§ Management Services (55)§ Administrative and Support and Waste
Management and Remediation Services (56)
§ Educational Services (61)§ Health & Social Services (62)§ Arts, Entertainment & Recreation (71)§ Accommodation & Food Services (72)§ Other Private Services (81)§ Public Administration (92)
The North American Industry Classification System (NAICS) is the standard used by federal statistical agencies in classifying business establishments for the purpose of collecting, analyzing, and publishing statistical data related to the U.S. business economy.
To learn more about NAICS: See http://www.bls.gov/bls/naics.htm
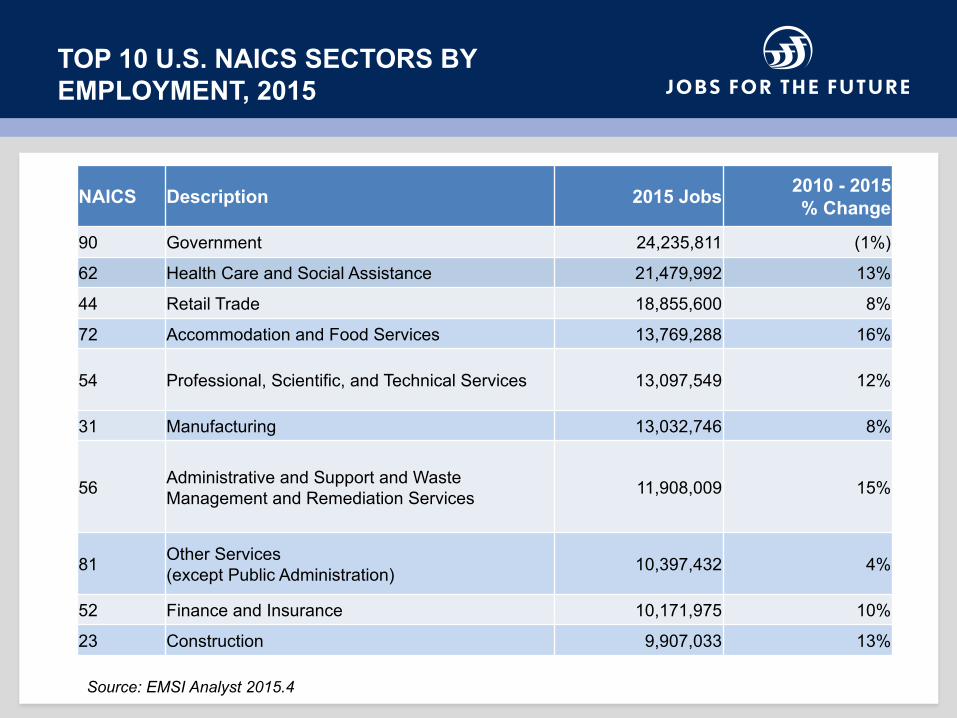
TOP 10 U.S. NAICS SECTORS BY EMPLOYMENT, 2015
NAICS Description 2015 Jobs 2010 - 2015 % Change
90 Government 24,235,811 (1%)
62 Health Care and Social Assistance 21,479,992 13%
44 Retail Trade 18,855,600 8%
72 Accommodation and Food Services 13,769,288 16%
54 Professional, Scientific, and Technical Services 13,097,549 12%
31 Manufacturing 13,032,746 8%
56 Administrative and Support and Waste Management and Remediation Services 11,908,009 15%
81 Other Services (except Public Administration) 10,397,432 4%
52 Finance and Insurance 10,171,975 10%
23 Construction 9,907,033 13%
Source: EMSI Analyst 2015.4
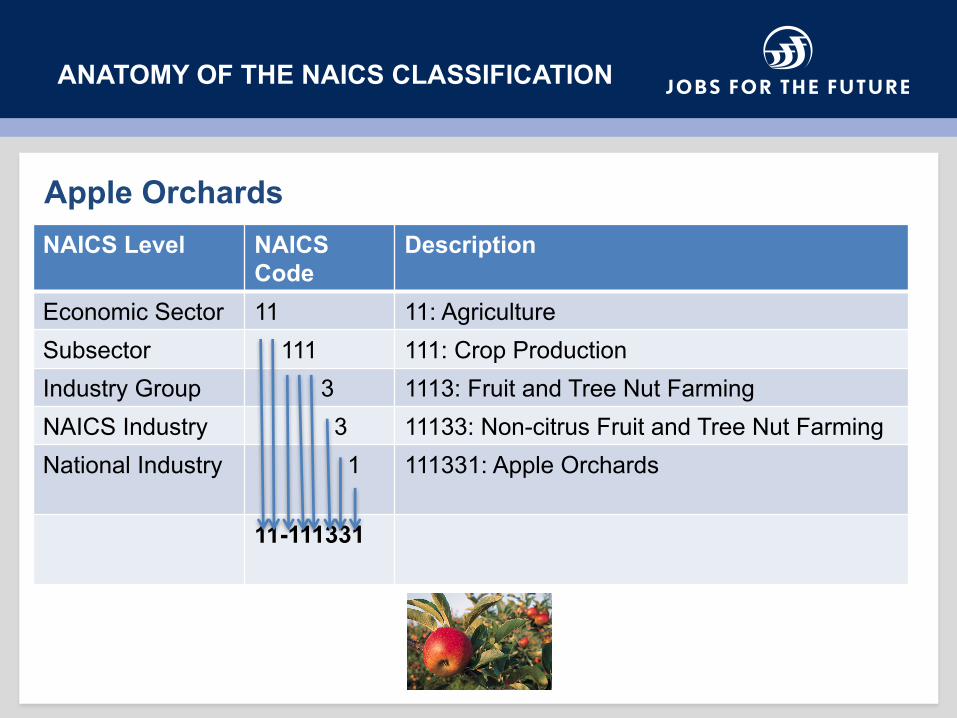
ANATOMY OF THE NAICS CLASSIFICATION
Apple Orchards NAICS Level NAICS
CodeDescription
Economic Sector 11 11: Agriculture Subsector 111 111: Crop Production Industry Group 3 1113: Fruit and Tree Nut Farming NAICS Industry 3 11133: Non-citrus Fruit and Tree Nut FarmingNational Industry 1 111331: Apple Orchards
11-111331
WHAT IS A SOC CODE?
> Standard Occupational Classification (SOC): These six-digit codes classify workers into occupational categories; all workers are classified into one of 840 occupations (e.g., medical assistant, hydrologist, or machinist).

STANDARD OCCUPATION CODE (SOC)
> Management> Business & Financial Operations> Computer & Mathematical Science > Architecture & Engineering > Life, Physical, & Social Science > Community & Social Service > Legal > Education, Training, & Library > Arts, Design, Entertainment, Sports,
& Media > Healthcare Practitioner & Technical > Healthcare Support
> Protective Service > Food Preparation & Serving Related > Building & Grounds Cleaning &
Maintenance > Personal Care & Service > Sales & Related > Office & Administrative Support > Farming, Fishing, & Forestry > Construction & Extraction > Installation, Maintenance, & Repair > Production > Transportation & Material Moving > Military Specific Occupations
SOC covers all occupations. Occupations are classified based on work performed, and the skills, education, or training needed to performed the work competently.
The 23 Broad SOC Clusters are:
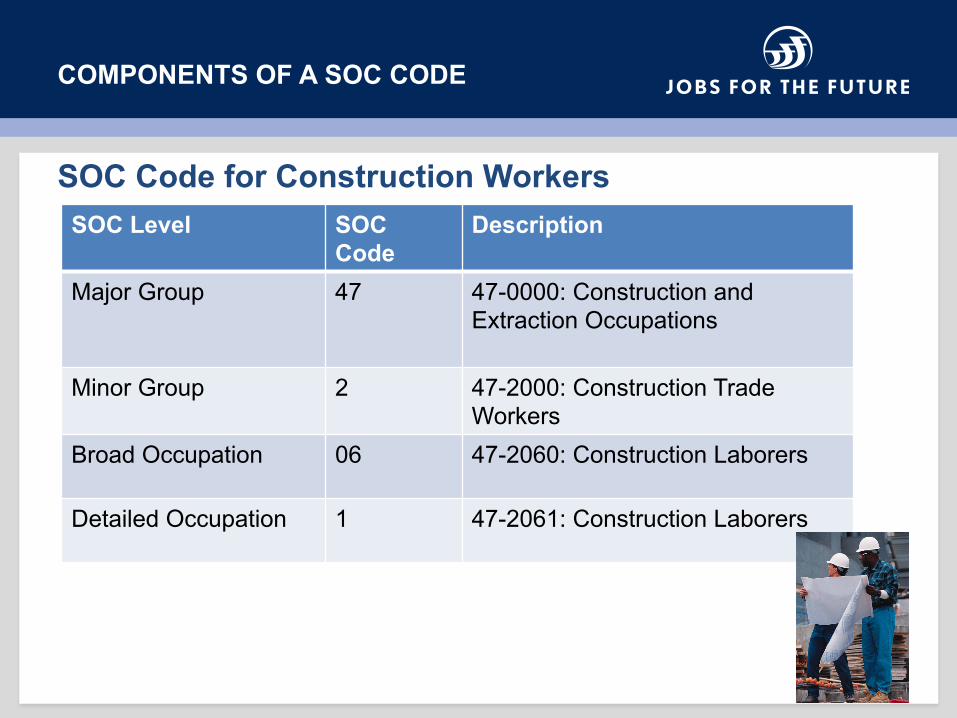
COMPONENTS OF A SOC CODE
SOC Code for Construction Workers SOC Level SOC
Code Description
Major Group 47 47-0000: Construction and Extraction Occupations
Minor Group 2 47-2000: Construction Trade Workers
Broad Occupation 06 47-2060: Construction Laborers
Detailed Occupation 1 47-2061: Construction Laborers
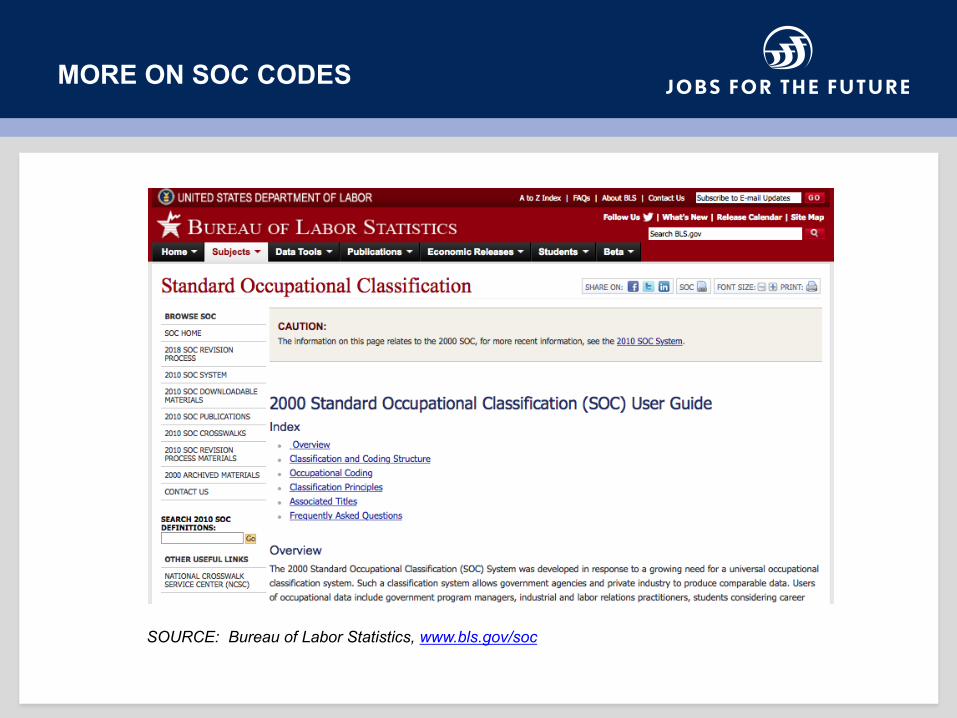
MORE ON SOC CODES
SOURCE: Bureau of Labor Statistics, www.bls.gov/soc
WHAT IS A CIP CODE?
> Classification of Instructional Programs (CIP): A six-digit code that enables data to be collected an analyzed for a field of study or academic discipline within U.S. institutions of higher education.
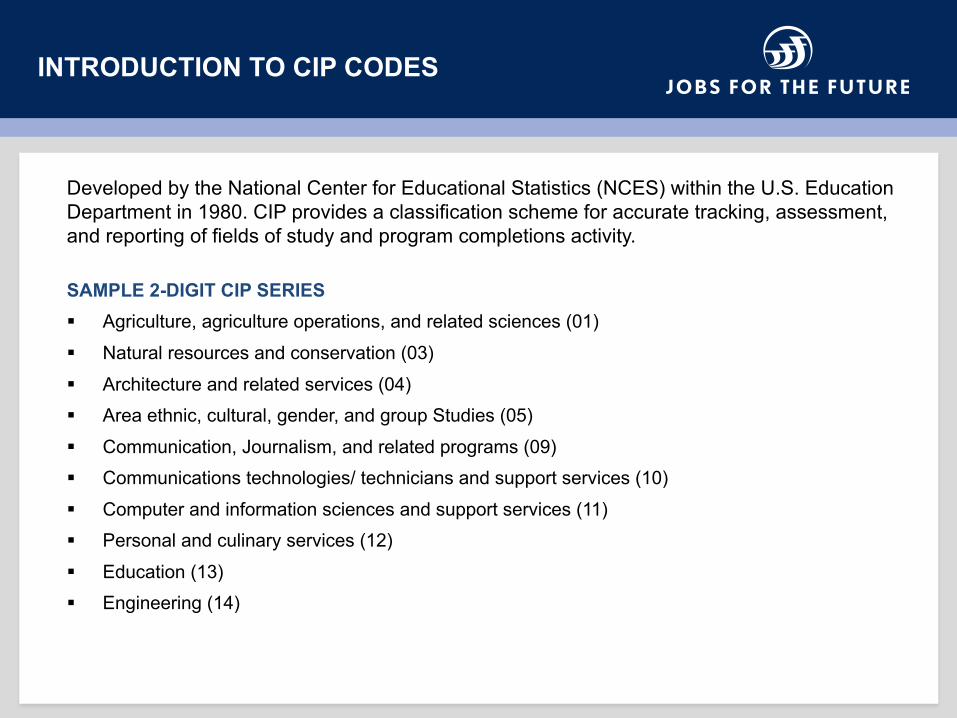
INTRODUCTION TO CIP CODES
SAMPLE 2-DIGIT CIP SERIES§ Agriculture, agriculture operations, and related sciences (01) § Natural resources and conservation (03)§ Architecture and related services (04) § Area ethnic, cultural, gender, and group Studies (05) § Communication, Journalism, and related programs (09) § Communications technologies/ technicians and support services (10) § Computer and information sciences and support services (11)§ Personal and culinary services (12)§ Education (13)§ Engineering (14)
Developed by the National Center for Educational Statistics (NCES) within the U.S. Education Department in 1980. CIP provides a classification scheme for accurate tracking, assessment, and reporting of fields of study and program completions activity.
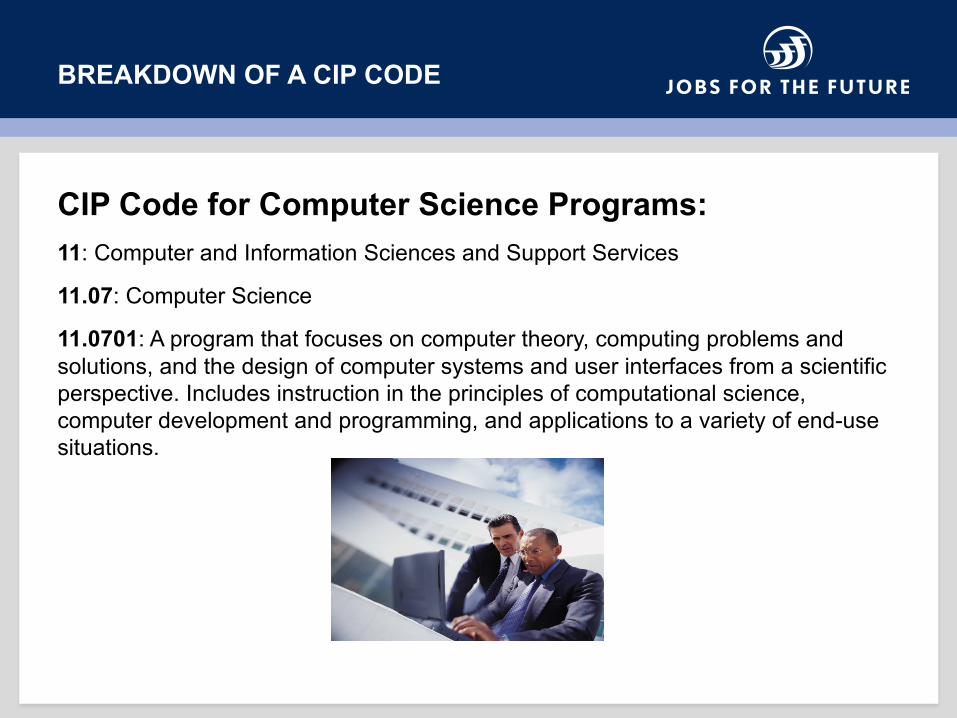
BREAKDOWN OF A CIP CODE
CIP Code for Computer Science Programs: 11: Computer and Information Sciences and Support Services
11.07: Computer Science
11.0701: A program that focuses on computer theory, computing problems and solutions, and the design of computer systems and user interfaces from a scientific perspective. Includes instruction in the principles of computational science, computer development and programming, and applications to a variety of end-use situations.
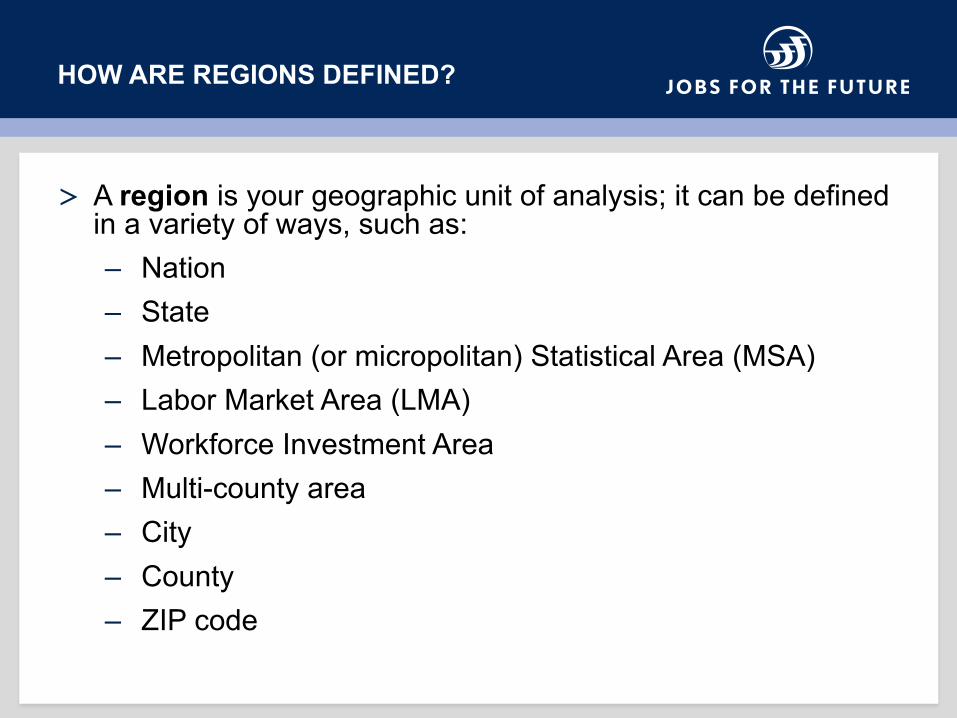
HOW ARE REGIONS DEFINED?
> A region is your geographic unit of analysis; it can be defined in a variety of ways, such as: – Nation – State – Metropolitan (or micropolitan) Statistical Area (MSA)– Labor Market Area (LMA)– Workforce Investment Area– Multi-county area– City– County– ZIP code

EXAMPLES OF REGIONS
> Metropolitan Statistical Areas (MSAs): large multi-county regions that describe major city economies.
– Contain areas with at least one urban area with a population over 50,000
> Labor Market Area (LMAs): describe the integration between cities, towns, and unincorporated areas not included in metro- or micro-politan statistical areas.
> Counties: Regions within states. > Zip Codes: Smaller regions within counties.
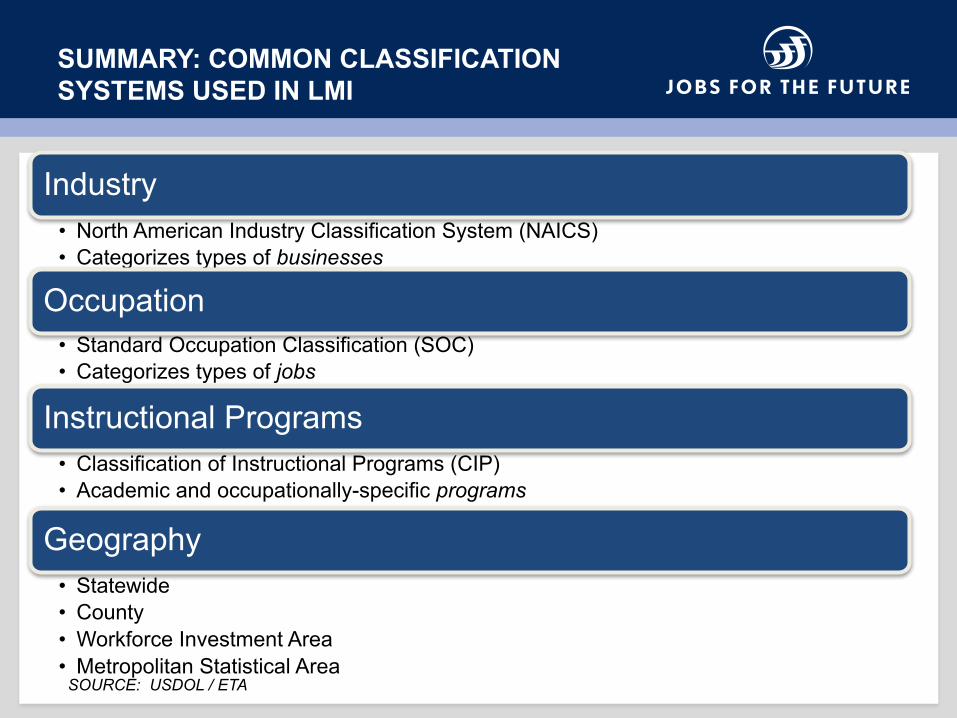
SUMMARY: COMMON CLASSIFICATION SYSTEMS USED IN LMI
Industry• North American Industry Classification System (NAICS)• Categorizes types of businesses
Occupation• Standard Occupation Classification (SOC)• Categorizes types of jobs
Instructional Programs• Classification of Instructional Programs (CIP)• Academic and occupationally-specific programs
Geography• Statewide• County• Workforce Investment Area• Metropolitan Statistical Area
SOURCE: USDOL / ETA
1. Understand the definition of labor market information (LMI)
2. Understand key terms and concepts related to labor market information research
3. Understand the difference between traditional and RT LMI
4. Understand the benefits and limitations of both traditional and RT LMI
TRADTIONAL LMI
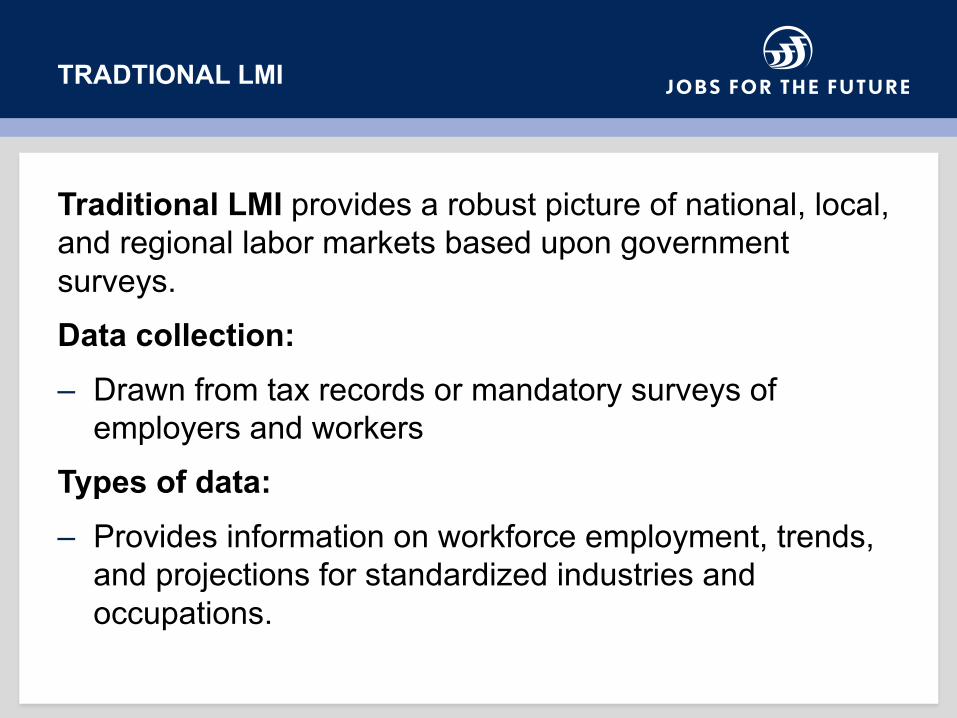
Traditional LMI provides a robust picture of national, local, and regional labor markets based upon government surveys. Data collection: – Drawn from tax records or mandatory surveys of
employers and workers Types of data: – Provides information on workforce employment, trends,
and projections for standardized industries and occupations.
WHERE IS TRADITIONAL LMI AVAILABLE?
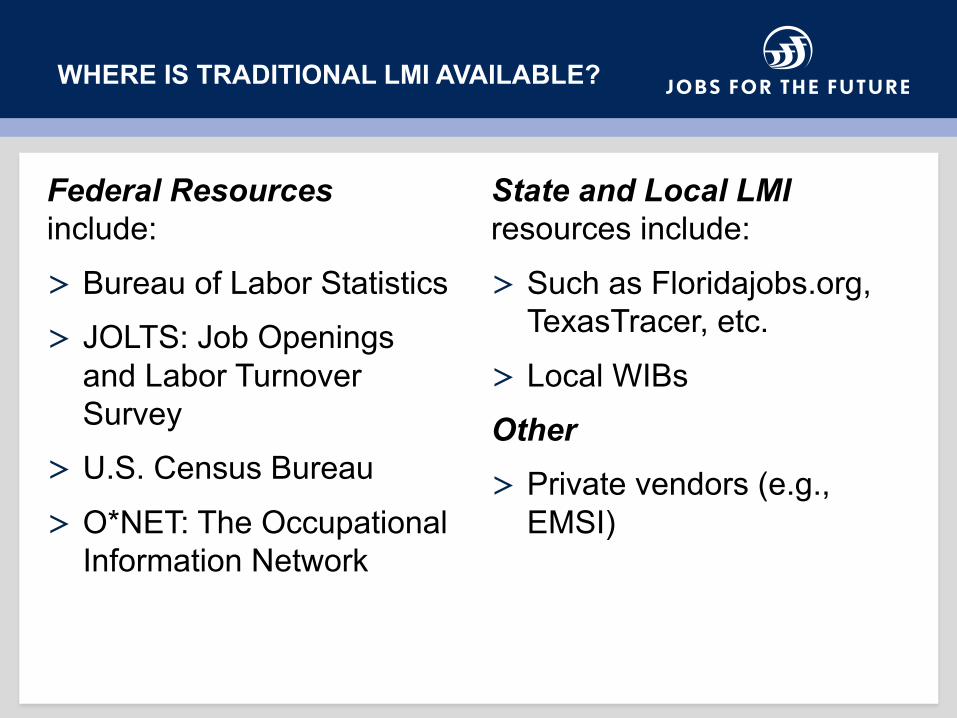
Federal Resources include:
> Bureau of Labor Statistics > JOLTS: Job Openings
and Labor Turnover Survey
> U.S. Census Bureau
> O*NET: The Occupational Information Network
State and Local LMI resources include:
> Such as Floridajobs.org, TexasTracer, etc.
> Local WIBsOther> Private vendors (e.g.,
EMSI)

WHAT CAN TRADITIONAL LMI TELL US ABOUT BOSTON?
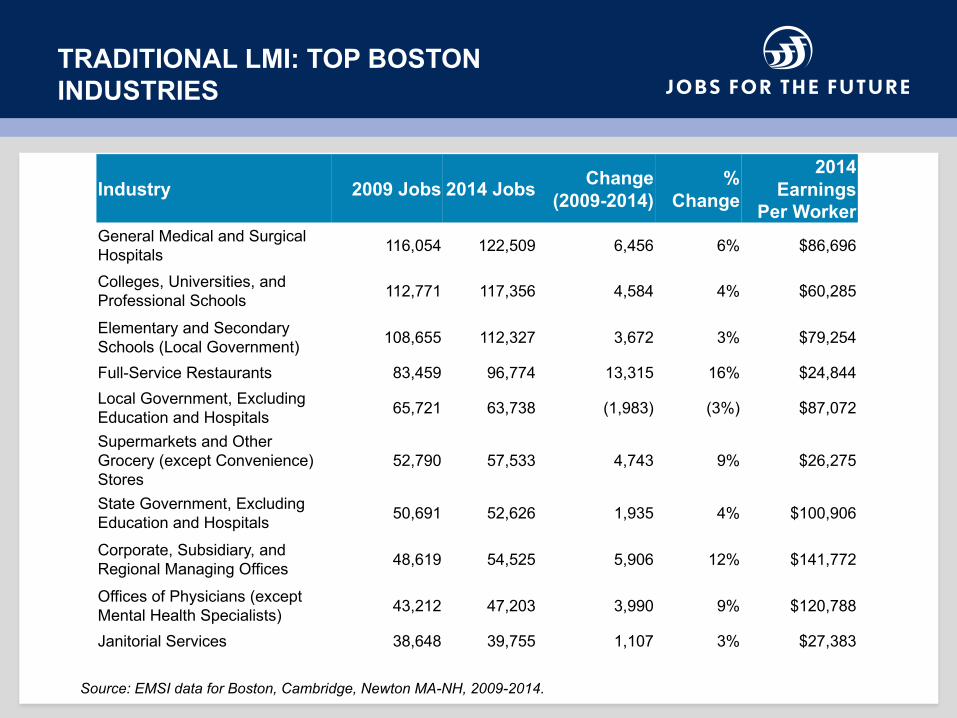
Source: EMSI data for Boston, Cambridge, Newton MA-NH, 2009-2014.
TRADITIONAL LMI: TOP BOSTON INDUSTRIES
Industry 2009 Jobs 2014 Jobs Change (2009-2014)
% Change
2014 Earnings
Per WorkerGeneral Medical and Surgical Hospitals 116,054 122,509 6,456 6% $86,696
Colleges, Universities, and Professional Schools 112,771 117,356 4,584 4% $60,285
Elementary and Secondary Schools (Local Government) 108,655 112,327 3,672 3% $79,254
Full-Service Restaurants 83,459 96,774 13,315 16% $24,844Local Government, Excluding Education and Hospitals 65,721 63,738 (1,983) (3%) $87,072
Supermarkets and Other Grocery (except Convenience) Stores
52,790 57,533 4,743 9% $26,275
State Government, Excluding Education and Hospitals 50,691 52,626 1,935 4% $100,906
Corporate, Subsidiary, and Regional Managing Offices 48,619 54,525 5,906 12% $141,772
Offices of Physicians (except Mental Health Specialists) 43,212 47,203 3,990 9% $120,788
Janitorial Services 38,648 39,755 1,107 3% $27,383

TRADITIONAL LMI: SELECT BOSTON OCCUPATIONS
Occupation 2009 Jobs 2014 Jobs Change % Change Median Earnings
Industrial Production Managers 3,016 3,027 11 0% $47.79
Nuclear Technicians 74 75 1 1% $38.77
Solar Photovoltaic Installers 69 78 9 13% $22.29
Wind Turbine Service Technicians 49 30 (19) (39%) $21.52
Totals 3,208 3,210 2 0.1% $46.74/hr
Source: EMSI data for Boston, Cambridge, Newton MA-NH, 2009-2014.
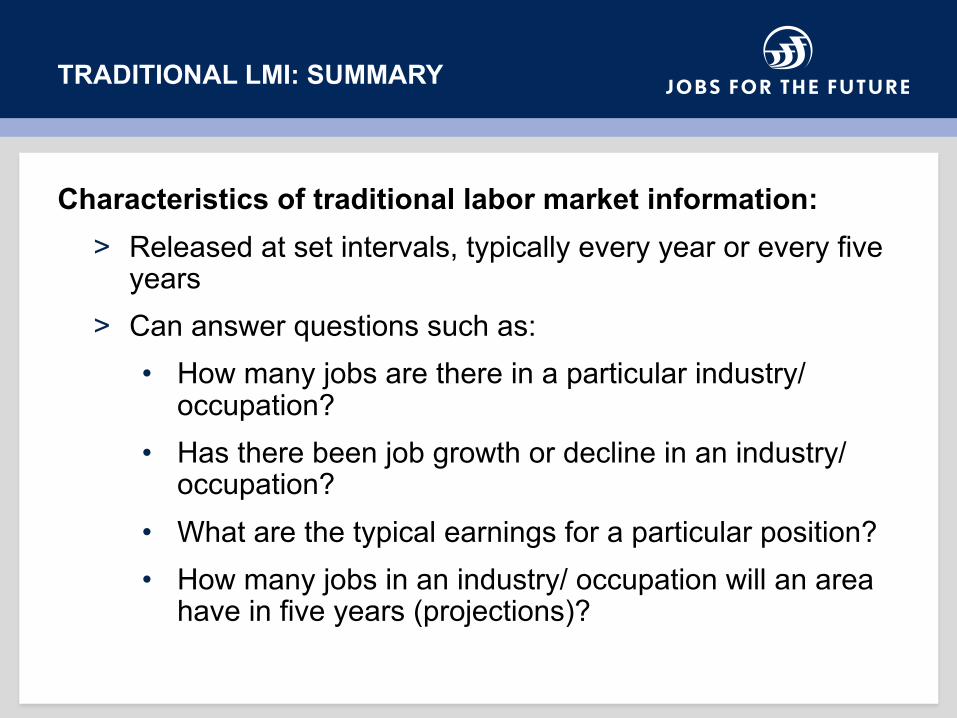
TRADITIONAL LMI: SUMMARY
Characteristics of traditional labor market information: > Released at set intervals, typically every year or every five
years> Can answer questions such as:
• How many jobs are there in a particular industry/ occupation?
• Has there been job growth or decline in an industry/ occupation?
• What are the typical earnings for a particular position? • How many jobs in an industry/ occupation will an area
have in five years (projections)?
REAL TIME LMI
> Real-time LMI refers to online job postings and resume data obtained from Internet job boards, company websites, and newspapers using “spidering” technology.
LMI VENDORS
32
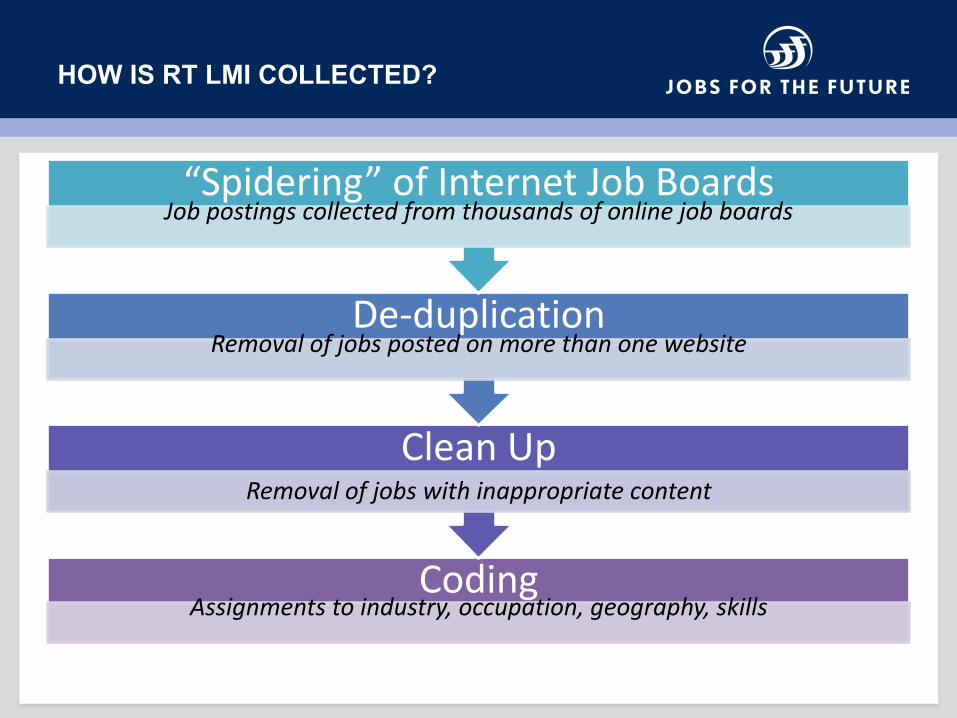
HOW IS RT LMI COLLECTED?
CodingAssignmentstoindustry,occupation,geography,skills
CleanUpRemovalofjobswithinappropriatecontent
De-duplicationRemovalofjobspostedonmorethanonewebsite
“Spidering”ofInternetJobBoardsJobpostingscollectedfromthousandsofonlinejobboards
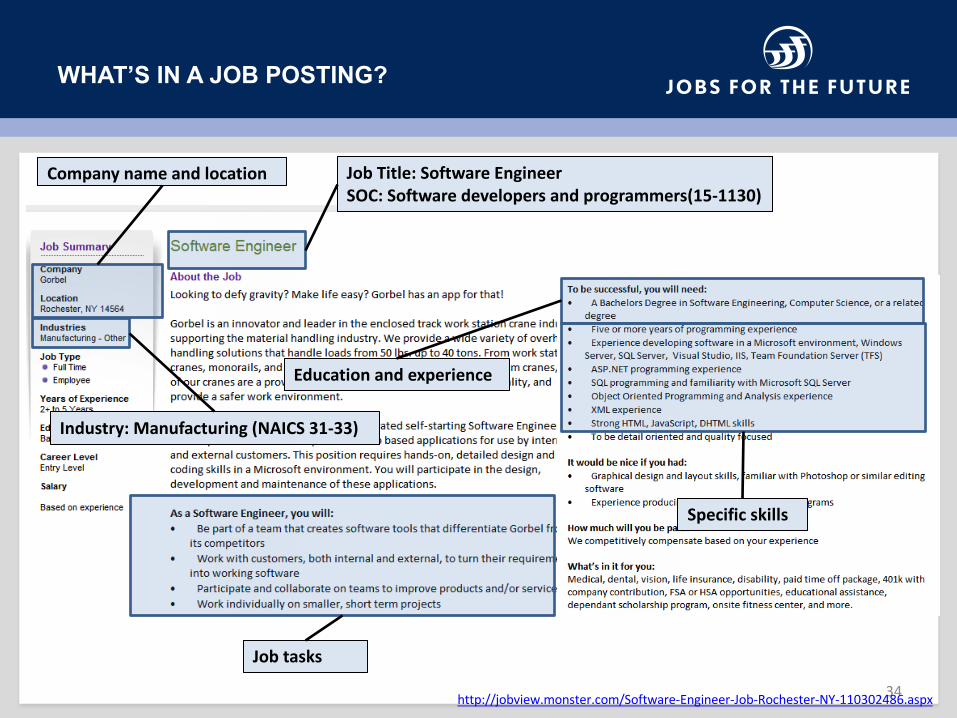
WHAT’S IN A JOB POSTING?
34
JobTitle:SoftwareEngineerSOC:Softwaredevelopersandprogrammers(15-1130)
Educationandexperience
Specificskills
Jobtasks
Companynameandlocation
Industry:Manufacturing(NAICS31-33)
http://jobview.monster.com/Software-Engineer-Job-Rochester-NY-110302486.aspx

KEY CHARACTERISTICS AND STRENGTHS
> Timeliness: Vendors spider up to 20,000 sites daily. > Quality assurance: Complex algorithms to increase integrity and reliability
of data provided for analysis and decision making. Some benchmark against Job Opening and Labor Turnover Survey (JOLTS).
> Current hiring trends: – In-demand experience levels, education requirements, skills and
certifications– Not based on estimates or projections– Does not require active employer participation– Key word searches allow us to find information on new and emerging
industries and occupations• Job Title Search – Health Informatics, medical coder• New Industry Search – Nanotechnology• Emerging skills – “cloud computing or apps developer”
Source: JFF (http://www.jff.org/publications/education/vendor-product-review-consumers-guide-re/1417)

WHAT TYPES OF JOBS DOES RT LMI CAPTURE BEST?
Well Represented• Arts, design, entertainment
• Building and grounds cleaning and maintenance
• Food preparation and serving related
• Legal
• Office & Administrative
• Personal Care and service
• Production
• Protective Services
• Sales & Retail positions
• Transportation & Material moving
Under Represented• Construction
• Farming
• Community and social services*
• Military Specific*
* RT LMI algorithms have difficulty with these postings
36Source: Burning Glass
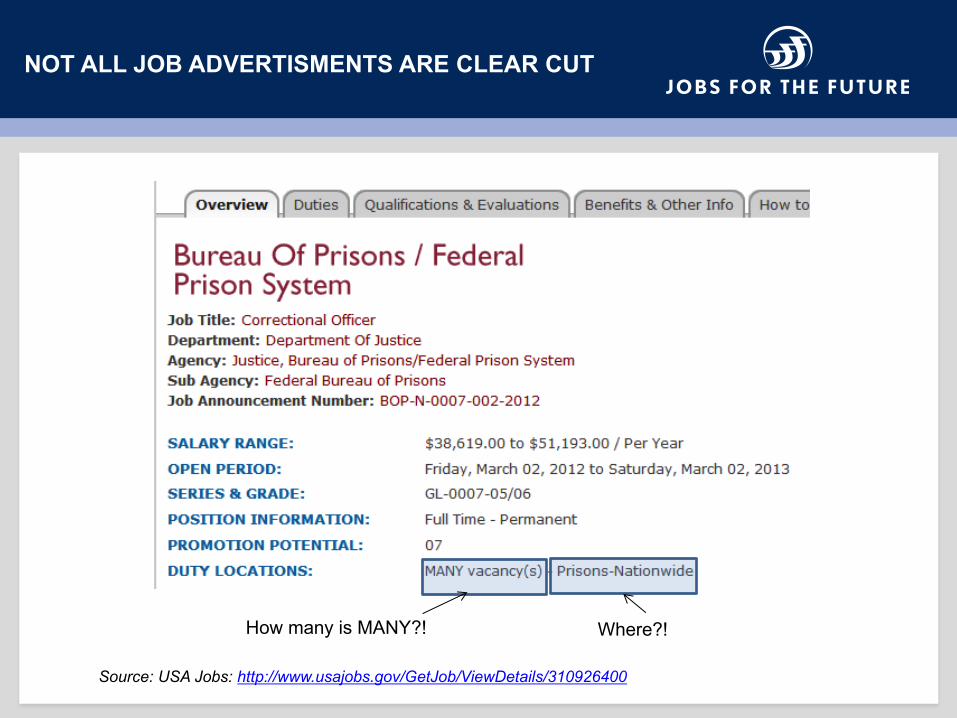
NOT ALL JOB ADVERTISMENTS ARE CLEAR CUT
How many is MANY?! Where?!
Source: USA Jobs: http://www.usajobs.gov/GetJob/ViewDetails/310926400

WHAT CAN REAL-TIME LMI TELL US ABOUT BOSTON?
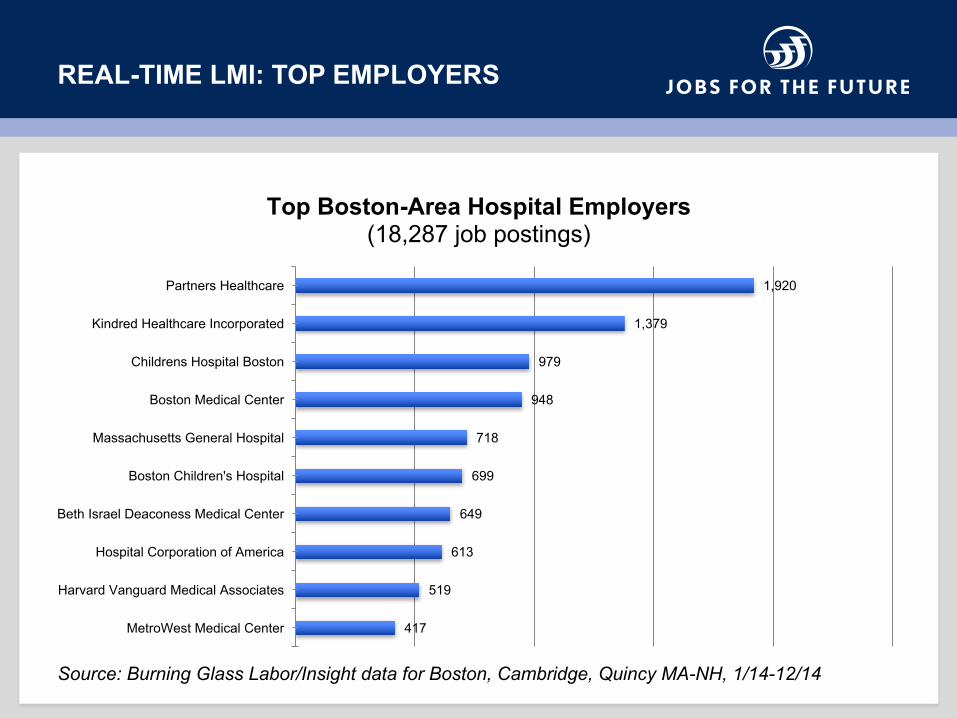
REAL-TIME LMI: TOP EMPLOYERS
1,920
1,379
979
948
718
699
649
613
519
417
Partners Healthcare
Kindred Healthcare Incorporated
Childrens Hospital Boston
Boston Medical Center
Massachusetts General Hospital
Boston Children's Hospital
Beth Israel Deaconess Medical Center
Hospital Corporation of America
Harvard Vanguard Medical Associates
MetroWest Medical Center
Top Boston-Area Hospital Employers(18,287 job postings)
Source: Burning Glass Labor/Insight data for Boston, Cambridge, Quincy MA-NH, 1/14-12/14

REAL-TIME LMI: TOP SKILLS
2,821
1,462
1,123
1,087
888
810
805
792
705
658
Patient Care
Scheduling
Collaboration
Treatment Planning
Administrative Support
Medical Coding
Appointment Setting
Data Entry
Therapy
Daycare
Top Boston-Area Skills for the Hospital Industry(18,287 total job postings)
Source: Burning Glass Labor/Insight data for Boston, Cambridge, Quincy MA-NH, 1/14-12/14
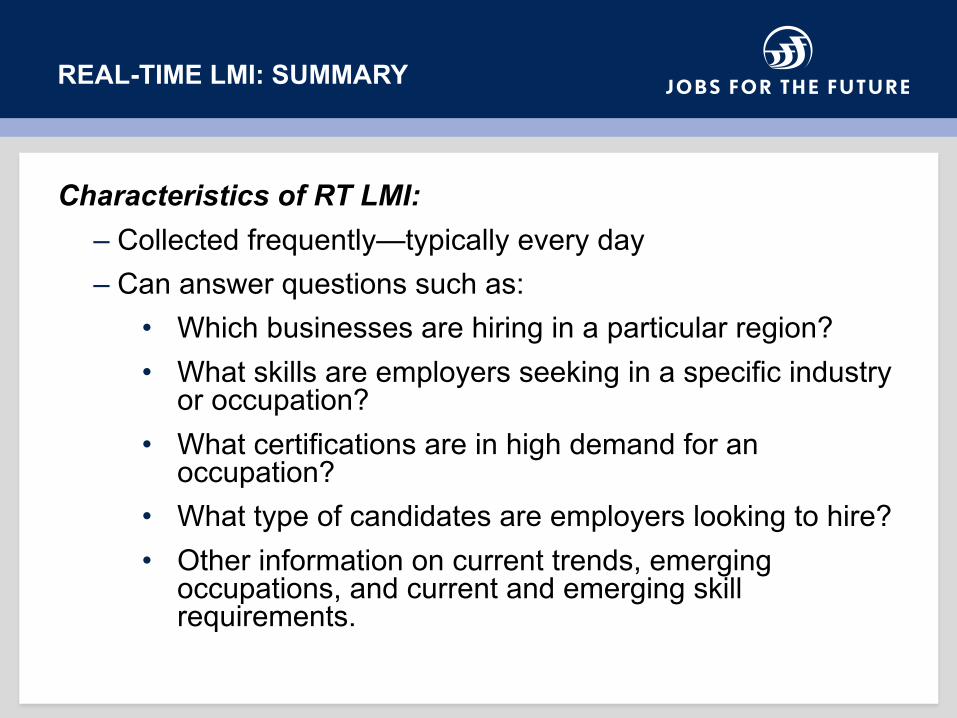
REAL-TIME LMI: SUMMARY
Characteristics of RT LMI: – Collected frequently—typically every day– Can answer questions such as:
• Which businesses are hiring in a particular region? • What skills are employers seeking in a specific industry
or occupation? • What certifications are in high demand for an
occupation? • What type of candidates are employers looking to hire? • Other information on current trends, emerging
occupations, and current and emerging skill requirements.
1. Understand the definition of labor market information (LMI)
2. Understand key terms and concepts related to labor market information research
3. Understand the difference between traditional and real-time LMI (RT LMI)
4. Understand the benefits and limitations of both traditional and RT LMI
43
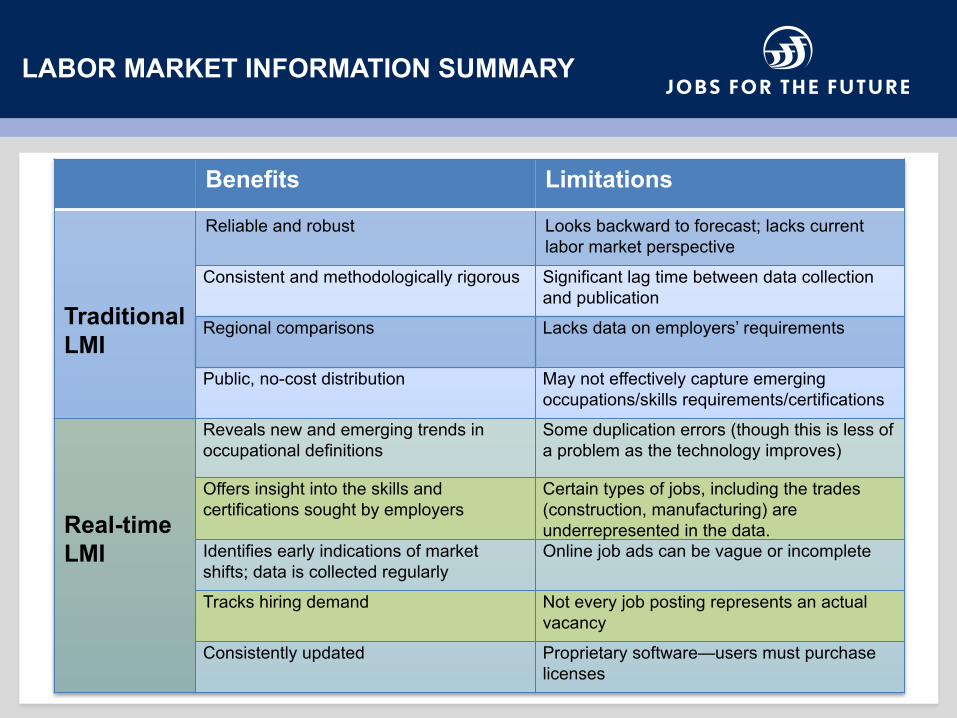
LABOR MARKET INFORMATION SUMMARY
Benefits Limitations
TraditionalLMI
Reliable and robust Looks backward to forecast; lacks current labor market perspective
Consistent and methodologically rigorous Significant lag time between data collection and publication
Regional comparisons Lacks data on employers’ requirements
Public, no-cost distribution May not effectively capture emerging occupations/skills requirements/certifications
Real-timeLMI
Reveals new and emerging trends in occupational definitions
Some duplication errors (though this is less of a problem as the technology improves)
Offers insight into the skills and certifications sought by employers
Certain types of jobs, including the trades (construction, manufacturing) are underrepresented in the data.
Identifies early indications of market shifts; data is collected regularly
Online job ads can be vague or incomplete
Tracks hiring demand Not every job posting represents an actual vacancy
Consistently updated Proprietary software—users must purchase licenses
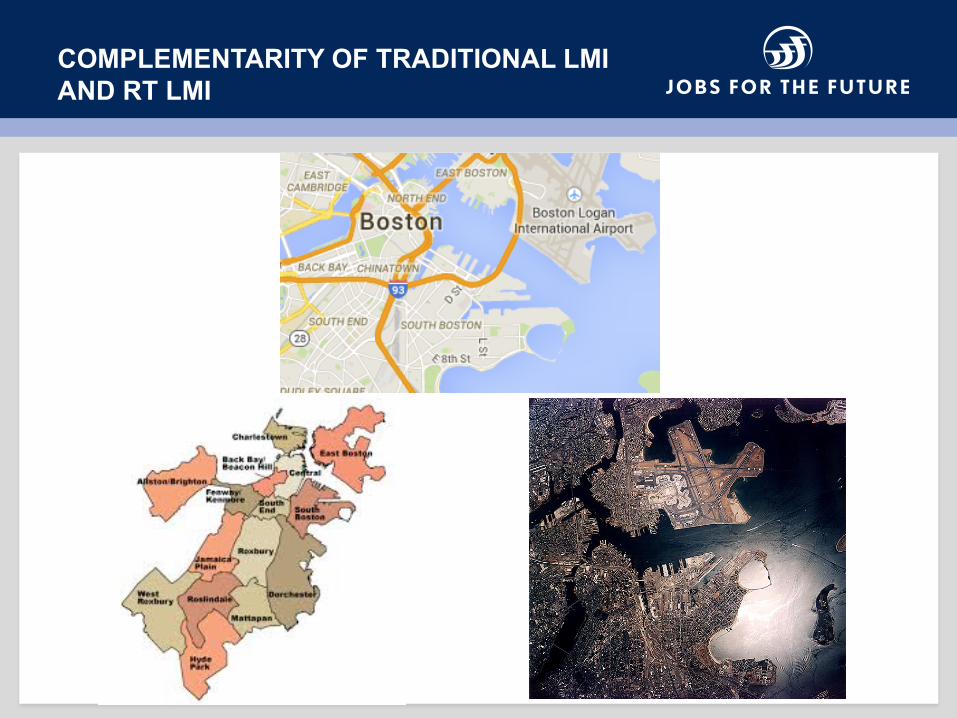
COMPLEMENTARITY OF TRADITIONAL LMI AND RT LMI

SO WHAT ARE THE TAKE-AWAYS?
> Traditional LMI and RT LMI both offer valuable information on local labor markets; they are best employed as complementary resources—since each has benefits and limitations.

Part 2: Assessing Your Local Labor Market
PART 2: LEARNING OBJECTIVES
> Identify the labor market demand in your area for target occupation(s)
> Identify the labor supply in your area for target occupation(s)

ANALYZE LOCAL LABOR MARKET DEMAND
> Download the Supply and Demand Data Elements Matrix – Identify program(s) of
focus– Identify target
occupation(s)– Determine geographic unit
of analysis (MSA, counties that comprise the college catchment area, etc.)

FOR EXAMPLE:
> Institution: Bunker Hill Community College (Boston, MA)> Program: Energy and Sustainability Management
Certificate Program> Occupation: Environmental Science and Protection
Technicians, Including Health (SOC 19-4091)> Geographic area: Boston MSA
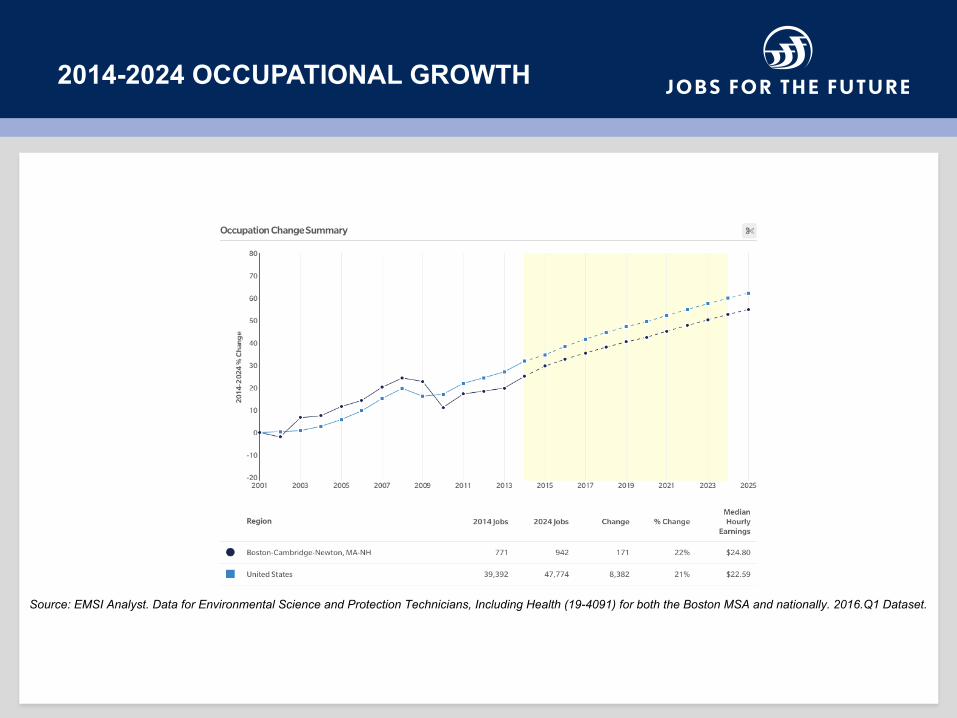
2014-2024 OCCUPATIONAL GROWTH
Source: EMSI Analyst. Data for Environmental Science and Protection Technicians, Including Health (19-4091) for both the Boston MSA and nationally. 2016.Q1 Dataset.
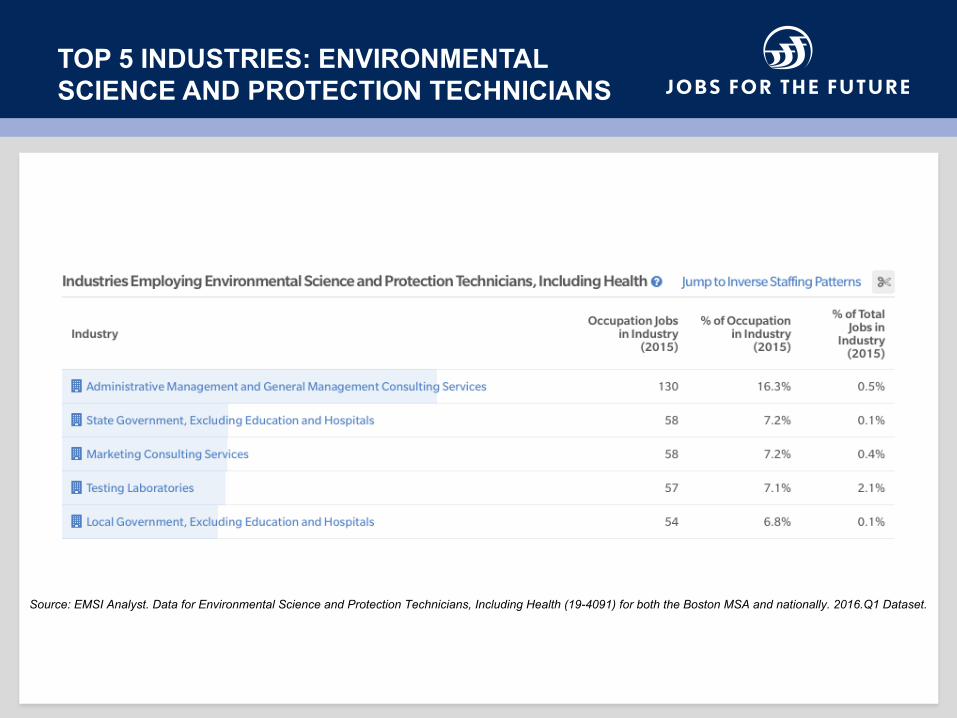
TOP 5 INDUSTRIES: ENVIRONMENTAL SCIENCE AND PROTECTION TECHNICIANS
Source: EMSI Analyst. Data for Environmental Science and Protection Technicians, Including Health (19-4091) for both the Boston MSA and nationally. 2016.Q1 Dataset.
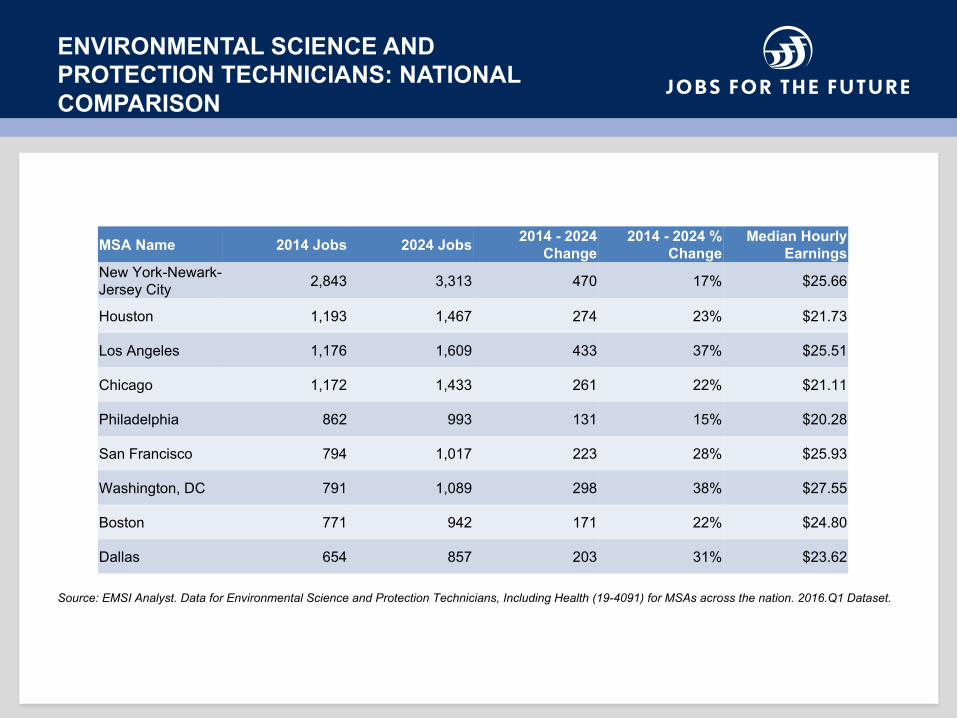
ENVIRONMENTAL SCIENCE AND PROTECTION TECHNICIANS: NATIONAL COMPARISON
MSA Name 2014 Jobs 2024 Jobs 2014 - 2024 Change
2014 - 2024 % Change
Median Hourly Earnings
New York-Newark-Jersey City 2,843 3,313 470 17% $25.66
Houston 1,193 1,467 274 23% $21.73
Los Angeles 1,176 1,609 433 37% $25.51
Chicago 1,172 1,433 261 22% $21.11
Philadelphia 862 993 131 15% $20.28
San Francisco 794 1,017 223 28% $25.93
Washington, DC 791 1,089 298 38% $27.55
Boston 771 942 171 22% $24.80
Dallas 654 857 203 31% $23.62
Source: EMSI Analyst. Data for Environmental Science and Protection Technicians, Including Health (19-4091) for MSAs across the nation. 2016.Q1 Dataset.

MAKE SURE TO CONSIDER THE LOCAL/ REGIONAL LIVING WAGE
Living wage information for the Boston Metropolitan Statistical Area:
Source: MIT Living Wage Calculator. Data retrieved from: http://livingwage.mit.edu/counties/51510

PROJECTED GROWTH BY MSA: 2014-2024
0%5%
10%15%20%25%30%35%40%
Source: EMSI Analyst. Data for Environmental Science and Protection Technicians, Including Health (19-4091) for MSAs across the nation. 2016.Q1 Dataset.
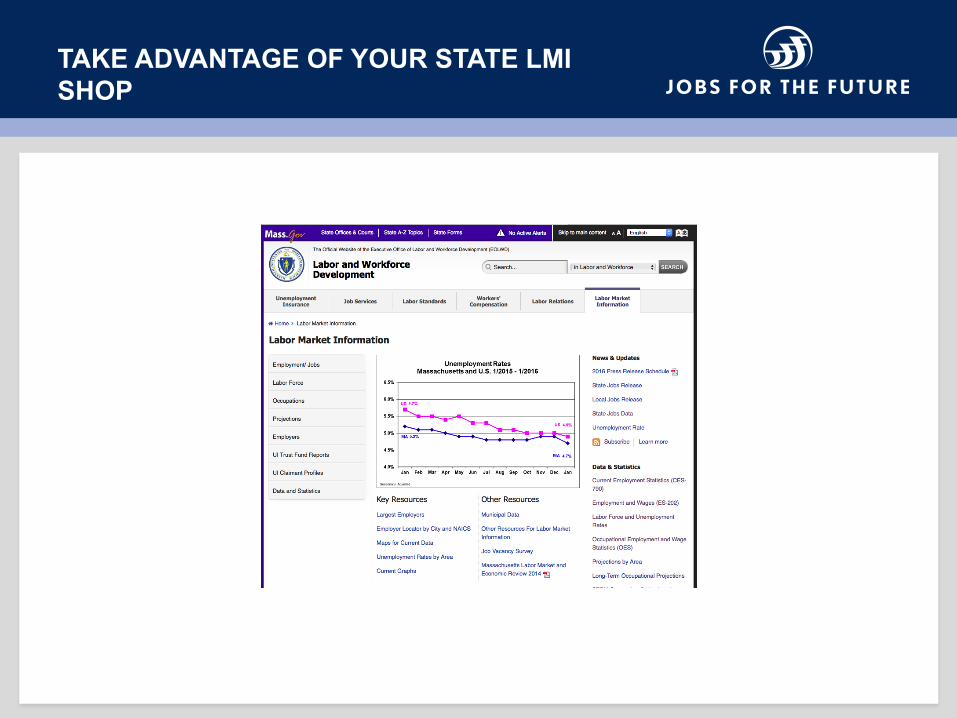
TAKE ADVANTAGE OF YOUR STATE LMISHOP
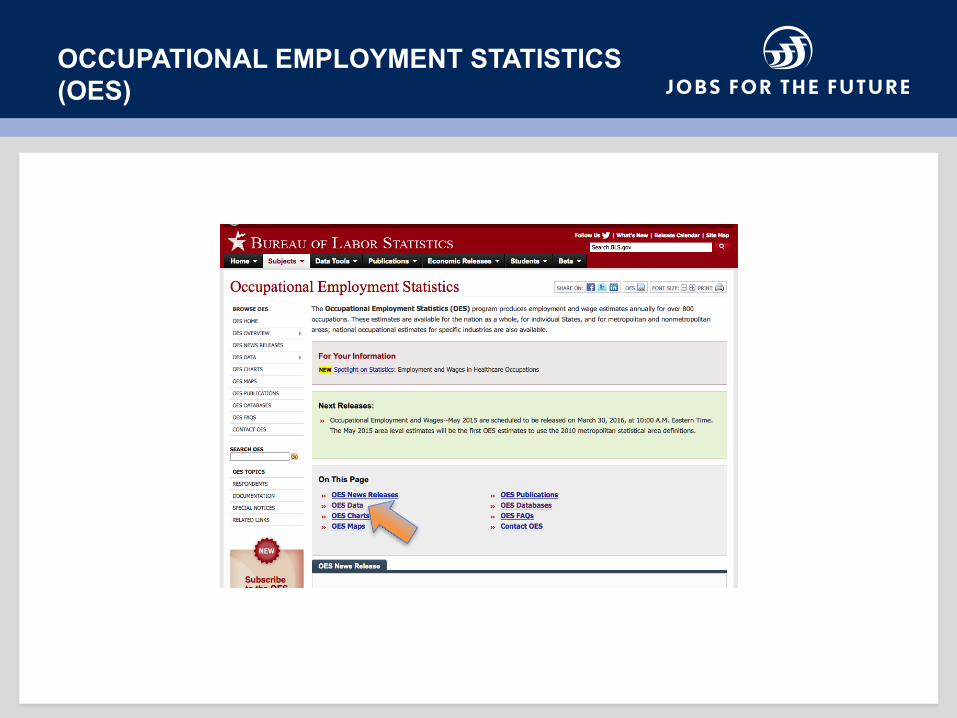
OCCUPATIONAL EMPLOYMENT STATISTICS (OES)
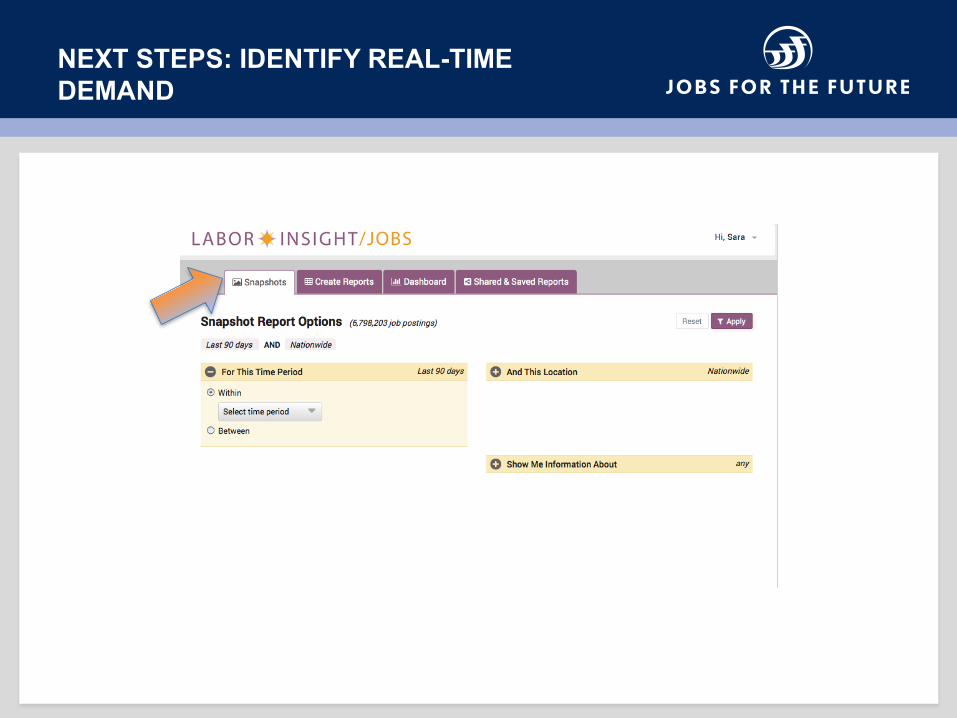
NEXT STEPS: IDENTIFY REAL-TIME DEMAND

TOP INDUSTRY SECTORS: ENVIRONMENTAL SCIENCE AND PROTECTION TECHNICIANS
Source: Burning Glass Labor/Insight data for Environmental Science and Protection Technicians, Including Health in the Boston MSA. Data from 3/1/2015-2/29/2016. 127 total postings.
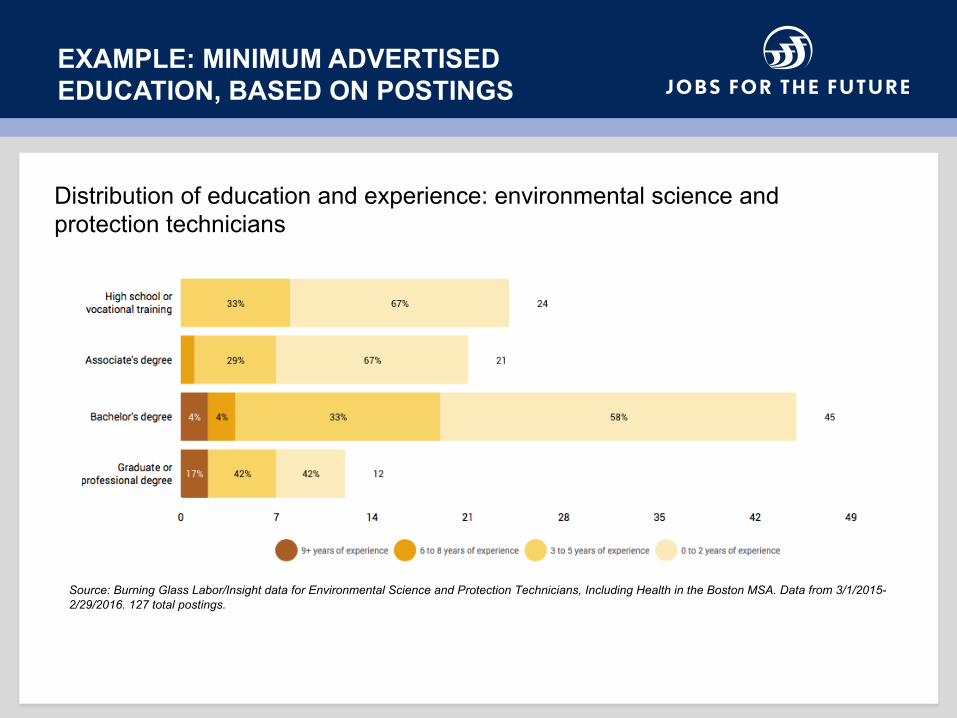
EXAMPLE: MINIMUM ADVERTISED EDUCATION, BASED ON POSTINGS
Source: Burning Glass Labor/Insight data for Environmental Science and Protection Technicians, Including Health in the Boston MSA. Data from 3/1/2015-2/29/2016. 127 total postings.
Distribution of education and experience: environmental science and protection technicians
> Identify the labor market demand in your area for target occupation(s)
> Identify the labor supply in your area for target occupation(s)
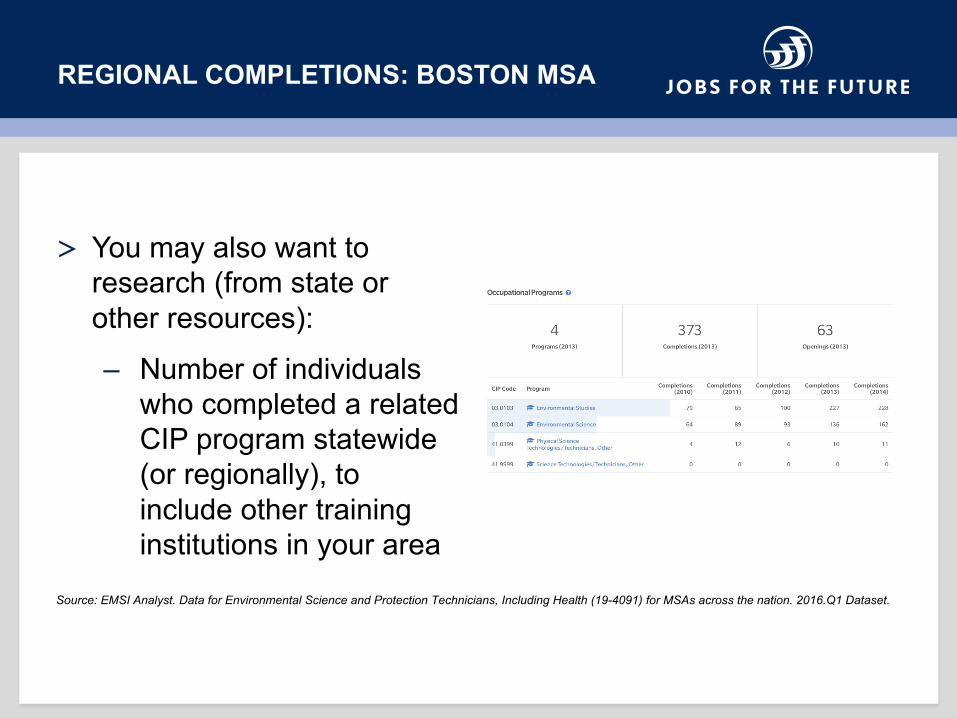
REGIONAL COMPLETIONS: BOSTON MSA
> You may also want to research (from state or other resources):
– Number of individuals who completed a related CIP program statewide (or regionally), to include other training institutions in your area
Source: EMSI Analyst. Data for Environmental Science and Protection Technicians, Including Health (19-4091) for MSAs across the nation. 2016.Q1 Dataset.

ANALYZE FINDINGS
> Calculate the following: – Ratio of number employed to number of job postingsThis ratio estimates the number of experienced workers who
may compete for a given job opportunity– Ratio of college completions to projected annual
openingsThis is an indication of the number of graduates competing for a typical opening– Subtract the number of completions from the
projected annual openings This provides an indication of whether supply is meeting demand

ANALYZE LOCAL LABOR MARKET SUPPLY

COMPONENTS OF ANALYSIS
Traditional LMI
Real Time LMI
Course Description
Employer Demands
Institutional Priorities
Staff Expertise
Local Drivers
Traditional LMI
Real-Time LMI
Program Graduate Outcomes
Employer Demands
Institutional Priorities
Staff Expertise
Local Drivers
Integrate local and institutional knowledge into the analysis!

LMI CATEGORY: LOCAL DRIVERS
Source: Boston Globe, January 13, 2016, retrieved via: https://www.bostonglobe.com/business/2016/01/13/general-electric-will-announce-tomorrow-that-has-selected-boston-for-global-headquarters-according-official-familiar-with-process/ZYZSu7GorfVTRXM2ZIaabJ/story.html
Part 3: Identifying In-Demand Skills and Credentials
PART 3: LEARNING OBJECTIVES
> Understand the rationale behind skills mapping> Identify the basic concepts related to sustainability skills
and how they can be examined> Use Labor/Insight to and other LMI resources to identify
in-demand skills and credentials
HOW CAN RT LMI BE USED TO UNDERSTAND SPECIFIC SKILLS?
Example: Sustainability Skills> Customize your search to your college’s needs, for
example take advantage of BG’s: – Green Skill Cluster
– Specialty Sector: Green Occupations (based on the O*Net list of ‘greening’ occupations)
– Keyword search: Search for a specific sustainability skill (e.g., conservation, weatherization)

TOP SUB-BA “GREEN SKILL” OCCUPATIONS IN THE BOSTON MSA
Source: Burning Glass Labor/Insight Jobs Region: Boston MSAPeriod: 3/1/2015-2/29/2016Filter: Sub-BA (inferred) and Green Skill ClusterPostings: 4,029
RT LMI can highlight the top local occupations for a particular skill
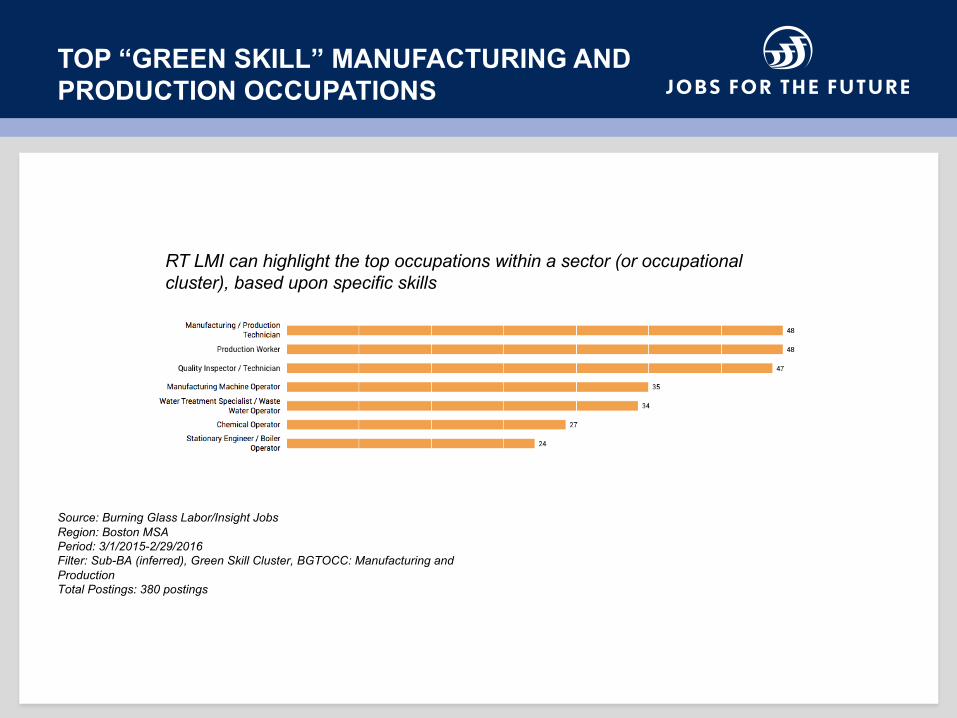
TOP “GREEN SKILL” MANUFACTURING AND PRODUCTION OCCUPATIONS
RT LMI can highlight the top occupations within a sector (or occupational cluster), based upon specific skills
Source: Burning Glass Labor/Insight Jobs Region: Boston MSAPeriod: 3/1/2015-2/29/2016Filter: Sub-BA (inferred), Green Skill Cluster, BGTOCC: Manufacturing and ProductionTotal Postings: 380 postings
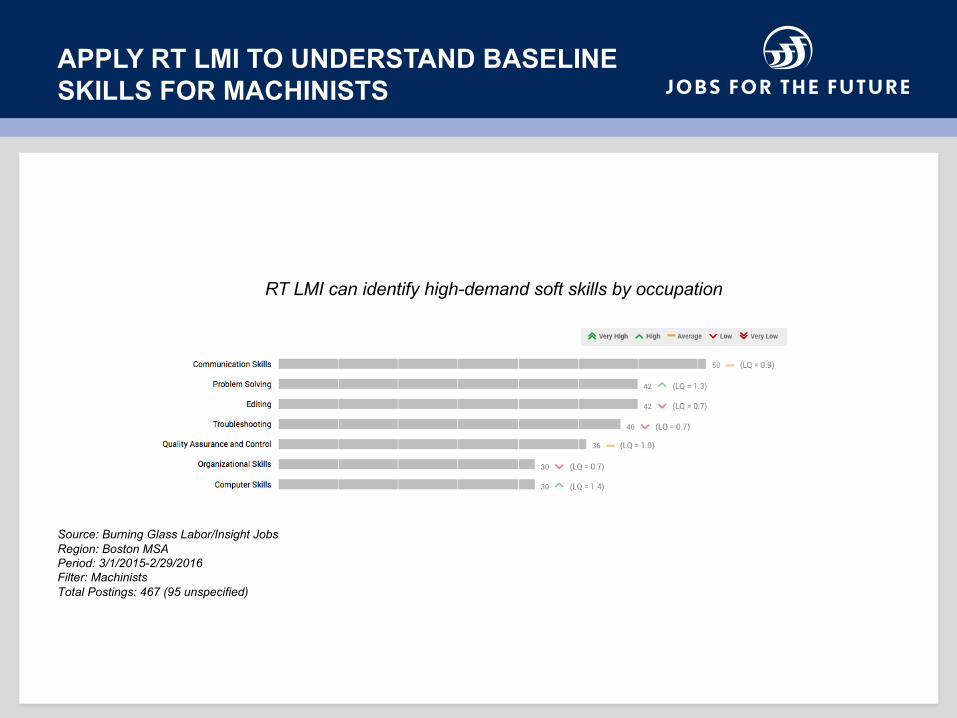
APPLY RT LMI TO UNDERSTAND BASELINE SKILLS FOR MACHINISTS
Source: Burning Glass Labor/Insight Jobs Region: Boston MSAPeriod: 3/1/2015-2/29/2016Filter: MachinistsTotal Postings: 467 (95 unspecified)
RT LMI can identify high-demand soft skills by occupation
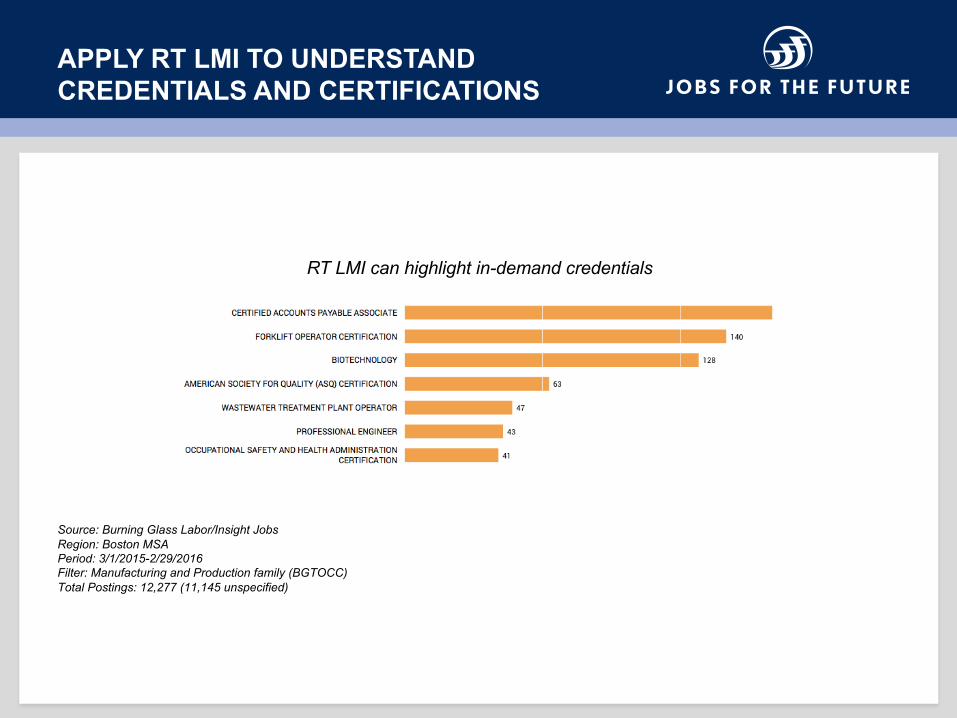
APPLY RT LMI TO UNDERSTAND CREDENTIALS AND CERTIFICATIONS
Source: Burning Glass Labor/Insight Jobs Region: Boston MSAPeriod: 3/1/2015-2/29/2016Filter: Manufacturing and Production family (BGTOCC) Total Postings: 12,277 (11,145 unspecified)
RT LMI can highlight in-demand credentials
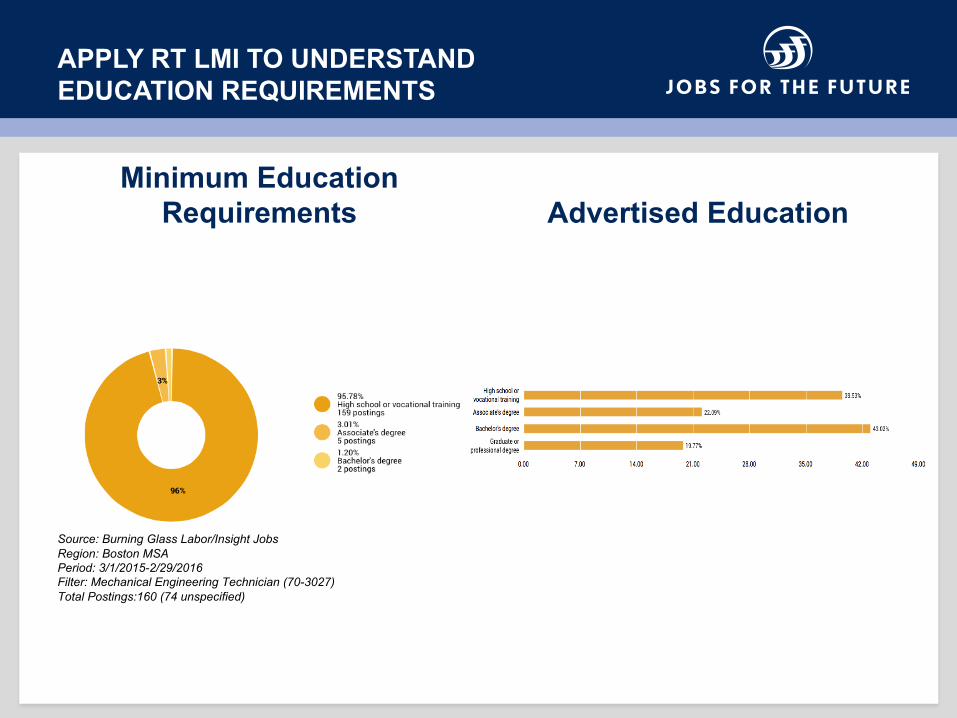
APPLY RT LMI TO UNDERSTAND EDUCATION REQUIREMENTS
Minimum Education Requirements Advertised Education
Source: Burning Glass Labor/Insight Jobs Region: Boston MSAPeriod: 3/1/2015-2/29/2016Filter: Mechanical Engineering Technician (70-3027) Total Postings:160 (74 unspecified)

COMPARE FINDINGS WITH OTHER LMISOURCES
Source: http://www.careeronestop.org/credentials/toolkit/find-certifications.aspx?keyword=51-4041.00&ajax=occ&direct=0
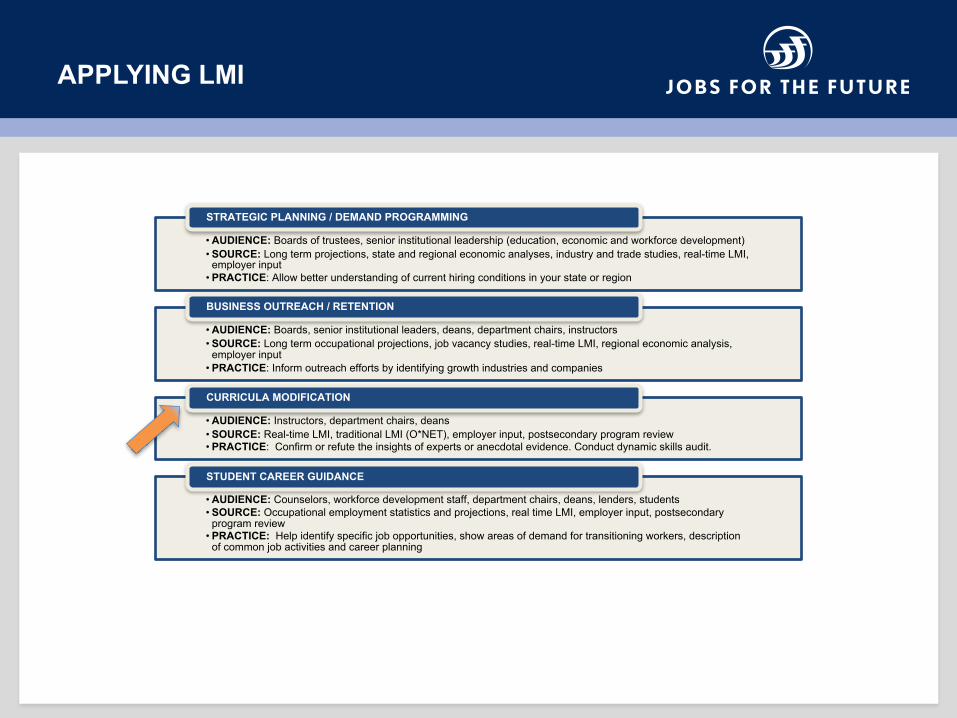
APPLYING LMI
• AUDIENCE: Boards of trustees, senior institutional leadership (education, economic and workforce development)• SOURCE: Long term projections, state and regional economic analyses, industry and trade studies, real-time LMI,
employer input• PRACTICE: Allow better understanding of current hiring conditions in your state or region
STRATEGIC PLANNING / DEMAND PROGRAMMING
• AUDIENCE: Boards, senior institutional leaders, deans, department chairs, instructors• SOURCE: Long term occupational projections, job vacancy studies, real-time LMI, regional economic analysis,
employer input• PRACTICE: Inform outreach efforts by identifying growth industries and companies
BUSINESS OUTREACH / RETENTION
• AUDIENCE: Instructors, department chairs, deans• SOURCE: Real-time LMI, traditional LMI (O*NET), employer input, postsecondary program review• PRACTICE: Confirm or refute the insights of experts or anecdotal evidence. Conduct dynamic skills audit.
CURRICULA MODIFICATION
• AUDIENCE: Counselors, workforce development staff, department chairs, deans, lenders, students• SOURCE: Occupational employment statistics and projections, real time LMI, employer input, postsecondary
program review• PRACTICE: Help identify specific job opportunities, show areas of demand for transitioning workers, description
of common job activities and career planning
STUDENT CAREER GUIDANCE
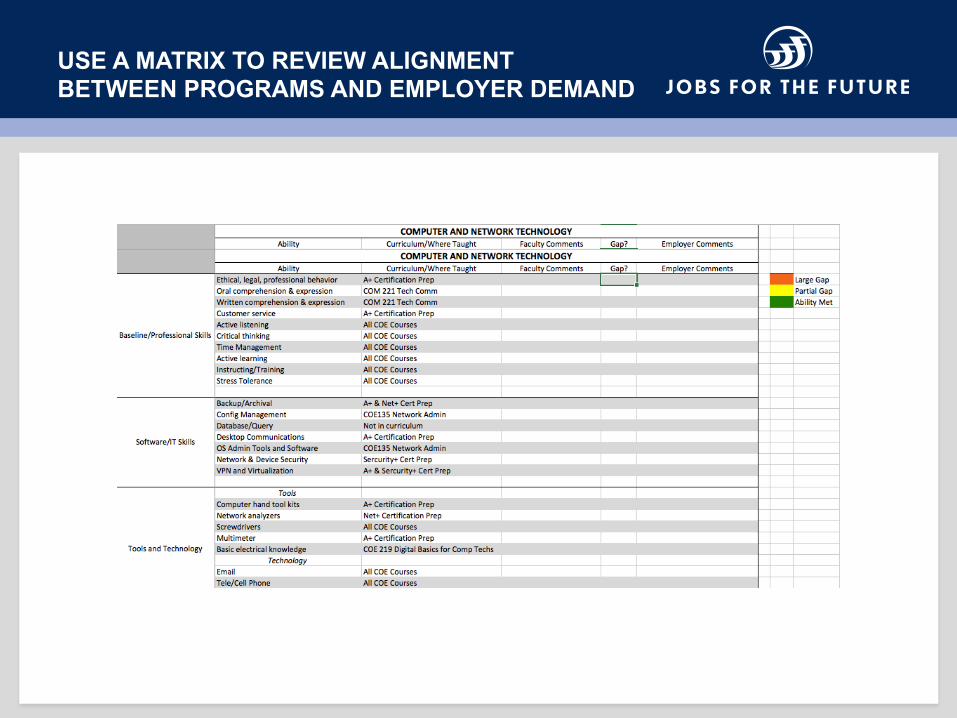
USE A MATRIX TO REVIEW ALIGNMENT BETWEEN PROGRAMS AND EMPLOYER DEMAND
Part 4: USING LMI TO ENHANCE EMPLOYER ENGAGEMENT
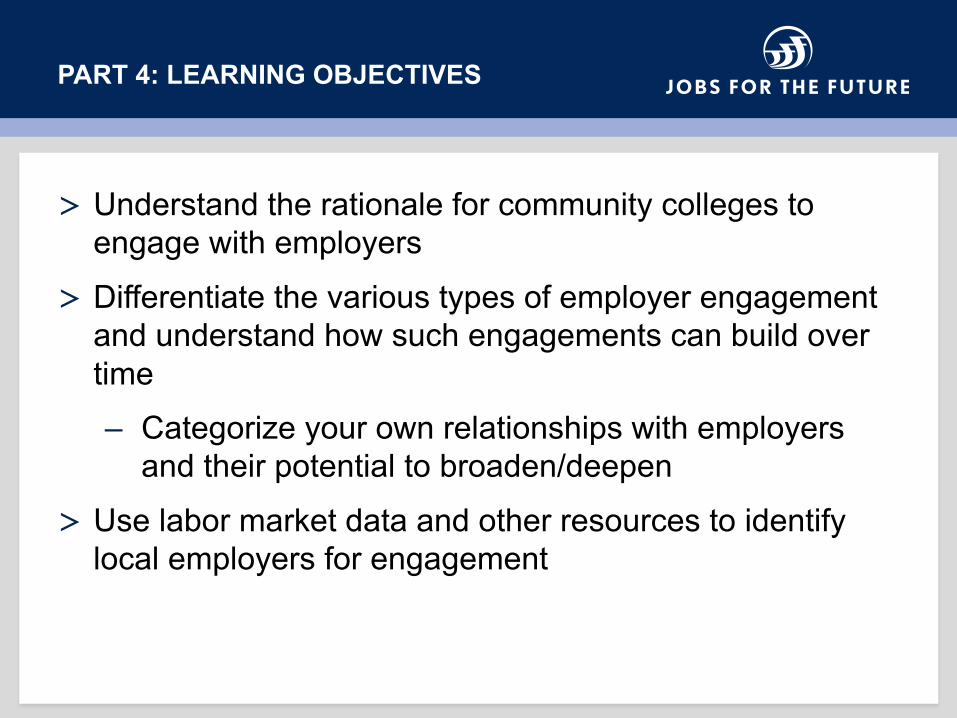
PART 4: LEARNING OBJECTIVES
> Understand the rationale for community colleges to engage with employers
> Differentiate the various types of employer engagement and understand how such engagements can build over time– Categorize your own relationships with employers
and their potential to broaden/deepen
> Use labor market data and other resources to identify local employers for engagement

WHAT IS EMPLOYER ENAGEMENT?
> Employer engagement is a mutually beneficial partnership between employers and education/workforce system.
> Some examples include:
– Recruiting on campus– Advising students– Providing curricular/ program feedback and expertise
– Offering work-based learning opportunities– Developing sectoral partnerships
Source:CTW
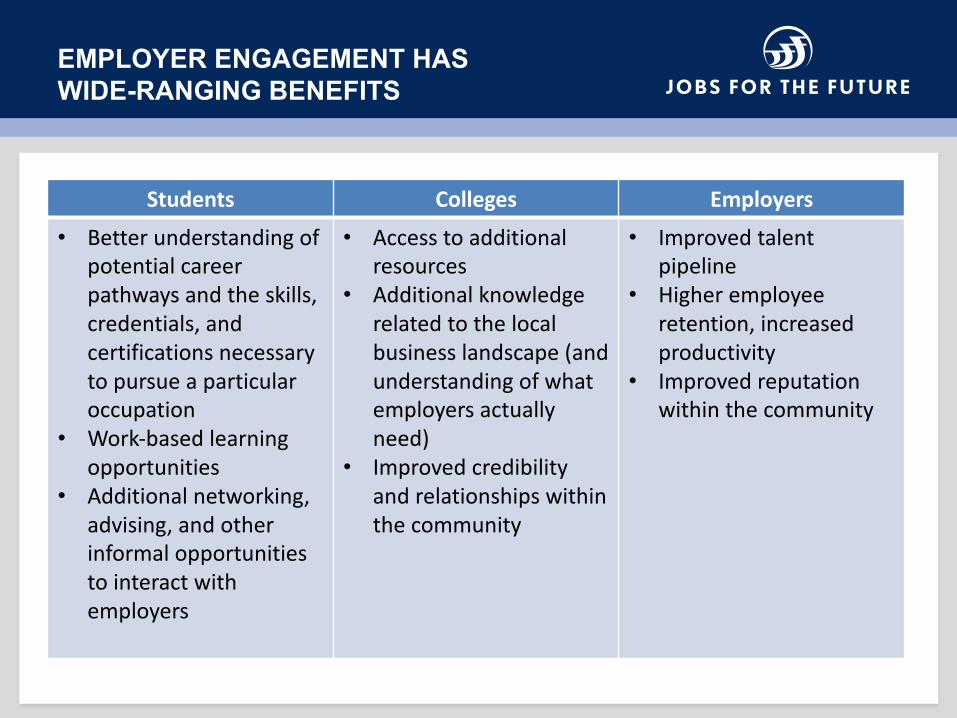
EMPLOYER ENGAGEMENT HAS WIDE-RANGING BENEFITS
Students Colleges Employers• Better understandingof
potentialcareerpathwaysandtheskills,credentials,andcertificationsnecessarytopursueaparticularoccupation
• Work-basedlearningopportunities
• Additionalnetworking,advising,andotherinformalopportunitiestointeractwithemployers
• Accesstoadditionalresources
• Additionalknowledgerelatedtothelocalbusinesslandscape(andunderstandingofwhatemployersactuallyneed)
• Improvedcredibilityandrelationshipswithinthecommunity
• Improvedtalentpipeline
• Higheremployeeretention,increasedproductivity
• Improvedreputationwithinthecommunity
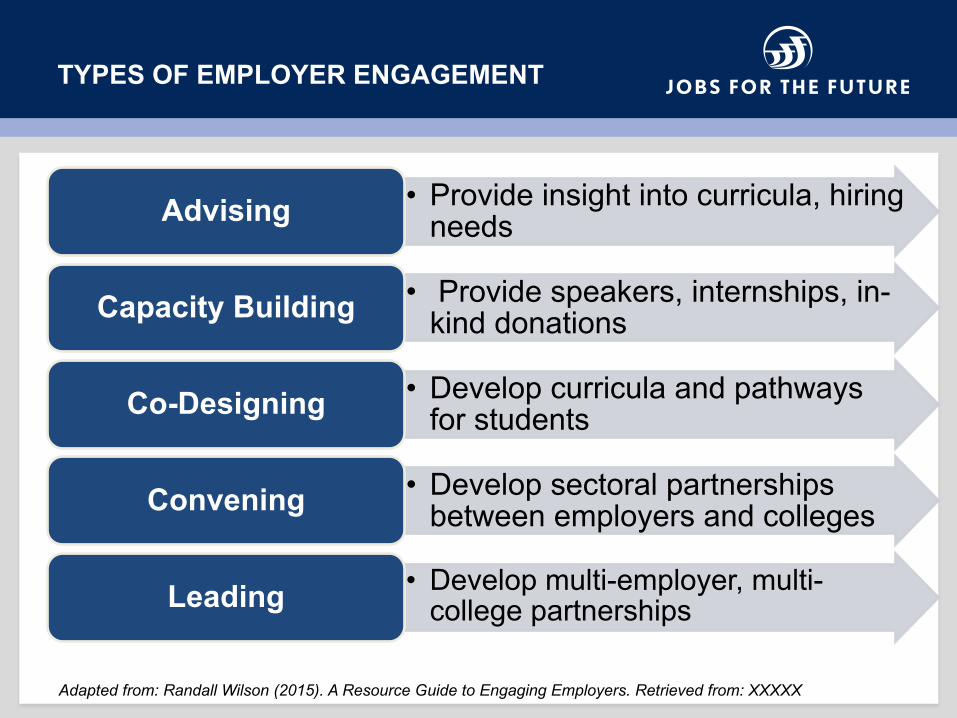
TYPES OF EMPLOYER ENGAGEMENT
• Provide insight into curricula, hiring needsAdvising
• Provide speakers, internships, in-kind donationsCapacity Building
• Develop curricula and pathways for studentsCo-Designing
• Develop sectoral partnerships between employers and collegesConvening
• Develop multi-employer, multi-college partnerships Leading
Adapted from: Randall Wilson (2015). A Resource Guide to Engaging Employers. Retrieved from: XXXXX
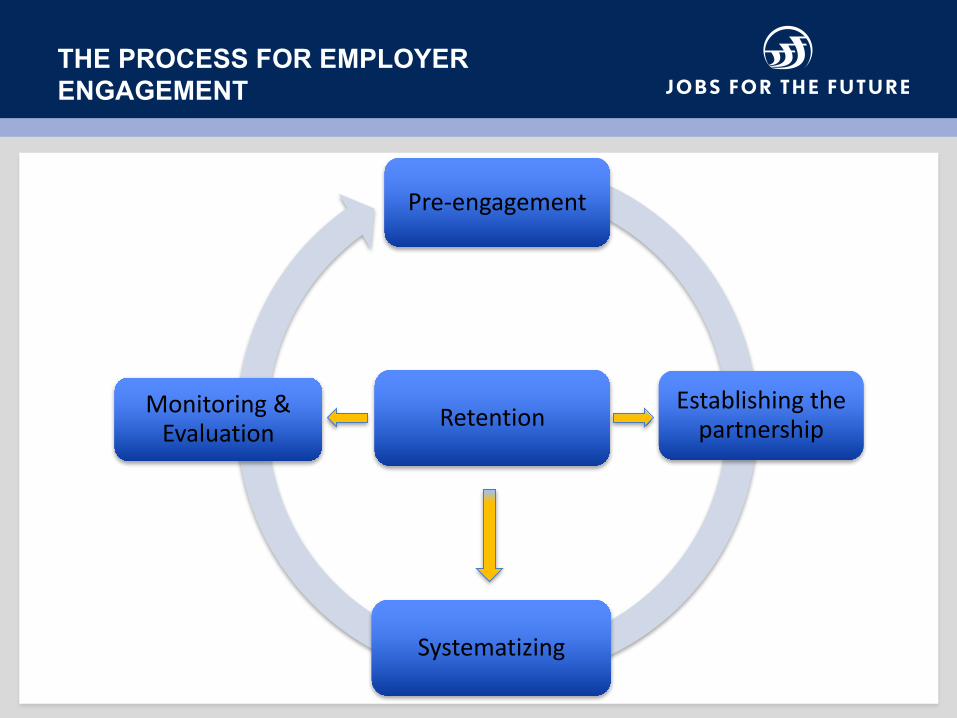
THE PROCESS FOR EMPLOYER ENGAGEMENT
Pre-engagement
Establishingthepartnership
Systematizing
Monitoring&Evaluation Retention
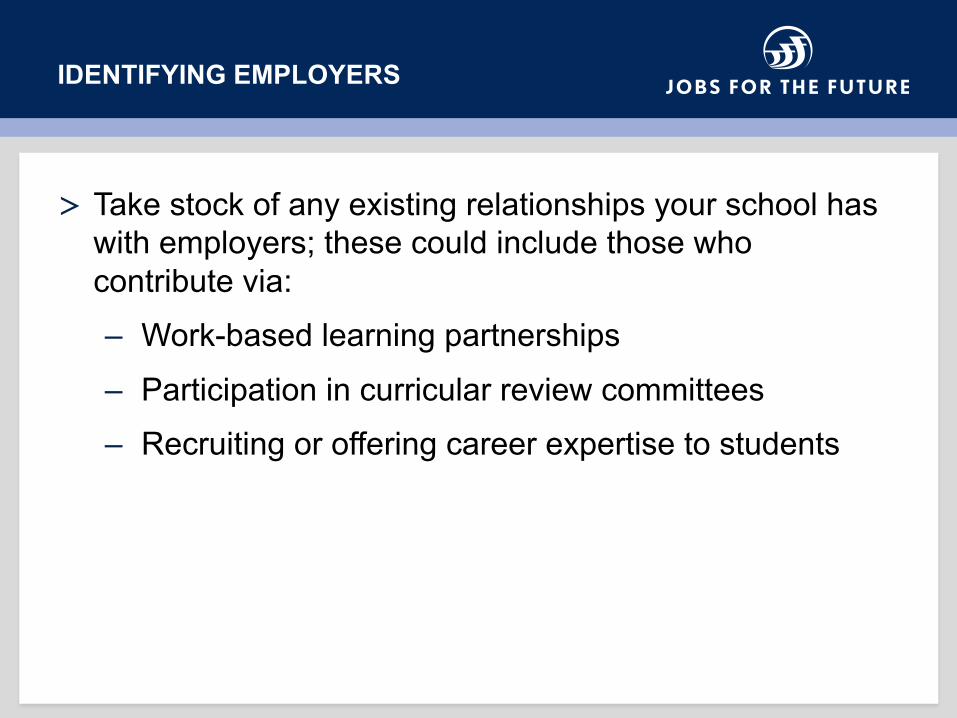
IDENTIFYING EMPLOYERS
> Take stock of any existing relationships your school has with employers; these could include those who contribute via: – Work-based learning partnerships
– Participation in curricular review committees – Recruiting or offering career expertise to students
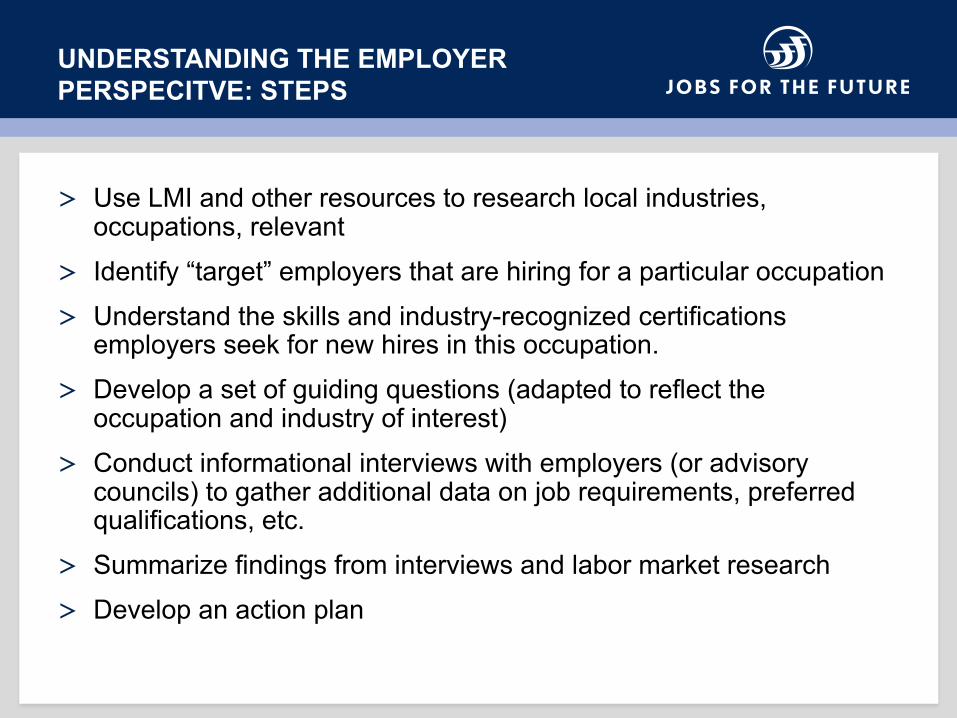
UNDERSTANDING THE EMPLOYER PERSPECITVE: STEPS
> Use LMI and other resources to research local industries, occupations, relevant
> Identify “target” employers that are hiring for a particular occupation> Understand the skills and industry-recognized certifications
employers seek for new hires in this occupation.> Develop a set of guiding questions (adapted to reflect the
occupation and industry of interest) > Conduct informational interviews with employers (or advisory
councils) to gather additional data on job requirements, preferred qualifications, etc.
> Summarize findings from interviews and labor market research > Develop an action plan

REAL-TIME LMI CAN ASSIST IN IDENTIFYING LOCAL EMPLOYERS
> Queries that can provide useful data for employer engagement efforts:
– Top employers – Top detailed industries
– In-demand skills and certifications – And more—take the time to explore!
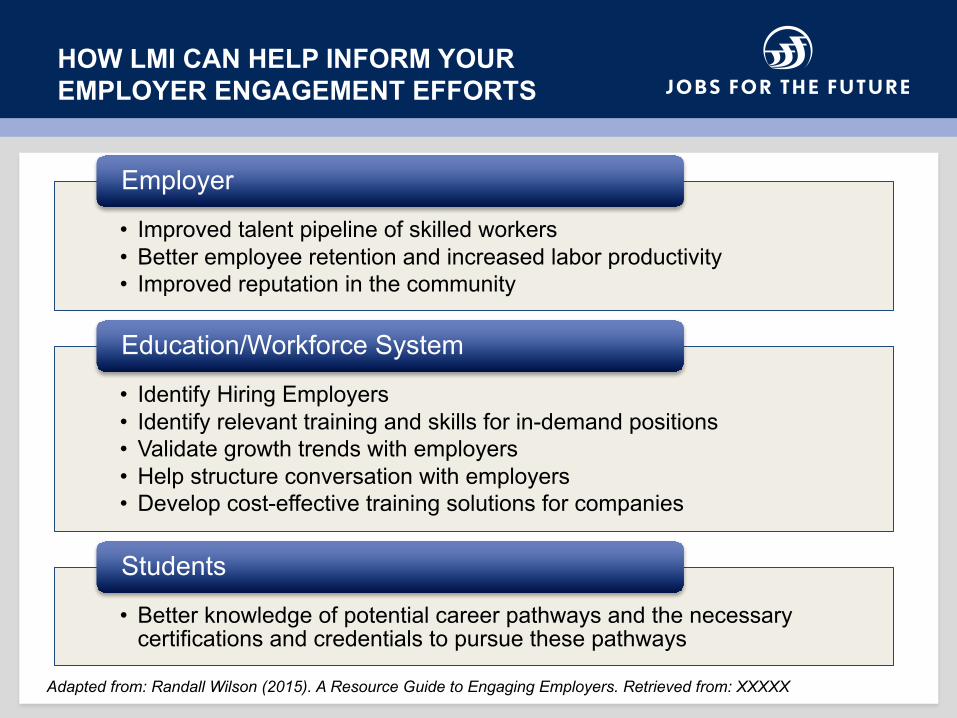
HOW LMI CAN HELP INFORM YOUR EMPLOYER ENGAGEMENT EFFORTS
• Improved talent pipeline of skilled workers• Better employee retention and increased labor productivity• Improved reputation in the community
Employer
• Identify Hiring Employers• Identify relevant training and skills for in-demand positions• Validate growth trends with employers• Help structure conversation with employers• Develop cost-effective training solutions for companies
Education/Workforce System
• Better knowledge of potential career pathways and the necessary certifications and credentials to pursue these pathways
Students
Adapted from: Randall Wilson (2015). A Resource Guide to Engaging Employers. Retrieved from: XXXXX
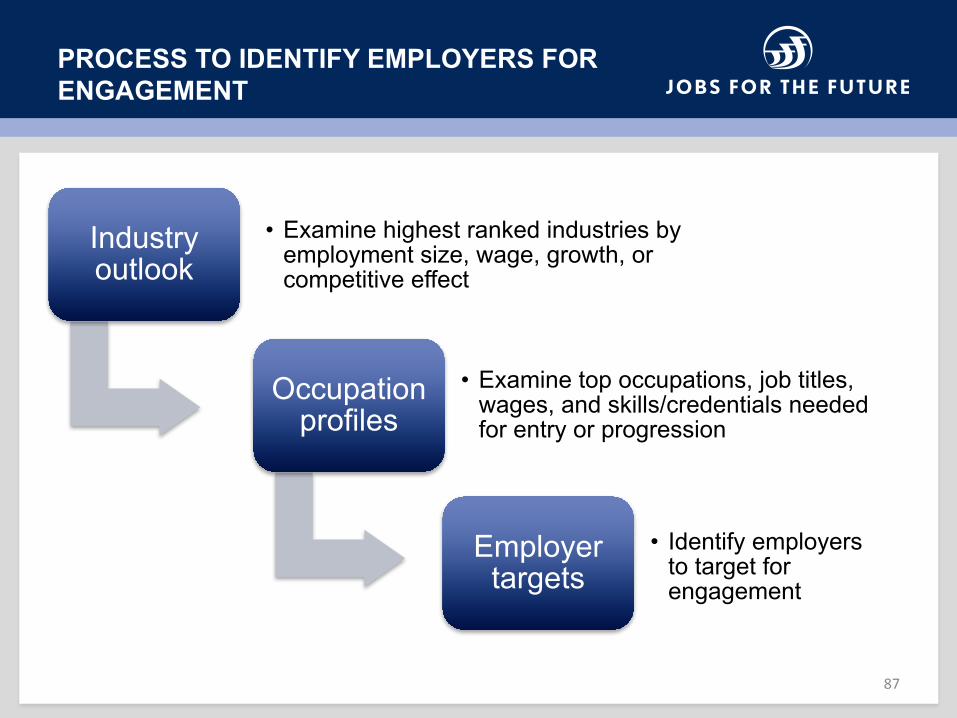
PROCESS TO IDENTIFY EMPLOYERS FOR ENGAGEMENT
Industry outlook
• Examine highest ranked industries by employment size, wage, growth, or competitive effect
Occupation profiles
• Examine top occupations, job titles, wages, and skills/credentials needed for entry or progression
Employer targets
• Identify employers to target for engagement
87
RESOURCES AND ADDITIONAL READING
> Aspen Institute: http://www.aspeninstitute.org/policy-work/college-excellence/college-excellence-blog/using-labor-market-data-improve-student-success
> Making use of labor market information: http://www.ccsf.edu/dam/Organizational_Assets/Department/Career_And_Technical_Education/Making%20Use%20of%20Labor%20Market%20Info.pdf
> Bureau of Labor Statistics: http://www.bls.gov/
> Department of Labor, Employment & Training Agency: http://www.doleta.gov/
> Labor Market Information WIN-WIN Network Community of Practice: https://winwin.workforce3one.org/page/home
> LMI Training Institute: http://www.lmiontheweb.org/?page=8
> State LMI Locator: careeronestop.org/red/StateLaborMarket Information.aspx
> State LMI Contact List: www.bls.gov/bls/ofolist.htm
> State Occupational Projections http://www.projectionscentral.com/

SARA LAMBACK [email protected]
TEL 617.728.4446 FAX 617.728.4857 [email protected] Broad Street, 8th Floor, Boston, MA 02110 (HQ)
122 C Street, NW, Suite 650, Washington, DC 20001505 14th Street, Suite 900, Oakland, CA 94612WWW.JFF.ORG