lab twelve dissolved oxygen and aquatic primary...
TRANSCRIPT

.r.. LAB TWELVE DISSOLVED OXYGEN .
AND AQUATIC PRIMARY PRODUCTIVITY
OVERVIEW 1. In Exercise 12A you will measure and analyze the dissolved oxygen (DO) concentration
in water samples at varying temperatures.
2. In Exercise 12B you will measure and analyze the primary productivity of natural waters or lab cultures using screens to simulate the attenuation (decrease) of light with increasing depth.
. OBJECTIVES Before doing this lab you should understand:
the biological importance of carbon and oxygen . how primary productivity relates to the . the physical and biological factors that affect the solubility of gases in aquatic ecosystems, and the relationship between dissolved oxygen and the processes of photosynthesis and respiration and how these processes affect primary productivity.
After doing this lab you should be able to: . measure primary productivity based on changes in dissolved oxygen in a controlled experiment, and investigate the effects of changing light intensity on primary pioductivity in a controlled experiment.
INTRODUCTION In the aquatic environment, osygen must be in solution in a free state (0,) before it is available for use by organisms. Its concentration and distribution 'ln the aquatic environment are directly dependent on'chemical and physical factors and are greatly affected by biological processes. In the atmosphere there is an abundance of oxygen, with about 200 milliliters of oxygen for every liter of a%. Conversely, in the aquatic environment there are only about 5 to 10 milliliters of dissolved oxygen in a liter of water. The concentration of the oxygen in aquatic environments is a very important component of water quality.
At 20°C oxygen diffuses 300,000 times faster in air than in water, making the distribution of oxygen in air relatively uniform. Spatial distribution of oxygen in water, on the other hand, can be highly variable, especially in the absence of mixing by currents, winds, or tides.
Other chemical and physical factors, such as salinity, pH, and especially temperature, can affect the DO concentration and distribution. Salinity, usually expressed in parts per thousand (ppt), is the content of dissolved salts in water. Generally, as temperature and salinity increase, the solubility of oxygen in water decreases (Figure 12.1).

Figure 12.1: Solublllty of Oxygen In Water
100% Saturation of DO at Different Temperatures and Salinities
8 5 4 3
0 10 20 30 40 Temperature ("C)
A
The partial pressure of oxygen in the air above the water affects the amQunt of DO in the water. Less oxygen is present at higher elevations since the air itself is less dense; therefore, water at higher elevations contains less oxygen. At 4,000 meters in elevation (abobt 13,000 feet), the amount of dissolved oxygen in water is less than two-thirds what it is at sea level. All of these physical factors work together to increase diversity in aquatic habitats with regard to oxygen availability.
Biological processes, such as photosynthesis and respiration, can also significantly affect DO concentration. Photosynthesis usually increases the DO concentration in water. Aerobic respiration requires oxygen and will usually decrease DO concentration. The measurement of the DO concentration of a body of water is often used to determine whether the biological activities requiring oxygen are occurring; consequently, it is an important indicator of pollution.
EXERCISE 12A: Dlssolved Oxygen and Temperature
There are several brands of test kits available to determine the dissolved oxygen content of a water sample. Follow your teacher's instructions for their use.
Depending on the testing procedure you use, the dissolved oxygen may be measured in parts per million (ppm), or milligrams per likr (mg/L), or milliliters per liter (nVL). You should be able to make conversions between each of these with the following information:
ppm 0, = mg O,/ L
From this you can also calculate the amount of carbon fixed in photosynthesis as follows:
mL O,/ L x 0.536 = mg carbon fixed / L
Procedure 1. Fill 3 of the water sampling bottles with water of the 3 different temperatures provided.
2. Determine the DO of each sample using the technique given to you. Record these values in Table 12.1.
3. On the nomogram of oxygen saturation on page 139, use a straightedge or ruler to estimate the percent saturation of DO in your samples and record this value in Table 12.1. Line up the edge of a ruler with the temperature of the water on the top scale and the DO on the bottom scale. then read the percent saturation from the middle scale.
4. Record your values on the class blackboard and then enter class means in Table 12.1.
Table 12.1: Temperature/DO Data
5. Graph both the lab group data and class means percent saturation as a function of temperature. For this graph you will need to determine the following:
kmpenture
a. The independent variable: Use this to label the horizontal (x) axis.
* , b. The dependent variable: I Use this to label the vertical (y) axis.
Lab Qroup DO
Graph 1 2 . 1 Title:
C l u r Mean DO
Lab Oroup K DD Satuntlon
(from nomogram)
C h Mean 96 DO Satuntlon
(trom nomogmrn)

Flgure 12.2: Nomogram of Oxygen Saturation
Water Temperature O C
I I I I I I I ! I l 1 ~l'llll~m
0 5 10 15 202530
Oxygen (mg per liter)
Productlvlty The primary productivity of an ecosystem is defined as the rate at which organic materials (carbon-containing compounds) are stored. Only those organisms possessing photosynthetic pigments can utilize sunlight to create new organic compounds from simple inorganic substances. Green plants obtain carbon for carbohydrate synthesis from the carbon dioxide in the water or the air according to the basic equation for photosynthesis:
The rate of carbon dioxide utilization, the rate of formation of organic compounds, or the rate of oxygen production can be used as a basis for measuring primary productivity. A measure of oxygen production over ti&e provides a means of calculating the amount of carbon that has been bound in organic compounds over a period of time. For each milliliter of oxygen produced, approximately 0.536 milligrams of carbon has been assimilated.
One method of measuring the rate of oxygen production is the light and dark bottle method. In this method, the DO concentrations of samples of ocean, lake, or river water, or samples of laboratory algal'cultures, are measured and compared before and after incubation in light and darkness. The difference between the measurements of DO in the initial and dark bottles is an indication of the amount of oxygen that is being consumed in respiration by the organisms in the bottle. In the bottles exposed to light, the biological processes of photosynthesis and respiration are occurring; therefore, the change over time in DO concentration from the initial concentrations is a measure of net productivity.
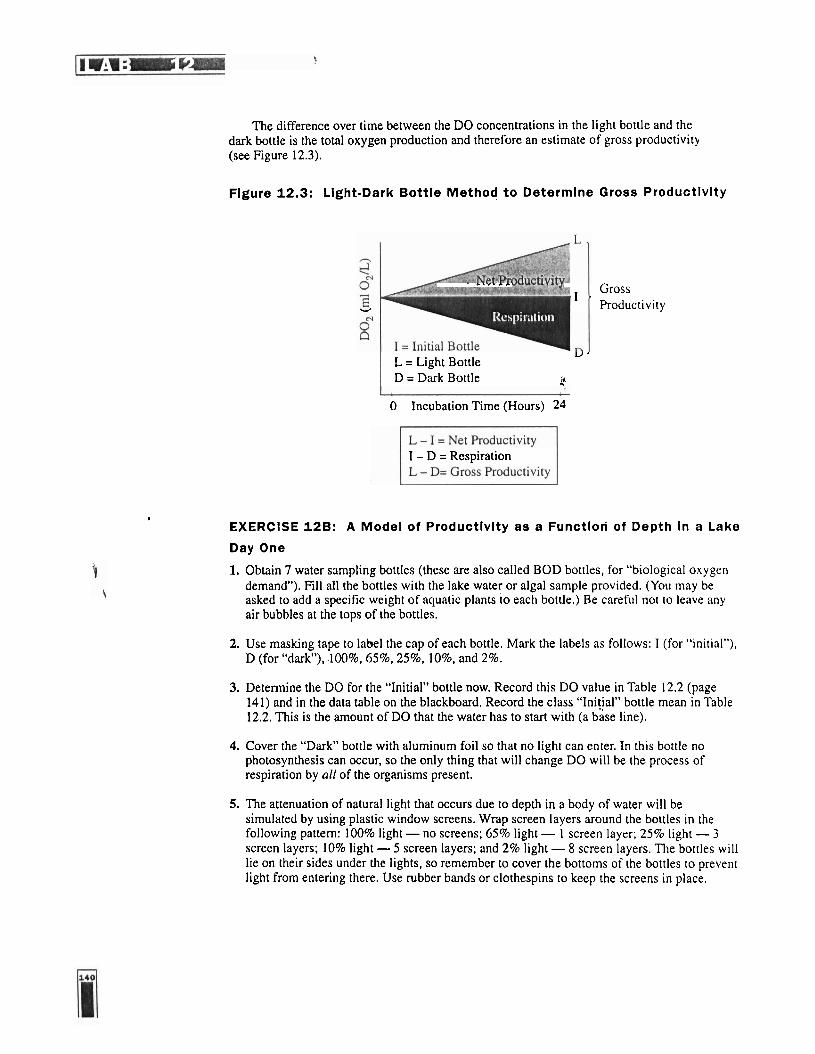
The difference over time between the DO concentrations in the light bottle and the dark bottle is the total oxygen production and therefore an estimate of gross productivity (see Figure 12.3).
Flgure 12.3: Llght-Dark Bottle Method t o Determine Gross Productlvlty
. ..".. . Gross
V
I ' Productivity
U' L = Light Bottle D = Dark Bottle i?
0 Incubation Time (Hours) 24
I - D = Respiration
I
EXERCISE 12B: A Model of Productlvlty as a Functlori of Depth In a Lake
Day One
1. Obtain 7 water sampling bottles (these are also called BOD bottles, for "biological oxygen demand"). Fill all the bottles with the lake water or algal sample provided. (You may be asked to add a specific weight of aquatic plants to each bottle.) Be careful not to leave any air bubbles at the tops of the bottles.
2. Use masking tape to label the cap of each bottle. Mark the labels as follows: I (for "initial"), D (for "dark"), .loo%, 65%, 25%, lo%, and 2%.
3. Determine the DO for the "Initial" bottle now. Record this DO value in Table 12.2 (page 141) and in the data table on the blackboard. Record the class "Initial" bottle mean in Table 12.2. This is the amount of DO that the water has to start with (a base line).
4. Cover the "Dark" bottle with aluminum foil so that no light can enter. In this bottle no photosynthesis can occur, so the only thing that will change DO will be the process of respiration by all of the organisms present.
5. The attenuation of natural light that occurs due to depth in a body of water will be simulated by using plastic window screens. Wrap screen layers around the bottles in the following pattern: 100% light - no screens; 65% light - 1 screen layer; 25% light - 3 screen layers; 10% light - 5 screen layers; and 2% light - 8 screen layers. The bottles will lie on their sides under the lights, so remember to cover the bottoms of the bottles to prevent light from entering there. Use rubber bands or clothespins to keep the screens in place.

6. Place the bottles on their sides under the bank of lights in the classroom. Be sure to turn the bottles so that their labels are down and do not prevent the light from getting to the contents. Leave overnight under constant illumination.
7. (Optional Exercise.) If time permits, make a wet mount slide of a sample of the lake water used for this experiment and draw some of the organisms you observe. Can you identify them?
Table 12.2: Respiration
Day Two
lnltlal DO
Dark Bottle DO
Resplratlon Rate (Inltlal-Dark)
8. Determine the DO in all the bottles that have been under the lights. Record the "Dark" bottle DO in Table 12.2. Calculate the respiration rate using the formula in the table. Record the values for the other bottles in Table 12.3. Complete the calculations in Table 12.4 to determine
I the gross and net productivity in each bottle. The calculations will be based on a time period I
i of 1 day. Enter your respiraiion rate and gross and net productivities in the data table on the class blackboard. Determine the class means. Enter these means in Table 12.2 and Table 12.4.
I Table 12.3: individual Data-Productlvlty of Screen-Wrapped Samples ,
lndlvldual Data Claan Mean
1
Net Productlvlty [Llght Bottle - lnltlal Bottle]
Qrosn Productlvlty [Ught Bottle - Dark Bottle]
d!
DO
.
# of Screens
0
1
3
6
8
% Llgllt
100%
65%
25%
10%
2%
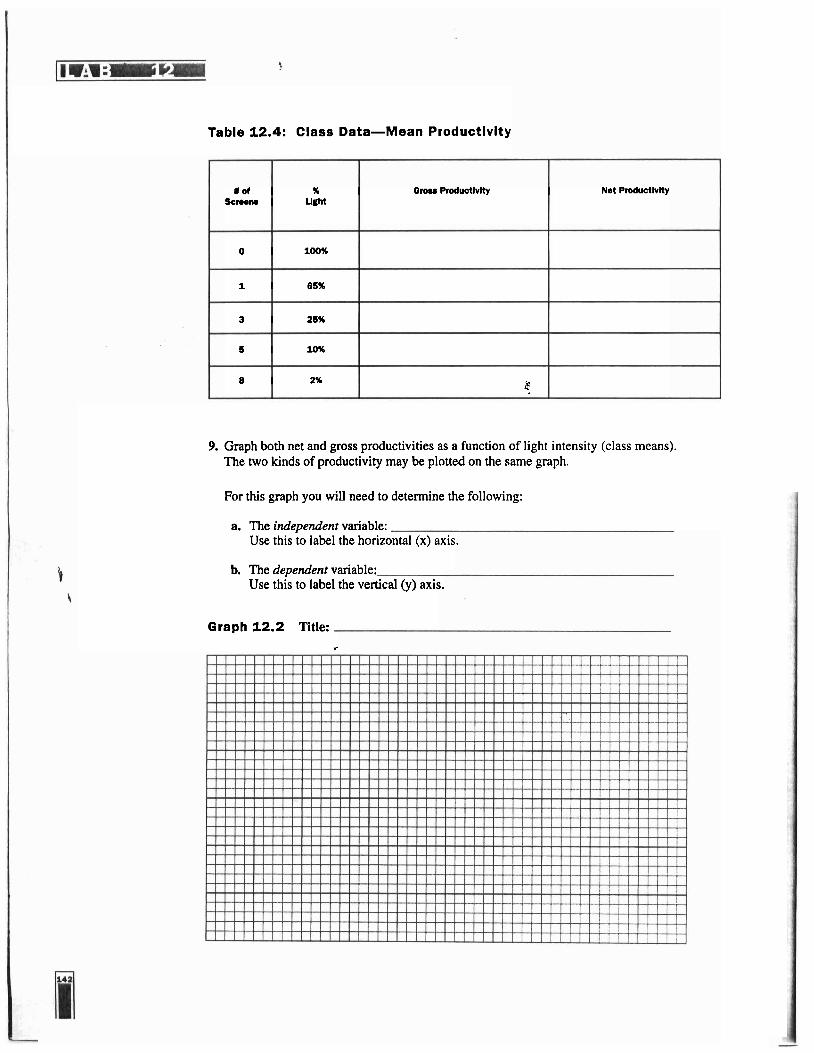
Table 12.4: Class Data-Mean Productlvlty
# of % Qrou Productlvlty Net Productlvlty Scnem urn
0 100%
1 85%
3 26%
s 10%
8 2% i".
9. Graph both net and gross productivities as a function of light intensity (class means). The two kinds of productivity may be plotted on the same graph.
For this graph you will need to determine the following:
a. The independent variable: Use this to label the horizontal (x) axis.
b. The dependent variable: Use this to label the vertical (y) axis.
Graph 12.2 Title: I

Questlons
1. What are three ways primary productivity can be measured?
2. What is the relationship between oxygen production and assimilation of carbon?
3. From your graph of the temperahre data, what is the effect of temperature on the amount of oxygen that water at different temperatures can hold?
4. Refer to your graph of productivity and light intensity. At what light intensity do you expect there to be:
No gross productivity? No net productivity?
5. A mammal uses only 1 to 2 percent of its energy in ventilation (breathing air in and out) while a fish must spend about 15 percent of its energy to move water over its gills. Explain this huge difference in their efforts to collect oxygen.
6. Would you expect the DO in water taken from a stream entering a lake to be higher or lower than the DO taken from the.lake itself? Explain.

7. Would you expect the DO concentration of water samples taken from a lake at 7:00 a.m. to be higher or lower than samples taken at 5:00 p.m.? Explain.
8. In the following drawings of identical containers with identical fish but with different volumes of water, which one, A or B, would have more oxygen available to the fish? Explain.
9. What is eutrophication? Research and explain why allowing nitrogen or phosphorous fertilizers to run into a body of water can negatively affect life in it.