dissolved organic matter (dom) in aquatic ecosystems · dissolved organic matter (dom). what is it...
TRANSCRIPT
A Study of European Catchmentsand Coastal Waters
A publication by the EU project DOMAINE (EVK3-CT-2000-00034)
Edited by Morten Søndergaard & David N. Thomas
Dissolved Organic Matter(DOM) in Aquatic Ecosystems:

(Blank page)

A Study of European Catchmentsand Coastal Waters
A publication by the EU project DOMAINE (EVK3-CT-2000-00034)
Edited by
Morten Søndergaard
& David N. Thomas
Dissolved Organic Matter(DOM) in Aquatic Ecosystems:

Data sheet
Title: Dissolved Organic Matter (DOM) in Aquatic Ecosystems:
A Study of European Catchments and Coastal Waters
Editors: M. Søndergaard & D.N.Thomas
Publisher: The Domaine project
Date of publication: June 2004
Editing complete: March 2004
Layout: Neri Graphic Work, Britta Munter
Drawings: Neri Graphic Work, Britta Munter & Tinna Christensen
Photos not described: from the Domaine project, CDanmark and high-lights
ISBN: 87-89143-25-6
Printed by: Schultz Graphic. Certified under ISO 14001 and ISO 9002
Paper quality: Galerie Art Silk
Internet-version: The book is also available at: http:/www.domaine.ku.dk

Dissolved organic matter (DOM). What is it and why study it?Preface and acknowledgements
By contract EVK3-CT-2000-00034 the European Commission initiated in January 2001 the 36 months research project “Dis-
solved organic matter (DOM) in coastal ecosystems: transport, dynamics and environmental impact” (www.domaine.ku.dk)*.
The overall aim of the project was to provide a better understanding of the terrestrial export of dissolved organic matter and its
fate and impacts on coastal ecosystem functioning, i.e. the storage and cycling of carbon, nitrogen and phosphorus. The argu-
ments for the project were that substantial amounts of nutrients are leaving terrestrial environments as dissolved organic matter
and transported to coastal areas where the bound nutrients are made available for the biota. Neglecting this source of nutrients
and the oxygen demand in DOM could lead to environmentally damaging management strategies.
We therefore suggested that along with an increased control of the export of inorganic nutrients at the European level,
there is a growing need to understand the production, fate and effects of DOM in coastal ecosystems. It is highly pertinent
to increase our understanding, both quantitatively and qualitatively, and ultimately find out how we can manage such effects.
The DOMAINE partners selected four very different European catchments/areas with respect to climate and land use for inten-
sive seasonal studies on terrestrial DOM export. Additionally, a series of experiments were undertaken to expand our knowledge
on DOM reactivity and the production of DOM within aquatic systems. In this booklet we summarise some of the major findings
and advocate, why we find it so important to study DOM.
Morten Søndergaard
Coordinator
Hillerød, March 2004
Partners
Freshwater Biological Laboratory, University of Copenhagen, Denmark
Finnish Environment Institute, Helsinki, Finland
Department of Marine Ecology, The National Environmental Research Institute, Denmark
School of Ocean Sciences, University of Wales, Bangor, United Kingdom
Centre National de la Recherche, Laboratoire Arago, Banyuls-sur-Mer, France
Institute of Marine Microbiology, University of Bergen, Norway
Department of the Coastal Environment, Vejle County, Denmark
Acknowledgements
The partners would like to acknowledge the help by our scientific officer Dr. Christos Fragakis in Brussels. Many people gave
us technical assistance during the practical execution of the project, although unfortunately they are too many to mention
here.
* DOMAINE is a constituent of the ELOISE Thematic Network and contributes to ELOISE concerning the human impact on
the coastal zone and the development of modelling methods.

List of Contributors
Niels Henrik Borch, Freshwater Biological Laboratory, University of Copenhagen, Denmark
David Bowers, School of Ocean Sciences, University of Wales, Bangor, United Kingdom
Gustave Cauwet, Centre National de la Recherche, Laboratoire Arago, Banyuls-sur-Mer, France
Pascal Conan, Centre National de la Recherche, Laboratoire Arago, Banyuls-sur-Mer, France
Gaelle Deliat, Centre National de la Recherche, Laboratoire Arago, Banyuls-sur-Mer, France
Dylan Evans, School of Ocean Sciences, University of Wales, Bangor, United Kingdom
Pirkko Kortelainen, Finnish Environment Institute, Helsinki, Finland
Theis Kragh, Freshwater Biological Laboratory, University of Copenhagen, Denmark
Anker Laubel, Department of the Coastal Environment, Vejle County, Denmark
Tuija Mattsson, Finnish Environment Institute, Helsinki, Finland
Stiig Markager, Department of Marine Ecology, The National Environmental Research Institute, Denmark
Mireille Pujo-Pay, Centre National de la Recherche, Laboratoire Arago, Banyuls-sur-Mer, France
Antti Räike, Finnish Environment Institute, Helsinki, Finland
Morten Søndergaard, Freshwater Biological Laboratory, University of Copenhagen, Denmark
Colin Stedmon, Department of Marine Ecology, The National Environmental Research Institute, Denmark
Frede Thingstad, Institute of Marine Microbiology, University of Bergen, Norway
David Thomas, School of Ocean Sciences, University of Wales, Bangor, United Kingdom
Torben Vang, Department of the Coastal Environment, Vejle County, Denmark
Peter Williams, School of Ocean Sciences, University of Wales-Bangor, United Kingdom
Anders Windelin, Department of the Coastal Environment, Vejle County, Denmark
Contents
Dissolved organic matter (DOM): Page 7What is it and why study it? P. J. LeB Williams, M. Søndergaard and D. Evans
Sources of dissolved organic Page 15matter from land P. Kortelainen, T. Mattsson, A. Laubel, D. Evans,
G. Cauwet and A. Räike
DOM sources and microbes Page 23in lakes and coastal waters M. Søndergaard, F. Thingstad, C. Stedmon,
T. Kragh and G. Cauwet
Effects of DOM in coastal waters Page 37S. Markager, C. Stedmon and P. Conan
Fate of DOM in coastal waters Page 43N. H. Borch, G. Deliat, M. Pujo-Pay and C. Stedmon
Analysis of DOM at the catchment scale: Page 51Two European case studies A. Laubel, D. Evans, T. Vang, D.G. Bowers,
C. Stedmon, N.H. Borch and M. Søndergaard
DOM and land use management Page 63A. Laubel, T. Vang, M. Søndergaard, P. Kortelainen
and A. Windelin
Suggested further reading Page 69
Glossary Page 71
Chapter 1Chapter 2Chapter 3Chapter 4Chapter 5Chapter 6Chapter 7

(Blank page)

Dissolved organic matter (DOM). What is it and why study it?Dissolved organic matter (DOM): What is it and why study it?
The geochemicaland biogeochemicalcycles
The flux of minerals from eroded rocks via the rivers through the
oceans to the marine sediments – the geochemical cycle – determines the composition of coastal and oceanic waters. The concentration of a par-ticular element is controlled by a number of physical and chemical factors: The principal ones being res-idence time of the water and the so-lubility and volatility of the various forms of the compound the element may be part of. Generally, the shorter the residence time and the lower the solubility the lower the resultant con-
centration in the sea. Chlorine and sodium, which play minor roles in bi-ological processes, have an exceed-ingly long residence time in the oceans, which is why the sea is salty. The fundamental physiological processes of photosynthesis (produc-tion) and respiration (decomposi-tion) have a further effect upon the cycling of elements. Photosynthesis (Fig 1.1) involves the utilisation of simple inorganic compounds (car-bon dioxide, nitrogen, phosphate, and other salts) and their conver-sion to organic material (Box 1.1), oxygen being essentially a by-pro-duct of the reaction. Respiration is basically the reverse overall proc-ess. Contrary to chlorine and so-
Chapter1Peter J. LeB WilliamsMorten SøndergaardDylan Evans
DISSOLVED ORGANIC MATTER (DOM) IN AQUATIC ECOSYSTEMS: A STUDY OF EUROPEAN CATCHMENTS AND COASTAL WATERS 7

Figure 1.1.
The Production/Decomposition Cycle.
The energy in light, inorganic nutrients,
CO2, water and salts are converted to
a complex mixture of organic com-
pounds and oxygen by photosynthetic
organisms. Respiration and decompo-
sition release CO2 at the expense of
oxygen and recycle nutrients to the
inorganic state. Prepared by Theis Kragh.
dium, nitrate and phosphate are substantially involved in biological cycles and have much reduced resi-dence times. For a great number of elements it is the biogeochemical cy-cle, which is the final determinant of its concentration. Thus, the biota cre-ates a cycle within a cycle.
Eutrophication – the potential for troubleThe growth of photosynthetic organ-isms in the sea – mostly algae (both phytoplankton and seaweeds), sea-grasses and some bacteria species – requires a number of factors (Fig. 1.1). Water and carbon dioxide are in abundant supply resulting in the main chemical limitation to the growth of marine plants being the various salts of phosphorus (phos-phate) and nitrogen (mainly nitrate and ammonium): collectively re-
ferred to as nutrients. The scale and yield of marine fisheries in a very broad way are controlled by the ex-tent of algal growth. Thus, up to a point, the more extensive the growth of algae the greater quantity of fish an area can yield. However, if the growth of algae is excessive then del-eterious effects can result. This com-monly occurs when the concentra-tion of the controlling compound (nitrogen and/or phosphorus) de-parts (most often increases) from the “natural” levels. This change in con-centration is referred to as eutrophi-cation. Although eutrophication is gen-erally a detrimental process, it is im-portant to stress that it is a reversible process. There are also instances when low levels of eutrophication can even be perceived as being a positive state for increasing the pro-ductivity of a specific water body.
Strictly speaking eutrophication is a process by which the productivity of an aquatic system is increased, and can therefore be caused by factors other than nutrient input. These in-clude reducing the suspended mate-rial in a water body and therefore in-creasing light for photosynthesis, or changing the residence time of water within a particular system. Coastal regions are immediate re-cipients of high dosages of nutrients both directly, via marine outfalls and discharges from estuaries. This, cou-pled with their relatively long resi-dence time, makes coastal ecosys-tems especially vulnerable to eutro-phication. This has resulted in the need for active management of these environments, which requires an un-derstanding of the sources of the criti-cal nutrients, intermediate treatments as well as the biological and physical dynamics of the ecosystem.
Phothos
ynth
esi
s(P
rodu
ct
ion) Respiration
(Decom
position)
Organicmaterial
andoxygen
Water,carbon dioxide
nitrate,phosphateand salts
LIGHT
HEAT
8 DISSOLVED ORGANIC MATTER (DOM) IN AQUATIC ECOSYSTEMS: A STUDY OF EUROPEAN CATCHMENTS AND COASTAL WATERS

Dissolved organic matter (DOM). What is it and why study it?
Sources Nitrogen Phosphorus
Natural Primary Atmosphere Rocks
Sources Secondary Soils, peat bogs, Soils, peat bogs, lakes & rivers lakes & rivers
AnthropogenicSources
Agriculture Primary Inorganic fertilisers Inorganic fertilisers (NO3, NH4, urea) (X-PO4)
Secondary Animal wastes, Animal wastes, silage, run off silage, run off & ground water & ground water
Domestic Sewerage Sewerage Industry Various Industrial Processing of wastes phosphate rock
DISSOLVED ORGANIC MATTER (DOM) IN AQUATIC ECOSYSTEMS: A STUDY OF EUROPEAN CATCHMENTS AND COASTAL WATERS 9
Chapter 1
Dissolved organic matter (DOM):What is it and why study it?
Table 1.1.
Summary of the major sources of
nitrogen and phosphorus to coastal
waters. They may simply be separated
into natural and anthropogenic
sources.
Sources of nitrogenand phosphorusA broad quantification of the nutri-ent sources into coastal ecosystems is a requirement of the European Union environment monitoring po-licies, and since the late 1980s par-ticipating nations have reported an-nually on the release of specified chemical discharges. In the case of nitrogen and phosphorus, these ele-ments may be present in a variety of organic and inorganic chemical forms. It is often neither practical nor desirable to quantify every ni-trogen or phosphorus containing
Figure 1.2.
Analytical categories for carbon,
nitrogen and phosphorus.
Prepared by Theis Kragh.
Dissolved
Ino
rgan
icO
rgan
ic
Particulate
Livingand
deadparticulate
organic material(POC,PON,POP)
Dissolvedorganic carbon
(DOC),nitrogen
(DON)and
phosphorus(DOP)
Phosphate,nitrate,
ammoniaand
carbon dioxide
Rarely analysed- no nitrogen forms

Box 1.2Definition and physical separation of dissolved and particulate materialIt is conventional to separate the organic components in wa-
ter into dissolved and particulate. The separation has some
biological validity. For the most part animals, from fish down
to protozoa, feed on particulate material, whereas in the
case of the bacteria, which have neither mouths nor guts,
their main immediate food source is organic material in solu-
tion. Thus the separation gives some insight into the poten-
compound present, and a common practice is to separate them within four categories (Fig. 1.2), based on their chemical form (inorganic or organic) and physical state (particu-late or dissolved), Box 1.1 and Box 1.2.
Control and manage-ment of dischargesAs society and environmental con-trol authorities became aware and concerned by the problem of eu-trophication additional treatment of waste-water was incorporated to re-move the inorganic products. The
different chemistries of nitrate and phosphate result in major differ-ences in the ease with which they are removed. Whereas phosphate may be removed chemically by precipita-tion no suitable insoluble salts for ni-trate exist, thus the removal is typi-cally biological via denitrification where nitrate in an anoxic environ-ment is transformed to gaseous ni-trogen (N2); a difficult process to control and expensive. The conse-quence is that whereas the tertiary removal of phosphate is not uncom-mon, that for nitrate is rather rare and can be difficult to control. The
preferred procedure is to control the source i.e. the use of nitrate fertilis-ers and manure and to decrease the production of airborne nitrogen. Likewise, the non-point sources of phosphorus can only be controlled by land use management.
DOM the overlooked source of nutrientsand oxygen demandIn the biogeochemical cycle inorganic nutrients are bound in organic com-pounds by photosynthesis and rem-ineralised during decomposition, which is mostly microbial (Chapters
tial food supply for these broad trophic categories. The
separation for analytical purposes is done by filtering the
sample through fine glass mat filters (the effective pore size
being between 0.5 and 1 micrometer). This gives an opera-
tional separation into particulate and dissolved, although in
reality there is no sharp boundary between the particulate
and dissolved states.
Box 1.1Definition of organicAlthough definitions are rather mundane they are a pre-
requisite for good science. Despite the term organic being
in common usage, even chemistry textbooks rarely attempt
a rigorous definition. Historically it is defined as compounds
produced by living organisms; however, a glance at Fig 1.1
shows that this definition would include water and oxygen
which are both biological products. Commonly organic com-
pounds are held to be those containing carbon, hydrogen
and oxygen, but that would include sodium bicarbonate
and exclude methane and many hydrocarbons. The unique
thing about organic material is that it contains a covalent
carbon-hydrogen bond – and it is this bond structure that
best defines what is, and what is not, organic.
10 DISSOLVED ORGANIC MATTER (DOM) IN AQUATIC ECOSYSTEMS: A STUDY OF EUROPEAN CATCHMENTS AND COASTAL WATERS

3 and 5). However, many of the or-ganics produced are not easily de-composed and can remain in an or-ganic form for long periods. Leaching of rainwater through soils carries these compounds as dissolved or-ganic matter (DOM) to watercourses and into coastal waters (Chapters 2, 4 and 6). Through the history of eu-trophication studies the effects of in-organic nutrients have been the pri-mary focus. However, both manage-ment and scientific communities have partly overlooked the large amounts of nitrogen and phosphorus embedded in terrestrial DOM (al-
lochthonous) transported to lakes and coastal waters and in the DOM produced within aquatic systems (autochthonous). Furthermore, as DOM also controls to a large extent, the light climate of aquatic systems, there are good reasons not to over-look the ecological effects of DOM (Chapter 4). It is pertinent to learn more about DOM, both with respect to quantities in transport from land to sea, how and at what time scales it releases ni-trogen and phosphorus, how much oxygen is consumed in the degrada-tion process, and how land use af-
fects the export (Chapter 6). Finally, the export and effects of DOM de-serves consideration from manage-ment perspectives (Chapter 7). In the DOMAINE project we have tried to keep focus on how climate and land use can control the riverine flow of DOM to coastal waters and the eco-logical effects of DOM. In this booklet we summarise some of our primary findings and where possible view these at a European dimension and in a management context.
Photo 1.1
The Conwy Estuary, North Wales
(photo by D. Thomas).
Chapter 1
Dissolved organic matter (DOM).What is it and why study it?
DISSOLVED ORGANIC MATTER (DOM) IN AQUATIC ECOSYSTEMS: A STUDY OF EUROPEAN CATCHMENTS AND COASTAL WATERS 11
Chapter 1
Dissolved organic matter (DOM):What is it and why study it?

Analysis of organic matter in natural systemsThere is no widely accepted princi-pal to analyse a complex mixture of organic material in its entirety in aquatic samples. Contemporary ap-proaches involve the measurement of the major (or ecologically impor-tant) constituent elements (carbon, nitrogen, phosphorus) or some phy-sical property associated with the or-ganic state. Chemical methods involve the oxi-dation of organic material (Box 1.3) and the measurement of one or more of the inorganic combustion products: CO2 in the case of carbon, NO2, N2 or NH3 in the case of nitro-gen and H3PO4 in the case of phos-
phorus. The classical oxidation pro-cedure at high temperatures can be used largely without modification for the particulate fraction using commercial elemental (CHN) ana-lyzers. The chemical analysis of to-tal organic material in natural wa-ters in solution (DOM) is proble-matic for a number of reasons. First, unlike the particulate fraction, the elements in DOM occur alongside their inorganic counterparts, thus unless the inorganic forms can be removed prior to oxidation, the in-organic nutrient from oxidation of the organically-bound part of the element has to be determined by difference. The various strategies are outlined in Box 1.4. The second
problem is that it is not feasible to remove the organic material from solution or to evaporate the water sample prior to analysis, since in doing so the samples can become seriously contaminated. Thus in practice the analysis for DOM is carried out in solution. The physical analysis entails the measurement of one of two optical properties of the water sample – ei-ther its absorbance (typically at 355 and/or 440nm) or its fluorescence. Organic compounds absorb light at various wavelengths and to vary-ing degrees. The pattern of absorp-tion (and fluorescence) is not uni-versal for organic compounds; lignins and phenolic compounds
Box 1.3Oxidation proceduresThe chemical analysis of water for dissolved organic matter
(DOM) falls into two steps – oxidation followed by determi-
nation of the quantity of the oxidation product. Broadly the
oxidation procedures fall into two categories The first entails
the oxidation of the organic material in the sample in the
liquid phase (wet oxidation), i.e. in water itself; the second
involves the oxidation of the sample at high temperatures in
the gas phase in a stream of oxygen, characteristically in the
presence of a catalyst (high temperature catalytic oxidation –
HTCO). In the former case the oxidation may be purely chem-
ical using a strong oxidising agent (typically persulphuric
acid) or by photo-oxidation (using an intense ultraviolet light
source), or a combination of photo and chemical oxidation.
In the case of the HTCO method, the sample, after the
removal of CO2 is injected into a quartz combustion tube
(at 700°C), the sample being evaporated in the tube. Both
approaches have their advantages and limitations. The
HTCO approach may be assumed to effect complete oxida-
tion, and the main problem with the method has been as-
sociated with assessing and minimising the analytical
blanks. It is now successfully used for dissolved organic car-
bon (DOC) analysis, where the end product, CO2, is typically
measured by its infrared absorption. Its application to dis-
solved organic nitrogen (DON) has been less successful, but
is improving.
The wet oxidations are simpler, however, they suffer
from the problem that they do not always completely oxi-
dise all organic material. This results in a small, but signifi-
cant underestimate of the organic material. Wet
oxidations are more general in their application having
been used for DOC, DON and dissolved organic phospho-
rus (DOP).
12 DISSOLVED ORGANIC MATTER (DOM) IN AQUATIC ECOSYSTEMS: A STUDY OF EUROPEAN CATCHMENTS AND COASTAL WATERS

Box 1.4Analytical strategies for DOC, DON and DOP
DON and DOP analysis: as there are no practical pro-
cedures to remove the inorganic forms prior to analysis,
the organic fraction is determined as the difference be-
tween the sums of the inorganic forms, before and subse-
quent to analysis. The determination by difference has to
make the assumption that there is no loss of the inorganic
nutrient during analysis – this may not always be correct
in the case of nitrogen (see Box 1.3).
The inorganic elements occur alongside their organically
bound counterparts; they are of course in many cases iden-
tical to the combustion products. There are two solutions
to this problem and different strategies are used for DOC
and for DON and DOP.
DOC analysis: the inorganic forms of carbon, the car-
bonates, may be removed by acidifying the sample, con-
verting the carbonates to CO2 and blowing off the CO2.
There is the potential to lose volatile organics at this stage
(e.g. methane) but this is regarded to be a minor problem
in most aquatic systems.
Figure 1.3.
The River Conwy, North Wales, UK.
The relationship between dissolved
organic carbon (DOC) and coloured
DOM (CDOM). The equation describes
the linear relationship between the
two measured parameters.
absorb strongly, whereas other bio-organic compounds e.g. sugars and most amino acids absorb weakly at the above wavelengths. Thus, light absorption due to organic material is compound specific and because of this it is prone to be site specific. Organic material of terrestrial ori-gin tends to be more coloured and
strongly absorbing than that of auto-chthonous origin. The high absorp-tion of coloured compounds can be used as a proxy for the quantifica-tion of non-coloured compounds. None relationship is more striking than the relationship between ab-sorption and DOC. Once relationships are developed
they can be used to predict other parameters and whole river sys-tems can be sampled quickly to identify areas deserving more de-tailed investigation. However, there are significant differences among different sites associated with the nature of their catchment area, and for example drainage waters from
0
200
400
600
800
1000
1200
1400
1600
1800
0 5 10 15 20 25 30
CDOM absorption (m-1)
DO
C (
µm
ol l
-1)
DOC = 61.813x + 158.89R2 = 0.734
Chapter 1
Dissolved organic matter (DOM).What is it and why study it?
DISSOLVED ORGANIC MATTER (DOM) IN AQUATIC ECOSYSTEMS: A STUDY OF EUROPEAN CATCHMENTS AND COASTAL WATERS 13
Chapter 1
Dissolved organic matter (DOM):What is it and why study it?

peaty soils tend to have higher DOC-specific absorbance coefficients than those from arable land. Thus, unlike the chemical methods, the optical methods have to be calibrated for particular sites or catchment types. The site specific difference in ab-sorption and fluorescence can there-fore be used to characterise DOM and to identify specific compounds or groups of compounds. The use of optical methods in DOM research is presented in more details in Chap-ter 3 (fluorescence) and in Chapter 4 (absorption). In summary, the scientific com-
munity has good control on how to measure DOC with high accuracy and precision. For DON it is very difficult to get accurate and high precision measurements when the concentration of nitrate is high. Such situations are often found in rivers draining agricultural areas. The same problem arises for trust-worthy DOP measurements when the concentration of phosphate is high. Furthermore, DOP concen-trations are generally very low, which at any circumstances make accurate and precise measurements difficult.
14 DISSOLVED ORGANIC MATTER (DOM) IN AQUATIC ECOSYSTEMS: A STUDY OF EUROPEAN CATCHMENTS AND COASTAL WATERS
Photo 1.2
Sampling on Horsens Fjord,
Niels Henrik Borch
(photo by Stiig Markager).
Dissolved organic matter (DOM). What is it and why study it?Sources of dissolvedorganic matter from land
Terrestrial ecosystems are the pri-mary source of freshwater dis-
solved organic matter (DOM), al-though decomposition products of aquatic organisms are important in eutrophic systems. The vast majority of aquatic ecosystems in the world have dissolved organic carbon (DOC) concentrations falling within the range of 40 to 4000 µmol l-1. Dis-solved organic carbon varies in con-centration from approximately 40 µmol l-1 for ground water and sea-water to over 2500 µmol l-1 for col-oured water from peatlands. Swamps, marshes and bogs have concentrations of DOC from 800 up to 5000 µmol l-1. In coastal marine waters typical surface water values
Pirkko Kortelainen Tuija Mattsson Anker Laubel Dylan Evans Gustave Cauwet Antti Räike
range from 100 µmol l-1 to 500 µmol l-1 in eutrophic lagoons and areas where water exchange is limited. The ranges of DON and DOP in natural waters are typically between 3 to 200 µmol l-1 and 0.05 to 2 µmol l-1, respectively. Generally, it is a combination of terrestrial and aquatic primary pro-duction and decomposition rates that control the amount of dissolved organic carbon (DOC). For example, Arctic, alpine and arid environments have low concentrations of DOC in rivers and lakes because of generally low primary productivity. In con-trast aquatic production in warm temperate and tropical latitudes is much higher. However, decomposi-tion of organic matter is also rapid
2Chapter
DISSOLVED ORGANIC MATTER (DOM) IN AQUATIC ECOSYSTEMS: A STUDY OF EUROPEAN CATCHMENTS AND COASTAL WATERS 15

tending to lower DOC concentra-tions. The taiga has high production of organic matter and slower decom-position, resulting in higher DOC concentrations. At the global scale, there are clear patterns of DOM concentration and flux related to regional climate, ei-ther directly through hydrological effects or indirectly through vegeta-tion. The principal sources of auto-chthonous DOM production vary across systems: Periphyton domi-nate in streams, macrophytes in lakes and phytoplankton in coastal waters, seas and oceans. It has been estimated that 95 % of freshwater lakes and wetlands receive > 97 % of their autochthonous DOM from macrophytes. In large lakes and oce-anic systems, much of the DOM originates from phytoplankton. Wetlands are generally thought to be the main allochthonous DOC source into surface waters. High
amounts of DOC leach from wet-lands (which retain a high water content throughout the year), and from soils where surface or subsur-face runoff is a major feature. DOC can be strongly adsorbed to oxides and clay minerals in lower soil hori-zons in upland catchments, result-ing in lower DOC concentrations be-ing released. Changes in the export of DOC to aquatic ecosystems also influence the delivery and biogeochemical cy-cling of other components associ-ated with DOC. However, studies including DON and DOP dynamics in addition to DOC are few. There are indications that the rate of re-lease and fates of DOC, DON, and DOP in the soil may differ to a greater extent than previously as-sumed, and controls established for DOC might therefore not be valid for DON and DOP. Moreover, con-trols of DOM dynamics in soils have
mostly been focused on temperate regions and there is an urgent need for these to be extended to soils un-der various land uses and in other climate zones. DON concentrations have been found to correlate positively with percentage cover of forestry. Moreo-ver, agricultural fields have been found to increase DON export and the use of organic fertilizers has been reported to increase the amount of water extractable organic matter. The major source of DOP is thought to be animal waste and sewage sludge, and consequently applica-tion of organic fertilisers to soils with a sandy texture is assumed to provide a high rate of infiltration to the groundwater.
16 DISSOLVED ORGANIC MATTER (DOM) IN AQUATIC ECOSYSTEMS: A STUDY OF EUROPEAN CATCHMENTS AND COASTAL WATERS
Photo 2.1
The upper reaches of River Tech, France
and Gustave Cauwet
(photo by Stiig Markager).

Effect of climatic conditions on DOM transportVegetation litter and humus are the most important DOM sources in soils, and high microbial activity, high fungal abundance, and any conditions that enhance mineralisa-tion all promote high DOM concen-trations. However, in general hydro-logical control in soil horizons with high carbon contents may be more important than biotic control of DOM release. Hydrological control becomes significantly more impor-tant with increasing time, and on the time scale of several years water fluxes through the soil are consid-ered to be the dominant factor con-trolling DOM fluxes in soil. In most rivers the organic matter concentrations vary with discharge and season and most of the DOM moving downstream is humic mat-ter that has a turnover time exceed-ing the residence time of the systems through which it passes. DOC con-centrations generally show a posi-tive correlation with discharge. How-ever, a strong positive relationship between discharge and DOC con-centrations has been recorded at low discharges, whereas a negative rela-tionship has been found at high dis-charges. Regional variation in annual export of DOC in North American rivers has been primarily attributed to differences in annual runoff, but DOC concentrations in single rivers were not strongly correlated to dis-charge alone, and an obvious rela-
tionship between leaching and dif-ferent climatic regions is not easily defined. Seasonal variation in DOC con-centrations often follow the pattern of increasing concentrations during spring and autumn high flow peri-ods and decreasing concentrations during winter and summer low flow periods. Catchments with a significant wetland component may experience fewer fluctuations in stream DOC concentrations with changes in hydrologic flux. In up-land catchments, the flow path of water through soil is an important determinant of DOC concentration. DOC concentrations are higher dur-ing periods when the dominant flow paths are near the surface through the organic-rich upper soil horizon rather than through the lower soil horizons that often have high DOC sorption capacity. In contrast, in a catchment containing a large wet-
land, DOC can decrease with dis-charge, since in wetlands, the water table remains close to the surface and additional water from precipi-tation does not greatly increase the contact with organic rich surface horizons. The strong relationship between DOC export and runoff suggests that climate change can have a great impact on DOC export. Increase in precipitation might increase DOC fluxes, whereas increasing evapora-tive demand under a warmer cli-mate might offset the effect. Organic carbon export simulations based on climate change scenarios and neural network indicate increasing DOC fluxes in Canadian rivers and in Finnish headwater streams, while a 20 year data set from the Experimen-tal Lake Area in Canada documents a significant decrease in DOC of lake water associated with a local climate warming.
Chapter 2
Sources of dissolved organic matter from land
DISSOLVED ORGANIC MATTER (DOM) IN AQUATIC ECOSYSTEMS: A STUDY OF EUROPEAN CATCHMENTS AND COASTAL WATERS 17
Photo 2.2
Peat-land near Oulu, Finland
(photo by Stiig Markager).

Controlling factors at the landscape scale Large drainage basins are composed of numerous sub-basins, differing in character and arranged in compli-cated mosaic patterns (Chapter 6). The DOM concentrations in the out-lets of large catchments give an aver-age, integrated picture of the hydrol-ogy and the DOM dynamics in the sub-basins. The DOM concentrations are related to export from the catch-ments due to differences in climate, soil and vegetation type, but they are also influenced by internal processes in lakes and streams such as sedi-mentation, photo-oxidation, bacte-rial uptake and mineralisation. Upstream lakes are likely to in-crease the residence time of water, which is reflected as decreasing DOM concentrations and often also as reducing temporal and annual variations. Small headwater lakes and streams mainly have lake-less catchments, which is consistent with the observation that small lakes and streams have the highest DOC con-centrations. In large and deep lakes, with long residence times, the deg-radation and sedimentation proc-esses affecting organic matter are likely to be more complete, resulting in lower concentrations. High DOC concentrations are measured in peat and forest cov-ered areas with few lakes, i.e. areas with large organic soil pools and short water retention times. Low concentrations are recorded in regi-ons with sparse vegetation, poorly
developed organic soils and large areas covered by lakes. From west-ern Norway, Scotland and Wales to eastern Finland, there is a gradient from high to low precipitation (3500 mm to 600 mm yr-1) and from mountain areas with thin and patchy soils to forested areas with thick soils. The pattern of total or-ganic carbon shows a clear increas-ing gradient from west to east re-flecting these changes, as well as a slightly increasing gradient from north towards south.
European river basins The European continent covers about 10 million km2, stretching from the Atlantic Ocean and Iceland in the west to the Ural Mountains and the Caspian Sea in the east, and from the Barents Sea in the north to the Mediterranean and the Black Sea in the south. River catchments are numerous but relatively small, and rivers are short. The 31 largest rivers in Europe, all which have catch-ments exceeding 50000 km2, drain approximately two thirds of the con-tinent. Approximately 42% of the total land area in Europe serves some agricultural purpose, 33% is covered by forest, 24% covered by mountains, tundra etc. and 1% by urban areas. These percentages, how-ever, vary greatly among countries. Forest cover varies from 6% in Ire-land up to 86% in Finland (classified as forestry land including forest land, scrub land and waste land). The proportion of land devoted to
agriculture varies from less than 10% in Finland, Sweden and Nor-way, up to 70% or more in Hungary, Ireland, Ukraine and the UK. How-ever, there are large regional differ-ences in the farming intensity, and the type of crops grown. For exam-ple, in Denmark agricultural land constitutes about 65% of the total land area and most of it is arable land. While in Ireland agricultural land constitutes 81% of the total land area, but only 18% is classified as ar-able land, most of the agricultural land being used for grazing. The highest peat-land proportion of the total land area in Europe is in Fin-land (32%), followed by Ireland (20%), Sweden (19%), Norway (9.2%), Great Britain (6.6%) and Poland (4.2%). The average annual runoff in Eu-rope follows closely the pattern of average annual rainfall and topogra-phy. Precipitation is highest in the west and lowest in the east, while evaporation is highest in the south and east. Annual runoff may exceed 3000 mm in parts of Iceland, Nor-way, and the Alps, whereas it is be-low 25 mm in parts of Spain and southern parts of the Russian Fed-eration. The greater variation of run-off in Western Europe, compared with Eastern Europe, reflects the greater variability in topography and rainfall. The pattern by which river flow varies during the year, i.e. the flow regime, is determined by the seasonal variation in climate, as well as the nature of the catchment i.e. soil and bedrock permeability,
18 DISSOLVED ORGANIC MATTER (DOM) IN AQUATIC ECOSYSTEMS: A STUDY OF EUROPEAN CATCHMENTS AND COASTAL WATERS

land-management and vegetation. Because climatic and geological pro-perties differ throughout Europe, the flow regimes of European rivers vary considerably. When extensive swamps, forests, and lakes are pre-sent in a river catchment they at-tenuate the natural fluctuation in discharge by storing the water and releasing it slowly.
Land use cover in the DOMAINE countriesThe study catchments of the DO-MAINE -project are situated in Den-mark, Finland, France and Wales. The land use cover in these countries is variable: In Denmark forests and plantations cover 12%, agricultural land covers 65%, lakes cover 1%, and urban areas 4% of the land. Meadows, marshland, moor land, sand dunes and bogs cover 11% of the total land area in Denmark. In France forests and other wooded
land account for less than 28 % of the total land area and agricultural land covers 57 % of the total land area. In the UK 75% of the total land area is agricultural. The forest cover of Brit-ain (11% of the land area) is un-evenly distributed: 8% in England, 12% in Wales and 16% in Scotland. In Finland forestry land covers 86% of the land area, compared to 10% for agricultural use and 4% built up. Freshwater covers 10% of the total area of Finland, including ap-proximately 56000 lakes larger than one hectare. In contrast the number of lakes larger than one hectare in Denmark and UK (England and Wales only), are only 690 and 1700, respectively, while France has 150 lakes larger than 10 ha.
Climate and land use cover in the DOMAINE catchmentsThe DOMAINE study catchments
differ significantly with respect to climatic conditions and land use cover. The mean air temperature and precipitation are highest in France and lowest in Finland (Table 2.1). The catchments in north Wales have nearly as high precipitation as the French catchments. Runoff data is not available from the Welsh catch-ments. However, due to colder cli-mate and lower evaporation, the runoff in north Wales is presumably much higher compared to France. The Danish and Welsh catch-ments are dominated by agricultural land, while forests cover large parts of the French and Finnish catch-ments (Table 2.2). However, most of the agricultural land in Denmark is arable, while in the Welsh catchment studied most is permanent grass-land. Wetland covers on average 27% of the Finnish catchments; in other countries the proportion of wetlands is minor.
Chapter 2
Sources of dissolved matter from land
DISSOLVED ORGANIC MATTER (DOM) IN AQUATIC ECOSYSTEMS: A STUDY OF EUROPEAN CATCHMENTS AND COASTAL WATERS 19
Photo 2.3
The upper reaches of the River Conwy,
North Wales
(photo by D. Thomas).
Chapter 2
Sources of dissolved organic matter from land
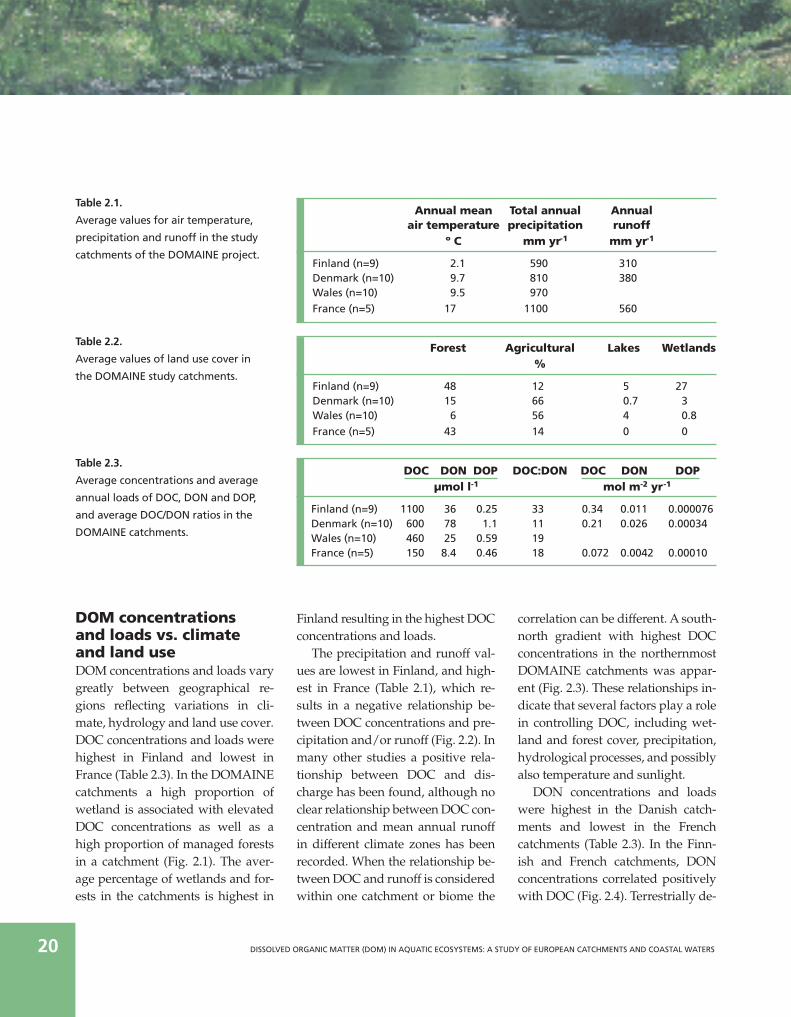
Table 2.1.
Average values for air temperature,
precipitation and runoff in the study
catchments of the DOMAINE project.
Table 2.2.
Average values of land use cover in
the DOMAINE study catchments.
Table 2.3.
Average concentrations and average
annual loads of DOC, DON and DOP,
and average DOC/DON ratios in the
DOMAINE catchments.
DOM concentrations and loads vs. climate and land use DOM concentrations and loads vary greatly between geographical re-gions reflecting variations in cli-mate, hydrology and land use cover. DOC concentrations and loads were highest in Finland and lowest in France (Table 2.3). In the DOMAINE catchments a high proportion of wetland is associated with elevated DOC concentrations as well as a high proportion of managed forests in a catchment (Fig. 2.1). The aver-age percentage of wetlands and for-ests in the catchments is highest in
Finland resulting in the highest DOC concentrations and loads. The precipitation and runoff val-ues are lowest in Finland, and high-est in France (Table 2.1), which re-sults in a negative relationship be-tween DOC concentrations and pre-cipitation and/or runoff (Fig. 2.2). In many other studies a positive rela-tionship between DOC and dis-charge has been found, although no clear relationship between DOC con-centration and mean annual runoff in different climate zones has been recorded. When the relationship be-tween DOC and runoff is considered within one catchment or biome the
correlation can be different. A south-north gradient with highest DOC concentrations in the northernmost DOMAINE catchments was appar-ent (Fig. 2.3). These relationships in-dicate that several factors play a role in controlling DOC, including wet-land and forest cover, precipitation, hydrological processes, and possibly also temperature and sunlight. DON concentrations and loads were highest in the Danish catch-ments and lowest in the French catchments (Table 2.3). In the Finn-ish and French catchments, DON concentrations correlated positively with DOC (Fig. 2.4). Terrestrially de-
Annual mean Total annual Annual air temperature precipitation runoff º C mm yr-1 mm yr-1
Finland (n=9) 2.1 590 310Denmark (n=10) 9.7 810 380Wales (n=10) 9.5 970
France (n=5) 17 1100 560
Forest Agricultural Lakes Wetlands %
Finland (n=9) 48 12 5 27Denmark (n=10) 15 66 0.7 3Wales (n=10) 6 56 4 0.8
France (n=5) 43 14 0 0
DOC DON DOP DOC:DON DOC DON DOP µmol l-1 mol m-2 yr-1
Finland (n=9) 1100 36 0.25 33 0.34 0.011 0.000076 Denmark (n=10) 600 78 1.1 11 0.21 0.026 0.00034Wales (n=10) 460 25 0.59 19France (n=5) 150 8.4 0.46 18 0.072 0.0042 0.00010
20 DISSOLVED ORGANIC MATTER (DOM) IN AQUATIC ECOSYSTEMS: A STUDY OF EUROPEAN CATCHMENTS AND COASTAL WATERS

rived organic matter often has high DOC:DON ratios compared with DOM produced by phytoplankton and aquatic plants. In the Danish catchments the average DOC:DON ratio was low (11) indicating a large contribution of aquatic sources of DOM. In contrast the Finnish catch-ments had a ratio three times higher and riverine DOM mostly originates from terrestrial sources. In the DO-MAINE catchments in Wales and Finland DON concentrations in-creased significantly with the in-creasing proportion of agricultural
Figure 2.2.
Relationships between DOC concentra-
tion vs. precipitation and runoff in the
DOMAINE catchments.
Figure 2.1.
Average, minimum and maximum DOC
concentrations in the DOMAINE catch-
ments with wetland cover ranging
from 0 to 10%, and from 20 to 50%,
and with managed forest cover ranging
from 0 to 20%, and from 30 to 50%.
land in the catchment (Fig. 2.5), while in the data from Denmark and France no such relationship was found. DOP concentrations and loads were low compared to DOC and DON (Table 2.3). The lowest values were recorded in Finland and the highest in Denmark, and DOP con-centrations were positively related to the percentage of agricultural land in the catchment (Fig. 2.6). The use of organic fertilizers has been reported to increase the amount of water extractable organic matter, probably contributing to the posi-
tive correlation between agricul-tural land in the DOMAINE catch-ments and DON or DOP concen-trations. DOC, DON and DOP concentra-tions were on average larger during the warm period (April-September) compared to the colder one (Octo-ber-March). However, in the Danish catchments DOC and DON concen-trations were somewhat higher during the cold period probably due to larger runoff compared to the warmer period. There was also a seasonal variation in the DOC:
0
500
1000
1500
2000
0 200 400 600 800Runoff (mm yr-1)
DOC = -2.9x + 1828R2 = 0.55
DO
C (
µm
ol l
-1)
0
400
800
1200
1600
2000
0-20Managed forest (%)
30-50
DO
C (
µm
ol l
-1)
0
500
1000
1500
2000
0 500 1000 1500Precipitation (mm yr-1)
DOC = -0.9x + 1385R2 = 0.27
DO
C (
µm
ol l
-1)
0
400
800
1200
1600
2000
0-10Wetland (%)
20-50
DO
C (
µm
ol l
-1)
Chapter 2
Sources of dissolved matter from land
DISSOLVED ORGANIC MATTER (DOM) IN AQUATIC ECOSYSTEMS: A STUDY OF EUROPEAN CATCHMENTS AND COASTAL WATERS 21
Chapter 2
Sources of dissolved organic matter from land

Figure 2.3.
Relationships between DOC versus lati-
tude and annual mean air temperature
in the DOMAINE catchments.
Figure 2.4.
Relationships between DOC and DON
in stream water in France and Finland.
DON ratio, especially in the Danish and the Finnish catchments, DOC:
Figure 2.5.
Relationships between DON and the
proportion of agricultural land in the
DOMAINE catchments in Finland and
Wales.
Figure 2.6.
Relationship between DOP and the
proportion of agricultural land in the
DOMAINE catchments. One outlier has
been omitted.
DON ratio being lower during the warm period.
0
500
1000
1500
2000
-5 0 5 10 15 20 25Annual mean air temperature (˚C)
DOC = -63x + 1172R2 = 0.49
DO
C (
µm
ol l
-1)
0
500
1000
1500
2000
40 50 60 70 80Latitude
DOC = 41x + 1639R2 = 0.54
DO
C (
µm
ol l
-1)
0
10
40
30
20
50
60
70
0 500 1000 1500 2000DOC (µmol l-1)
Finland
DON = 0.031x + 2.1R2 = 0.49
DO
N (
µm
ol l
-1)
0
2
8
6
4
10
12
0 100 200 300DOC (µmol l-1)
France
DON = 0.053x + 0.47R2 = 0.97
DO
N (
µm
ol l
-1)
0
0.5
1.5
1.0
2.0
2.5
0 20 40 60 80 100Agricultural land (%)
DOP = 0.2124e0,0176x
R2 = 0.57
DO
P (µ
mo
l l-1
)
0
10
40
30
20
50
60
70
0 20 40 60 80 100Agricultural land (%)
DON = 1.0x + 24R2 = 0.86
FinlandWales
DON = 0.21x + 13R2 = 0.79
DO
N (
µm
ol l
-1)
22 DISSOLVED ORGANIC MATTER (DOM) IN AQUATIC ECOSYSTEMS: A STUDY OF EUROPEAN CATCHMENTS AND COASTAL WATERS

Dissolved organic matter (DOM). What is it and why study it?DOM sources and microbesin lakes and coastal waters
Both allochthonous and autoch-thonous DOM are complex mixtures of many different organic com-pounds, which can influence aquatic ecosystems via their diverse physi-cal and chemical properties (Chap-ter 4). The bulk of terrestrial DOM and some of the “freshly” produced autochthonous DOM degrade slow-ly so DOM can be transported long distances from its original sources. Thus, the oxygen demand and nutri-ents bound in the DOM constituents DOC, DON and DOP can be re-leased uncoupled in time and space from its production. Bacterial utilisation and photo-chemical reactions are the two most important processes removing and
Morten SøndergaardFrede Thingstad Colin Stedmon Theis Kragh Gustave Cauwet
transforming DOM (Chapter 5). In this chapter some chemical proper-ties of DOM and the interactions of DOM and microbes in lakes and coastal waters will be summarized.
Microbial dominance: Bacteria and DOM turnoverIt is estimated that the global bacte-rioplankton carbon demand (orga-nic carbon needed to fuel bacterial growth and respiration) averages some 40-60 % of phytoplankton pri-mary production. Bacteria can only utilise small dissolved molecules so high bacterial activity can only take place together with a high produc-tion of readily available DOM.
3Chapter
DISSOLVED ORGANIC MATTER (DOM) IN AQUATIC ECOSYSTEMS: A STUDY OF EUROPEAN CATCHMENTS AND COASTAL WATERS 23

Figure 3.1
A simplified and conceptual water col-
umn food web model. The “classical”
particulate food chain with phyto-
plankton, zooplankton and fish is pro-
ducing DOM and dead particles for the
microbial loop with bacteria exploiting
dissolved compounds and recycling
DOM to the particulate phase. Also
inserted are the photochemical action
of solar radiation, the interchange
between recalcitrant (RDOM) and bio-
degradable DOM (BDOM) and the
remineralisation of DOM to CO2, inor-
ganic nitrogen (DIN) and orthophos-
phate (DIP). Original by Theis Kragh.
CO2
DINDIP
BDOM
RDOM
UV PAR
Fish
Zooplankton
Virus
Bacteria
Aggregates
Flagellates/ciliates
Phytoplankton
24 DISSOLVED ORGANIC MATTER (DOM) IN AQUATIC ECOSYSTEMS: A STUDY OF EUROPEAN CATCHMENTS AND COASTAL WATERS

The “classicalc (before 1974) view of the turnover of organic matter in a water column ignored an active DOM compartment, since DOM was deemed a large but inert part of the ecosystem. The conceptual picture of dominant pelagic processes was a linear particulate food chain, where phytoplankton were grazed by small zooplankton, which in turn were eaten by small fish and again eaten by larger fish at the top of the food chain. The classical particulate food chain is on the right side of the food web cartoon in Figure 3.1. This “classical” view totally changed in the late 1970s and early 1980s. New improved techniques to measure bacteria showed high abun-dance and activity of free-living bac-terioplankton in lakes and marine waters. The microbial loop with bac-teria at the base of a DOM “food web” was born (Fig. 3.1, middle and left side)
Turnover of organic matter via bacteria is generally important; how-ever, there are large seasonal and spatial variations among different aquatic systems. Oligotrophic sys-tems – whether lakes or oceans- have very high bacterial carbon de-mand amounting to approximately 80 % of phytoplankton primary production, while lower values are found in more eutrophic and shal-low systems, where much of the produced organic material is de-composed in the sediment. In humic lakes and other water bodies with high terrestrial DOM import, the bacterial carbon de-mand can surpass primary produc-tion due to the ability of bacteria also to utilise allochthonous DOM, aided by the photochemical production of small and easily assimilated sub-strates from large complex DOM fractions. Although bacteria easily degrade only a small fraction of ter-
restrial DOM the total import is large and can sustain high bacterial pro-duction. Most water columns in lakes are net heterotrophic, i.e. produce more CO2 than O2 due to respiration of allochthonous DOM. The conclusion that came out of this new “era” was that in many aquatic ecosystems bacterial utilisa-tion of DOM is THE major route of organic carbon turnover. Further-more, due to the high nitrogen and phosphorus requirement of bacteria compared with other organism in the plankton, the cycling of N and P are also tightly linked to microbial activ-ity. Modelling such interactions is one key to understand the factors shap-ing biological structure in coastal wa-ters and to understand how food webs can control DOM. A newly de-veloped “minimum” model with in-teractions of bacteria, phytoplankton and dissolved inorganic and organic nutrients is presented in Box 3.1.
Chapter 3
DOM sources and microbesin lakes and coastal waters
Photo 3.1
Bacterioplankton stained with SYTO
13 (green particles). The red particles
(white arrows) are small algal cells
flourescing red (photo by Anne
Jacobsen).
DISSOLVED ORGANIC MATTER (DOM) IN AQUATIC ECOSYSTEMS: A STUDY OF EUROPEAN CATCHMENTS AND COASTAL WATERS 25

DOM – a dominant constituent and complex chemical poolChemical measurements of the ma-jor organic constituents show in most aquatic systems an overwhel-ming dominance of the dissolved fraction compared with the particu-late fraction. DOC is typically found in concentrations 10 to 100 times
higher than particulate organic car-bon (POC). The ratios between dis-solved and particulate organic nitro-gen and phosphorus can be lower and very variable as nitrogen and phosphorus during the growth sea-son are efficiently harvested by or-ganisms. All chemical measurements of DOM show an enrichment of carbon
relative to nitrogen and phosphorus when compared with the molar C:N:P Redfield ratio of 106:16:1 found in many plankton organisms and or-ganic particles in the water column. The C:N and C:P ratios of DOM are indicators for the nutritional value of DOM and deviations from Redfield (C:N at 6.6 and C:P at 106) toward carbon enrichment generally indi-
Box 3.1Analysis of food web effects using idealised models: Is bacterial consumption of DOC influenced by the trophic interactions of the microbial food web?Food webs consist of a network of balancing processes;
growth and death, remineralisation and nutrient uptake,
competition and predation. Focusing on one of these as-
pects only, inevitably gives a biased discussion that easily
miss essential aspects of how these processes work together
as a system. Combining ALL processes and organisms in a
natural ecosystem into the discussion would on the other
hand create a monstrous network from which it would be
impossible to distinguish important from unimportant fea-
tures. Somewhere in-between is the arena for a “conceptual
minimum model”. This is the idealized version of the food
web that has just enough components to allow an under-
standing of its central features, but no more. As one sugges-
tion for such a “minimum model”, it seems that many
important properties of the food web in Fig. 3.1 (which al-
ready is an idealisation) can be summarized in the following
(even more idealised) network.
AutotrophicFlagellates
HeterotrophicFlagellates
HeterotrophicBacteria
Ciliates
PO4
Copepods
Diatoms
SiLDOC
26 DISSOLVED ORGANIC MATTER (DOM) IN AQUATIC ECOSYSTEMS: A STUDY OF EUROPEAN CATCHMENTS AND COASTAL WATERS
The blue arrows and boxes illustrate the flows and pools
of phosphorus through the food web. The red boxes and ar-
rows illustrate how a lack of available organic-C substrates for
bacteria (LDOC), or a lack of silicate (Si) needed by diatoms,
may restrict the phosphorus flow through the left “microbial”
or the right “classical” part of the food web, respectively.
A steady state of such a network is one where the oppos-
ing processes balance each other and there is no change over
time although material continuously circulates through the
food web. In our context, one important feature of the sug-
gested minimum model is that it has sufficient elements to al-
low steady states both with bacterial growth limited by
mineral nutrients (in this case phosphate) and with organic
carbon limitation.
To illustrate the mechanism, assume that bacterial growth is
phosphorus limited. Since bacteria, with their high surface-to-
volume ratio, are assumed to be the best competitors for phos-
phate, one could argue that they should out-compete the
phytoplankton until primary production is reduced to a level
where bacterial growth becomes carbon-limited. If this was
true, one should only observe steady states in nature with car-
bon-limited bacteria. Since this is not in accordance with obser-
vations, which strongly suggest bacterial phosphorus limitation
cate poor substrate quality. High car-bon enrichment would be expected for terrestrial DOM with its origin from terrestrial vegetation and soils, however, enrichment is also influ-enced by land use (Chapter 2). The consequence of high carbon enrich-ment is that microbes often have to extract the carbon (and energy) with the use of inorganic nutrients from
the environment and ultimately min-eralise DOM with a high oxygen de-mand compared with the release of inorganic nitrogen and phosphorus. The concentrations of DOC, DON and DOP and the C:N:P stoichiom-etry of DOM at the land-sea inter-face can be exemplified by a study of Hansted Stream draining an agri-cultural dominated Danish catch-
ment with Horsens Fjord as the coastal end-member (see Fig 3.2 and Chapter 6). The DOM in Horsens fjord, as is the case for most coastal waters, is carbon rich and poor in nitrogen and phosphorus relative to the Red-field ratio. The N:P ratio of DOM in the fjord is 42 and about 10-fold higher than in a bacterial cell. From
occurs regularly both in freshwater and in some marine en-
vironments, additional mechanisms are needed to prevent
such an inevitable transition to carbon-limitation.
Predation from heterotrophic flagellates prevents the
build-up of a large bacterial biomass that would immobilise
the available phosphorus, and some phosphorus will thus be
left for the competing phytoplankton. With bacteria sand-
wiched between predatory control of biomass and competi-
tion control of growth rate, bacterial production (=growth
rate x biomass) will remain low. Bacteria use organic carbon
for two purposes, for production of new biomass, and for
respiration. With production now controlled by our compe-
tition-predation mechanism, and respiration constrained
within limits given by bacterial physiology, bacterial con-
sumption of organic carbon will, in our minimum model, be
restricted to some low level. If degradable organic matter
now is supplied by allochthonous and/or autochthonous
sources at a rate exceeding this restricted rate of bacterial
consumption, the excess of otherwise perfectly degradable
DOC will simply accumulate. This is what we believe we
have seen when, in some systems, there is no bacterial re-
sponse to addition of an easily accessible carbon source like
glucose, and most of the added glucose just accumulates.
Chapter 3
DOM sources and microbesin lakes and coastal waters
DISSOLVED ORGANIC MATTER (DOM) IN AQUATIC ECOSYSTEMS: A STUDY OF EUROPEAN CATCHMENTS AND COASTAL WATERS 27
Chapter 3
DOM sources and microbesin lakes and coastal waters

Box 3.2Fluorescence of DOMFluorescence spectroscopy is a sensitive technique for
tracing quantitative and qualitative changes in fractions
of DOM. When irradiated with ultra violet and blue light,
a sub-fraction of the DOM pool fluoresces. The concentra-
tion and chemical composition of the DOM pool deter-
mine the intensity and shape of the fluorescence spectra
measured. The exact location of the fluorescence peaks
varies with the composition of the fluorescent DOM.
Parallel factor analysis (PARAFAC) allows the decompo-
sition of the measured spectra into the different under-
lying sub-fractions. The dynamics of the different frac-
tions in different aquatic environments can then be
traced and used as a proxy for the changing characteris-
tics of the DOM pool as a whole. This example show the
eight fractions identified in DOM from the Horsens catch-
ment and estuary in Denmark. Components 1 to 6 exhibit
fluorescence characteristics similar to that of humic mate-
rial (both of allochthonous and autochthonous origin),
and components 7 and 8 represent a protein-like fluores-
cence (autochthonous DOM).
28 DISSOLVED ORGANIC MATTER (DOM) IN AQUATIC ECOSYSTEMS: A STUDY OF EUROPEAN CATCHMENTS AND COASTAL WATERS
121
43
65
87
Measured
DOM
fluorescence.
PARAFAC
model of
DOM
fluorescence.
Residuals
difference
between
measured
and modelled.
300 400Excitation wavelength
0.2 0.1 0
Emis
sio
nw
avel
eng
th (
nm
)
600
300
300 400Excitation wavelength
0.02 0 -0.02
Emis
sio
nw
avel
eng
th (
nm
)
600
300
The model
is the sum
of 8
fluorescent
sub-
fractions.

these measurements of the DOM nutrient stoichiometry we learn that microbial exploitation of DOM in most cases requires bacterial up-take of inorganic nitrogen and phos-phorus or an ability to exploit DON and DOP specifically. The conse-quence of the chemical composition of DOM is a high oxygen demand during degradation and a bacterial community competing with phyto-plankton for limiting nutrients DOM from terrestrial environ-ments has a high content of humic material and a very complex chemis-try. The coloured humic material provides specific optical markers for the terrestrial origin, which can be used to trace the fate of terrestrial
compounds traveling in a stream into a lake and further into an estu-ary. Additionally, the mixing of al-lochthonous with autochthonous DOM can be followed using a newly developed method identifying spe-cific optical signals linked to the ori-gin of DOM (Box 3.2). Hansted Stream once more can be used as an example to follow DOM from land to sea. In the upper reaches of the stream the terrestrial and humic compound groups 1 to 6, as identified by the PARAFAC mo-delling, dominate as expected (Fig. 3.3), but the relative distribution and concentrations change after passing a eutrophic lake and more so in the fjord. The changes in composition
are due to autochthonous DOM pro-duction in the lake and the fjord di-luting the terrestrial DOM signa-tures. Down stream dilution of the total bulk organic pool is described by DOC, which decreases in concen-trations from 1110 to 230 µmol l-1. It is the interactive combination of selective microbial degradation and photochemical transformations that makes freshwaters, estuaries and coastal waters function as a sieve re-moving terrestrial signals from DOM on its way to the oceans where ter-restrial signals are absent.
creased and the C:P and N:P ratios almost doubled. In the
fjord the ratios resembled DOM at the lake outlet. The C:N:P
ratio of the fjord end-member is 740:42:1. In comparison, the
C:N:P ratio of DOM in surface waters of oceans totally domi-
nated by autochthonous DOM is typically about 430:36:1, i.e.
much less carbon enriched than in this system dominated by
terrestrial DOM.
Chapter 3
DOM sources and microbesin lakes and coastal waters
Stream Lake outlet Estuary0
5
10
15
20
25
Mo
lar
C:N
rat
ios
0
200
400
600
800
1000
Mo
lar C:P ratio
s
C:NC:P
DO
C (
µm
ol l
-1)
DO
N an
d D
OP (µ
mo
l l -1)
0
200
400
600
800
0
20
40
60
80
Stream Lake outlet Estuary
DOC
DOPDON
DISSOLVED ORGANIC MATTER (DOM) IN AQUATIC ECOSYSTEMS: A STUDY OF EUROPEAN CATCHMENTS AND COASTAL WATERS 29
Chapter 3
DOM sources and microbesin lakes and coastal waters
Figure 3.2
Seasonal averages of DOC, DON and DOP concentrations
and molar C:N and C:P ratios of DOM in the Danish stream
Hansted, in the outlet from a eutrophic lake, and in the re-
ceiving estuarine end-member Horsens Fjord. The average
C:N and C:P ratios for DOM in the stream are well above Red-
field ratios, while the N:P ratio is close to Redfield. In the out-
let from the lake, DOM is less carbon rich relative to N due to
an increase in DON; however, the concentration of DOP de-

Photo 3.2
Station 13 in the Hansted catchment
(photo by Stiig Markager).
Figure 3.3
Fluorometric analysis of DOM sampled
in the upper reaches of Hansted
Stream, at the outlet of a eutrophic
lake and in the estuarine end-member
Horsens Fjord. Eight compound groups
were identified and it is shown how
there is a shift in the relative distribu-
tion moving from the steam to the
fjord. The methodology of the com-
pound modelling is outlined in Box 3.2.
Flu
ore
scen
ce(%
Ram
an u
nit
s)
0
5
10
15
20
25
30
35
8765
4321
Outer estuary(233 µmol l-1 DOC)
Hansted outflow(486 µmol l-1 DOC)
Forest stream(1112 µmol l-1 DOC)
30 DISSOLVED ORGANIC MATTER (DOM) IN AQUATIC ECOSYSTEMS: A STUDY OF EUROPEAN CATCHMENTS AND COASTAL WATERS

Two types of DOM and its biodegradationThe allochthonous DOM and some of the autochthonous DOM production can be measured chemically because it has not yet been removed by micro-bial and photochemical processes. In essence, most of the measured DOM must be somewhat resistant to degra-dation. The other part of the DOM production is the fraction that is re-moved as fast as it is produced, and this fraction can only be measured in-directly as bacterial production and respiration. This latter fraction typi-cally consists of amino acids, small carbohydrates, sugar alcohols, and small-chained fatty acids among oth-ers. Their concentrations in natural waters are extremely low (nanomol l-1) and vary little in time and space. High concentrations of very biode-
gradable DOM such as glucose and amino acids can only occur if the ac-tivity of the bacterial community is suppressed by high grazing keeping the active bacterial biomass low or if bacterial growth rates are limited by nutrients (see Box 3.1). At steady state between autoch-thonous DOM production, terres-trial import and DOM removal by microbes and photochemical proc-esses, i.e. when the rates of input and removal are balanced, the con-centration of degradable compounds will be constant and inversely pro-portional to their biological lability (how easy they are utilized). This is why the DOM pool in most situa-tions is dominated by compounds that can only be degraded slowly (semi-labile and recalcitrant) or not at all within time scales of decades or
hundreds, even thousands of years (refractory compounds). Experiments on biodegradation of terrestrial DOM show that most DOC is recalcitrant with degradation rates of less than 0.2% per day, although a slow degradation rate is not unique to terrestrial DOC. A variable but quantitatively significant part of the primary production in lakes, coastal waters and oceans is routed to a car-bon rich DOM pool. Biodegradation of a DOM pool not influenced by ter-restrial DOM is exemplified by re-sults from surface waters collected in the Atlantic Ocean off the US north-east coast (Fig. 3.4). It is of interest to notice that nitro-gen and specifically phosphorus are “utilised” selectively compared with carbon. After biodegradation the re-maining DOM is even more carbon
Figure 3.4
The relative distribution of biodegradable and recalcitrant
fractions of DOC, DON and DOP in surface water samples
from the continental shelf area off the US northeast cost.
Degradation experiments were run for 180 days. The labile
pools had half-lives below 12 days, while the semi-labile
polls had half-lives below 113 days. Most DOC (75%) was
not degraded at all. The biodegradability of DON and DOP
was higher at 40 and 80%, respectively. Data compiled from
Hopkinson et al. (2002).
Chapter 3
DOM sources and microbesin lakes and coastal waters
Labile
Semi-labileRecalcitrant
Labile
Semi-labileRecalcitrant
DOC DON DOP
Labile
Semi-labileRecalcitrant
Labile
Semi-labileRecalcitrant
Labile
Semi-labileRecalcitrant
DOC DON DOP
Labile
Semi-labileRecalcitrant
Labile
Semi-labileRecalcitrant
Labile
Semi-labileRecalcitrant
DOC DON DOP
Labile
Semi-labileRecalcitrant
DISSOLVED ORGANIC MATTER (DOM) IN AQUATIC ECOSYSTEMS: A STUDY OF EUROPEAN CATCHMENTS AND COASTAL WATERS 31
Chapter 3
DOM sources and microbesin lakes and coastal waters

rich than at the beginning of the ex-periment. DON and DOP were trans-formed to inorganic nutrients, while DOC was mineralised to CO2. Why should a manager of coastal waters and lakes care about the pro-duction, accumulation and degrada-tion of autochthonous DOM? The answer is because nutrients and the
related oxygen demand are “hid-den“ inside the organic pool and not necessarily “released“ at the site of production. DOM has a slow but variable reactivity leading to export from and import to different regions. The result can be transport of oxy-gen demand and nutrients from pro-ductive to less productive areas. Ne-
glecting this feature of DOM may lead to misinterpretation of causes and effects with respect to anoxia events and nutrient load (Chapter 4). In the following sections we focus on the processes producing autochtho-nous DOM in the water column, how it can accumulate and how it is subse-quently decomposed.
Box. 3.3Production of autochthonous DOC and DON in coastal watersLarge (11m3) mesocosms were used to control phytoplank-
ton by the addition of different concentrations of inor-
ganic nutrients leading to either nitrogen deficient or
replete growth. The three conditions were; Phase I: the
phytoplankton bloom was created; Phase II: a nitrogen de-
ficient community, and Phase III: a nitrogen replete and
blooming community.
The addition of nutrients in Phase I increased the pro-
duction of algae (here measured as particulate organic
carbon = POC), which was immediately followed by an in-
creased bacterial production (BP). After a few days DOC
started to accumulate at the same speed as bacterial pro-
duction. During the nutrient deficient Phase II, DOC con-
tinued to accumulate despite that the production of
particles almost ceased. Bacterial production also contin-
ued to increase. The addition of a surplus of nutrients in
Phase III resulted in a major diatom bloom where the pro-
duction of new DOC closely followed the POC production.
DON also accumulated, but lagged behind the increase
in POC and DOC. Production of new DON was detected
Day 12 and an enhanced accumulation was detected dur-
ing the last 5 days with high nitrate dosing (DON is scaled
on the secondary y-axis). Thus, the molar C:N ratio of the
newly produced and accumulating autochthonous DOM
varied from very high (∞) in the beginning of the experi-
ment to between 11 and 20 in phase II and III. The latter
ratio is comparable to the values measured in Horsens
Fjord and in oceans (Fig. 3.2). The accumulating DOM was
carbon rich, as expected.
From the chemical and biological measurements it is
possible to calculate the total production of DOC and the
sequestration into DOC immediately removed by bacteria
and the amount accumulating. Bacterial production did
not result in a higher biomass so grazers effectively re-
moved the produced bacteria.
During nutrient replete growth (Phase I and III) about
half the total carbon production was routed via DOC and
half of this was accumulating and could be measured
chemically. During nutrient deficiency in Phase II the pro-
duction was totally dominated by DOC (90%) and about
half accumulated.
BR = bacterial respiration.
32 DISSOLVED ORGANIC MATTER (DOM) IN AQUATIC ECOSYSTEMS: A STUDY OF EUROPEAN CATCHMENTS AND COASTAL WATERS

Data from Søndergaard et al. (2000).
Autochthonous DOM sourcesPhytoplankton photosynthesis is the ultimate DOM source in systems without large littoral zones and ex-tensive import of terrestrial DOM. However, autochthonous DOM pro-duction has multiple sources. Dur-ing each step in the complex plank-
ton food web production of DOM takes place (see Fig. 3.1). DOM is re-leased during photosynthesis, graz-ing, when organisms die, during lysis of cells, from viral attack, and when bacterial enzymes solubilise particles and aggregates. Extracellular release by phytoplank-ton. Phytoplankton cells inevitably
loose a variable but significant amount of newly produced organic matter directly to the environment. Phytoplankton exudation (loss) is a normal process and an important source of organic carbon readily available for bacteria. Most exu-dates are considered very labile. On average the loss is about 13 % of the
Photo 3.3.
Pontoon bridge with experimental
mesocosms positioned in the inner
Raunefjord at the former EU Large
Scale Facility at Espeland, near Ber-
gen in Norway (photo by Stiig
Markager).
Chapter 3
DOM sources and microbesin lakes and coastal waters
(µm
ol l
-1 d
-1)
0
10
20
30
40
50
Phase I Phase II Phase III
POCDOCBPBR
0
30
60
90
120
150
180
0 5 10 15 20 25Time (days)
Net
car
bo
n p
rod
uct
ion
(µm
ol l
-1)
0
5
10
15
20
25
30
Net D
ON
pro
du
ction
(µm
ol l -1)
BP
DOC
DON
POCPhase I
N+PPhase II
N+PPhase III 5N+P
DISSOLVED ORGANIC MATTER (DOM) IN AQUATIC ECOSYSTEMS: A STUDY OF EUROPEAN CATCHMENTS AND COASTAL WATERS 33
Chapter 3
DOM sources and microbesin lakes and coastal waters

total water column primary pro-duction. However, there are large variations both within and among systems (from 5 to 50%). Grazing. When particle-eating or-ganisms eat, the food particles are not utilised with 100% efficiency. Partly digested food and dissolved organic matter are defecated or ex-creted. Particles may also be broken up by the mouth parts and cell sap and blood released into the water. This process is called “sloppy feed-ing”. The DOM production during grazing is not linked to any specific size of organism and occurs at all levels of the food web. Grazing is considered one of the most impor-tant DOM producing processes and the DOM is of high nutritious value. Cell lysis and particle solubilisation. Planktonic organisms can die of “natural” causes other than grazing and predation. Physiological stress due to nutrient depletion and age can result in attack by saprophytic fungi and bacteria followed by death. Before and after death the or-ganism is leaching DOM into the surrounding water (cell lysis) and attracting motile bacteria sensing a good meal. Motile bacteria also colonise dead organic particles and aggregates and utilise the organic matter not pro-tected by cell walls and membranes. The utilisation of polymeric material is facilitated by the action of hydro-lytic ectoenzymes either excreted to the surroundings or connected to a cell. The hydrolytic activity produ-
ces dissolved organic substrates not only available for the bacteria at the degradation site but a surplus of low molecular DOM diffuses away from the site sustaining the growth of free-living bacteria. Not all autochthonous DOC, DON and DOP are immediately used in the microbial loop. Seasonal and episodic accumulations of DOM fractions occur in oceans, coastal seas and lakes revealing that a sig-nificant part of the produced DOM is utilized slowly and even enters the refractory DOM pool with turno-ver times of tens to hundred of years. With the current knowledge, it is not possible to make any general and global conclusions concerning the quantitative sequestration of pri-mary production into DOM. How-ever, measurements of bacterial pro-duction and respiration have unam-biguously proven that the DOM route is one highway for the process-ing of autochthonous organic pro-duction in plankton dominated aquatic ecosystems. A few empirical examples may enlighten current knowledge.
DOM production in a coastal plankton communityOne example to “illuminate” the complexity of DOM production and organic carbon sequestration in a coastal plankton community is taken from an experiment carried out at the former EU large-scale fa-cility in Bergen. The purpose of the
study was to find out how nutrient replete and deplete conditions might affect the production and accumu-lation of DOC and DON (Box 3.3). Although the Bergen experiment cannot be used for global generali-sations, it clearly shows that a high proportion of plankton production can be stored in the DOM pool and not immediately converted to its in-organic constituents in the micro-bial loop. Accumulation of DOC and DON shows that DOM pro-duced in natural waters persists long enough to be exported to other locations. Transport can for exam-ple be from productive surface lay-ers to bottom waters or from lakes and estuaries to coastal waters. An analysis of the ecological conse-quences of DOM production and export needs to include knowledge about its degradation. How much of the autochthonous DOM is bio-degradable, what is the time scale of degradation and how important is the photochemical reactivity? The latter subject is treated in Chapter 5.
Bacterial degradation and mineralisation of autochthonous DOMDegradation experiments with DOM from the continental shelf of the At-lantic Ocean showed a distinct dif-ference in the distribution of recalci-trant and biodegradable compounds among DOC, DON and DOP (Fig. 3.4). The DOC and DON pools were characterised by large recalcitrant background values, which may not
34 DISSOLVED ORGANIC MATTER (DOM) IN AQUATIC ECOSYSTEMS: A STUDY OF EUROPEAN CATCHMENTS AND COASTAL WATERS

Figure 3.5
The increase in DOC during an experimental freshwater plank-
ton bloom and its decrease during bacterial degradation and
the concentrations of inorganic N and P during degradation.
Net mineralisation of DON and DOP is identified as inorganic
concentrations higher than when the degradation experiment
was initiated.
Over 22 days the bloom of freshwater phytoplankton pro-
duced about 275 µmol l-1 new DOC. The DOM was isolated,
added bacteria and allowed to degrade over 230 days. Initi-
ally, the degradation of DOC was fast and after 25 days half
the DOC was removed. The degradation then slowed down
and almost came to a halt after 230 days. At that time about
12 % of the new DOC was not degraded. This “leftover” DOC
is characterised as recalcitrant. The term refractory is saved
for organic pools with turnover times of years.
DON and DOP were not measured, but measurements of
inorganic nitrogen and phosphate allowed the net minerali-
zation of DON and DOP to be followed. Initially, the growing
bacteria used inorganic N and P concomitant with the fast
degradation of DOC. With respect to inorganic N, a net pro-
duction occurred after about 50 days and in total 4 µmol l-1 N
was mineralised. A net production of inorganic N can only be
explained by mineralisation of DON. For P a net mineralisation
was found after about 75 days and inorganic P was slowly in-
creasing over the next 100 days. Data from Kragh & Sønder-
gaard (Aquatic Microbial Ecology, in press).
be representative for newly pro-duced DOM. However, the results convincingly demonstrate how a mixture of old and new autoch-thonous DOC behave with respect to biodegradation and how the dif-ferent degradability of DOC, DON and DOP controls the C:N:P ratio of the chemically measurable DOM pool. Biodegradation of newly pro-duced autochthonous DOC with-out interference from old and re-
fractory compounds can only be studied experimentally. Once more we used a plankton bloom to pro-duce new autochthonous DOM and then measured how bacteria de-graded DOC and mineralised DON and DOP (Fig. 3.5). Bacterial degradation of new DOC has two phases. About half of the de-gradable compounds were utilized within a few weeks, while the other half was more slowly degraded over a couple of months. Furthermore,
about 12% of the new DOC was recal-citrant or refractory. Organic nitrogen and phosphorus were mineralised; however, the “leftover” DOM was enriched with respect to nitrogen and phosphorus and is most probably of bacterial origin. We have now learned that a large part of freshly produced DOC and also autochthonous DON and DOP are mineralised rather slowly with turnover times of several weeks. This is a time scale longer than the
Chapter 3
DOM sources and microbesin lakes and coastal waters
Time (days)
Ino
rgan
ic n
itro
gen
(µ
mo
l l-1
)
Pho
sph
ate (µm
ol l -1)
0
3
6
9
12
15
0 50 100 150 200 2500
1
2
3
4
NO3 + NH4
PO4
Time (days)
DO
C (
µm
ol l
-1)
0
50
100
150
200
250
300Degradation
0 50 100 150 200 250
DISSOLVED ORGANIC MATTER (DOM) IN AQUATIC ECOSYSTEMS: A STUDY OF EUROPEAN CATCHMENTS AND COASTAL WATERS 35
Chapter 3
DOM sources and microbesin lakes and coastal waters

water renewal in many estuaries, coastal waters and shallow lakes. Thus, autochthonous DOM can be exported and its oxygen demand and nutrients “released” gradually over time and possible far from the site of its production.
ConclusionsThe load of inorganic nutrients to aquatic environments is still the major threat to the quality of most
surface waters at the European scale. However, our message is that we should not neglect how nutri-ents and oxygen demand are trans-ported in DOM and how microbes via DOM dominate the nutrient re-cycling in coastal areas. Microbial processing of DOM can explain a major proportion of the turnover of organic matter in many aquatic eco-systems. With the increasing regu-lation of the release of inorganic nu-
trients, the relative importance of the DOM export from land to sea will increase. It therefore becomes crucial to include DOM in coastal management strategies and to un-derstand the quantities exported from land and the environmental effects. Furthermore, it is important to increase our knowledge on how autochthonous DOM production in-fluences water quality.
36 DISSOLVED ORGANIC MATTER (DOM) IN AQUATIC ECOSYSTEMS: A STUDY OF EUROPEAN CATCHMENTS AND COASTAL WATERS

Dissolved organic matter (DOM). What is it and why study it?Effects of DOMin marine ecosystems
DOM affects marine ecosystems in at least three ways: DOM ab-
sorbs light thereby reducing the light level. This occurs primarily in the blue and ultraviolet (UV) part of the light spectrum and the consequence is that there is less light available for plant and algal growth. At the same time this absorption means that aquatic organisms, to some extent, are protected from damaging UV-radiation. Both nitrogen and phosphorus are bound to DOM and these nutrients are carried into the system as part of the DOM pool and may stimulate plant and algal growth, potentially contributing to eutrophication and associated problems. The nutrients
Stiig MarkagerColin StedmonPascal Conan
bound in DOM are not directly available for plant growth, but after degradation, either photochemically or by microbes, the nutrients are re-leased and enter the bioavailable nu-trient pool. Carbon is an important component in DOM and the carbon in DOM can serve as substrate for bacteria resulting in a demand for oxygen. DOM, light and marine systemsDOM colour varies from yellow to even dark brown, because light ab-sorption by DOM increases expo-nentially with decreasing wave-length. Very little red and yellow light is absorbed whereas absorp-
Chapter4
DISSOLVED ORGANIC MATTER (DOM) IN AQUATIC ECOSYSTEMS: A STUDY OF EUROPEAN CATCHMENTS AND COASTAL WATERS 37
Phot
o: H
elen
e M
unk
Søre
nsen
.

Box 4.1Light absorption by DOMThe absorption of light by organic compounds is depend-
ent on their chemical nature. The presence of different
chemical groups and different atomic bonds will lead to
the absorption of light (energy) in different regions of the
electromagnetic spectrum. As the DOM pool in natural wa-
ters consists of a complex mixture of compounds, its ab-
sorption spectrum represents the sum of the different
overlapping absorption peaks. CDOM absorption spectra
can be used to trace relative changes in the composition
and size of the DOM pool by modelling the characteristics
of the absorption curve in the UV and visible regions (slope
and intensity). DOM originating from differing sources dif-
fers in chemical composition, causing the light absorption
properties to vary which in turn can control the underwa-
ter light environment for plants and animals.
Photo 4.1
Water from a creak near Oulu, Finland.
The brown colour is due to DOM. The
DOC concentration was 1143 µmol l-1
and absorption at 320 nm was 109 m-1
(photo by Stiig Markager).
Wavelength (nm)
CD
OM
ab
sorp
tio
n (
m-1
)
300 400 500 6000
5
10
15
20
25
30
Stream draining agricultural landPeatland drainage (x10-1)Estuarine CDOMAutochthonous CDOMMountain river
Visible lightUltra violet light
38 DISSOLVED ORGANIC MATTER (DOM) IN AQUATIC ECOSYSTEMS: A STUDY OF EUROPEAN CATCHMENTS AND COASTAL WATERS

Figure 4.1
The effect of DOM concentration on the light attenuation
(Kd ) at different wavelengths in water from Horsens Fjord,
Jutland (DOC > 200 µmol l-1) and from Skagerrak (DOC < 200
µmol l-1). It is clear how the attenuation at low wavelengths
increases with increasing DOC concentrations whereas the
effect is small in the red part of the spectrum.
Figure 4.2
Variation in irradiance with depth in Horsens Fjord, Denmark.
Photo 4.2
At very high concentrations DOC makes
the water yellow-brown as seen in the
Bothnian Bay outside Kiiminginjoki River,
Oulu, Finland (photo by Stiig Markager).
Wavelength (nm)
Horsens Fjord, inner station
300 400 500 600 700
Irra
dia
nce
(µm
ol n
m-1
m-2
s-1
)
0
2
1
4
3
6
5
0.74 m
3.49 m
Surface
Wavelength (nm)
Kd spectra and DOC concentration(µmol l-1)
300 400 500 600 700
Dif
fuse
att
enu
atio
nco
effi
cien
t K
d (
m-1
)
0
2
1
4
3
6
5 ~450
~300
~180~100
Chapter 4
Effect of DOMin marine ecosystems
DISSOLVED ORGANIC MATTER (DOM) IN AQUATIC ECOSYSTEMS: A STUDY OF EUROPEAN CATCHMENTS AND COASTAL WATERS 39

tion is high in the blue and UV part of the spectrum (Box 4.1). The effect of DOM on the under-water light climate is a marked in-crease of light attenuation when DOM concentrations increase. In the UV part of the spectrum, below 400 nm, absorption is almost entirely due to DOM and therefore propor-tional to light absorption by DOM. Therefore it is closely linked to the actual concentration of DOM in the water (Fig. 4.1). In the blue part of the spectrum (between 400 and 500 nm) DOM absorption also domi-nates, although absorption by phy-toplankton can also be important in more eutrophic systems (Fig 4.1). Above 500 nm light attenuation is mainly due to scattering and ab-sorption by water it self. The rather high concentrations of DOM (> 200 µmol l-1) in many coastal waters mean that they appear yellow-greenish and not deep blue like oce-anic water where DOM concentra-tions are typically lower than 100 µmol l-1. When DOM concentra-tions exceed about 500 µmol l-1, the water will appear brown which is commonly the case in estuaries re-ceiving freshwater from wetlands or peat-lands. Figure 4.2 shows the light spec-trum with depth in an estuary on the East Coast of Jutland. At the surface, irradiance is approximately constant with wavelengths down to 480 nm, but rapidly declines in the blue and UV-region. In water, the red and particularly blue and UV
wavelengths are attenuated so the peak in irradiance at a depth of 3.49 m occurs at 582 nm. With depth and with increasing concentrations of DOM the peak irradiance will move toward higher wavelengths, and so will the peak irradiance for light es-caping the water, which is responsi-ble for the colour seen when look-ing at the water.
DOM and the distribu-tion of macrovegetationSeagrasses and macroalgae are im-portant components in coastal eco-systems. They contribute to the over-all primary production but they also act as structuring components form-ing habitats for other organisms such as crustaceans and fish. These larger plants and algae generally have lower growth rates than phyto-plankton and a slower turnover rate of the nutrients bound in their bio-mass. Hence, a large population of macrovegetation is generally consi-dered as positive for the environ-mental state of coastal ecosystem. The depth limit for occurrence of macrovegetation is set by the avail-ability of light. It has been shown that a seagrass such as Zostera marina requires about 13% of the surface ir-radiance and that large brown mac-roalgae (seaweeds) can grow at depths where only 1% of the surface light is left. Since DOM is an impor-tant component of the light attenua-tion, the DOM concentration will ef-fectively set the depth limit for macrovegetation. The effect of DOM
on the distribution is controlled by the concentration, the attenuation by particles and the bathymetry of the area. The largest effect will occur in systems where a large area of the bottom, otherwise suitable for mac-rovegetation, is at a depth similar to the depth for the light limit of the dominating plant type. If the banks are steep or light attenuation by sus-pended particles in the water is high due to re-suspension of sediment particles or due to high concentra-tions of phytoplankton in the water, the effects of DOM will be small.
DOM and primary production by phytoplanktonPhytoplankton is the other algal component in coastal ecosystems. Their production is regulated by complex interactions between phys-ical factors such as temperature, cir-culation in the water column, sur-face light, nutrients, grazing and light attenuation. Since DOM is im-portant for light attenuation, a high DOM concentration will have a neg-ative effect on primary production. In most coastal systems less than 20%, and often much less, of the sur-face irradiance is absorbed by phyto-plankton pigments (dominated by chlorophyll) for photosynthesis. The rest is absorbed by other compo-nents, mainly water it self and DOM, resulting in a competition for photons between the light absorbing compo-nents. It can be shown that the frac-tion of surface light absorbed by one
40 DISSOLVED ORGANIC MATTER (DOM) IN AQUATIC ECOSYSTEMS: A STUDY OF EUROPEAN CATCHMENTS AND COASTAL WATERS

component is the ratio between the absorption coefficient for that com-ponent and the total absorption coef-ficient for the water. The consequence is that if the light absorption by one component increases, the fraction of surface light absorbed by other com-ponents will decrease. Since the ab-sorption by water is basically con-stant, the concentration of DOM and detritus are the regulating factors that determine the fraction of surface light absorbed by phytoplankton between systems with equal chlorophyll con-centrations (Fig. 4.3). Since primary production of phytoplankton is ba-sed on light and nutrients, and DOM reduces the amount of light available for phytoplankton, it is proposed that at high DOM concentrations a higher nutrient supply is required to main-tain the same production per unit area compared to systems with a low DOM concentrations.
DOM as a carrier of nutrients to marine systemsNutrients are supplied to marine systems by atmospheric deposition and freshwater runoff, either di-rectly via rivers and streams or with groundwater. Only a small fraction of the nitrogen in atmospheric dep-osition is DON (generally less than 15%). From a practical and quanti-tative point of view, DOM in atmos-pheric deposition can be neglected. There is meager information avail-able about the importance of ground-water to the total nitrogen loading to marine systems, and even less about the forms of nitrogen in it. Nitrogen from ground water can be important in some estuaries where runoff from rivers is low. However, nitrogen in groundwater is most likely in the form of nitrate, and DON contribu-tions are probably low.
The fraction of the total nitrogen load contained within riverine DOM varies greatly between systems. In areas with intense agriculture activi-ties it is a minor, though not a negli-gible, fraction. In DOMAINE we found that DON contributed 12% of the annual load to the temperate es-tuary Horsens Fjord. In natural catch-ments, particularly if dominated by wetlands, peatland or forest, DON will be the dominating fraction. For the Baltic Sea, 60% of the total nitro-gen loading is due to DON. The values above are for the land/sea interface. Once the nitro-gen reaches the sea, there is a rapid transformation of inorganic nitrogen to organic fractions due to uptake by bacteria and phytoplankton. For Hor-sens Fjord it was found that al-though only 12% of the loading came as DON, 83% of the nitrogen leaving the estuary was as DON. Thus, estu-
Figure 4.3
Simulation of the fraction of surface
light absorbed by phytoplankton at
different chlorophyll and DOC concen-
trations in Danish marine waters. Left
axis is the fraction of surface light ab-
sorbed by phytoplankton. Right axis
is the percent change from a situation
with 2 µg Chl l-1 and DOC at100 µmol l-1.
Photosynthesis is fuelled by the amount
of light absorbed and primary produc-
tion is determined by carbon fixation and
the efficiency of converting fixed car-
bon to growth. The latter is mainly con-
trolled by the availability of nutrients. DOC concentration (µmol l-1)
Frac
tio
n a
bso
rbed Percen
t chan
ge
0 100 200 300 400 500 6000
0.1
0.2
0.3
0%
25%
50%
75%
100%
125%
150%
2 µg Chl l-1
1 µg Chl l-1
4 µg Chl l-1
Chapter 4
Effect of DOMin marine ecosystems
DISSOLVED ORGANIC MATTER (DOM) IN AQUATIC ECOSYSTEMS: A STUDY OF EUROPEAN CATCHMENTS AND COASTAL WATERS 41
Chapter 4
Effect of DOMin marine ecosystems

aries and lakes act as reactors where DIN is incorporated into DON (see Fig. 6.5). The form of nitrogen export is important because it influences the potential of nitrogen loading in eutrophication processes. Inorganic forms and some organic forms like urea and free amino acids are di-rectly available for phytoplankton and bacteria and therefore have the full potential to contribute to eu-trophication. In contrast, nitrogen bound in complex structures such as humic material, does not contribute to eutrophication until they are min-eralised to inorganic forms. The results from DOMAINE in-dicate that within 5 months a con-siderable fraction of terrestrial DOM exported to the sea is degraded whereas the remaining part is rela-tive recalcitrant. We estimate the de-gradable fraction to average 40% but to be variable depending on the land use which affects the quality of DOM. The freshly formed DOM in estuaries
is more reactive, but with time, parts of it are transformed to more recalci-trant DOM compounds where the nutrients are bound for longer time, probably many years. In summary, nutrients bound in DOM can represent a considerable fraction of the total loading, but is not likely to cause eutrophication in the zone near to the outfall. However, on a longer time scale, when residence time exceeds 1-2 months, there is probably little difference between the effects of the different form of nitro-gen with respect to eutrophication.
Oxygen demand from DOMDOM is organic material with an ox-ygen demand. When it is degraded the process will consume oxygen. Since hypoxia (reduced oxygen con-ditions) and anoxia (oxygen free conditions) are common problems in marine areas this could be of con-cern. However, these problems are
usually related to oxygen consum-ing processes in the deeper part of the water column or associated with the sediment. Since DOM is carried to estuaries in freshwater it will be layered into the upper part of the water column, where the close con-tact of surface waters with atmos-pheric oxygen and phytoplankton produced oxygen normally prevents hypoxia. One of the pathways for the degradation of DOM, photodeg-radation, only takes place in light and will therefore always occur to-gether with oxygen production from photosynthesis. The situation where oxygen consumption related to DOM is likely to be a problem is when there is intense flocculation of DOM in the transition zone between fresh-water and seawater (Chapter 5). Here a fraction of the DOM can set-tle out causing an increased oxygen demand in the underlying sediment leading to low oxygen levels.
42 DISSOLVED ORGANIC MATTER (DOM) IN AQUATIC ECOSYSTEMS: A STUDY OF EUROPEAN CATCHMENTS AND COASTAL WATERS

Dissolved organic matter (DOM). What is it and why study it?Fate of DOMin estuaries
Large amounts of organic and in-organic material are carried to
the oceans each year, and the river-ine transport of water and different compounds is an essential part of the global geochemical cycling of the elements. Most of the organic matter exported to coastal waters is re-moved in estuaries and near-shore environments, and thus compounds of terrestrial origin are hardly trace-able in the open ocean. The lack of terrestrial signals from organic compounds in the oceans cannot be exclusively explained by dilution in the vast amounts of ocean water. The annual runoff from land can cover the entire ocean with a layer of only 10 cm, and the ocean
Niels Henrik Borch Gaelle Deliat Mireille Pujo-PayColin Stedmon
is on average 3800 m deep. The con-tinuous supply of terrestrial matter, and the long survival time of the most inert and hard to degrade com-pounds should eventually lead to some accumulation in the open ocean. Considering the large amounts of organic matter transported through the rivers, this removal in the coastal waters must be very effective. Terres-trially derived organic matter there-fore seems to be highly modified or remineralised inside rivers, estuaries and coastal waters before a very small fraction is further exported to the open sea. Except for extraordi-nary cases with flooding, most or-ganic matter transported by rivers to
Chapter5
DISSOLVED ORGANIC MATTER (DOM) IN AQUATIC ECOSYSTEMS: A STUDY OF EUROPEAN CATCHMENTS AND COASTAL WATERS 43

Figure 5.1
Schematic diagram of the fate of organ-
ically bound carbon, nitrogen, and phos-
phorus in coastal waters. Red arrows
indicate loss processes where the com-
pound is transformed to gaseous matter
and red dashed arrows loss processes by
sedimentation. Green arrows indicate
processes where organically bound ni-
trogen or phosphorus is made available
for the phytoplankton by either photo-
chemical or microbial degradation.
44 DISSOLVED ORGANIC MATTER (DOM) IN AQUATIC ECOSYSTEMS: A STUDY OF EUROPEAN CATCHMENTS AND COASTAL WATERS
Respiration
Grazing Grazing
Export
DOC Photochemical Degradation
Microbial Degradation
Aggregation
Denitrification
Remineralisation
Remineralisation
Grazing Grazing
Export
DON Photochemical
Photochemical
Microbial Activity
Aggregation
Algae
Algae
Grazing Grazing
Export
DOP
Microbial Activity
Aggregation

the ocean is found in the dissolved phase as dissolved organic matter (DOM). In the context used here, DOM obviously includes organic carbon, but DOM also contains large albeit variable amounts of organi-cally bound nitrogen and phospho-rus (DON and DOP, respectively). In general there are three major path-ways for dissolved organic matter re-moval:
i) Physical particle formation (ag-gregation) and subsequent sedi-mentation
ii) Photochemical degradationiii) Microbial degradation.
In terms of the fate of DOM in coastal waters, it is important to distinguish between the fate of DOC and the cy-cles of DON and DOP. Figure 5.1 il-lustrates the major differences be-tween carbon cycling and organic N and P cycling. For carbon, the main pathways are removal through respi-
ration by organisms (thereby trans-forming organic carbon into its inor-ganic form CO2), burial in the sedi-ments in sinking organisms or fol-lowing aggregation, or export out to open waters. Since respiration and export probably are the two most im-portant loss terms, both the absolute amount and the rate by which DOC is degraded by microbes are impor-tant factors for studying the fate of DOC in coastal areas. Organically bound N is not lost from the system by respiration but can be incorporated in the microbial food webs, and subsequently be ei-ther remineralised to their inorganic compounds (primarily nitrate and ammonium), buried in the sediment in sinking particles or transferred to higher trophic levels through graz-ing food chains. For the nitrogen bur-ied in the sediment there is a loss term as nitrogen under anaerobic conditions (without the presence of oxygen) can be denitrified by bacte-
ria to N2, which is subsequently lost as a gas. In general it is assumed that 10 to 15% of all the nitrogen (i.e. both inorganic and organic forms) enter-ing an estuary is lost from the system by denitrification. For phosphorus the cycling is sim-pler. Organically bound phosphorus is predominantly remineralised by bacteria to its inorganic form PO4
3-, and then incorporated by phyto-plankton. Some of the phosphorus incorporated into phytoplankton cells sinks to the sediment, is rem-ineralised and eventually mixed into the water column again. There is no respiratory loss term for phospho-rus, and the fate of terrestrially de-rived phosphorus is either burial in the sediments, continuous recycling or export to the open waters.
AggregationThe term aggregation is used in this context to represent the transforma-tion of dissolved material to particles
Figure 5.2
Concentration of DOC in a salinity gra-
dient experiment with water from dif-
ferent Danish freshwater systems. A
humic lake (open squares), a stream in-
fluenced by municipal waste (open tri-
angles), wetland (filled squares), an
agricultural dominated stream (open
circles), forest stream (filled circles) and
an algal culture (open diamonds). Data
from Søndergaard et al. 2003.
DO
C (
µm
ol l
-1)
Salinity
0 5 10 15 20 25
200
0
400
600
800
1000
1200
1400
1600
Chapter 5
Fate of DOMin estuaries
DISSOLVED ORGANIC MATTER (DOM) IN AQUATIC ECOSYSTEMS: A STUDY OF EUROPEAN CATCHMENTS AND COASTAL WATERS 45

as a result of a change in the physico-chemical environment. Such changes can occur during the mixing of fresh-water with salt water during estua-rine mixing, where considerable changes in salinity and pH occur. Once in a particulate form, organic material can then be removed from the water through sedimentation (sinking) or by filter feeding organ-isms. There are two general mecha-nisms by which DOM can aggre-gate: Adsorption or flocculation. Adsorption is the attraction of DOM onto the surface of inorganic particles (e.g. clay particles or sand grains) resulting in a film of organic material enveloping the particle. Flocculation is the process where large dissolved organic molecules combine to eventually form parti-culate material. Both processes occur during estuarine mixing and result in an area of turbid water (the tur-bidity maximum) where flocculates form due to changes in salinity and pH, and where bottom sediments are re-suspended into the water as a result of turbulence. The importance of flocculation and subsequent removal of organic matter as a result of salinity changes is controversial. It must be noted here that almost all studies have exclu-sively dealt with carbon removal, and ignored organically bound nitro-gen and phosphorus. Earlier studies showed that some DOC (generally below 10%) is removed when salinity increases above 5 ppt, but since then
only few studies have investigated this under controlled conditions. In the DOMAINE project, we have tried to quantify the amount of DOC that can be removed from water from different land-use areas. We have used different sources for the water recognising the fact that different land-use patterns have an influence on the chemical characteristics of the DOM in the water. Only with water with a very high content of humic matter did we measure a slight effect of increased salinity (Fig. 5.2). In gen-eral, for the Danish waters studied, it appears that aggregation is only a mi-nor removal process for DOM, and can be more or less ignored in terms of mass transport of organic matter to the sea.
Photodegradation of DOMThe structural changes of the com-pounds in the DOM pool, initiated by photochemical reactions, lead to alterations in its biological, chemical and physical properties and there-fore have the potential to influence its role in aquatic ecosystems. The degradation of DOM by photoche-mical processes is thought to control the removal of a considerable pro-portion of DOC in surface waters, substantially decreasing its lifetime. Not only do these processes repre-sent a removal for organic carbon in natural waters but they also can have an extensive influence on aqua-tic ecosystems resulting in:
i) A loss in the light absorbing pro- perties and hence increased ex-
posure of the water column to ul-traviolet (UV) and visible light.
ii) Remineralisation of organic car-bon (e.g. CO and CO2 production)
iii) Oxygen consumptioniv) Production of labile organic com-
pounds and compounds rich in nitrogen and phosphorus.
v) Production of biologically resist-ant DOM
vi) Destruction of organic ligand-binding capacity, causing the re-lease of trace metals, micronutri-ents and even toxins (e.g. Cu, Fe, Mn).
Absorption of light (energy) by a molecule results in a transition into an excited state. Immediately after this transition, relaxation to the ground state then occurs through loss of the absorbed energy via inter-nal conversion (heat and molecular motion) and fluorescence or phos-phorescence. During a primary pho-tochemical reaction, a chemical al-teration occurs whilst the molecule is in the excited state. The products of the reaction can be a new stable molecule(s) and/or new reactive species, which then go on to initiate secondary reactions. Whereas pri-mary reactions only concern the or-ganic compounds that can absorb light (e.g. coloured CDOM), second-ary reactions can affect all com-pounds present (i.e. the whole DOM pool), depending on the lifetimes, concentrations and reactivity of the
46 DISSOLVED ORGANIC MATTER (DOM) IN AQUATIC ECOSYSTEMS: A STUDY OF EUROPEAN CATCHMENTS AND COASTAL WATERS

reactive species. Primary photoreac-tions can result in molecular cleav-age and/or rearrangement of the molecules. As a result of the complex nature of DOM in aquatic environments, there are many possible secondary reactions, however, the reactions of organic and inorganic free radicals produced as a consequence of pri-mary reactions, are major degrada-tion pathways for DOM. Radicals are highly reactive and influence both
the chemistry and biology of sunlit waters. For example, light absorption by CDOM is the principal source of a variety of reactive oxygen species (ROS) in surface waters, which play a pivotal role in the degradation of DOM. Inorganic chromophores (e.g. nitrate and nitrite) are also a signifi-cant source of ROS, if they are present in high enough concentrations. The underwater light environ-ment can be divided into three wave-bands; UV-B (280-315 nm), UV-A
(315-400 nm) and visible light (400-800 nm). The energy associated with a photon of light decreases with in-creasing wavelength (Fig. 5.3A). For example, a photon at 300nm has 33% more energy than a photon at 400 nm. UV-B light is rapidly attenuated in natural waters due to CDOM ab-sorption. Figure 5.3B shows the depth at which there is 1% of surface irra-diance left for different sampling sites in the DOMAINE project. UV-A light and visible blue light (400 nm) pene-
Figure 5.3
A: Variation in the energy of a photon
at different wavelengths. Also plotted
are the bond dissociation energies
(i.e. the energy needed to break/cleave
a chemical bond in a molecule) for a
selection of organic bonds.
B: The depth of 1% of surface light
for UV-B, UV-A and visible light in five
localities from the DOMAINE project.Location
Mesocosm River Stream Estuary Peatland
Dep
th o
f 1%
surf
ace
inte
nsi
ty (
m)
0
2
4
6
8
10
UVB (300nm) UVA (350nm) Visible (400nm)
B
Ener
gy
(Kj m
ol-1
)
Wavelength (nm)300 400 500 600 700
100
150
200
250
300
350
400
450Energy of photonsBond dissociation energy
C-HN-H
C-OC-C
C-NC-P
C-S
UVB UVA Visible
A
Chapter 5
Fate of DOMin estuaries
DISSOLVED ORGANIC MATTER (DOM) IN AQUATIC ECOSYSTEMS: A STUDY OF EUROPEAN CATCHMENTS AND COASTAL WATERS 47

trates much further into the water column than UV-B and therefore has the potential to influence a greater volume of water. Therefore, al-though the energy per photon in the UV-B is high, it appears that UV-A and visible wavelengths of light are the ones that probably dominate photodegradation processes. In ad-dition, it is clear that photons in the UV-A and the blue light regions have enough energy to initiate vari-ous photochemical reactions in sun-lit waters (Fig. 5.3A). So when inves-tigating light induced degradation of DOM in natural waters it is im-portant to consider the trade-off be-tween photon energy, in situ light in-tensity and CDOM light-absorption. Photodegradation reactions both compete with bacteria to degrade a fraction of DOM and also aid bacte-rial degradation via the cleavage of non-bioavailable components of DOM. Bacteria use DOM for growth and as an energy source (see below). As they can only exploit energy from bond cleavages taking place inside their cell, DOM must first be taken up i.e. enter through their cell mem-branes. The fragmentation of high molecular weight DOM via extracel-lular enzymes (enzymes attached to the outside of the cell membrane) and photodegradation processes therefore control the availability of DOM to the microbial community. Research over the last decade has shown that photodegradation of ter-restrially derived DOM (alloch-thonous) has a positive effect on its
bioavailability, reducing its average molecular weight and producing a suite of labile organic compounds, which are readily available to the microbial food web. On the contrary, results have shown that photodegra-dation of DOM produced within the system (autochthonous) can render the pool more resistant to microbial degradation, suggesting that the two processes compete for a degradable fraction.
Microbial degradationAggregation and photodegradation of DOM only occurs at specific inter-faces where the right conditions ex-ist, for example in surface waters or at the turbidity maximum. A more ubiquitous removal process for DOM is degradation by microbes. Bacteria are the main consumers of dissolved compounds in all aquatic environments, and bacterial proc-esses occur under all circumstances. Since it is not light dependent, bac-terial DOM degradation is not re-stricted to surface waters and there-fore takes place in the entire water column. In most natural waters the concentration of bacteria range from 1 to 10 million cells per millilitre. The ecological role of bacteria is to con-sume dissolved organic compounds, transforming them into bacterial bio-mass, and, during that process, also respire some of the carbon to CO2. Unicellular protozoa, flagellates and ciliates, graze upon the bacteria, and are in turn prey for larger grazers. In this way a portion of the DOM
which is transformed into bacterial biomass, is passed up the food chain (Chapter 3). Bacterial processes have time frames of minutes to hours. They can respond quickly to inputs of food (DOM), and have very effi-cient uptake systems for readily available substances. Under the right conditions they can double their bio-mass within less than a day and therefore have a large potential to degrade organic carbon (DOM). However, in nearly all aquatic sys-tems there is a substantial amount of DOM, suggesting that bacterial uptake of DOM is limited in some way. Three main factors influence the capacity of bacteria for DOM degradation: i) The DOM is not degradable by
bacterial enzymes. ii) The DOM is originally degrada-
ble but is transformed into non-degradable substances.
iii) The bacteria are limited by other factors than the food available.
DOM degradation is directly linked to the intrinsic nature of DOM. In aquatic environments, DOM utilis-able by bacteria is principally present as large polymeric molecules. To be used by bacteria, an organic molecule must first get into the bacterial cell. Specific enzymes, called permeases, located in the bacterial cell wall, are responsible for this process. But only substrates of low molecular weight (small physical size) can be taken up. Prior to bacterial uptake, macromol-
48 DISSOLVED ORGANIC MATTER (DOM) IN AQUATIC ECOSYSTEMS: A STUDY OF EUROPEAN CATCHMENTS AND COASTAL WATERS

ecules therefore have to be broken down into smaller molecules by ec-toenzymes present on the outside of the bacteria cells or released by the bacteria. Ectoenzymes are highly specific, and each enzyme can only break certain specific chemical bonds. For example, proteases can only break the peptide-bond between two ad-jacent amino acids in a protein, and even this process is limited to com-mon amino acids. No single bacte-ria species can produce all the en-zymes to break down all types of organic matter. However, aquatic bacterial communities are generally made up of many different popula-tions and species, each with differ-ent capabilities for breaking down DOM. Bacterial communities can cope with most organics. Dissolved organic matter consists of a myriad of different compounds all produced by biological processes. Even though most biological pro-duction is well characterised i.e. we know what and how much can be produced by plants; current chemi-cal analyses can only identify a small part of DOM at the molecular level as belonging to the three major classes of organic compounds: Pro-teins, carbohydrates, and lipids. Or-ganic material originating from dif-ferent sources differ in chemical com-position and therefore in degrad-ability (Table 5.1). The most degra-dable material is sewage and algal derived organic matter, which pre-sumably is of most recent biological
Table 5.1
Degradability of dissolved organic car-
bon from different locations sampled
during the DOMAINE project. The
relative amount of carbon that could
be degraded by microbes in 5 months
is shown.
origin. It is noteworthy that water that has passed a modern sewage treatment plan still is rather degra-dable, reflecting the fact that sewage treatment is primarily focused on re-moval of inorganic nutrients. In some treatment plants organic material is even added to the water to improve nutrient removal. The least degra-dable land-derived material is found in drainage from forests, and reflects the low degradability of the struc-tural elements in trees (lignin and its derivatives). It is also interesting that the degradability of DOM in rivers and marine waters is rather uniform despite the differences in geographi-cal regimes and terrestrial systems they represent. It is our hypothesis that the explanation is that most (all?) DOM that we measure chemi-cally has been through a process of
microbial and photochemical deg-radation and transformation. In addition to the chemical nature of DOM other factors can limit the capability of bacterial communities to consume DOM in natural envi-ronments. The two major causes are inorganic nutrient limitation, and control of bacterial biomass by either grazing and/or viral infections (Chapter 3). Aquatic bacteria have to satisfy their need for nutrients (primarily nitrogen and phosphorus) in paral-lel to carbon acquisition. This can be achieved either directly by uptake of inorganic compounds (principally nitrate, ammonium and phosphate) or indirectly by assimilation of the organically bound nitrogen (e.g. protein and amino acids) and phos-phorus (basically in DNA). Bacteria
Source Degradability (%)
Sewage 40
Algal produced DOM 52
Forest, Denmark 6
Stream, Denmark 18
River, Finland 20
River, France 9
Marine, Denmark 3–15
Marine, Finland 4–17
Marine, France 13–17
Chapter 5
Fate of DOMin estuaries
DISSOLVED ORGANIC MATTER (DOM) IN AQUATIC ECOSYSTEMS: A STUDY OF EUROPEAN CATCHMENTS AND COASTAL WATERS 49

compete directly with phytoplank-ton for the available nutrients. Therefore bacteria and phytoplank-ton can use all the inorganic nutri-ents available, and this has been pro-posed to explain the seasonal DOM accumulation occurring in almost all aquatic systems. Much of the inor-ganic nutrients are incorporated into algal cells, which sink to the sedi-ments. Nutrients are temporarily re-moved from the water phase. How-ever, the nutrients are returned to the water column during subse-quent mixing of the water. It should be stressed that water exported from agricultural dominated catchments, is rarely deficient in nutrients com-pared to carbon. Predation by grazers, mostly uni-cellular ciliates and flagellates (see
Fig. 3.1), contributes to the control of the bacterial biomass and to de-crease the total activity of a bacterial community. Recent results have re-ported a selective grazing on active bacterial cells and consequently the possible regulation of bacterial pro-ductivity within natural communi-ties. The increase in bacterial mortal-ity by virus attack might also modify the capability of bacterial communi-ties to use DOM. But grazing and vi-ral lysis only act on short time scales, and it has been shown that when there is heavy grazing on bacteria, the remaining cells increase their ac-tivity so the overall result is that the degradation of DOM is as fast as without grazing pressure. The degradation of DOM is a process acting continually during its
transport from the terrestrial envi-ronment to coastal waters. The frac-tion of DOM left upon arrival to the coastal zone is then a function of both the transport time through the river system and the removal rate by bacteria and by abiotic processes. Most biologically labile compounds are removed from the water before it is exported. They simply do not exist long enough in the environment to be of practical concern, but because they are also produced during this transport, they constitute a measur-able but minor part (less than 5%) of total DOM. It is the semi-labile and refractory components that will be exported to coastal waters, and these will have the maximum effects on the microbial dynamics and nutrient recycling in these waters.
50 DISSOLVED ORGANIC MATTER (DOM) IN AQUATIC ECOSYSTEMS: A STUDY OF EUROPEAN CATCHMENTS AND COASTAL WATERS

Dissolved organic matter (DOM). What is it and why study it?Analysis of DOM at the catchment scale: Two European case studies
Terrestrial production of DOM is at large scales regulated by fun-
damental climatic parameters with linkage to site specific attributes like elevation, topography, soil type and land use (forest, wetlands, lakes, ag-riculture etc). Large scale terrestrial DOM sources and the regulation of DOM export are discussed in Chap-ter 2, where it is shown that the four catchments selected for study in the DOMAINE project are different and have unique export patterns with re-spect to quantities of DOC, DON and DOP and their relative distribu-tion (see Table 2.3). These values are the integrated outcome of specific DOM loss patterns from many sub-catchments, each with their own ef-
Anker Laubel Dylan EvansTorben Vang David Bowers Colin StedmonNiels Henrik BorchMorten Søndergaard
fect on the whole. In order to under-stand the role of each sub-catchment it is necessary to have a detailed knowledge of land use and dis-charge and a sampling programme that can reveal how specific at-tributes, e.g. agriculture, forest cover and lake area may influence the DOM export and its composition. Such knowledge is a prerequisite for a more comprehensive understand-ing of the factors and processes that regulate DOM export and, perhaps, more importantly, to provide an in-formed basis to ask and answer “what if?” questions in future man-agement scenarios (Chapter 7). In 2001 and 2002 DOMAINE es-tablished seasonal sampling and
6Chapter
DISSOLVED ORGANIC MATTER (DOM) IN AQUATIC ECOSYSTEMS: A STUDY OF EUROPEAN CATCHMENTS AND COASTAL WATERS 51

Figure 6.1
The Danish DOMAINE catchment Hor-
sens Fjord showing the position of 14
stream and estuarine sampling stations
(•), two major lakes and the Fjord.
measuring programmes to provide empirical data for DOM and inor-ganic nutrients for the selected catchments in Denmark, Wales and France. In this chapter we show the distribution of DOM export in a Danish catchment dominated by agriculture. Furthermore, we use the data from Wales to illustrate an analytical strategy for the handling of a complex dataset based on clus-ter analysis.
Horsens Fjord, Denmark
The catchmentThe Horsens Fjord study area is sit-uated on the east coast of Jutland, Denmark (Fig. 6.1). The catchment is about 500 km2 and dominated by intensive farming. The climatic and land use information can be found in Tables 2.1 and 2.2. The landscape is mainly gently undulating mo-raine with elevations of less than
13
14
27
67
8
9
16
12
4 3
10
2
1
11
Skagerrak
No
rth
Sea Kattegat
Bygholm Åsystem
Hanstad Åsystem
Kokkedal Å
Sampling stations
Lake
Lake
Søvind Å
1 km
52 DISSOLVED ORGANIC MATTER (DOM) IN AQUATIC ECOSYSTEMS: A STUDY OF EUROPEAN CATCHMENTS AND COASTAL WATERS

170 m. The soil composition ranges from sand to sandy clay loam, with peat soils constituting less than 3% of the total catchment area. Horsens Fjord is a micro tidal es-tuary with a residence time from 12 to 18 days and with end-member sa-linity about 29 ppt. With respect to nutrient load the estuary is highly influenced by terrestrial runoff, es-
Figure 6.2
Distribution of land use for sub-catch-
ment categories
Figure 6.3
Seasonal averages of DOC, DON and DOP in the
sub-catchment categories.
pecially the inner estuary. DOM and inorganic nutrients were measured with a frequency of 14 days at 10 stream stations and 4 estuarine sta-tions (Fig. 6.1). The 10 sampled sub-catchments were 385 km2, equivalent to about 77% of the total area. They could be placed in three major land use cate-gories:
1. Agricultural: >75% agriculture; mean human
population density of 51 per km2
2. Mixed rural: < 75% agriculture; mean human
population density of 14 per km2.3. Urban: 100% urban area; mean human
population density of 1800 per km2.
When compared with the agricul-tural sub-catchments, the mixed ru-ral sub-catchments contain more for-est, lakes and wetlands and are
thereby closer to a natural reference condition (Fig. 6.2). There is only one urban sub-catchment in the study area. A large sewage treatment plant is situated in the town Horsens (the only major town in the catchment). It is upstream of sampling Station 16, and very close to the outlet to the estuary.
Land use and DOMThe data made it possible to esti-mate the seasonal averages of DOC, DON and DOP concentrations ex-ported from each type of sub-catchment (Fig. 6.3). Combined with measured discharge in all streams the total load to the estuary can therefore be calculated. The average DOC concentration for agricultural sub-catchments (530 µmol l-1) was lower than for the mixed rural and urban sub-catch-ments (730 µmol l-1). One plausible explanation for the lower concen-
Agri-culture
Mixedrural
Urban0
0.5
1.0
1.5
2.0
DO
P(µ
mo
l l-l)
Agri-culture
Mixedrural
Urban0
300
600
900
DO
C(µ
mo
l l-l)
Agri-culture
Mixedrural
Urban0
60
120
180
DO
N(µ
mo
l l-l)
UrbanOther nature
LakesWetland
ForestAgriculture
Perc
ent
0%
25%
50%
75%
100%
Agri-culture(N=6)
Mixedrural(N=3)
Urban(N=1)
DISSOLVED ORGANIC MATTER (DOM) IN AQUATIC ECOSYSTEMS: A STUDY OF EUROPEAN CATCHMENTS AND COASTAL WATERS 53
Chapter 6
Analysis of DOM at the catchment scale: Two European case studies
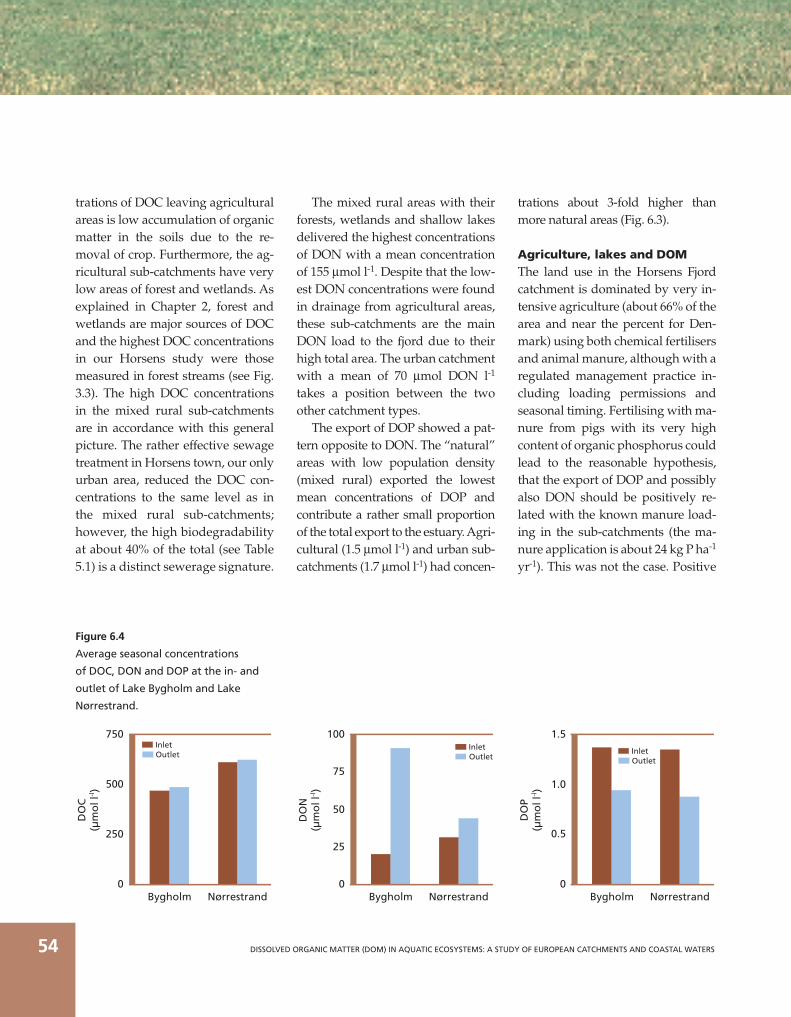
trations of DOC leaving agricultural areas is low accumulation of organic matter in the soils due to the re-moval of crop. Furthermore, the ag-ricultural sub-catchments have very low areas of forest and wetlands. As explained in Chapter 2, forest and wetlands are major sources of DOC and the highest DOC concentrations in our Horsens study were those measured in forest streams (see Fig. 3.3). The high DOC concentrations in the mixed rural sub-catchments are in accordance with this general picture. The rather effective sewage treatment in Horsens town, our only urban area, reduced the DOC con-centrations to the same level as in the mixed rural sub-catchments; however, the high biodegradability at about 40% of the total (see Table 5.1) is a distinct sewerage signature.
The mixed rural areas with their forests, wetlands and shallow lakes delivered the highest concentrations of DON with a mean concentration of 155 µmol l-1. Despite that the low-est DON concentrations were found in drainage from agricultural areas, these sub-catchments are the main DON load to the fjord due to their high total area. The urban catchment with a mean of 70 µmol DON l-1 takes a position between the two other catchment types. The export of DOP showed a pat-tern opposite to DON. The “natural” areas with low population density (mixed rural) exported the lowest mean concentrations of DOP and contribute a rather small proportion of the total export to the estuary. Agri-cultural (1.5 µmol l-1) and urban sub-catchments (1.7 µmol l-1) had concen-
trations about 3-fold higher than more natural areas (Fig. 6.3).
Agriculture, lakes and DOMThe land use in the Horsens Fjord catchment is dominated by very in-tensive agriculture (about 66% of the area and near the percent for Den-mark) using both chemical fertilisers and animal manure, although with a regulated management practice in-cluding loading permissions and seasonal timing. Fertilising with ma-nure from pigs with its very high content of organic phosphorus could lead to the reasonable hypothesis, that the export of DOP and possibly also DON should be positively re-lated with the known manure load-ing in the sub-catchments (the ma-nure application is about 24 kg P ha-1 yr-1). This was not the case. Positive
Figure 6.4
Average seasonal concentrations
of DOC, DON and DOP at the in- and
outlet of Lake Bygholm and Lake
Nørrestrand.
DO
N(µ
mo
l l-l)
Bygholm Nørrestrand0
25
50
75
100InletOutlet
DO
P(µ
mo
l l-l)
Bygholm Nørrestrand0
0.5
1.0
1.5
InletOutlet
DO
C(µ
mo
l l-l)
0
250
500
750
Bygholm Nørrestrand
InletOutlet
54 DISSOLVED ORGANIC MATTER (DOM) IN AQUATIC ECOSYSTEMS: A STUDY OF EUROPEAN CATCHMENTS AND COASTAL WATERS

statistical relationships were neither found for DOP, DON nor DOC ver-sus manure load. With respect to the export of nitrate and phosphate the relationships were positive, strong and significant, so manure loading is creating an export of inorganic nutri-ents. Mineralisation, uptake by crop and soil retention are active and keep organic leaching -not low- but unrelated statistically to the manure load. Still, relatively high DOP con-centrations are leaving the agricul-tural areas (Fig. 6.3). In our detailed study of this catchment we also found that shal-low lakes did affect the export of DOM at the catchment scale, despite low residence time (5-6 days). The two lakes are positioned in the lower reaches of the two most important streams (Fig. 6.1). The lakes Bygholm
and Nørrestrand are 0.52 and 1.2 km2, respectively and draining 310 km2, about 60% of the entire catch-ment. Both lakes are highly eutro-phic, as expected. The lakes are neutral with respect to DOC, which did not change in concentration between in- and outlet (Fig. 6.4). However, both the concen-trations of DON and DOP were af-fected by the lake passage. The DON concentrations increased at the ex-pense of nitrate and the DOP levels decreased. However, at the catch-ment scale the allochthonous DOM sources are more important than within lake processes. The role of the two lakes may very well be benefi-cial for the environmental condition of the estuary, as the load of inor-ganic N and P and DOP to the estu-ary is reduced by passage through
the lakes. The loss of phosphorus must be due to sedimentation. The effect of the transformation of nitrate to DON is more difficult to interpret. Ultimately, all the nitrogen aside losses due to denitrification will be-come available for primary produc-ers, but most of the DON bound ni-trogen may not be released at a time scale shorter than the residence time of the estuary (about 2 week) thus affecting systems outside the estu-ary. The production of DON in the lakes may well be an export of the problem to somewhere else.
DOM and nutrients from land to seaWe can now make a summary for the behaviour of DOM and inor-ganic nutrients at the largest scale of our Danish study, the entire
Figure 6.5
Annual average concentrations of DOC,
total dissolved nitrogen (DON and nitra-
te) and total dissolved phosphorus (DOP
and phosphate) from all streams and in
a horizontal transect through the Fjord.
Chapter 6
Analysis of DOM at the catchment scale: Two European case studies
DIPDOP
0
0.5
1.0
1.5
2.0
Streams InnerEstuary
OuterEstuary
Dis
solv
ed p
ho
sph
oru
s(µ
mo
l l-l)
DO
C(µ
mo
l l-l)
0
100
200
300
400
500
600
Streams InnerEstuary
OuterEstuary
DINDON
0
100
200
300
400
Dis
solv
ed n
itro
gen
(µm
ol l
-l)
Streams InnerEstuary
OuterEstuary
DISSOLVED ORGANIC MATTER (DOM) IN AQUATIC ECOSYSTEMS: A STUDY OF EUROPEAN CATCHMENTS AND COASTAL WATERS 55

Horsens Fjord catchment and in the estuary. The overall picture shows a dilu-tion of all variables moving from land to sea; not an unexpected result (Fig. 6.5). The most dynamic element is ni-trate. From a very high concentration in the steams (about 310 µmol l-1) it decreases due to plant uptake, deni-trification and dilution in the estuary. Likewise, phosphate decreases, but not so dramatically. The obvious thing to notice is that in the estuary most of the dissolved nutrients are bound in DOM, which now becomes a prime player in the ecosystem. The ecological effects of DOM are treated in Chapter 4. For the entire catchment we can now calculate the export to be: DOC: 200 mmol m-2 year-1; DON: 18 mmol m-2 year-1 and DOP: 0.4 mmol m-2 year-1. However, nitrate ex-port of 150 mmol m-2 year-1 is clearly the major nutrient problem for the es-tuary and phosphate with 0.3 mmol m-2 year-1 is only of slightly less im-portance than DOP. An evaluation of export is not complete without considering nutri-ents bound in particles. For nitrogen the particulate fraction was low at about 6% of the total, however, for phosphorus the freshwater sources carried a high particulate load amounting to about 21% of the total. Water leaving the estuary had a high relative contribution from particu-late phosphorus (54%), while PON was almost undetectable. In summary: With respect to the dissolved organic export our catch-
ment scale study revealed the agri-cultural sub-catchments to export higher DOP concentrations than mixed rural areas with a higher con-tribution of forest, wetlands and lakes. With respect to DOC and DON the higher concentrations were ex-ported from the mixed rural areas. However, it is to be noted that the ab-solute DOM concentrations exported from land to the estuary are high when viewed at the European scale (Chapter 2, Table 2.3), but most prob-ably representative for catchments dominated by intensive agriculture. The DOM loading to this estuary is important for phosphorus more than for nitrogen. The inorganic ni-trogen and phosphorus species and the particulate phosphorus export from this catchment should be kept in managerial focus, but the DOM loading is not unimportant. The function of the estuary is to trans-form a nutrient load with high con-centrations of inorganic species to DOM species leaving the estuary.
The River Conwy, North Wales, U.K.
The CatchmentThe Conwy is the third largest river to discharge into the Irish Sea from the North Wales coast. It drains a catchment of some 670 km2, the main drainage channel covering a distance of approximately 56 km (Fig. 6.6). The Conwy rises in the Snowdonia national park at around 460m above
sea level. The upper Conwy flows across upland peat moors through to grazing land, falling some 450m to emerge as the lower Conwy, which flows through extensive flood plains to meet the effective tidal limit at the town of Llanrwst. As with many North Wales rivers the Conwy can be described as “flashy”; there is near immediate runoff, with only a small proportion of rainfall being retained by the predominantly thin peaty soils of the upper catchment.
Sampling StrategyWhen confronted by a disparate ar-ray of ecosystems and habitats, both aquatic and terrestrial, choosing a representative sample is not a trivial matter. It is necessary to be sure that carefully collected and analysed samples both do represent the sys-tem that one wishes to describe, and that they do so objectively. The use of proxy measurements for quantification of the total DOM pool are well established, in particu-lar, the linear relationship between DOC and coloured DOM (CDOM) is well explored (Chapter 1). As DOC is known to be the major contributor to the total dissolved organic matter pool, at least in terms of absolute amounts, its relationship to CDOM is considered a good indicator of the whole DOM pool. Such relation-ships permit the rapid and inexpen-sive assessment of DOM variability on catchment, or other large scales. Initially, 45 locations within the catchment, along the whole of the
56 DISSOLVED ORGANIC MATTER (DOM) IN AQUATIC ECOSYSTEMS: A STUDY OF EUROPEAN CATCHMENTS AND COASTAL WATERS

Figure 6.6
The River Conwy Catchment, North
Wales, UK. The letters in red circles
show sample sites. The brown circles
represent human settlements with
size proportional to inhabitant density.
Insert ‘1’ is a scaled equivalent of the
whole. Insert ‘2’ is a schematic descrip-
tion of the sampled locations, specifi-
cally it demonstrates the relative
distance from the lake at the head
of the catchment, and the position
of the confluence of the rivers Conwy
and Eidda.
Chapter 6
Analysis of DOM at the catchment scale: Two European case studies
5 km M
AB
CD
EF
GH
IJKL
M
L
K
H
A
E
FG
B
C
D
I
J
5 km
Conwy
Llandudno Junction
Glan Conwy
Dolgarrog
Trefriw
Betws-y-Coed
Llanrwst
Pentrefoelas
Eglwysbach
Ysbytu Ifan
Capel Curig
Settlements
Sampling sites
Dolwyddelan
Penmachno
Llyn Conwy
DISSOLVED ORGANIC MATTER (DOM) IN AQUATIC ECOSYSTEMS: A STUDY OF EUROPEAN CATCHMENTS AND COASTAL WATERS 57

river system were repeatedly sam-pled for CDOM concentration using standard methods. If any of these lo-cations were frequently found not to harbour statistically significantly dif-ferent CDOM concentrations to their nearest neighbours, they were sim-ply discarded. In effect, these loca-tions were not providing any “new” information, and were therefore like-ly to reduce the overall efficiency of the sampling programme. In this way, 13 sites were eventually chosen to represent the whole catchment. By surveying these 13 locations approximately every 21 days over the
course of two years, a detailed pic-ture was constructed of any inputs to, and exports from, the Conwy system. Amongst 16 analysed water quality determinants were chromophoric dissolved organic matter (CDOM), dissolved organic carbon (DOC), dis-solved organic nitrogen (DON), and dissolved organic phosphorus (DOP).
Sub-CatchmentsOnce the 13 sites had been selected, sub-catchment boundaries for each were calculated using the Arc View Geographical Information Systems (GIS) software package (version 3.1).
Figure 6.7
The River Conwy Catchment and
Sub-catchments, North Wales, UK.
A – Llyn Conwy
B – Road Bridge
C – Flood Plain
D – Ysbytu Ifan
E – The River Eidda
F – Pont Padog (Conwy)
G – Pont Padog (Mixed)
H – Fairy Glen
I – Betws y Coed
J – Llanrwst
K – Dolgarrog
L – Tal y Cafn
M – Pier
By definition, the location from which a sample is taken must be the lowest point in the sub-catchment area, which that sample represents. Rain drop tracing software, written for the Arc View GIS package, ena-bles the calculation of sub-catch-ment extent based upon this princi-ple (Fig. 6.7). Essentially it calculates the area from which a drop of rain could theoretically make its way to the sample point, while taking into account any topographical features which may serve to impede flow. This procedure, by extension calcu-lates the area drained by the water
10 0 10 20
Km
M
L
J
K
H
I
I
F & GE
DC
A
B
58 DISSOLVED ORGANIC MATTER (DOM) IN AQUATIC ECOSYSTEMS: A STUDY OF EUROPEAN CATCHMENTS AND COASTAL WATERS

body flowing past the point from which the sample was taken. In all but one case, the 13 selected sites come from nested sub-catch-ments, that is, they wholly incorpo-rate one another as one moves downstream along the main drain-age channel of the river. The excep-tion being samples representing the Afon Eidda (E, from Figs. 6.6 and 6.7). This tributary drains a topo-graphically isolated and very small (8.75km2) sub-catchment. Table 6.1 describes the major features of the Conwy catchment and the 12 sub-catchments considered by this study.
Table 6.1
The River Conwy Catchment and Sub-
Catchments, North Wales, UK. Sampling
location, altitude relative to sea level
(m), drainage channel length (km), and
human population density (n total).
Land UseThe Conwy catchment is rural with sheep farming as the main agricul-tural land use both to the east and west of the main drainage channel. The lowland flood plain, down-stream of Betws y Coed (I), does have some arable farming, which requires an enhanced level of drainage. To the west of Betws y Coed there is a large afforested area, Gwydyr Forest, maintained and managed in-dependently. The forest hides many abandoned mines, which them-selves leach waters laden with met-als into several tributaries of the
main river. At the seaward end of the catchment, the Conwy estuary con-tains several extensive salt marshes important to migratory wading birds. One of the most pervasive influen-ces on water quality is known to be the concert effects of land use (and hence land type) and climate. Given this, the 13 chosen sites fall into six broad categories (Table 6.2).
Understandingthe distribution of DOMWhen the information from the sur-veys described above was analysed, it quickly became apparent that the
Name ID Sample Alt (m) Str Len (km) Pop n
Llyn Conwy A 523 1.69 0
Road Bridge B 432 3.69 0
Flood Plain C 390 4.01 2
Ysbytu Ifan D 217 14.97 270
The Eidda E 169 6.57 280
Pont Padog (Conwy) F 170 20.33 2835
Pont Padog (Mixed) G 169 20.45 2835
Fairy Glen H 20 26.76 3000
Betws y Coed I 18 28.83 3455
Llanrwst J 5 36.88 7460
Dolgarrog K 2 40.41 13610
Tal y Cafn L 1 44.53 13800
Pier M 0 55.88 28002
Chapter 6
Analysis of DOM at the catchment scale: Two European case studies
DISSOLVED ORGANIC MATTER (DOM) IN AQUATIC ECOSYSTEMS: A STUDY OF EUROPEAN CATCHMENTS AND COASTAL WATERS 59

Table 6.2
The River Conwy catchment and sub-
catchments, North Wales, UK. Broad
descriptive categories of the predomi-
nant aquatic and terrestrial variables
affecting DOM dynamics.
Figure 6.8
The River Conwy, North Wales, UK. The
relationship between DOC and distance
from the source (km). The lines represent
the negative linear relationships between
the two variables.
Sample site Predominant influence on water quality
L, M Estuarine
J, K Marine influenced
F, G, H, I Agricultural
The River Eidda,E a distinct- subcatchment
B, C, D Upland peat
A The source lake, Llyn Conwy
data described a dilution phenom-enon where the majority of the DOM, particularly DOC, is exported from a single area, the high catch-ment peat moors, via the river, to the coast (Fig. 6.8). In order to understand the distri-bution, both through space, and time (spatial and temporal), of DOM at catchment or other large scales it is often instructive to use a tech-nique that enables the incorporation of all the measured parameters con-currently. These methods allow the best possible descriptive resolution from collected data. The output from such multivariate techniques, how-ever, must be intuitive. Meaning that it should be both easy to generally understand, and if it is to be used for the purposes of longer time scale monitoring, the output must can-didly reflect change. Such a tech-nique was developed by implement-ing a slight, but very instructive, alteration to a firmly established
method called cluster analysis (Box 6.1). From the outcome of the cluster analysis and the developed dendro-gram (Fig. 6.9) we can now see that the six final clusters represent ac-curately, the whole of the river and its catchment, in a single, easily com-prehensible, two-dimensional form. Sites M and L are given their own grouping, principally due to the ex-tent to which they are influenced by the sea. Sites K and J are still influ-enced by the marine environment, but to a far lesser extent, and as such have formed their own cluster. Sites I, H, G and F represent areas where the land use adjacent to the river is mostly agricultural, and have thus been classified together. Site E de-notes the River Eidda, a tributary of the Conwy, which carries much lower concentrations of DOM. Its own catchment is geographically isolated from those upstream of it along the main drainage channel
DO
C (
µm
ol l
-1)
R2 = 0.903
R2 = 0.904
0
100
200
300
400
500
600
700
800
0 10 20 30 40 50 60
Distance from source (km)
Year OneYear Two
60 DISSOLVED ORGANIC MATTER (DOM) IN AQUATIC ECOSYSTEMS: A STUDY OF EUROPEAN CATCHMENTS AND COASTAL WATERS

and as such has been awarded its own cluster. Site A is the source lake, and again represents a biogeochemi-cally distinct system. Finally the up-land peat system, represented by sites D, C, and B is grouped sepa-rately. It is noteworthy that this is the grouping, which is most distinct from any other. This is an example of how apparently complex data sets involving several multi-parameter relationships can be reduced to sim-ple diagrammatic representations. Here, for demonstrative purposes we have highlighted only the spatial distribution of DOM, however the method is also easily applicable to seasonal studies. Within systems where the rela-tionship between export and deliv-
ery to the coast by rivers is not clear, or changes seasonally, the devel-oped method may be employed. Now the data could, for example, be split into seasons, or rainfall could become one of the parameters used in the model. Thus, simply by ob-serving the change in the shape of the dendrogram, subtle multivariate changes in the biogeochemical char-acteristics of the system can easily be tracked. This method is also useful for relating any changes to differing land use practices, and by extension, in linking cause and effect. As the technique involves only the collec-tion and subsequent analysis of wa-ter samples, it is entirely objective. In fact, by the very nature of the analy-sis it cannot be influenced by the an-
Figure 6.9
The River Conwy catchment and sub-
catchments, North Wales, UK. The den-
drogram from the Cluster analysis,
produced by normalised correlation
matrices, represents the six broad land
use categories, and therefore the six
major controls on DOM concentration
in all of the sub-catchments.
alyst as ultimately all that the model does is to group together collections of numbers, which change at similar rates relative to one another. Perhaps the biggest advantage that the tech-nique has over purely statistical methods is that it does not require expert knowledge. It only requires, in the first instance at least, the abil-ity to recognise changes in the shape of the dendrogram produced. In the event of such change further work can then be initiated in a directed and efficient manner. In summary: Relatively simple methods can be very valuable in the analysis of large scale distributions of DOM. They contribute positively both to the efficiency of sample col-lection, and subsequent statistical
25.93
50.62
75.31
100.00M L K J I H G F E A D C B
% S
imila
rity
Sample locations
Chapter 6
Analysis of DOM at the catchment scale: Two European case studies
DISSOLVED ORGANIC MATTER (DOM) IN AQUATIC ECOSYSTEMS: A STUDY OF EUROPEAN CATCHMENTS AND COASTAL WATERS 61

treatment of the gathered data. It must be remembered, however, that although the cluster analysis enable the bigger picture to always remain
in focus, more conventional statisti-cal methods, such as multiple linear regression should not be discounted. Rather the technique described here
Box 6.1Cluster analysis of DOM distributionCluster analysis is based on the premise that the ratios of
the concentration of chemical elements of interest in two
or more samples are better indicators of the common ori-
gin of the samples than the concentrations themselves.
The method involves a hierarchical process that begins
with the assumption that all observations are separate,
and therefore each forms its own cluster.
In the first step, the two locations that are most similar
in terms of the relative concentrations of their dissolved
constituents are joined. In the next step, either a third lo-
cation joins the first two or two other locations join to-
gether to form a different cluster. This process will
continue until eventually all clusters are joined into one.
This is of no value and it is therefore necessary to either,
specify the final number of clusters, or, to specify the level
of similarity at which clusters are considered comparable
enough to be joined. There are no mathematical rules,
which guide this process. By extension is it therefore nec-
essary to have some knowledge of the system under con-
sideration. It must be stated here that this method has no
basis in statistical proof, but rather guides the analysis in
an unbiased way, such that locations deserving of further
data mining can be easily identified, as can broad yet spe-
cific patterns within the data. There are six obvious and
distinct land use types throughout the catchment (Table
6.2), and therefore the task of specifying the final number
of clusters was simple, namely six.
Covariate and linear relationships between parameters
are often found within carefully collected biogeochemical
data sets, a good example being the linear relationship
between CDOM and DOC (Chapter 1). When using multi-
variate statistical methods, which concurrently analyse the
differences between many parameters, these relation-
ships, but more particularly their effect on the analysis, is
often ignored. While analysts take great care to avoid in-
troducing bias due to, for example, differences in scale,
very few consider the skewing effects of correlations
within the data set. This can be removed by the use of
correlation matrices, which effectively negate the effect
of this bias on the analysis; the clusters from the cluster
analysis then become truly meaningful (Fig. 6.9). In order
to generate the dendrogram shown in Fig. 6.9, the graph-
ical representation of the clustering process, concentra-
tion values relating to the following determinants were
used; CDOM, DOC, DON, DOP, ammonium, nitrite, nitrate,
phosphate, silicate, and Chlorophyll. All of which are im-
portant, dynamic and commonly assessed water quality
parameters.
should serve to efficiently direct the analysis of large data sets such as those collected by workers in the field of water quality management.
62 DISSOLVED ORGANIC MATTER (DOM) IN AQUATIC ECOSYSTEMS: A STUDY OF EUROPEAN CATCHMENTS AND COASTAL WATERS

Dissolved organic matter (DOM). What is it and why study it?DOM and land use management
Excessive loads of nutrients whether inorganic or bound in
DOM have the potential to harm aquatic ecosystems (Chapter 1). In-organic nutrients are readily avail-able for plant and algal uptake while nutrients in DOM have to be mineral-ised by microbes and/or light before they become a major water quality problem. Thus, it is necessary to in-clude a time scale for mineralisation before evaluating the effects of nutri-ents in DOM. Water quality manage-ment of coastal waters and lakes strives to control nutrients from point sources (e.g. sewerage) and the ter-restrial export via diffuse sources. Control at point sources is rela-tively easy, although not without
Anker LaubelTorben VangMorten Søndergaard Pirkko KortelainenAnders Windelin
problems for nitrogen removal. The control of terrestrial export from dif-fuse sources has the potential for conflict between intensive agricul-tural production and water quality. The EU Water Framework Directive has the wellbeing of ecosystems as its main quality criterion. Therefore it is necessary from now on, not only to focus on export quantities, but also to analyse how nutrients (both inorganic and organic) and other substances such as CDOM and oxy-gen demand in DOC may affect coastal water quality. Land use man-agement and management practise at large geographical scales are the only options for such an enterprise.The need for future environmental
7Chapter
DISSOLVED ORGANIC MATTER (DOM) IN AQUATIC ECOSYSTEMS: A STUDY OF EUROPEAN CATCHMENTS AND COASTAL WATERS 63

management to operate at catch-ment scales and to include all (most) environmental impacts is one reason why we in the DOMAINE project have combined studies of DOM and inorganic nutrient export from land to sea (Chapters 2 and 6) with stud-ies on the fate (Chapters 3 and 5) and effects (Chapter 4) of DOM. By de-tailed studies at catchment scales and knowledge of land use and DOM ex-port we collected empirical data for use in predicting how changes in land use and management practices would affect DOM export and ulti-mately the ecological quality of re-ceiving coastal waters. As explained in Chapter 4 both allochthonous and autochthonous DOM have multiple effects in aqua-tic ecosystems. Nutrients, oxygen demand and light attenuation are among the most important, how-ever, management regulations only with an eye on DOM is too narrow a view. Changes in land use have im-
Box 7.1Link between management, freshwater input, and environmental conditions of water bodies
plications for all nutrient species whether inorganic or organic. It might be beneficial for one system to have a change from an inorganic to an organic load, but this is not neces-sarily the case for every system. Here we shall use the data presented in the previous chapters and specifi-cally in Chapter 6 to explore how a change in land use can affect the DOM and nutrient export from a catchment dominated by intensive agriculture.
Management, water quality and ecological conditionsWhen introducing new land use or management practise it is impor-tant that all effects are considered. This seems an obvious statement, however, we still do not under-stand all the consequences on fresh-water quality from a number of land use and management condi-tions. The focus is often restricted to
one substance (e.g. nitrate) that is assumed to impose the main nega-tive environmental influence. In some cases, the implementation of new management changes may in fact turn out to have unwanted side effects. One lesson came from the introduction of “winter green fields” in Denmark. Since the late 1980s it has been allowed and encouraged to start a new crop in autumn. The purpose was to decrease the leach-ing of nitrate during winter and early spring. However, it soon be-came evident that soil erosion and phosphorus export increased and posed a threat to phosphorus lim-ited lakes and coastal waters. Thus, it is important to understand and quantify the overall impact before implementing major land use and management changes.
Land use, DOM and inorganic nutrientsA detailed study of the sub-
Land use and management practise influence the quan-
tity, quality, and timing of water supplied to surface wa-
ter bodies. Freshwater input criteria can include concen-
trations and loads of nitrate, phosphate, suspended par-
ticulate matter, DOM etc. The fundamental issue is to de-
fine the wanted ecological quality (The Water Framework
Directive) and then work backwards to establish a land use
and management practice leading to the goal.
64 DISSOLVED ORGANIC MATTER (DOM) IN AQUATIC ECOSYSTEMS: A STUDY OF EUROPEAN CATCHMENTS AND COASTAL WATERS
Land useand
management practice
Freshwater input:quality, quantity
and timing
Environmentalcondition
of a water body

catchments supplying freshwater to Horsens Fjord showed that differ-ent combinations of land use re-sulted in different export concentra-tions of DOC and nutrients as well as in the relative distribution be-tween dissolved organic and dis-solved inorganic nutrients (Chapter 6). In summary: mixed rural catch-ments with forests and wetlands deliver high concentrations of DOC and DON but low DOP and inor-ganic nutrients, while intensive ag-ricultural activity delivers very high nitrate and DOP and somewhat lower concentrations of DOC and DON. It was also shown that lakes
could reduce the delivery of phos-phorus from land to sea. This picture is for an agricultural landscape and is a somewhat biased view, at the larger European scale, due to the fact that none of the investigated sub-catchments had agricultural land cover lower than 40% of the area. In the DOMAINE project we have extended the analysis of land use and export to 34 catchments and sub-catchments positioned in a north-south and a west-east gradient cov-ering North Wales, most of southern Finland, a mountainous catchment in southern France and a low land agricultural area in Denmark. The
relationship between dominant cat-egories of land use and basic natural variables and the concentrations of DOC and dissolved nutrients can be analysed by a Rank Correlation Ana-lysis (Box 7.2). The quantitative data are presented in Chapter 2. The relationships presented in Box 7.2 must be seen as a generalised picture and only used as a first step to understand how land use affects the DOM export in different areas. A detailed and proper evaluation has to include very specific catchment features to be valid. One example is the function of lakes where resi-dence time and exposure time of
Box 7.2Relationships between land use and the concentrations of dissolved organic and inorganic species in 34 European catchments
In the Rank correlation analysis the
strength of the relationships is given by a
value from 0 to 1 and a positive or nega-
tive relationship is indicated by sign. Sin-
gle + or – values indicate a weak
relationship.
Both land use and basic natural condi-
tions affected DOM and inorganic nutrient
concentrations. Wetlands, lakes and for-
ests had the most important positive rela-
tionship with DOC and negative for DOP,
while agriculture and human population
density showed high positive relationships
for most nutrient species.
Soil type, runoff, precipitation events
and temperature (annual averages) are
descriptors of basic conditions resulting in
both positive and negative relationships.
Independent variable Dissolved species DOC DON DOP DIN DIP
Land use
Agricultural areas -0.37 + +0.67 +0.46 +0.37
Managed forest +0.51 + -0.52 +
Wetland +0.67 + -0.37 –
Lakes +0.66 -0.41 – -0.44
Dry natural areas with no forest -0.37 -0.69 – -0.91
Urban areas + +0.38 +0.71 +0.54
Population density +0.40 +0.61 +0.84 +0.52
Basic natural conditions
Sandy soils +0.65 +0.79
Runoff -0.78 – –
Temperature -0.77 +0.46 +
Days with intense rain +0.57 +0.53 +0.56
Chapter 7
DOM and land usemanagement
DISSOLVED ORGANIC MATTER (DOM) IN AQUATIC ECOSYSTEMS: A STUDY OF EUROPEAN CATCHMENTS AND COASTAL WATERS 65

DOM to light are important specific features. In Finland many lakes are actually sinks for DOC and humic matter and not producers. Agriculture is a major land use ac-tivity in large parts of Europe and the overall negative ecological effects of chemical fertilisers and high loads of manure with eutrophication of coastal systems as a consequence are well known. Regulation of nitrogen ferti-lisation is a common tool to reduce DIN export to surface waters. The concern regarding phosphorus ferti-lisation has grown stronger over the last one or two decades, and it has been documented that not only an in-crease in particulate but also in dis-solved phosphorus is often associ-ated with agricultural activity. This is also obvious from the empirical data presented in Figure 6.3. The data from DOMAINE present an opportu-nity to create scenarios of changing land use and to predict the quantita-tive effects on the quality of freshwa-ter export. As high nutrient export from arable land is a major problem for coastal waters at the European scale, we shall here present an example on how a change in land use can work.
Changing land use: The Horsens Fjord catchment The Horsens Fjord catchment is an agricultural landscape with low coverage of forest, wetlands and lakes and can be used as a model catchment for Denmark and other European areas with intensive agri-culture. Current trends in manage-
ment of land use – partly regulated by EU- are to reduce the area of ar-able land and replace with new for-ests, wetlands and occasionally re-construction of lakes and meande-ring streams. One realistic scenario would be to change the agricultural landscape toward a mixed rural landscape by reducing the area of ar-able land and urban settlements by 25 and 3% respectively, and replace with 25% forest, 2% wetland and 1% lake area. From the results presented in Chapter 6 (see Fig. 6.2) the quanti-tative outcome of such a change can be evaluated (Box 7.3). It is pertinent to address the ques-tion: What happens now to the export of DOM and inorganic nutrients and is the change only beneficial for the water quality in the estuary? The two most important features in this land use change scenario are the reduction in phosphorus export and a 25% decrease in the export of nitrate, but now exported as DON. With respect to phosphorus the re-duction would be further enhanced by a reduction in the particulate phosphorus load mainly caused by high erosion when farmers in the au-tumn are preparing for “winter green fields“. This reduction is not included in the scenario. The terrestrial load of nitrate is the main reason for the eutrophic status of the Horsens estuary (Vejle County environmental assessments). Thus, a reduction in nitrate by 25% could lead to a considerable improve-ment in the status of the estuarine
ecosystem due to a reduction in phy-toplankton biomass, less sedimen-tation, better light climate and a lower probability of oxygen deple-tion in the bottom waters. The export of total nitrogen would not decline, but nitrate would be exchanged with relatively recalcitrant (even refrac-tory) terrestrial DON. Microbial and photochemical degradation proces-ses would gradually release nitro-gen to the ecosystem during its pas-sage through the estuary and coastal waters and ultimately become avail-able for biological production. How-ever, the released nitrogen would be continuously diluted during coastal mixing and more impor-tantly, with an increasing fraction lost by denitrification over time. The scenario for land use change predicts, with respect to nitrogen and phosphorus, an improvement in estuarine ecosystem quality. Changing agricultural areas with forest and wetlands will increase the export of DOC and therefore col-oured compounds (CDOM) absorb-ing light in the water column (Chap-ters 1 and 4). An increase in terres-trial DOC of about 15% would cause a 20% increase in CDOM. Two con-sequences are apparent:
1) DOC consumes oxygen during degradation and thus would re-sult in an increased oxygen de-mand in the estuary.
2) DOC absorbs light and would reduce the depth at which pri-mary production can take place.
66 DISSOLVED ORGANIC MATTER (DOM) IN AQUATIC ECOSYSTEMS: A STUDY OF EUROPEAN CATCHMENTS AND COASTAL WATERS

Box 7.3
Changing agriculture to forest and wetlands in the Horsens Fjord catchment
These are both negative environ-mental effects. For Horsens Fjord we evaluate the positive effects to be more important than the negative, but cannot at this stage provide quantitative arguments. The oxygen consumption may be delayed and exported out of the estuary. Further-more, in a stratified estuary the in-put of freshwater floats at the sur-face and the effect of an imported terrestrial oxygen demand is prob-ably minor (Chapter 4). Photochemi-cal bleaching of CDOM over time may counteract the negative effects of light absorption. It can be argued that the role of DOM exported from the terrestrial
environment in this estuary is rather limited due to the massive impact of intensive agricultural activity in the catchment. However, we want to emphasize that land use and mana-gerial practice have major impact on the export of both DOM and inor-ganic nutrients and that a receiving estuary filters away most of the inor-ganic nutrients and export these as DOM. This is just one more argu-ment that it is necessary to gain an even better understanding of the dy-namics and characteristics of DOM moving from land to sea.
ConclusionsDOM is an integrated part of the ex-
port of nutrients to coastal waters. Land use has a major impact on both the amount and the relative distribu-tion of the nutrient species. A change from intensive agriculture toward more forest and wetlands generally changes the export from inorganic to organic species and reduces the phosphorus export. At the same time more DOC and coloured DOM are exported. Such a change will be beneficial for coastal waters with catchments dominated by intensive agriculture. In the future we need a better handle on the fate of DOM to reach an ability to quantify effects at appropriate time scales.
The increase in forested areas by 25%, wetlands by 2%
and lakes by 1% at the expense of agriculture (25%) and
minor urban settlements (3%) and without a change in
the present regulation of farming practise will have a
measurable impact on the export of all dissolved sub-
stances. Dissolved organic carbon (DOC) increased, while
the total quantity of nitrogen did not change. However,
the distribution between DON and DIN changed dramati-
cally. About 25% of the very high nitrate export was re-
placed by DON. The land use change resulted in a major
reduction in dissolved phosphorus and a minor change in
the relative distribution between DIP and DOP. Sedimen-
tation of phosphorus in the lakes makes a significant
(20%) contribution to the effect on phosphorus export.
DIP exportDOP export
0
0.2
0.4
0.6
0.8
Agriculture Mixed rural
P ex
po
rt(m
mo
l m-2
yr-
1 )
DIN exportDON export
0
40
80
120
160
200
Agriculture Mixed rural
N e
xpo
rt(m
mo
l m-2
yr-
1 )
0
50
100
150
200
250
300
350
Agriculture Mixed rural
DO
C e
xpo
rt(m
mo
l m-2
yr-
1 )
DISSOLVED ORGANIC MATTER (DOM) IN AQUATIC ECOSYSTEMS: A STUDY OF EUROPEAN CATCHMENTS AND COASTAL WATERS 67
Chapter 7
DOM and land usemanagement
Figure showing export of DOC, DON and DIN, and DOP and DIP.
Chapter 7
DOM and land usemanagement

Box 7.4Converting mol to weight
In limnology there is a tradition to use concentrations in weight units; e.g.
phosphate is presented in µg or mg P l-1. However, organisms respond to
the concentrations of molecules and not to their weight. Thus, we have used
molar units. It is simple to convert from one to the other using the atomic
weight of the element. The area unit for land use and export analyses are
often presented in hectares (1 ha = 10,000 m2) and not in m2 as used in
aquatic ecology. The conversions are shown in the following table. Dissolved
organic carbon, nitrogen and phosphorus = DOC/DON/DOP. Dissolved inorganic
nitrogen and phosphorus = DIN/DIP
68 DISSOLVED ORGANIC MATTER (DOM) IN AQUATIC ECOSYSTEMS: A STUDY OF EUROPEAN CATCHMENTS AND COASTAL WATERS
Concentration units Export units mmol l-1 mg l-1 mol m-2 yr-1 kg ha-1 yr-1
(element) (element)
DOC 1 = 0.012 1 = 120
DON/DIN 1 = 0.014 1 = 140
DOP/DIP 1 = 0.031 1 = 310
Photo 7.1
Agricultural fields
– the Horsens catchment
(photo by Stiig Markager).

Books & websitesAnonymous. 2004. Multivariate Sta-
tistics – An Introduction. http://
trochim.human.cornell.edu/tutorial/
flynn/multivar.htm
European Environment Agency. 2003.
Europe’s’ Environment: the third
assessment. Environmental assess-
ment report No 10. Luxembourg:
Office for Official Publications of the
European Communities.
Findlay, S.E.G and Sinsabaugh, R.L (eds.)
2003. Aquatic ecosystems: Interactiv-
ity of dissolved organic matter. Aca-
demic Press, New York.
Hansell, D.A. and Carlson, C. A. (eds.)
2003. Biogeochemistry of marine
dissolved organic matter. Academic
Press, Amsterdam.
Kristensen, P. and Hansen, H.O. (eds.)
1994. European Rivers and Lakes: As-
sessment of their environmental
state. EEA Environmental Mono-
graphs 1, European Environment
Agency, Copenhagen.
Kirk, J.T.O. 1994. Light and photosyn-
thesis in aquatic ecosystems. Cam-
bridge University Press.
Pelkonen, P., Pitkänen, A., Schmidt, P.
Oesten, G., Piussi, P. and Rojas, E.
(eds.) 1999. Forestry in Changing So-
cieties in Europe, Part II. Silva Net-
work.
Perdue, E.M. and Gjessing, E.T. (eds.)
1990. Organic acids in aquatic ecosys-
tems. John Wiley & Sons, Chichester
Riemann, B. and Søndergaard M. (eds.)
1986. Carbon dynamics in eutrophic,
temperate lakes. Elsevier, Amsterdam.
Stanners, D. and Bourdeau, P. (eds.)
1995. Europe’s Environment – the
Dobris Assessment. European Envi-
ronment Agency, Copenhagen.
Thurman, E.M. 1985. Organic geochem-
istry of natural waters. Martinus Nij-
hoff, Dordrecht.
Wetzel, R.G. 2001. Limnology – Lake
and River Ecosystems. 3rd edition,
Academic Press.
Williams, P.J leB., Thomas, D.N. and
Reynolds, C.S. (eds.). 2002. Phyto-
plankton Productivity. Blackwell
Publishing, Oxford.
Articles & book chaptersAlber, M. 2002. A conceptual model of
estuarine freshwater inflow man-
agement. Estuaries, 25, 1246-1261.
Azam F., Fenchel T., Field, J.G., Gray,
J.S., Meyer-Reil, L.A. and Thingstad,
F. 1983. The ecological role of water-
column microbes in the sea. Marine
Ecology Progress Series, 10, 257-263.
Blough, N.V. and Zepp, R.G. 1995. Reac-
tive Oxygen Species in Natural Wa-
ters. In Active Oxygen Chemistry (C.S.
Foote, J.S. Pacentine, A. Greenberg
and J.F. Liebman Eds.), pp. 280-333.
Chapman and Hall, New York.
Bowers, D.G., Evans, D.W., Thomas,
D.N., Ellis, K. and Williams, P. J leB.
2004. Interpreting the colour of an
estuary. Estuarine and Coastal Shelf
Science, 59, 13-20.
Chantigny, M. H. 2003. Dissolved and
water-extractable organic matter in
soils: a review on the influence of
land use and management practices.
Geoderma 113, 357-380.
Cole, J.J., Findlay S. and Pace M.C. 1988.
Bacterial production in freshwater
and saltwater ecosystems: a cross-
system overview. Marine Ecology
Progress Series 43: 1-10.
Hope, D., Billett, M.F. and Cresser, M.S.
1994. A review of the export of
carbon in river water – fluxes and
processes. Environmental Pollution
84, 301-324.
Hopkinson, Jr C.S., Vallino, J.J. and
Nolin, A. 2002. Decomposition of
dissolved organic matter from the
continental margin. Deep-Sea
Research II, 49, 4461-4478.
Kalbitz, K., Solinger, S., Park, J.-H.,
Michalzik, B. and Matzner, E. 2000.
Controls on the dynamics of dis-
solved organic matter in soils: a re-
view. Soil Science, 165, 277-304.
Kortelainen, P., Mattsson, T., Rantakari,
M and Räike A. 2004. Organic carbon
concentrations in Finnish lakes and
rivers. In Eloranta P (ed.). Finnish
inland and coastal waters. Palmenia
Publishing, University of Helsinki,
Saarijärvi, Finland (In press).
Kortelainen, P. and Saukkonen, S. 1998.
Leaching of nutrients, organic carbon
and iron from Finnish forestry land.
Water, Air, and Soil Pollution, 105,
239-250.
Kragh, T. & Søndergaard, M. 2004.
Production and bioavailability of au-
tochthonous DOC: Effects of meso-
zooplankton. Aquatic Microbial Eco-
logy (In press).
Markager, S. and Sand-Jensen, K. 1992.
Light requirements and depth zona-
tion of marine macroalgae. Marine
Ecology Progress Series, 88, 83-92.
Mattsson, T., Finer, L., Kortelainen, P.
and Sallantaus, T. 2003. Brook water
quality and background leaching
DISSOLVED ORGANIC MATTER (DOM) IN AQUATIC ECOSYSTEMS: A STUDY OF EUROPEAN CATCHMENTS AND COASTAL WATERS 69
Suggested further reading

from unmanaged forested catch-
ments in Finland. Water, Air, and Soil
Pollution, 147, 275-297.
Mulholland, P.J. 2003. Large-scale pat-
terns in dissolved organic carbon
concentration, flux, and sources. In:
Aquatic ecosystems: interactivity of
dissolved organic matter (Eds.
Findlay, S.E.G. and Sinsabaugh, R.L.),
p. 139-159. Academic Press.
Pomeroy, L.R. 1974. The ocean’s food
web, a changing paradigm. Bio-
science, 24, 499-504.
Prepas, E.E., Planas, D.,Gibson, J.J.,Vitt,
D.H., Prowse, T.D, Dinsmore, W.P.,
Halsey, L.A., McEachern, P.M., Paquet,
S., Scrimgeour, G.J., Tonn, W.M.,
Paszkowski, C.A., and Wolfstein, K.
2001. Landscape variables influenc-
ing nutrients and phytoplankton
communities in Boreal Plain lakes of
northern Alberta: a comparison of
wetland- and upland-dominated
catchments. Canadian Journal of
Fisheries and Aquatic Science, 58,
1286-1299.
Sholkovitz, E.R. 1976. Flocculation of
dissolved organic and inorganic mat-
ter during the mixing of river water
and seawater. Geochimica Cosmo-
chimica Acta, 40, 831-845.
Stedmon, C. A. and Markager, S. 2001.
The optics of chromophoric dissol-
ved organic matter (CDOM) in the
Greenland Sea: An algorithm for dif-
ferentiation between marine and
terrestrially derived organic matter.
Limnol. Oceanogr. 46(8): 2087-2093.
Stedmon, C. A. and Markager, S. 2003.
Behaviour of the optical properties
of Coloured Dissolved Organic Mat-
ter (CDOM) under conservative mix-
ing. Estuarine Coastal and Shelf
Science 57: 973-979.
Stedmon, C. A. and Markager, S. 2004.
Resolving compositional changes in
dissolved organic matter (DOM) in a
temperate estuary and its catchment,
using spectrofluorometry and PARA-
FAC analysis. (Submitted).
Stedmon, C. A. and Markager, S. 2004.
Tracing the production and degrada-
tion of autochthonous fractions of
dissolved organic matter (DOM) us-
ing optical analysis. (Submitted).
Stedmon, C.A. Markager, S. and Bro, R.
2003. Tracing dissolved organic mat-
ter in aquatic environments using a
new approach to fluorescence spec-
troscopy. Marine Chemistry, 82,
239-254.
Stedmon, C. A., Markager, S., Borch, N.
H., Laubel, A., Søndergaard, M.,
Vang, T. and Windelin, A. 2004. Dis-
solved organic matter (DOM) export
to a temperate estuary: Seasonal var-
iations and implications of land use.
(Submitted)
Søndergaard, M., Stedmon, C.A. and
Borch, N.H. 2004. Fate of terrigenous
dissolved organic matter (DOM) in
estuaries: Aggregation and bioavaila-
bility. Ophelia, 57, 161-176.
Søndergaard, M., Williams, P.J leB., Cau-
wet, G., Riemann, B., Robinson, C.,
Terzic, S., Woodward, E.M.S. and
Worm, J. 2000. Net accumulation and
flux of dissolved organic carbon and
dissolved organic nitrogen in marine
plankton communities. Limnology
and Oceanography, 45, 1097-1111.
Thingstad, T. F. 2002. Physiological
models in the context of microbial
food webs. In S. Finley and R. L.
Sinsabaugh (eds.); Aquatic Ecosys-
tems and Dissolved Organic Matter.
Academic Press. p. 383 –395.
Williams, P.J leB. 1981. Incorporation of
microheterotrophic processes into
the classical paradigm of the plank-
tonic food web. Kieler Meeresforc-
hung Sonderheft, 5, 1-28.
70 DISSOLVED ORGANIC MATTER (DOM) IN AQUATIC ECOSYSTEMS: A STUDY OF EUROPEAN CATCHMENTS AND COASTAL WATERS
Algae: Aquatic photosynthetic organ-
isms that vary in size from less than 1µm
to seaweeds over 50 m long. Algae are
plants having a quite different evolu-
tional history, although many of the
photosynthetic and nutrient uptake
processes are similar to those of the
green plants. All lack roots, stems and
leaves, and no algae produce flowers or
seeds.
Allochthonous: Matter imported from
another system, e.g. terrestrial DOM in
aquatic systems.
Attenuation: A decrease in the energy of
light due to absorption and scattering in
the water.
Autochthonous: Matter produced within
a given system.
Autotrophy: The capacity to produce or-
ganic compounds from inorganic com-
pounds using light energy (photoauto-
trophs) or chemical energy (chemoauto-
trophs).
Bacterioplankton: Bacteria cells in the
plankton, e.g. comparable to phyto-
plankton
Catchment: The area draining naturally
to a water course or to a given point.
The total area from which a single river
or estuary collects surface runoff. A
catchment is composed of many sub-
catchments that contribute to the cha-
racteristics of the whole.
Cluster analysis: A statistical analysis
which allows the description of like-
nesses in large data sets comprised of
many parameters.
Concentration: Number of molecules of
a substance in a given volume. Generally
expressed as moles per litre = mol l-1.
Dendrogram: A tree-like diagram de-
signed to show proposed relationships
between groups of data such as sam-
pling sites within a catchment.
Denitrification: The formation of re-
duced nitrogen compounds (gaseous
N2) from nitrate. Denitrification is a
microbial respiration process that takes
place in wet soil and sediment when
oxygen is not available, but nitrate is.
The common source of energy used by
denitrification is organic matter, or in
some cases pyrite.
Diatom: Unicellular algae with a cell
wall or frustule of silica. Adapted to a
wide range of pelagic and benthic hab-
itats.
DIN: Abbreviation used for dissolved in-
organic nitrogen; mainly nitrate, ammo-
nia and nitrite.
DIP: Abbreviation used for dissolved in-
organic phosphorus, i.e. phosphate.
Discharge: Quantity of water passing
a certain cross section per unit of time.
DOM: Abbreviation used for dissolved
organic matter. DOC, DON and DOP are
the abbreviations used for dissolve or-
ganic carbon, dissolved organic nitro-
gen and dissolved organic phosphorus,
respectively.
Ectoenzymes: Hydrolytic enzymes pro-
duced and released by bacteria and al-
gae that are active outside the cell
membrane.
Eutrophic: Water that contains high
concentrations of inorganic nutrients
and typically supports high primary
production and plankton biomass. Spe-
cies diversity in eutrophic waters tends
to be low.
Eutrophication: The process by which
natural waters are converted from nu-
trient poor and low productivity to high
nutrient concentrations and high pro-
ductivity. This can be from the addition
of nutrients, changing the residence
time of a body of water, or other com-
plex interactions.
Export: The amount of a substance
transported by a river or water body.
Loosely, the term export has the same
meaning as the transport, the load, the
loss, or the yield of a river. For instance
expressed as moles m-2 yr-1.
Fluorescence: Emission of light (pho-
tons) after a molecule has absorbed
light energy at a lower wavelength.
Half-life: The time it takes to degrade
a substance or compound to half of the
starting amount or concentration.
Heterotrophy: Non autotrophic nutri-
tion (see autotrophy).
Humic: Of, or relating to, or derived
from humus. The term humus is used by
some soil scientists synonymously with
soil organic matter (all organic material
in the soil) including humic substances.
Humic substances: A series of relatively
high-molecular-weight, brown to black
colored substances formed by secondary
synthesis reactions. The term is used as
a generic name to describe colored mate-
rial or its fractions obtained on the ba-
sis of solubility characteristics, including
humic acids, fulvic acids and humins.
Lysis: Dissolution or destruction of cells.
Macrophytes: Large visable aquatic
plants, mostly used for angiosperms.
Microbial loop: The regeneration of
nutrients and their return to the food
chain that is mediated by bacteria and
protozoans.
Mineralisation: See remineralisation.
DISSOLVED ORGANIC MATTER (DOM) IN AQUATIC ECOSYSTEMS: A STUDY OF EUROPEAN CATCHMENTS AND COASTAL WATERS 71
Glossary

Multivariate Statistics: A technique en-
abling the researcher to examine the
patterns of relationships within data si-
multaneously. These methods are often
used to summarise data and to reduce
the number of variables necessary to
describe it.
Nutrient: Elements, inorganic or orga-
nic compounds or ions used primarily in
the nutrition of primary producers, e.g
carbon, nitrogen and phosphorus.
Oligotrophic: Water that is low in nutri-
ents and subsequently low in primary
production and plankton biomass. Typi-
cally high in plankton species diversity.
PARAFAC: A statistical method to search
and identify patterns.
Periphyton: Alga, bacteria and associated
microorganisms growing attached to any
submerged surface.
Phytoplankton: Floating or swimming
mostly microscopic algae.
Plankton: Organisms that are suspended
or swim in the water column. These or-
ganisms are not capable of swimming
against a water current, but rather drift
with water masses.
Primary production/ productivity: The
net amount of organic carbon that re-
sults from photosynthesis. It is usually
expressed per unit volume or area and
per unit of time.
Protozoa: Unicellular animals.
Redfield ratio: The ratio between orga-
nic carbon, nitrogen and phosphorus in
plankton. It is reported as 106:16:1
(carbon:nitrogen:phosphorus), and is a
generally accepted ration for these ele-
ments in planktonic organisms.
Remineralisation: Sometimes called mi-
neralisation. Transformation of elements
from organic to inorganic form, e.g. the
conversion of organic carbon to inorga-
nic carbon.
Respiration: A metabolic process carried
out by all organisms in which organic
substances are broken down to yield
energy. It is the opposite reaction to
photosynthesis and results in the release
of carbon dioxide.
Runoff: The proportion of precipitation
that flows towards the stream on the
ground surface or within the soil (per
unit of area in a specified time).
Salinity: The number of grams of salts
dissolved in 1000 grams of water. Be-
cause it is a weight divided by another
weight it is in fact a unit-less unit, but
often presented as ppt = parts per thou-
sand.
Trophic level: The nutritional position
occupied by an organism in a food chain
or food web.
Turn over time: The time it takes to con-
sume the amount of a given substance
present, e.g. the concentration of glu-
cose is 10 nM and the rate of bacterial
uptake is 2 nM hour-1, then the turn over
time is 5 hours.
Water Framework Directive: EU direc-
tive for the protection of water quality
and with guidelines for how it should
be achieved
Wetland: An area dominated by water
but often shallower than a lake. Its for-
mation has been dominated by water,
and its processes and characteristics are
largely controlled by water. A wetland
is a place that has been wet enough for
a long time to develop specially adapted
vegetation and other organisms. The
soil is always saturated with water.
They include areas of fen or peatland
with permanent or temporary water.
72 DISSOLVED ORGANIC MATTER (DOM) IN AQUATIC ECOSYSTEMS: A STUDY OF EUROPEAN CATCHMENTS AND COASTAL WATERS

(Blank page)

BergenPartner 5
FinlandPartner 2
HorsensPartners 1-3-7
Banyuls-sur-MerPartner 4
BangorPartner 6
Wales
Denmark
NorwayFinland
France
Dissolved Organic Matter(DOM) in Aquatic Ecosystems:
A Study of European Catchmentsand Coastal Waters
Edited by Morten Søndergaard & David N. Thomas
Substantial amounts of nutrients are leaving terrestrial environments as dissolved organic matter (DOM). Neglecting the effects of DOM in coastal waters could lead to environ-mentally damaging management strategies. Here we summarise the results concerning DOM export from four selected European catchments and advocate, why we find it impor-tant to study DOM.
www. domaine.ku.dk
ISBN 87-89143-25-6Prep
ared
by
Pasc
al C
on
an