lab manual for lbymatc
DESCRIPTION
Laboratory Manual for Chemistry LabTRANSCRIPT

Experiment 1A SILLY POLYMER
In the course of performing this experiment the student will learn to cross-link a polymer and observe the changes in physical
properties as a result of this cross-linking observe the changes in a cross-linked polymer at varying temperatures learn concepts of molecular motion and intermolecular bond strength
PRINCIPLES:
If a substance springs back to its original shape after being twisted, pulled or compressed, it is most likely a polymer called an elastomer. The elastomer has elastic properties (i.e., it will recover its original size and shape after being deformed). Examples of elastomers are rubber bands and car tires.
The liquid latex (Elmer’s glue) which you will use in this experiment is a solution consisting of the polymer named polyvinyl acetate (PVA). The silly putty is formed by joining the globules of PVA using sodium borate ( a cross-linker). This cross-linking causes the mixture to undergo an irreversible gelation reaction. The silly putty is held together by weak intermolecular bonds that provide flexibility and rotation about the chain of the cross-linked polymer.
MATERIALS(L): 55% Elmer’s glue solution in water, 4% borax solution, food colors(S): Styrofoam cups, plastic bags
SAFETY PRECAUTIONS Borax (as solid or solution) can burn your eyes; it is absolutely necessary to wear
safety goggles and lab aprons. Wash hands thoroughly after handling the silly putty.
1

PROCEDURE
1. Pour 20 mL of Elmer’s glue solution into a Styrofoam cup.2. Add 8.5 mL of the cross-linker (borax solution) to each cup.3. Immediately begin stirring the solutions together using a wooden stick.4. After a couple of minutes of mixing, the silly putty should be taken out of the cup
and kneaded in the hands. Continue to knead until the desired consistency is reached.
5. Drop the ball from a height of 30 centimeter. Measure (using a ruler) the height to which the ball rebounds.
6. Stretch the silly putty slowly from each side.7. Compress the silly putty back into a ball.8. Pull the silly putty quickly from each side and compare the results.9. Place the silly putty on regular newsprint paper and press down firmly.10. Remove the silly putty from the newsprint and make observations.11. Place the silly putty in a bag and keep in the refrigerator for 10 minutes.12. Repeat step 5 and compare results.
Questions:
1. How do the physical properties of the glue-water mixture change as a result of adding sodium borate?
2. What would be the effect of increasing the concentration of sodium borate in the mixture?
3. In this experiment, how did you measure the elasticity of the polymer you prepared?
2

Experiment 1
A SILLY POLYMER
Group No. Date: ____________Name: _________________________________ Section: Groupmates: _________________________________
_________________________________
Objective(s):
1. Describe results (steps 1-4):
2. Height of the rebound (step 5): ______
Observation (step 6)
4. Observation (step 8)
5. Observation (step 9-10)
6. Height of the rebound (cold silly putty, step 11-12): ______
Answers to Questions: (use a separate sheet if necessary)1. How do the physical properties of the glue-water mixture change as a result of
adding sodium borate?
2. What would be the effect of increasing the concentration of sodium borate in the mixture?
3. In this experiment, how did you measure the elasticity of the polymer you prepared?
3

Experiment 2 (Demonstration)CLASSIFICATION AND IDENTIFICATION OF COMMON PLASTICS
You will use four tests to aid in the classification and identification of the six types of plastics. The first will be to determine the relative densities of the plastics by checking to see whether the samples float or sink in three liquids of differing densities. The second will be to melt the plastic. All six of these plastics melt reversibly (when they are cooled, they harden and may regain their original properties). If a plastic does not melt, it is a thermosetting plastic (which does not melt cleanly and reversibly but tends to char instead).
The third test will involve burning the plastic (to be done in a fume hood). The vapors given off from the burning plastic may have different properties depending on the plastic. The last, the copper wire test, will be used to determine if the polymer contains a halogen.
MATERIALSKnown samples of all six types of plastics1:1 mixture of 95% ethanol and water10% aqueous NaCl solution6-inch piece of copper wire and a corkblue litmus papertest tubesBunsen burner and matchesScissorsGlass stirring rodMetal spatulaForceps or tongs
PROCEDUREI. Density
Three liquids of differing densities will be used.
Liquid Density g/cm3
1:1 ethanol (95%) / water 0.94Water 1.010% aqueous NaCl 1.08
1. Pour about 5 mL of liquid into each of three labeled test tubes.2. Obtain two narrow strips of each of the six types of plastic. Cut one strip of each
plastic into 3 small pieces.
3. For each plastic, place a piece into each of the three test tubes containing the test liquids. Push each piece under the liquid surface with a stirring rod. If the sample
4
floats, it has a density lower than that of the liquid; if it sinks, its density is greater than that of the liquid.
4. Test each of the other plastics in the same way.5. Ask students to sort the six plastics by their densities, filling in the table and the
ranking list on the data sheet.
II. Melt Test1. Place each sample of each plastic, one at a time, on the end of a metal spatula and
hold the end of the spatula over a light blue burner flame.2. Heat slowly and observe the plastic as it warms and finally melts. Do not heat
strongly enough for the plastic to catch fire.3. Cool the sample and examine it for appearance and flexibility by bending it.4. The melted sample can still be used for the tests that follow.
III. Ignition Test (Do this in the fume hood)2. Place a burner in a fume hood.3. Place a large beaker of water in the hood.4. Hold one end of a small strip of plastic in a pair of tongs and place it directly in a
flame. Observe the color of the flame and its characteristics. (Is a lot of smoke or visible vapor given off? Does the plastic continue to burn after it is removed from the flame?)
5. Test the vapors given off for acidic properties by holding a piece of wet litmus paper in the vapors from the burning plastic.
6. Extinguish the burning plastic by dropping it into the beaker of water.7. Repeat steps 4 – 6 for the other plastics.
IV. Copper Wire Test (Do this in the fume hood)1. Push the end of a 6-inch length of copper wire into a small cork.2. Use the cork as a handle and heat the free end of the wire in a burner flame until
the flame has no green color.3. Touch the hot copper wire to the plastic you are testing and then return the wire
end to the flame. A tiny bit of plastic should be picked up by the hot wire. Return the wire end to the flame and watch for a slight flash of luminous flame. This indicates that you have correctly picked up a little bit of plastic on the wire.
4. Watch for the appearance of a green flame or green color in the flame (indicating the presence of chlorine) when the plastic is heated.
5

Experiment 2
CLASSIFICATION AND IDENTIFICATION OF COMMON PLASTICS
Group No. ____ Date: February 7, 2013Name: Caryl Blanche Baguilod Section: V24BGroupmates: Jasper Tanhueco
Louie Yupangco
Objective(s): To identify the properties of common plastics
I. Density (write in either “sinks”, “floats” or “can’t tell”)Type of plastic 1:1 ethanol/H2O water 10% NaCl
PET Sinks Sinks SinksHDPE Sinks Floats FloatsPVC Sinks Sinks SinksLDPE Floats Floats FloatsPP Floats Floats FloatsPS Sinks Sinks Floats
Density Categories (place each plastic into one of these categories)
Less than 0.94 g/cm3
Less than1.0 g/cm3
Less than 1.08 g/cm3
More than1.08 g/cm3
LDPE, PP HDPE, LDPE, PP HDPE, LDPE, PP, PS
PET, PVC
Ranking of densities
(lowest) __PE__ _LDPE_ _HDPE_ __PS__ __PVC__ __PET__ (highest)
II. Melting and Ignition Tests
Plastic Melting test Ignition test (also indicate if acidic
smoke was obtained)
Copper-wire test
PET Retained the color of the litmus paper (non acidic)
Produced orange smoke (non acidic)
HDPE Retained the color of the litmus paper (non acidic)
Produced orange smoke (non acidic)
PVC Turned the blue litmus paper red
Produced green smoke (acidic)
6

(acidic)LDPE Retained the color
of the litmus paper (non acidic)
Produced orange smoke (non acidic)
PP Retained the color of the litmus paper (non acidic)
Produced orange smoke (non acidic)
PS Retained the color of the litmus paper (non acidic)
Produced orange smoke (non acidic)
7

Experiment 3IDENTIFICATION OF ANALGESIC DRUGS
BY THIN-LAYER CHROMATOGRAPHY
In the course of performing this experiment, the student will perform thin-layer chromatography and calculate Rf values utilize thin-layer chromatography to identify the analgesic compound(s)
present in an unknown sample of an over-the-counter painkiller preparation learn concepts of chromatography, polarity of molecules and intermolecular
forces of attraction
PRINCIPLES:Chromatography is a technique used to separate and identify individual
components in a mixture. Components of a mixture tend to move at different speeds along a coated tube or flat surface. The different rates of movement are the result of differing attractions of the components to the coating material compared to the tendency of the components to remain in the moving fluid.
Thin-layer chromatography (TLC) is one of the easiest chromatographic techniques. A thin layer of a suitable solid substance is coated on a sheet of glass or plastic. By immersing one edge of the sheet in an appropriate liquid solvent, the solvent is drawn up the sheet by capillary action, and the compounds of interest are carried along at differing rates.
In this experiment, thin-layer chromatography will be used to identify the analgesic compound(s) present in an over-the-counter (OTC) painkiller preparation. OTC preparations can be easily acquired and are widely used. Although extremely useful and effective, they are also powerful drugs that can be very harmful if misused. Because such analgesics are so commonly available in homes, there is a danger of accidental overdose by young children who discover the innocuous-looking white pills. In cases of accidental poisoning, there may be need for quick identification of what is in an unknown tablet. This experiment demonstrates one such method.
MATERIALS:(S): ruler and pencil(L): solutions of analgesics in methanol (aspirin, paracetamol, ibuprofen,
caffeine), unknown OTC analgesic tablet, methanol, solvent mixture (25 parts ethyl acetate: 1 part ethanol: 1 part acetic acid), large beaker, 400 – 600 mL, aluminum foil or plastic wrap to cover beaker, test tubes, stirring rod, glass capillary tubes for spotting, plastic TLC sheet, about 5 cm 10 cm, mortar and pestle, ultraviolet lamp
8

SAFETY PRECAUTIONS: Poisoning may occur from ingestion, inhalation or percutaneous absorption of
methanol. Acute effects include visual impairment or complete blindness, convulsion, respiratory failure, death. It is absolutely necessary to wear safety goggles and lab aprons.
All solvents (methanol and solvent mixture) in this experiment are highly flammable, do not handle near open flames.
Do not stare directly into the source of ultraviolet radiation. Wash hands thoroughly after performing the experiment.
PROCEDURE:1. Obtain a large beaker (400 - 600 mL) and a piece of plastic wrap or aluminum
foil to cover it. Alternatively, a wide-mouthed jar may be used. The beaker or jar should be large enough so that the chromatographic sheet can lean against one side (see Figure 2).
2. Add enough of the solvent mixture (containing 25 parts ethyl acetate, 1 part ethanol, and 1 part acetic acid) to give a thin layer of solvent in the bottom of the container. To provide an atmosphere saturated with solvent inside the container, place a piece of filter paper around the inside surface of the container, extending into the solvent. Then cover the container with the plastic wrap, foil or screw cap and set it aside while preparing the chromatographic sheet (steps 3 – 6).
3. Obtain an unknown analgesic tablet (or a portion of one). Using a mortar and pestle, crush a portion of a tablet to a fine powder. Transfer the pulverized analgesic into a test tube, add a few milliliters of methanol to the powder and stir. Allow the mixture to settle for a few minutes.
4. Obtain a piece of plastic-backed chromatographic sheet. The white coating may flake off if the sheet is not handled carefully. Handle it only on the edges. The backing is flexible, but the sheet should not be bent excessively. Using a pencil (not a pen), draw a very light line across the sheet, about 1 cm from one end (see Figure 1). Then make five small light marks at 1-cm intervals along the line. These are the points at which the samples will be spotted. Label each point with a penciled number or abbreviation and record this code on the data sheet.
1 cm
Figure 1: Layout of TLC Sheet5. Samples will be spotted onto the chromatographic sheet, using glass capillary
tubes drawn down to a very small opening. (The tubes are quite fragile.) Before
9
Unk
Caf
Ibu
Par
Asp

spotting the sheet, you should practice putting very small spots of solution on a piece of scrap paper. To do this, dip the tip of a capillary tube into a solution, then, very gently touch the tip to the paper for a brief moment. The spots should be as small as possible in order to minimize tailing and overlapping when the chromatographic sheet is “developed”. (If a more intense spot is desired, it is preferable to let the spot dry and re-spot in the same location.)
6. Solutions of the three analgesic compounds plus caffeine will be available in the lab. Carefully place small spots of the four solutions at four pencil marks (Caution: Use separate capillary tubes for each sample solution). Finally, spot a sample of the solution of your unknown tablet onto the chromatographic plate. Allow the solvent to evaporate.
7. When the spots are dry, place the sheet in the developing container (Figure 2). Check to be sure that the bottom edge (near the spots) is in the solvent but that the spots are above the solvent surface. Then cover with plastic wrap, foil or screw-cap lid and watch carefully. The liquid will slowly move up the TLC sheet by capillary action.
8. When the front edge of the liquid has moved 80-90% of the way to the top of the sheet, carefully take the sheet out of the developing the chamber. Immediately, while the sheet is still wet, draw a pencil line to show the top edge of the liquid. Then lay the sheet on a clean surface in a fume hood or well-ventilated area and allow the solvent to evaporate until the sheet appears dry.
9. The spots are unlikely to be visible to the naked eye, but they should be quite visible when viewed under an ultraviolet (UV) lamp. While observing under the UV lamp, draw a light pencil mark around each spot. Caution: UV radiation is harmful to your eyes. Do not stare directly at the UV lamp.
10. Study the chromatogram and record your observations.a) Did the analgesics and caffeine produce a single spot?b) What distances did the spots travel?c) How many spots did the unknown analgesic produce?d) Can you identify the compound(s) present in the unknown tablet?
11. One way of interpreting chromatogram results is to calculate a retention factor, Rf, for each spot. The retention factor is the ratio of the distances traveled by the component and the solvent.
Rf = distance traveled by the substance = distance to center of spot
distance traveled by the solvent distance to solvent fronta. Obtain a short ruler marked in centimeters and millimeters. For each spot,
carefully measure the distance (in mm) from the starting line to the solvent front and also from the starting line to the middle of the spot. Some judgment may be necessary in choosing the middle of the spot. Record these numbers on the work sheet. If more than one spot is present from the unknown, make these measurements for each spot.
b. Calculate the Rf value for each spot, dividing the distance to the center of the spot by the distance to the solvent front. The quotient must be less than 1. Record this ratio on the work sheet, express it up to two digits after the decimal point.
10

QUESTIONS:1. Suggest possible advantages and disadvantages of using a longer (taller) TLC
sheet?2. Why do you think it was important to use a very small amount of sample when
spotting the plate?3. The relative movement of components is controlled partially by the polarity of
the molecules. The TLC sheet is coated with a highly polar substance, whereas the solvent mixture has a much lower polarity. From your chromatographic results, predict the relative polarities of aspirin, paracetamol, ibuprofen and caffeine by arranging them in order of increasing polarity. Explain your reasoning.
11

Experiment 3IDENTIFICATION OF ANALGESIC DRUGS
BY THIN-LAYER CHROMATOGRAPHY
Group No. Date: Names: Section:
Objectives:
SampleLabel on TLC sheet
Distance to center of spot
Distance to solvent front
Calculated Rf
Aspirin
Paracetamol
Ibuprofen
Caffeine
Unknown
GUIDE QUESTIONS:1. What compounds are present in the unknown tablet?
2. Tape the TLC sheet here or copy/illustrate the chromatogram. Cover the whole sheet with clear tape to protect it.
12
3. Suggest possible advantages and disadvantages of using a longer (taller) TLC sheet?
Advantages:
Disadvantages:
4. Why do you think it was important to use a very small amount of sample when spotting the plate?
5. The relative movement of components is controlled partially by the polarity of the molecules. The TLC sheet is coated with a highly polar substance, whereas the solvent mixture has a much lower polarity. From your chromatographic results, predict the relative polarities of aspirin, paracetamol, ibuprofen and caffeine by arranging them in order of increasing polarity. Explain your reasoning.
13

Experiment 4SYNTHESIS OF ASPIRIN
In this experiment, the student will Synthesize aspirin inside the laboratory. Observe proper laboratory skills in the preparation of aspirin
DISCUSSIONThe compound that we know as aspirin, acetylsalicylic acid, actually does more
than simply relieve pain. Aspirin can be synthesized in the laboratory through a simple reaction between salicylic acid and acetic anhydride. An esterification reaction usually combines an organic alcohol and an organic acid. To synthesize aspirin, salicylic acid will be combined with acetic anhydride. The acetic anhydride (which is actually two acetic acid molecules with a water molecule removed) will act as the acid part of the reaction
SAFETY PRECAUTIONS Be very CAREFUL in handling Phosphoric Acid and Acetic anhydride. Contact
with the body of any of these chemicals result in rapid destruction of tissue and can cause severe burns.
Use the lowest setting of the hotplate when heating. Turn the hotplate off immediately after use.
PROCEDURE1. Add 138 mg of salicyclic acid, a boiling chip, and one small drop of 85%
phosphoric acid followed by 0.3 mL of acetic anhydride to a reaction tube2. Mix the reactants thoroughly using a stirring rod, and then heat the reaction in a
beaker of 90ºC water for 5 min3. Cautiously add 0.2 mL of water to the reaction mixture4. When the reaction is over, add 0.3 mL more water and allow the tube to cool
slowly to room temperature5. Scratch the inside of the tube with a glass of stirring rod if crystallization haven’t
started at this point. 6. Cool the tube in ice until crystallization is complete. (at least 10 min), and then
remove the solvent with a Pasteur pipette. If the crystals are too fine for this procedure, collect the product by vacuum filtration on the Hirsch funnel
7. Complete the transfer of the product to the funnel using a very small quantity of ice water
8. Allow the product to dry thoroughly in air before determining the weight and calculating the percentage yield.
14

Experiment 4SYNTHESIS OF ASPIRIN
Group No. Date: Names: Section:
GUIDE QUESTIONS:1. Draw the molecular structure of acetylsalicylic acid, encircle and identify the functional
groups present.
2. Look for Infrared Spectrum of Acetylsalicylic acid, and tabulate the significant peaks. Compare the peaks in the IR spectrum you obtained from the synthesized aspirin. Assign functional groups to each of the experimental peaks you obtained according to IR correlation table.
Theoretical peaks of aspirin
Experimental peaks(from the synthesized aspirin)
Functional groups
3. Conclusion.
15

Experiment 5PROPERTIES OF WATER
pH of Water and PurificationSource: EUN Partnership aisbl. (2010). Global Experiment for the International Year of
Chemistry. International Year of Chemistry 2011. Retrieved on January 7, 2012 from the World Wide Web: http://www.chemistry2011.org/.
In this experiment the students will: Measure the pH of a local water sample using 2 different indicators. Compare which indicator is best to use for a given water sample. Purify and remove the solids from “dirty” water from natural resources. Observe the difference between untreated and treated water after carrying out a
clarification procedure.
DISCUSSIONAcidity (pH) measurement is widely performed since it is an indication of water
quality. The pH of water can vary differently from one place to another depending on the area that it was collected. Factors such as pollutants (sulfur dioxide from car and coal) and illegal chemical disposal can greatly affect the pH of water. When slight change in pH occurs, it can cause health problems or even death to living organisms since they can only tolerate a certain pH level. The acidity of water can be measured using naturally occurring substances that change in color in the presence of an acid or a base, like a litmus paper. In this experiment, bromothymol blue and phenol red are another set of indicator that are usually used in acid-base titrations. These indicators changes in color from yellow to blue (bromothymol blue) and yellow to purple (phenol red) as the solution goes from acidic to basic.
The quality of water does not only depend on its pH level it must also be purified. In this experiment, the purification of water will be done in 4 stages mainly, aeration, coagulation, sedimentation and filtration. The first step in purification is aeration wherein oxygen is being added to the water and at the same time allows trapped gases in the water to escape. The second step is coagulation, wherein dirt and other solid particles are chemically bonded together (clumping) so that it can easily be removed from the water. Sedimentation is a process that occurs when the clumped particles are being pulled by gravity and being left at the bottom once the water is being poured from one container to another. Lastly, the process of filtration removes the remaining impurities that are present in water after coagulation and sedimentation.
MATERIALS:(L): 3.0cc disposable syringe, cotton, sand, beakers, graduated cylinder, bromothymol blue, phenol red, color chart(S): water sample, dirty water sample, alum crystals
PROCEDURE:I. pH of water
1. Place 6mL of water sample in 3 containers (3 trials).
1

2. Add 3 drops of bromothymol blue indicator in each container and swirl.3. Compare the color of the mixture with those in the color chart and record the pH.4. Repeat steps 1-3 using phenol red as the indicator.
II. PurificationA. Aeration1. Note the appearance and smell of dirty water sample.2. Obtain 15mL of dirty water sample and placed it in a container.3. Place the lid on the container and vigorously shake the container for 30 sec.4. Pour the water sample into the second container and continue transferring it back
and forth between the containers about 10 times.5. Once aerated, any bubbles should be gone.
B. Coagulation and Sedimentation1. Add one or two crystals of alum to the aerated water. 2. Stir the mixture slowly for 5 min.3. Describe the appearance and smell of the water.4. Allow the water to stand undisturbed and observed the water at 5 min. intervals
for a total of 10 min. This water with alum sample is needed for the filtration stage. Write down your observations
C. Filtration1. Remove the plunger from the syringe.2. Pull a small piece of cotton apart to make a thin layer of cotton wool.3. Put a small piece of cotton wool in the bottom of the syringe. Lightly tap the
cotton wool into position using pen or pencil. If the cotton layer is too thick, the filter would not work properly.
4. Pour the sand on top of the cotton wool until 2/3 of the syringe is filled.5. Clean the filter by slowly adding CLEAN water. Throw away the water that has
passed through the filter.6. Pour the water/alum mixture to the filter in the syringe. Be careful not to disturb
the sediment. You may use a dropper.7. Collect the filtered water and compare the appearance and smell with the
untreated/unfiltered water.
2

Experiment 5PROPERTIES OF WATER
Group No. Date: Names: Section:
I. pH of WaterWater Sample Number:Temperature of Water Sample:
Bromothymol Blue Phenol RedTrial 1
Trial 2
Trial 3
Average
II. Water PurificationDate of Sample Collection:
Temperature of water when collected:
Type of Water (fresh: pond, river, stream or swamp or estuarine):
Describe where you found the water:
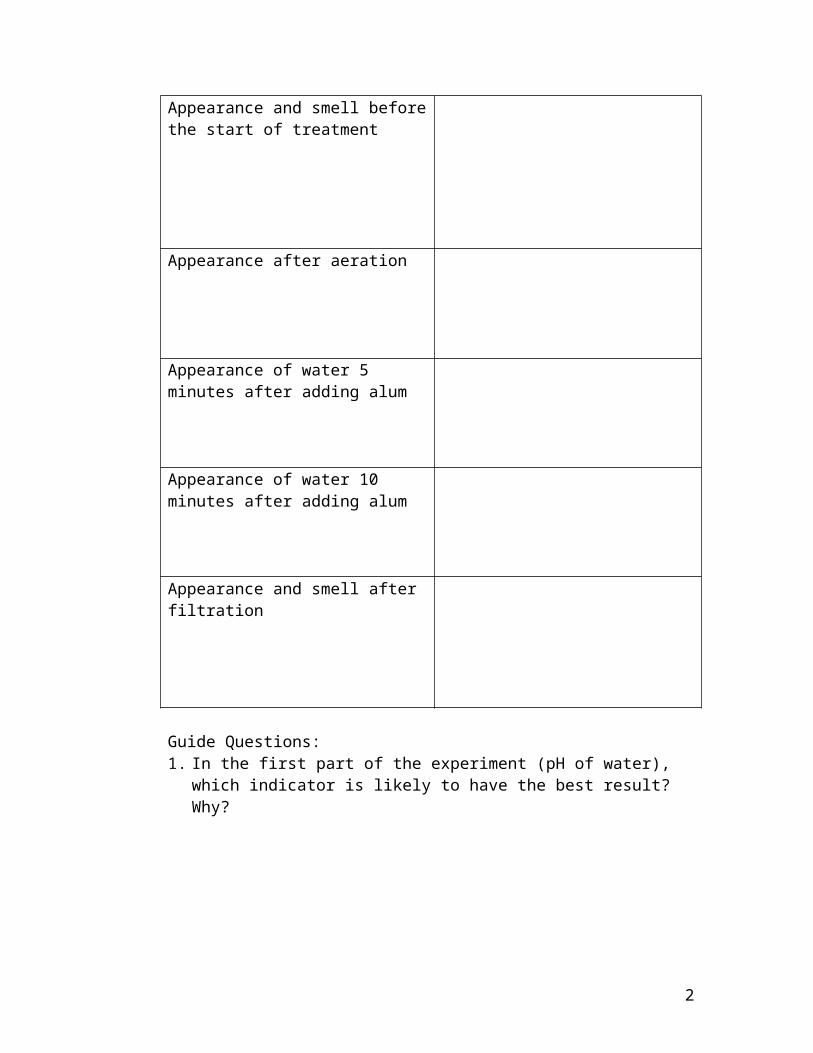
Water AppearanceAppearance and smell before the start of treatment
Appearance after aeration
1

Appearance of water 5 minutes after adding alum
Appearance of water 10 minutes after adding alum
Appearance and smell after filtration
Guide Questions:1. In the first part of the experiment (pH of water), which indicator is likely to
have the best result? Why?
2. What factors do you think affects the pH of water?
3. Compare the treated and untreated water. Has treatment changed the appearance and smell of the water?
2

4. Do you think your clarified water is safe to drink? Give at least 3 reasons for your answer.
3
Experiment 6SOAP-MAKING
In this experiment the student will prepare soap and determine its properties investigate the reactions and uses of organic molecules such as fats
DISCUSSIONSoaps are alkali salts of fatty acids formed from the reaction between triglycerides
(fats or oils) and a strong base such as potassium or sodium hydroxide. Fats and the fatty acids that constitute them represent one of the three main groups of organic biological molecules; the others are proteins and carbohydrates. Apart from their use as foods, fats and oils are used as raw materials for the manufacture of various household and industrial products. In the reaction known as saponification, a molecule of triglyceride is hydrolyzed into 3 molecules of soap (alkali salt of a fatty acid) and glycerol.
R’’ COO – CH2 R’’COO-Na+ HO - CH2
+
R’ COO – CH + 3 NaOH R’ COO-Na+ + HO - CH
+
R COO – CH2 R COO-Na+ HO – CH2
Triglyceride (fat or oil) base soap glycerol
Soap molecules contain chains of 16 to 20 carbon atoms. The most common types are salts of palmitic, stearic and oleic acid. Soap cleanses because the long C chain dissolves in grease and dirt, and the charged end dissolves in water causing dirt and grease to wash away during rinses.
MATERIALS:(L): coconut or vegetable oil, 32.5% sodium hydroxide, stearic acid, kerosene,
hot plate, 250-mL beaker, watch glass, thermometer, stirring rod, graduated cylinders, test tubes
(S): commercial soap (Ivory works best), molds of different shapes and sizes, perfume or cologne if desired
1

SAFETY PRECAUTIONS Concentrated sodium hydroxide can cause alkali burns; do not touch with bare
hands. Use the lowest setting of the hotplate when heating. Turn the hotplate off
immediately after use.
PROCEDURE1. Weigh 17.50 g of coconut or vegetable oil in a 250-mL beaker.2. In a small watch glass, weigh 0.125 g of stearic acid. Add the stearic acid into
the oil in the beaker.3. Heat the oil until the stearic acid dissolves.4. Cool the oil and stearic acid mixture to 40 – 45 C.5. Add 32.0 mL of 32.5% NaOH solution to the above mixture. Maintain the
temperature at 40C and continue on stirring until the saponification process is complete. If a clear layer of liquid appears at the bottom of the beaker even after a prolonged period of stirring, add a very small quantity of stearic acid and continue on stirring and heating the mixture.
6. If you wish to add scent to your soap, add about 0.5 mL of any essential oil or perfume.
7. Pour the solution into a mold and allow it to harden overnight.
Some properties of soap (to be performed next meeting)Perform the following experiments with commercial soap and with the soap you prepared in the lab.
1. Try washing your hands with each soap. Describe results (e.g. feel, lathering capacity).
2. Add 5 mL of distilled water to each of 2 test tubes. Add 5 to 10 drops of kerosene and shake the mixture. Observe what happens as the liquid settles. Now add a small portion of each soap (no more than 0.5 g). Shake each tube again fairly vigorously. Again observe what happens when the mixture settles. Explain your observations.
Questions:
1. Write a balanced equation for the reaction involving the formation of the soap sodium stearate(C17 H35 COO-Na+ ) from the triglyceride tristearin.
2. How do drain cleaners (like liquid Sosa which is sodium hydroxide solution) work to remove grease from the drain?
2

Experiment 6SOAP MAKING
Group No. Name: Date: _________Groupmates: Section:
1. Properties of soap (Describe your results)
Properties Your Soap Commercial Soap
a) Lathering capacity
b) Feel
c) H2O + kerosene + soap
Explain your results in (c) above. What property of soap is illustrated in this experiment?
3

ANSWER TO GUIDE QUESTIONS:1. Write a balanced equation for the reaction involving the formation of the soap
sodium stearate(C17 H35 COO-Na+ ) from the triglyceride tristearin.
2. How do drain cleaners (like liquid Sosa which is sodium hydroxide solution) work to remove grease from the drain?
4

Experiment 7HOW MUCH FAT IS IN POTATO CHIPS?
In performing this experiment, the student will learn how to determine the fat content of a food sample using one of the most
common approaches learn and follow proper techniques in measuring weight and volume
INTRODUCTIONFat, sugar and salt are three food components that worry nutritionists especially
since Filipinos tend to consume too much of these food ingredients. In this experiment, one common method will be used to determine the fat content
of foods. In fat-coated foods such as French fries, the fat can be dissolved out of the food using a solvent. Other approaches must be used for products where the fat is bound up in other tissue molecules.
The solvent, petroleum ether, will be mixed with ground-up chips to extract the fat. After separating the solvent mixture from the chips, the solvent is allowed to evaporate, leaving behind the fat that can then be weighed.
MATERIALS(L) analytical or triple-beam balance, mortar and pestle, glass funnel and funnel support, filter paper, beakers (50 – mL), spatula, hot plate or steam bath, graduated cylinder (100 – mL), petroleum ether (50 mL)(S) one small bag of chips
SAFETY PRECAUTIONS Petroleum ether is extremely flammable. Therefore it is absolutely essential that no
open flames be present anywhere in the laboratory during this experiment. Under no circumstances should the heating be done with a Bunsen burner or alcohol lamp.
PROCEDURE1. Obtain two 50-mL beakers that are clean and dry.2. Accurately weigh out two samples of chips of about 3 grams each. This is done
most conveniently by using small sheets of paper. Record the mass of the first paper, then add 2 – 3 grams of chips, and again record the mass. Repeat with the second sample. Keep track of which sample is which.Reminder about weighing: It is important to check the balance each time it is used to be sure it reads 0.00 g when there is nothing on the balance pan.
3. Also weigh the two 50-mL beakers and record their masses in the appropriate places in the data table (see the worksheet).
4. Put chip sample # 1 in a clean mortar and pestle and grind the mixture thoroughly.5. Add 15 mL of petroleum ether to the mortar and mix thoroughly.6. Prepare a glass funnel with folded filter paper. Mount it over weighed beaker # 1.
Using a spatula, carefully transfer the ground chip mixture into the filter paper. Try to get all of the mixture into the filter.
5

7. In order to rinse out any remaining fat in the mortar and on the chip mixture, add 5 mL more petroleum ether to the mortar, stir it around with the pestle, then pour it onto the chip mixture in the filter.
8. Repeat with another 5 mL rinse of the mortar and the chip mixture in the filter.9. Repeat steps 4 to 8 with the second sample of chips using the same mortar and
pestle but a fresh piece of filter paper and weighed beaker # 2.10. When both mixtures have finished filtering, the next step is to remove all of the
petroleum ether by evaporation. There are two ways this can be done.(a) You can leave the beakers in the fume hood until the next day or lab
period, by which time the solvent will have evaporated.(b) A much faster way is to place the beakers on a steam bath or hot plate in a
fume hood. Leave them for about 15 minutes or until all of the petroleum ether has evaporated. Then, remove the beakers from the steam bath or hot plate, carefully wipe the outsides to remove all water, and let them cool for a few minutes.
11. Reweigh the beakers and record the masses.
Clean UpDiscard the filter paper and chip mixtures in a designated container. The instructor will specify what to do with the mortar and pestle and the beakers.
CalculationsFor each sample, calculate by subtraction the mass of chips and mass of fat. Then, calculate the percent fat in the chips:
% fat = mass of fat x 100mass of chips
Sharing Your ResultsShare your results with others in your class. It will probably be advantageous to report your two results separately rather than as an average. If others analyzed the same brand, you can check how closely you agree. Examining the class data as a whole, you can look for differences and possible generalizations about different types of snack chips.
Questions1. If your class analyzed any “low fat” or “no fat” products, do the results support
this claim? If not, suggest a reasonable explanation.2. A snack pack of potato chips holds 28 grams of chips. Based on your data, how
much fat is present in a snack pack? In such a bag of chips, there are about 15 grams of carbohydrate and about 1 gram of protein. Given that carbohydrates and protein provide about 4 Calories of energy per gram and fats provide about 9 Calories per gram, what is the total energy equivalent (in Calories) of a bag of chips? What percent of Calories are from fat?
6
Experiment 7HOW MUCH FAT IS IN POTATO CHIPS?
Group No. ____Name: _________________________________ Date: _____________Groupmate: Section:
Objectives:
Brand of chips: _______________________________
Trial 1 Trial 2Mass of dish + chipsMass of empty dishMass of chipsMass of beaker + fatMass of empty beakerMass of fatPercent fat in chips
Answers to Questions:1. If your class analyzed any “low fat” or “no fat” products, do the results support this
claim? If not, suggest a reasonable explanation.
2. A snack pack of potato chips holds 28 grams of chips. Based on your data, how much fat is present in a snack pack? In such a bag of chips, there are about 15 grams of carbohydrate and about 1 gram of protein. Given that carbohydrates and protein provide about 4 Calories of energy per gram and fats provide about 9 Calories per gram, what is the total energy equivalent (in Calories) of a bag of chips? What percent of Calories are from fat?
7

Experiment 8CALORIMETRY
Calorimetry is used to determine the heat or energy involved in a chemical process. There are two types of process of calorimetry; the constant pressure and constant volume calorimetry. Constant pressure calorimetry involves two Styrofoam cups and a cover, thermometer and a stirrer. The equation involved in calorimetry is given by:
q= msΔT q= ms(Tfinal-Tinitial) (1)
- qwater =qrxn (2) mwaterswaterΔTwater = -(msubstancessubstanceΔTsubstance) (3)
Where q is the heat involved in the chemical process, m is the mass of the substance in the calorimeter, most commonly water, s is the specific heat of water or any substance inside the calorimeter and ΔT (Tfinal – Tinitial) is the change in temperature of water or any substance in the calorimeter.
In this experiment the students need to confirm the value of the specific heat of the substance added to the calorimeter which is 4.184 J/g C.
Figure 1. Coffee-cup calorimeter1
PROCEDURE1. Measure the weight of the calorimeter (except the cover and thermometer)2. Add about 100 mL of water to the calorimeter using 100-mL graduated cylinder3. Measure the weight of the water in the calorimeter4. Measure the initial temperature of water in the calorimeter5. Add about 10.00 g ice to the water in the calorimeter6. Measure the lowest temperature of water in the calorimeter after the addition of ice.7. Repeat the procedure for another trial.
1 Temperature changes and heat: constant pressure calorimetry. (https://www.cdli.ca/courses/chem3202/unit03_org01_ilo03/b_activity.html)
8

Experiment 8CALORIMETRY
Group No. ____Name: _________________________________ Date: _____________Groupmate: Section:
I. DATA TRIAL 1 TRIAL 2
Mass of calorimeter (g)
Mass of water + calorimeter (g)Mass of water in the calorimeter (g)Initial temperature of water (C) Mass of ice (g)Initial temperature of ice (C) 0.0 C 0.0 CFinal temperature of water + ice (C)Specific heat of ice (J/g C)
II. Show a sample calculation for the computation of specific heat of ice
III. Calculate the percent error of the experiment (for one trial only) using percent error equation.
IV. Did you get an accurate result based from the percent error you calculated?
Experiment 9ICE CREAM MAKING
9

Objectives: In this activity students will learn and apply some concepts in food chemistry by preparing ice cream. Discussion:
A mixture of oil and water is an example of an “immiscible” system. When these substances are added together the tiny droplets of oil that form in water enlarge and eventually become a separate layer. However, the oil droplets can be prevented from coming together if a third substance, an emulsifying agent, is shaken together with the mixture. The emulsifying agent stabilizes the two immiscible liquids in each other. The resulting mixture is called an emulsion. In the making of ice cream a mixture of milk and cream is added together with gelatin, the emulsifying agent. Casein, the protein in milk, can also act as an emulsifier.
Materials:(S): 1 tetrabrick all purpose cream, one small can condensed milk, one small
pack of powdered unflavored gelatin, vanilla and/or other flavoring.Container (1 pint) for ice cream, wire whisk or blender
Procedure:
1. Pour cream into a clean and dry bowl. Using a wire whisk or blender, whip cream.2. Add condensed milk (enough to achieve desired sweetness). Whip.3. Add 1 teaspoon of vanilla (or other )flavor and two to three tablespoons of powdered unflavored gelatin. Whip.4. To basic ice cream mixture you may add the following ingredients to achieve the desired flavor:Chocolate - chocolate syrup
Optional: nuts, mallows, choco barsCheese - ½ box cheese (half grated, half cut into cubes)Fruity - canned/bottled fruit (e.g. pineapple, strawberry, mango etc. or fruit combination5. Seal container then put inside freezer for at least one day.
10