lab 2: time domain reflectometry - computer action...
TRANSCRIPT
Department ofElectrical and Computer Engineering
ECE331
Lab 2: Time Domain Reflectometry
Version: 0.1Revised: January 28, 2014
ECE331 Lab 2: Time Domain Reflectometry
Contents
1 Pre-Lab Assignment 1
2 Introduction 22.1 Overview of Transient Response . . . . . . . . . . . . . . . . . . . . . . . . . . . . . . . . . . . 22.2 Overview of Time Domain Reflectometry . . . . . . . . . . . . . . . . . . . . . . . . . . . . . 3
3 Experiments 43.1 Relative Dielectric Constants . . . . . . . . . . . . . . . . . . . . . . . . . . . . . . . . . . . . 43.2 Identifying Transmission Discontinuities . . . . . . . . . . . . . . . . . . . . . . . . . . . . . . 43.3 Microstrip Transmission Line . . . . . . . . . . . . . . . . . . . . . . . . . . . . . . . . . . . . 53.4 Mystery Box . . . . . . . . . . . . . . . . . . . . . . . . . . . . . . . . . . . . . . . . . . . . . 6
A Tektronix DSA8200 Basic Operation 8A.1 Front Panel . . . . . . . . . . . . . . . . . . . . . . . . . . . . . . . . . . . . . . . . . . . . . . 8A.2 Control Panel . . . . . . . . . . . . . . . . . . . . . . . . . . . . . . . . . . . . . . . . . . . . . 9A.3 User Interface . . . . . . . . . . . . . . . . . . . . . . . . . . . . . . . . . . . . . . . . . . . . . 11A.4 80E04 Sampling Module . . . . . . . . . . . . . . . . . . . . . . . . . . . . . . . . . . . . . . . 14
B Taking TDR Measurements 14
References 20
Objective
Learn to locate and identify transmission line discontinuities using Time Domain Reflectometry.
Concepts Covered
• Transmission line transient analysis
• Identifying and locating faults on a transmission line
• Time Domain Reflectometry resolution and accuracy factors
• Microstrip transmission lines
1 Pre-Lab Assignment
1. Review section 2-11 in Ulaby[1]. This section describes the transient response of a signal on a trans-mission line.
2. Read pages 1-4 in the Tektronix TDR Impedance Measurements application note [2]. This documentoffers a detailed description of the Time Domain Reflectometry technique and its theory.
3. (In your lab notebook) draw the bounce diagrams and the corresponding voltage variation versus timeplot for each of the transmission line load impedance cases listed below, when z = l/2 and t = 4 T .
(a) ZL = inf
(b) ZL = 0
(c) ZL = Z0
(d) ZL = 12 Z0
1
ECE331 Lab 2: Time Domain Reflectometry
(e) ZL = 2 Z0
4. Review section 2-5 in Ulaby[1]. This section offers an introduction to microwave transmission line.Also find a relative permittivity value (i.e. dielectric constant value) of FR-4 and cite its source.
2 Introduction
In the most general case, transmission lines encompass all structures and media that serve to transfer energybetween two points. This includes acoustic waves propagating through fluids, mechanical pressure waves ina solid, and all forms of electromagnetic signals. In this lab we will be focusing on transmission lines forguiding electromagnetic signals. Some examples of transmission lines of this type are: coaxial, two-wire, andoptical fiber cables, and printed circuit board traces.
The transmission line can be modeled as a two-port device; on the input port (sending end) it receivespower from a source and at the output port (receiving end) it delivers power to the load. Depending on thecharacteristic impedance Z0 of the line, the generating source impedance Rg, and the load impedance ZL,reflections may occur.
When a transmission line is terminated by a load impedance ZL different from the characteristic impedanceZ0 of the line, an incident wave (from the generator) and a reflected wave (from the load) exist. In gen-eral, reflections occur whenever a mismatch in impedance occurs along the transmission line. We call thesemismatches in impedance discontinuities in the transmission line.
In this set of experiments we will be observing the voltage reflections that occur from different transmissionline discontinuities. We will learn to identify the different types of discontinues that occur and how to locatethem along the transmission line based on their reflected waveforms.
2.1 Overview of Transient Response
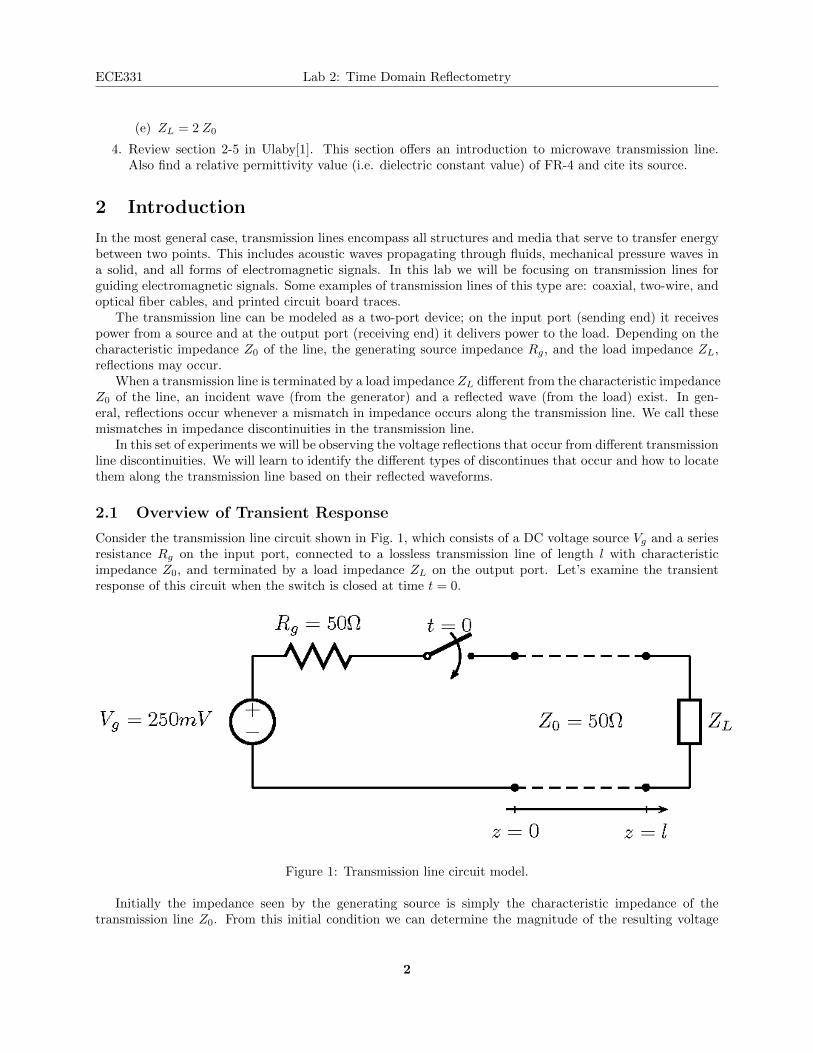
Consider the transmission line circuit shown in Fig. 1, which consists of a DC voltage source Vg and a seriesresistance Rg on the input port, connected to a lossless transmission line of length l with characteristicimpedance Z0, and terminated by a load impedance ZL on the output port. Let’s examine the transientresponse of this circuit when the switch is closed at time t = 0.
Figure 1: Transmission line circuit model.
Initially the impedance seen by the generating source is simply the characteristic impedance of thetransmission line Z0. From this initial condition we can determine the magnitude of the resulting voltage
2
ECE331 Lab 2: Time Domain Reflectometry
(and current) that begins to propagate down the transmission line.
V +1 = I+1 Z0 = Vg
Z0
Rg + Z0(1)
This voltage propagates along the transmission line with a velocity up immediately after the switch hasclosed (assuming non-magnetic materials so that µ = µ0).
up =1√µε
=c√εr
(2)
When the resulting voltage reaches the output port at distance z = l the instantaneous voltage at the loadmust remain constant (i.e. V + = Z0 ) and the total voltage and current must obey Kirchoff?s law (i.e.
V/I = V ++V −
I++I− = Z). In order to satisfy these two conditions there must exist a reflected voltage at theoutput port. The magnitude of the reflected voltage is determined by the reflection coefficient of the loadΓL and the incident voltage.
ΓL =V −1V +1
=ZL − Z0
ZL + Z0(3)
V −1 = ΓLV+1 (4)
The reflected voltage at the load propagates along the transmission line in the −z direction back toward thegenerating source Vg. When it arrives at the input port, if Rg 6= Z0, we obtain another reflecting voltagethat is determined by the reflection coefficient of the source Γg.
Γg =V −1V +2
=Zg − Z0
Zg + Z0(5)
V +2 = ΓgV
−1 = ΓgΓLV
+1 (6)
The reflections continue until the the steady-state voltage of the transmission line is reached.
V∞ = V +1
1 + ΓL
1− ΓLΓg= Vg
ZL
Rg + ZL(7)
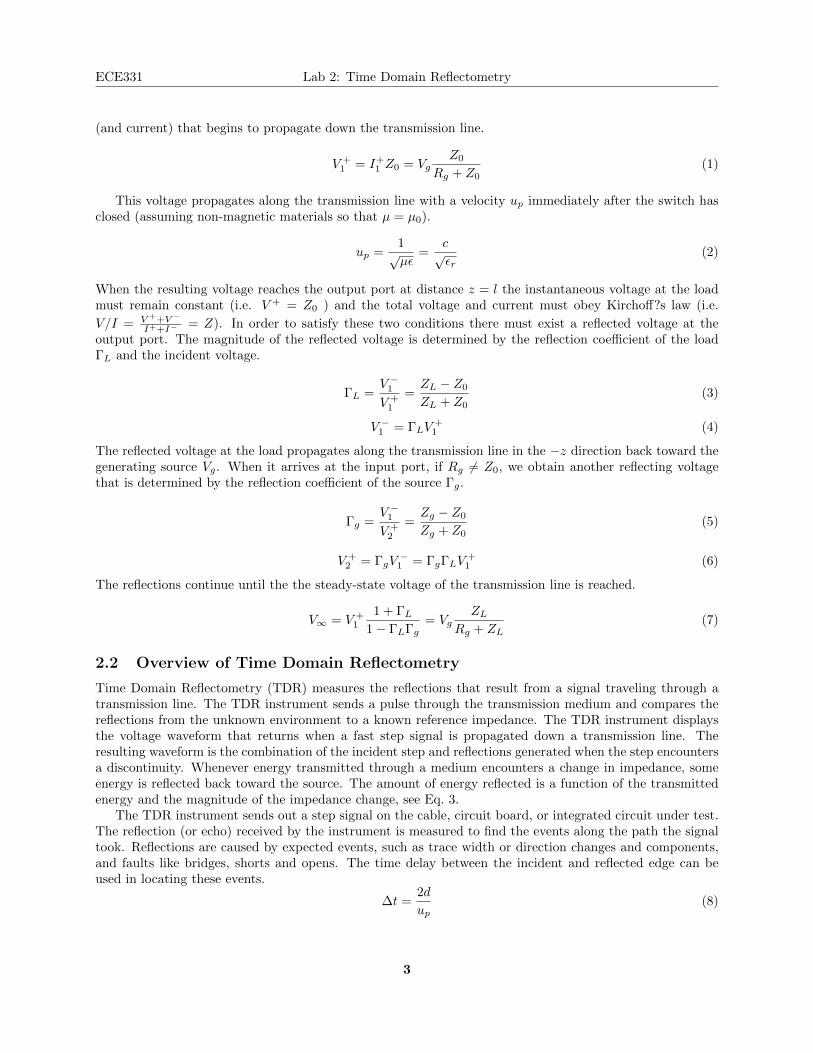
2.2 Overview of Time Domain Reflectometry
Time Domain Reflectometry (TDR) measures the reflections that result from a signal traveling through atransmission line. The TDR instrument sends a pulse through the transmission medium and compares thereflections from the unknown environment to a known reference impedance. The TDR instrument displaysthe voltage waveform that returns when a fast step signal is propagated down a transmission line. Theresulting waveform is the combination of the incident step and reflections generated when the step encountersa discontinuity. Whenever energy transmitted through a medium encounters a change in impedance, someenergy is reflected back toward the source. The amount of energy reflected is a function of the transmittedenergy and the magnitude of the impedance change, see Eq. 3.
The TDR instrument sends out a step signal on the cable, circuit board, or integrated circuit under test.The reflection (or echo) received by the instrument is measured to find the events along the path the signaltook. Reflections are caused by expected events, such as trace width or direction changes and components,and faults like bridges, shorts and opens. The time delay between the incident and reflected edge can beused in locating these events.
∆t =2d
up(8)
3
ECE331 Lab 2: Time Domain Reflectometry
Measurement Range
There are a number of factors that affect the distance over which the TDR can locate features. The mostimportant parameters that are TDR-related are step amplitude and step width. Step amplitude is theamount of voltage produced by the TDR step. In general the higher the step amplitude, the farther theTDR can “see”. Overall step width also affects measurement range. Step width follows the setting of theinternal clock rate. The longer the step width (lower frequency), the greater the range of the TDR.
Resolution Factors
Resolution determines the shortest impedance discontinuity that a TDR instrument can measure. If a TDRsystem has insufficient resolution then small or closely spaced discontinuities may be smoothed together andappear as a single discontinuity on the waveform. Due to round trip effects [2] TResolution = 1
2TSystemRiseTime.If a discontinuity is small with respect to the system rise time, the reflection will not accurately representthe impedance of the discontinuity.
Accuracy Factors
The accuracy of the measured impedance depends directly on the accuracy of the known reference impedance.All TDR measurements are relative; they compare a known impedance to unknown impedances.
3 Experiments
3.1 Relative Dielectric Constants
In this experiment we will use Time Domain Reflectometry to determine the relative dielectric constant εrof a short length of cable.
Equipment
• Tektronix DSA8200 with 80E04 Sampling Module
• Short length of SMA-SMA cable
Procedure
1. Connect one end of the SMA-SMA cable to channel one of the 80E04 sampling module leaving theother end open.
2. Take a TDR measurement of the open ended SMA cable. (The procedure for taking TDR measurementscan be found in appendix B.)
3. Mark the waveform with the location of the event of interest and take a screen capture of the waveform.
4. Using Eqs. 2 and 8 calculate the SMA-SMA cable’s dielectric constant.
3.2 Identifying Transmission Discontinuities
In this experiment we will use Time Domain Reflectometry to identify the nature of different transmissionline discontinuities.
4
ECE331 Lab 2: Time Domain Reflectometry
Equipment
• Tektronix DSA8200 with 80E04 Sampling Module
• Short length of SMA-SMA cable
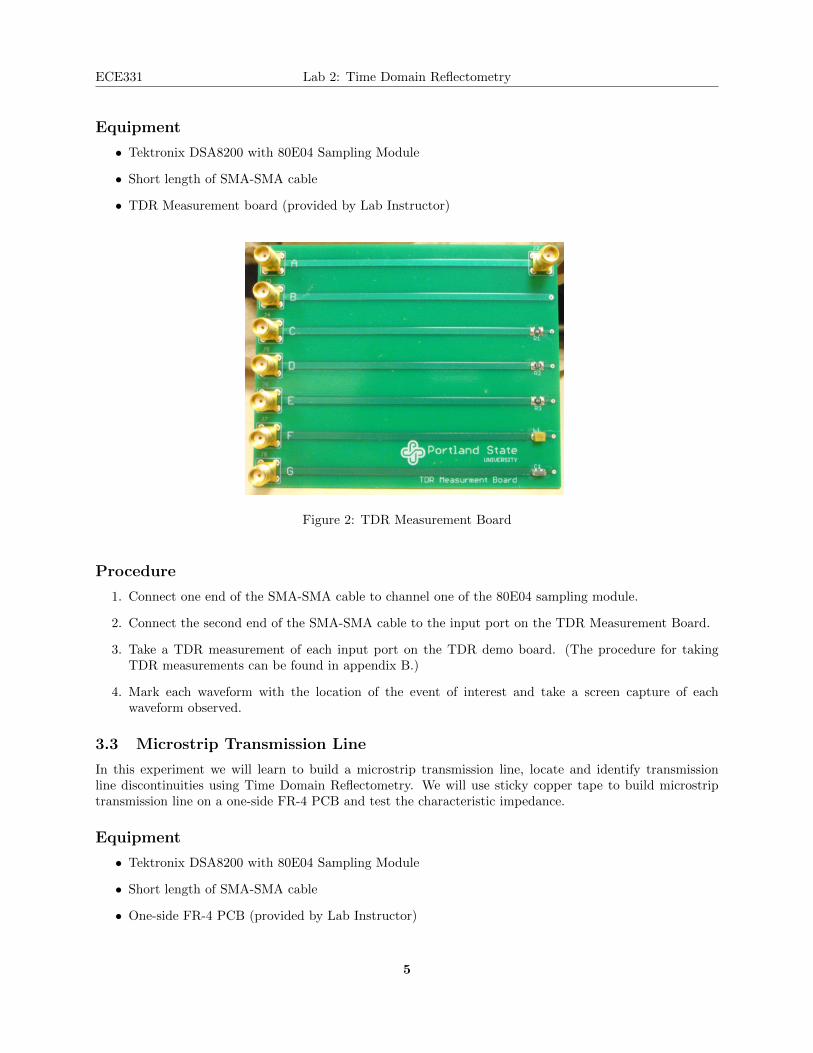
• TDR Measurement board (provided by Lab Instructor)
Figure 2: TDR Measurement Board
Procedure
1. Connect one end of the SMA-SMA cable to channel one of the 80E04 sampling module.
2. Connect the second end of the SMA-SMA cable to the input port on the TDR Measurement Board.
3. Take a TDR measurement of each input port on the TDR demo board. (The procedure for takingTDR measurements can be found in appendix B.)
4. Mark each waveform with the location of the event of interest and take a screen capture of eachwaveform observed.
3.3 Microstrip Transmission Line
In this experiment we will learn to build a microstrip transmission line, locate and identify transmissionline discontinuities using Time Domain Reflectometry. We will use sticky copper tape to build microstriptransmission line on a one-side FR-4 PCB and test the characteristic impedance.
Equipment
• Tektronix DSA8200 with 80E04 Sampling Module
• Short length of SMA-SMA cable
• One-side FR-4 PCB (provided by Lab Instructor)
5
ECE331 Lab 2: Time Domain Reflectometry
• Sticky copper tape (provided by Lab Instructor)
• RF connector (provided by Lab instructor)
Procedure
1. Calculate the characteristic impedance of a 1/4” microstrip transmission line in Matlab using theprovided code (use the relative permittivity or dielectric constant value you find in the Pre-lab section).
2. Cut a 5 cm long copper tape and stick it to the PCB, and make sure one end of the trace is at theedge of the board.
3. Solder the connector pin to the end of the trace.
4. Connect one end of the SMA-SMA cable to channel 1 of the 80E04 sampling module, and connectanother end of the SMA-SMA cable to the test board you just built.
5. Take a TDR measurement of the 1/4” microstrip transmission line. (The procedure for taking TDRmeasurements can be found in appendix B.)
6. Mark the waveform with the location of the event of interest (inside the microstrip transmission lineportion) and take a screen capture of the waveform.
7. Compare your measurement result with your calculation result, and modify your dielectric constantvalue and use it to design a 50 Ohm microstrip transmission line.
8. Repeat steps 2 to 6 for the 50 Ohm microstrip transmission line you designed.
3.4 Mystery Box
In this experiment we will extend our understanding of Time Domain Reflectometry by using only observedwaveforms to determine the nature and location of a transmission line discontinuity.
Equipment
• Tektronix DSA8200 with 80E04 Sampling Module
• Short length of SMA-SMA cable
• Mystery fault box (provided by Lab Instructor)
Procedure
1. Connect one end of the SMA-SMA cable to channel one of the 80E04 sampling module.
2. Connect the second end of the SMA-SMA cable to the input port of the Mystery Box.
3. Take a TDR measurement of the Mystery Box and a screen capture of the waveform observed. (Theprocedure for taking TDR measurements can be found in appendix B.)
4. Record all changes in impedances and their corresponding location along the transmission line in atable in your lab notebook.
5. Using the data obtained from the TDR waveform sketch an equivalent simplified transmission linecircuit model, similar to figure 1, for the observed waveform. (You do not need to include capacitiveor inductive effects in your model.)
6

ECE331 Lab 2: Time Domain Reflectometry
Figure 3: Mystery Fault Box
Lab Report Questions
Include the answers to the following questions in your lab report. (5 pts each)
• What is the propagation velocity of the SMA-SMA cable used in experiment 3.1?
• What are some possible causes of inaccuracy for the method used to calculate the value of the dielectricconstant in experiment 3.1?
• Can you determine the characteristic impedance of each of the transmission lines on the TDR DemoBoard? If so, what are they?
• Where does the 2 come from in Eq. 8?
• What determines the characteristic impedance of a transmission line?
• What types of transmission line discontinuities are there and what does their corresponding waveformlook like?
• What are possible causes of a fault along a transmission line?
• What affects a TDRs resolution, accuracy, and measurement range?
• What are the possible sources of inaccuracies of your 50 Ohm microstrip transmission line design?
Your lab report should also include:
• The TDR waveform for the SMA cable measurement in experiment 3.1. (5 pts)
• A TDR waveform for each transmission line measured in experiment 3.2. (5 pts each)
• Two TDR waveforms of the 1/4” and 50 Ohm microstrip transmission line (make sure you set yourcursors in the right section to show the characteristic impedance of the line) in experiment 3.3 (5 ptseach).
• A TDR waveform of the Mystery Box measured in experiment 3.4. (5 pts)
7
ECE331 Lab 2: Time Domain Reflectometry
• A sketch of the simplified transmission line circuit model for the Mystery Box measured in experiment3.4. (5 pts)
• A table of impedance and location of discontinuities measured in experiment 3.4. (5 pts)
• Equations used in each experiment. (10 pts)
A Tektronix DSA8200 Basic Operation
In this lab we will be using a Tektronix 8200 Digital Serial Analyzer(DSA8200) with an 80E04 SamplingModule. This appendix is intended to help you become familiar with the controls and interface of theDSA8200 and the 80E04 Sampling Module.
Note: This appendix is meant for quick reference during the lab experiments, and as such, some features of the
instrumentation has been omitted. For further information about the operation of the Tektronix DSA8200 and the 80E04
Sampling Module, please refer to their respective User Manuals[3, 4].
A.1 Front Panel
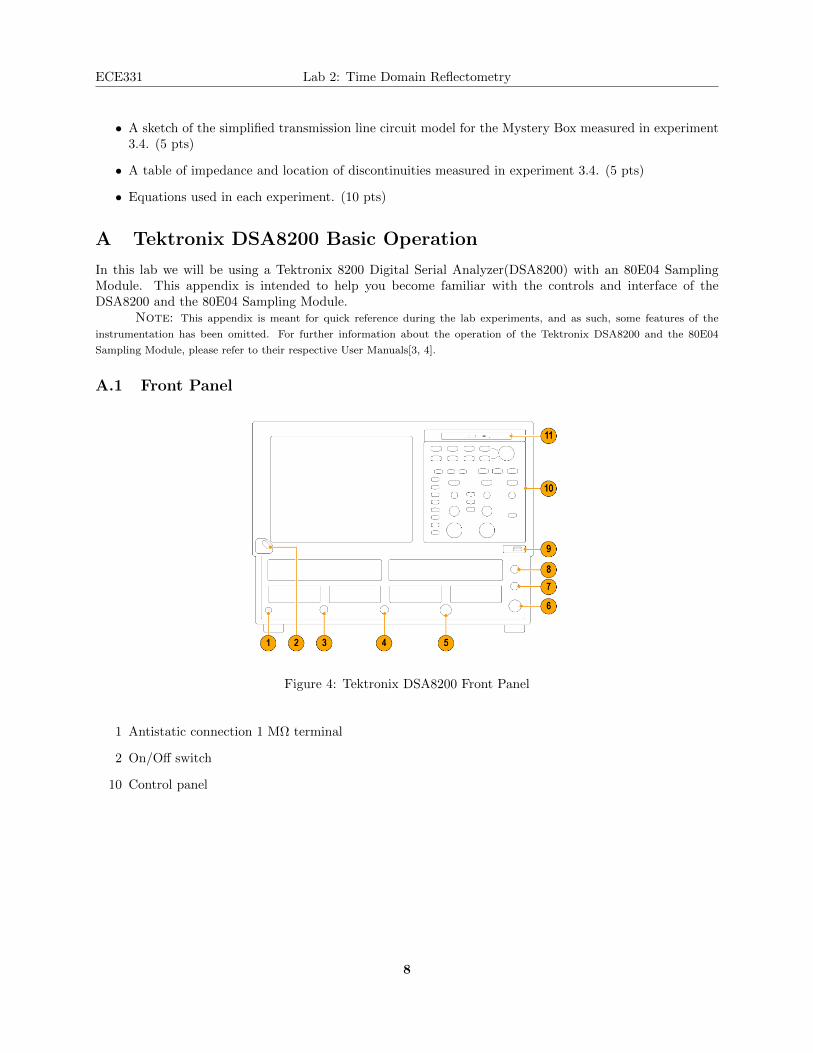
Figure 4: Tektronix DSA8200 Front Panel
1 Antistatic connection 1 MΩ terminal
2 On/Off switch
10 Control panel
8
ECE331 Lab 2: Time Domain Reflectometry
A.2 Control Panel
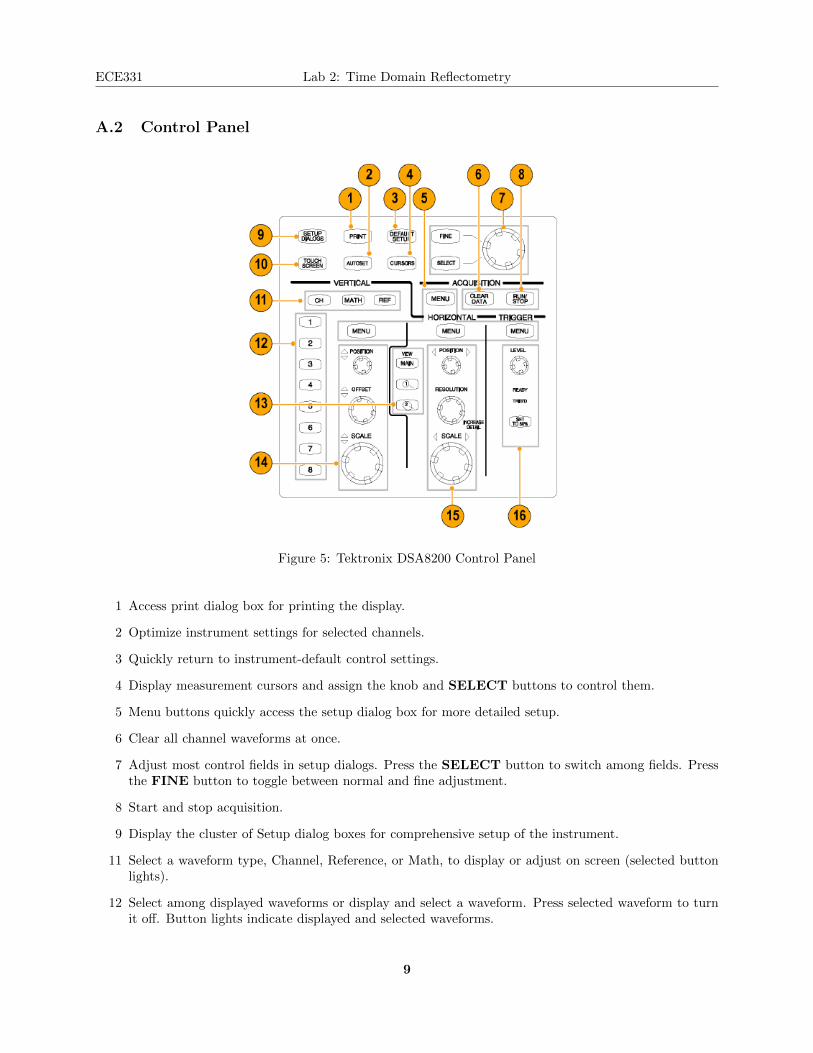
Figure 5: Tektronix DSA8200 Control Panel
1 Access print dialog box for printing the display.
2 Optimize instrument settings for selected channels.
3 Quickly return to instrument-default control settings.
4 Display measurement cursors and assign the knob and SELECT buttons to control them.
5 Menu buttons quickly access the setup dialog box for more detailed setup.
6 Clear all channel waveforms at once.
7 Adjust most control fields in setup dialogs. Press the SELECT button to switch among fields. Pressthe FINE button to toggle between normal and fine adjustment.
8 Start and stop acquisition.
9 Display the cluster of Setup dialog boxes for comprehensive setup of the instrument.
11 Select a waveform type, Channel, Reference, or Math, to display or adjust on screen (selected buttonlights).
12 Select among displayed waveforms or display and select a waveform. Press selected waveform to turnit off. Button lights indicate displayed and selected waveforms.
9

ECE331 Lab 2: Time Domain Reflectometry
13 Select among displayed timebase views or display and select a timebase view. Press selected view toturn it off (except main, which is always on).
14 Vertically scale, position, and offset selected waveform.
15 Horizontally scale, position, and set record length of selected waveform.
10
ECE331 Lab 2: Time Domain Reflectometry
A.3 User Interface
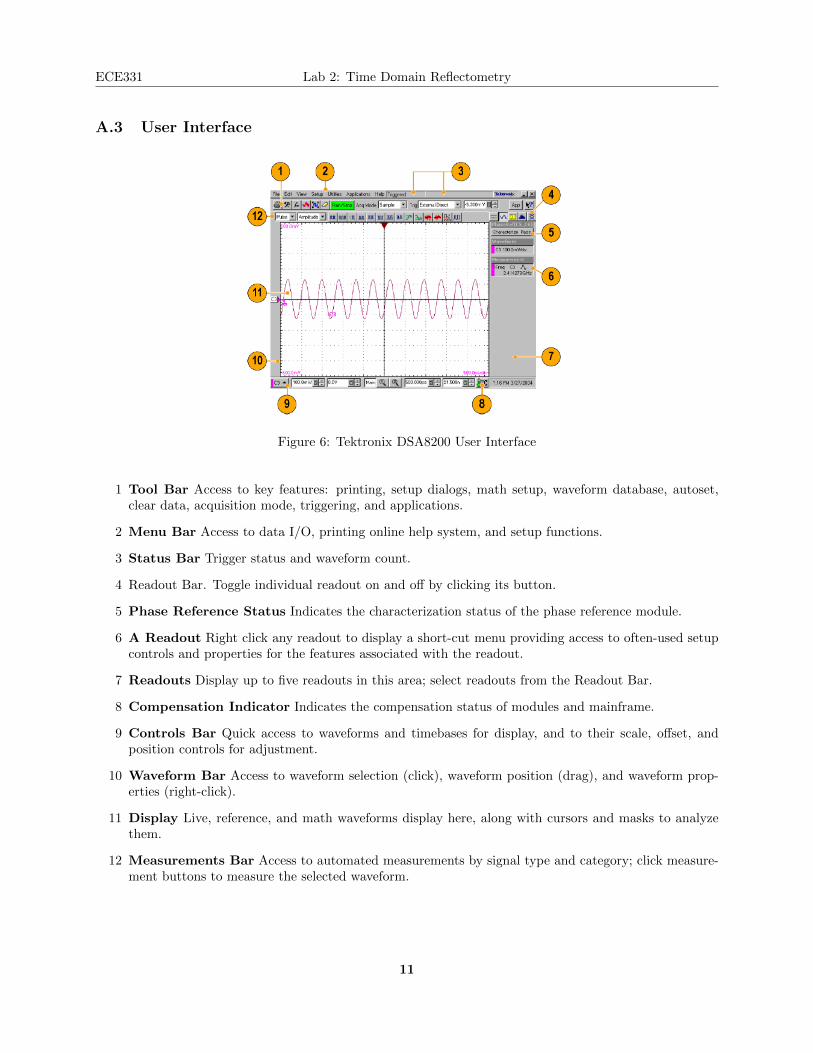
Figure 6: Tektronix DSA8200 User Interface
1 Tool Bar Access to key features: printing, setup dialogs, math setup, waveform database, autoset,clear data, acquisition mode, triggering, and applications.
2 Menu Bar Access to data I/O, printing online help system, and setup functions.
3 Status Bar Trigger status and waveform count.
4 Readout Bar. Toggle individual readout on and off by clicking its button.
5 Phase Reference Status Indicates the characterization status of the phase reference module.
6 A Readout Right click any readout to display a short-cut menu providing access to often-used setupcontrols and properties for the features associated with the readout.
7 Readouts Display up to five readouts in this area; select readouts from the Readout Bar.
8 Compensation Indicator Indicates the compensation status of modules and mainframe.
9 Controls Bar Quick access to waveforms and timebases for display, and to their scale, offset, andposition controls for adjustment.
10 Waveform Bar Access to waveform selection (click), waveform position (drag), and waveform prop-erties (right-click).
11 Display Live, reference, and math waveforms display here, along with cursors and masks to analyzethem.
12 Measurements Bar Access to automated measurements by signal type and category; click measure-ment buttons to measure the selected waveform.
11
ECE331 Lab 2: Time Domain Reflectometry
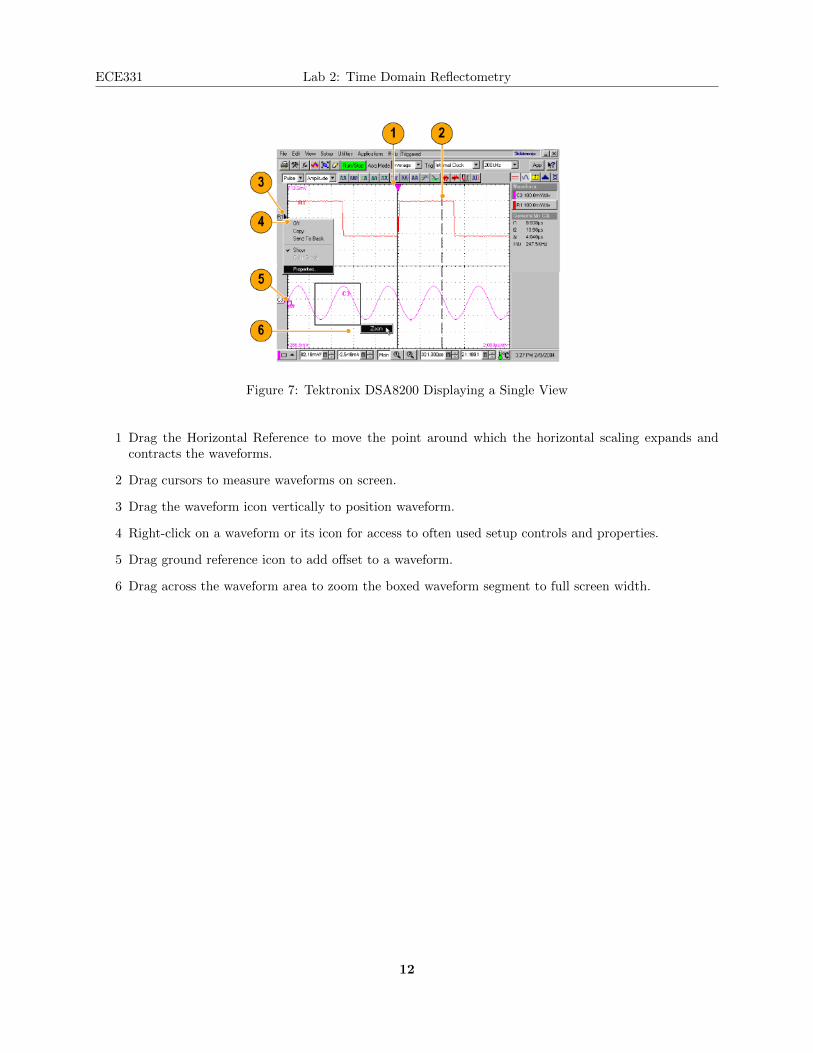
Figure 7: Tektronix DSA8200 Displaying a Single View
1 Drag the Horizontal Reference to move the point around which the horizontal scaling expands andcontracts the waveforms.
2 Drag cursors to measure waveforms on screen.
3 Drag the waveform icon vertically to position waveform.
4 Right-click on a waveform or its icon for access to often used setup controls and properties.
5 Drag ground reference icon to add offset to a waveform.
6 Drag across the waveform area to zoom the boxed waveform segment to full screen width.
12
ECE331 Lab 2: Time Domain Reflectometry
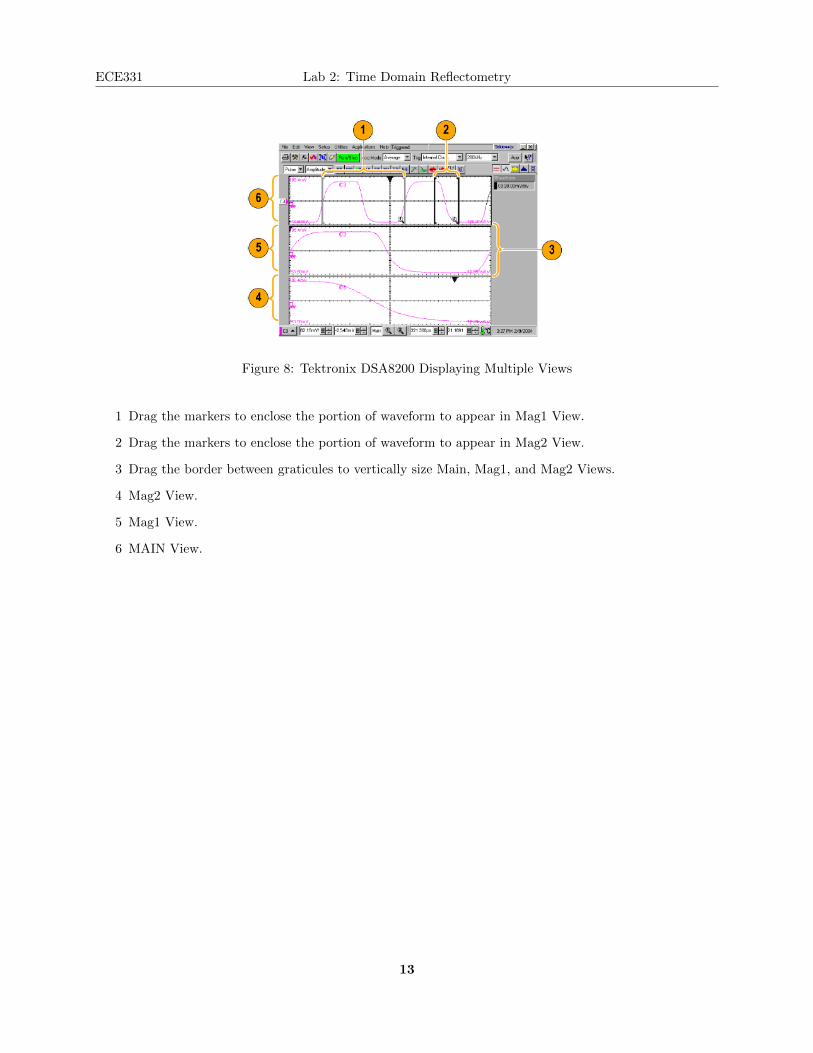
Figure 8: Tektronix DSA8200 Displaying Multiple Views
1 Drag the markers to enclose the portion of waveform to appear in Mag1 View.
2 Drag the markers to enclose the portion of waveform to appear in Mag2 View.
3 Drag the border between graticules to vertically size Main, Mag1, and Mag2 Views.
4 Mag2 View.
5 Mag1 View.
6 MAIN View.
13
ECE331 Lab 2: Time Domain Reflectometry
A.4 80E04 Sampling Module
Each sampling module contains two identical input channels. This section describes channel controls, con-nectors, and indicators.
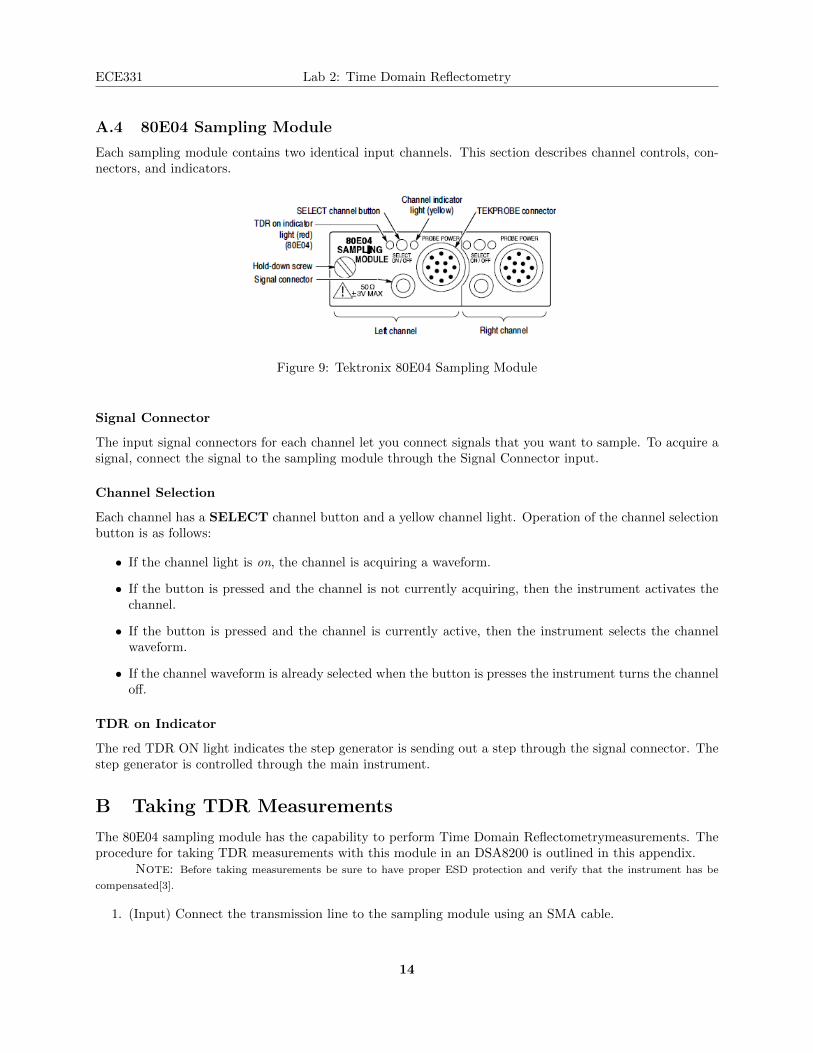
Figure 9: Tektronix 80E04 Sampling Module
Signal Connector
The input signal connectors for each channel let you connect signals that you want to sample. To acquire asignal, connect the signal to the sampling module through the Signal Connector input.
Channel Selection
Each channel has a SELECT channel button and a yellow channel light. Operation of the channel selectionbutton is as follows:
• If the channel light is on, the channel is acquiring a waveform.
• If the button is pressed and the channel is not currently acquiring, then the instrument activates thechannel.
• If the button is pressed and the channel is currently active, then the instrument selects the channelwaveform.
• If the channel waveform is already selected when the button is presses the instrument turns the channeloff.
TDR on Indicator
The red TDR ON light indicates the step generator is sending out a step through the signal connector. Thestep generator is controlled through the main instrument.
B Taking TDR Measurements
The 80E04 sampling module has the capability to perform Time Domain Reflectometrymeasurements. Theprocedure for taking TDR measurements with this module in an DSA8200 is outlined in this appendix.
Note: Before taking measurements be sure to have proper ESD protection and verify that the instrument has be
compensated[3].
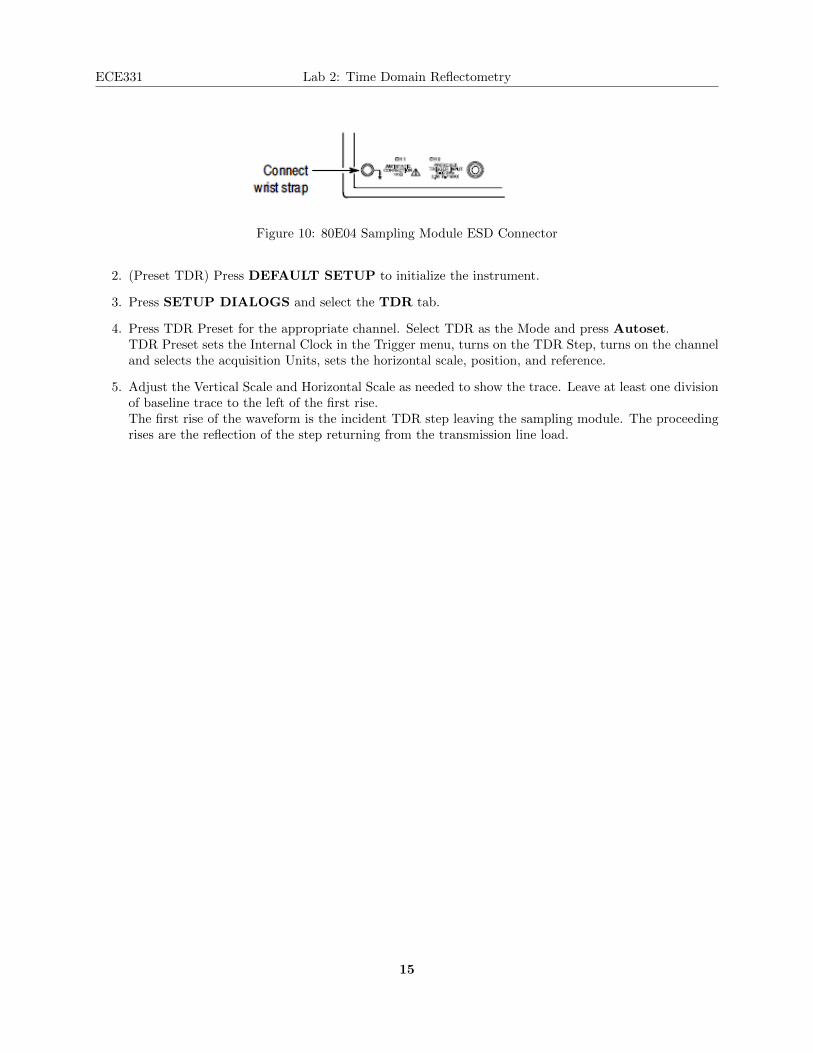
1. (Input) Connect the transmission line to the sampling module using an SMA cable.
14
ECE331 Lab 2: Time Domain Reflectometry
Figure 10: 80E04 Sampling Module ESD Connector
2. (Preset TDR) Press DEFAULT SETUP to initialize the instrument.
3. Press SETUP DIALOGS and select the TDR tab.
4. Press TDR Preset for the appropriate channel. Select TDR as the Mode and press Autoset.TDR Preset sets the Internal Clock in the Trigger menu, turns on the TDR Step, turns on the channeland selects the acquisition Units, sets the horizontal scale, position, and reference.
5. Adjust the Vertical Scale and Horizontal Scale as needed to show the trace. Leave at least one divisionof baseline trace to the left of the first rise.The first rise of the waveform is the incident TDR step leaving the sampling module. The proceedingrises are the reflection of the step returning from the transmission line load.
15
ECE331 Lab 2: Time Domain Reflectometry
Changing Graticule Units
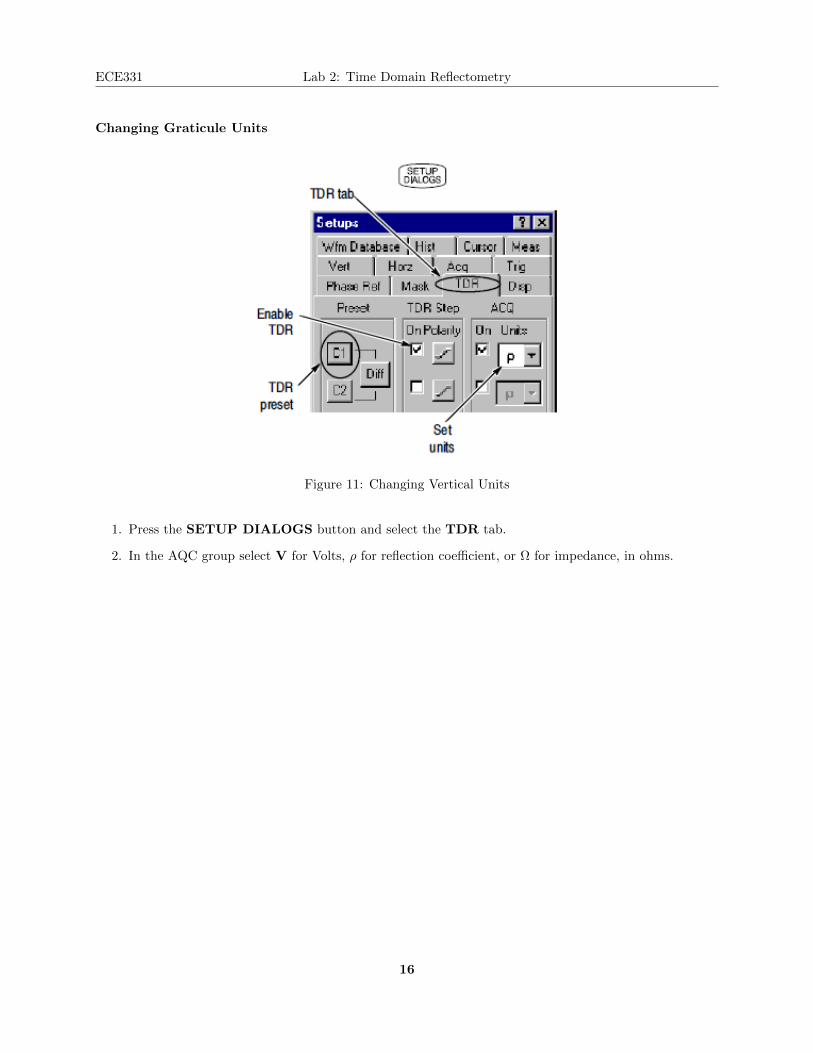
Figure 11: Changing Vertical Units
1. Press the SETUP DIALOGS button and select the TDR tab.
2. In the AQC group select V for Volts, ρ for reflection coefficient, or Ω for impedance, in ohms.
16
ECE331 Lab 2: Time Domain Reflectometry
Changing Horizontal Units
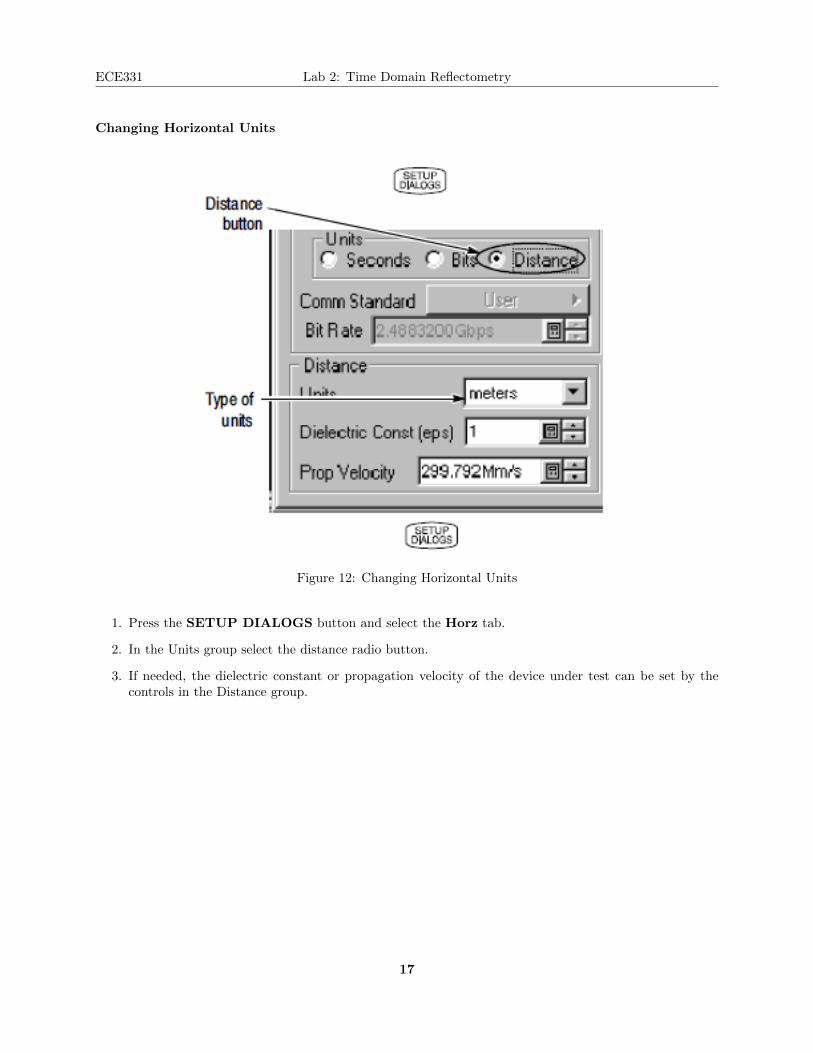
Figure 12: Changing Horizontal Units
1. Press the SETUP DIALOGS button and select the Horz tab.
2. In the Units group select the distance radio button.
3. If needed, the dielectric constant or propagation velocity of the device under test can be set by thecontrols in the Distance group.
17

ECE331 Lab 2: Time Domain Reflectometry
Automatic Measurements
Figure 13: Automatic Measurements
1. Select the waveform to be measured.
2. Select one of the measurement tool bars.
3. Click the measurement you want in the measurement toolbar.
4. To take measurements over a portion of the waveform, Press the SETUP DIALOGS button andselect the Region tab.
5. Click the On checkbox to display gates on the screen.
6. Adjust G1 and G2 to the portion of the waveform the measurement is to be taken over.
18
ECE331 Lab 2: Time Domain Reflectometry
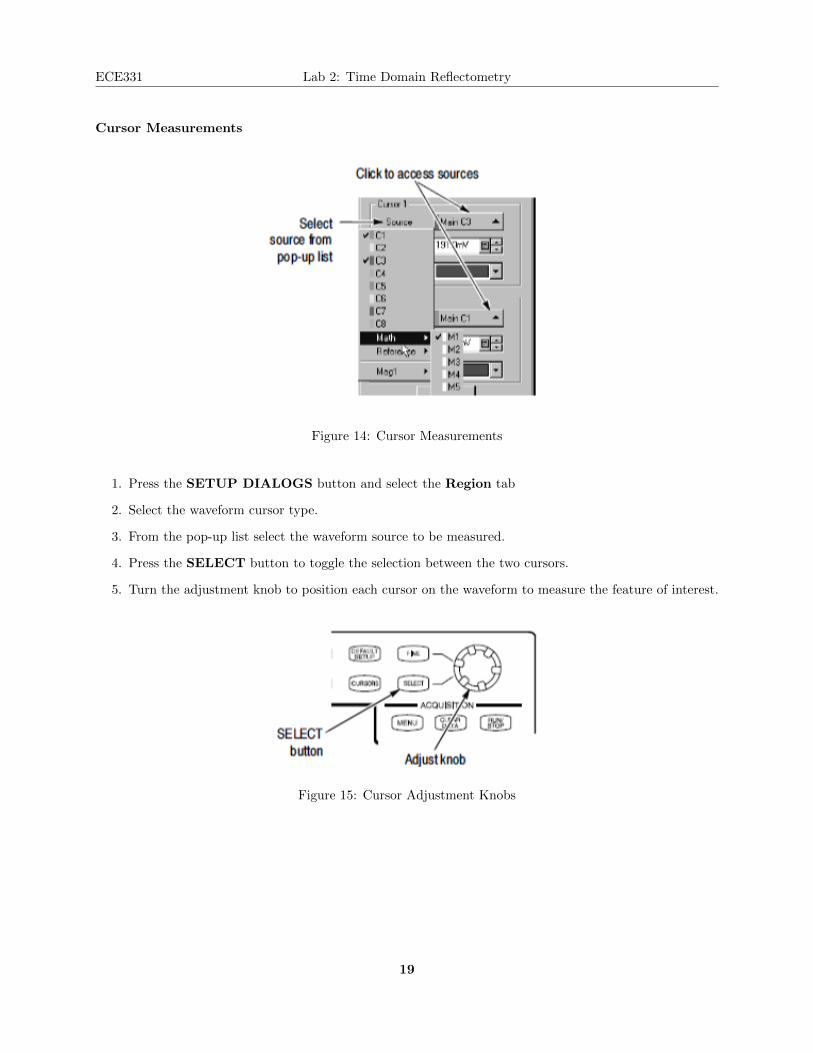
Cursor Measurements
Figure 14: Cursor Measurements
1. Press the SETUP DIALOGS button and select the Region tab
2. Select the waveform cursor type.
3. From the pop-up list select the waveform source to be measured.
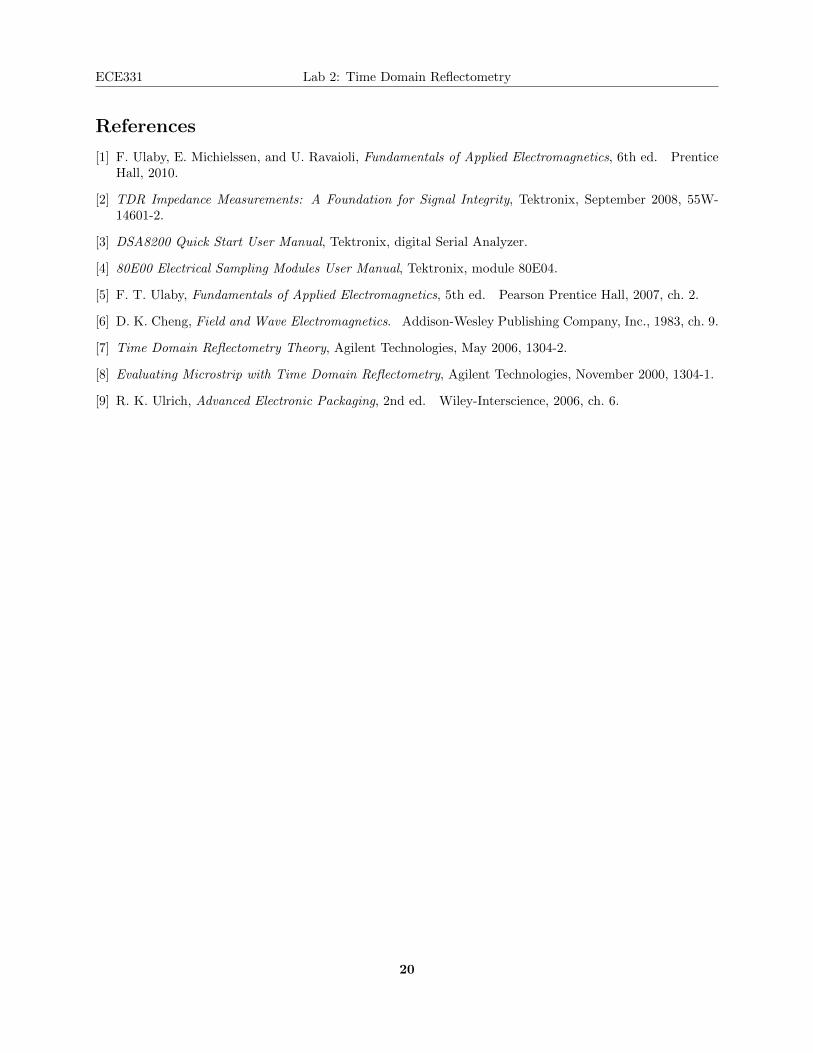
4. Press the SELECT button to toggle the selection between the two cursors.
5. Turn the adjustment knob to position each cursor on the waveform to measure the feature of interest.
Figure 15: Cursor Adjustment Knobs
19
ECE331 Lab 2: Time Domain Reflectometry
References
[1] F. Ulaby, E. Michielssen, and U. Ravaioli, Fundamentals of Applied Electromagnetics, 6th ed. PrenticeHall, 2010.
[2] TDR Impedance Measurements: A Foundation for Signal Integrity, Tektronix, September 2008, 55W-14601-2.
[3] DSA8200 Quick Start User Manual, Tektronix, digital Serial Analyzer.
[4] 80E00 Electrical Sampling Modules User Manual, Tektronix, module 80E04.
[5] F. T. Ulaby, Fundamentals of Applied Electromagnetics, 5th ed. Pearson Prentice Hall, 2007, ch. 2.
[6] D. K. Cheng, Field and Wave Electromagnetics. Addison-Wesley Publishing Company, Inc., 1983, ch. 9.
[7] Time Domain Reflectometry Theory, Agilent Technologies, May 2006, 1304-2.
[8] Evaluating Microstrip with Time Domain Reflectometry, Agilent Technologies, November 2000, 1304-1.
[9] R. K. Ulrich, Advanced Electronic Packaging, 2nd ed. Wiley-Interscience, 2006, ch. 6.
20