lab 2: multistory building lan: daisy chain versus...
TRANSCRIPT

OPNET IT Guru Lab 2, Page 1
Lab 2: Multistory Building LAN: Daisy Chain Versus Collapsed Backbone Architecture
Objective
This lab teaches the application performance of two different network architectures: Daisy Chain and Collapsed Backbone Network. The book shows a collapsed backbone data network in which there is a core switch in the basement equipment room. The core switch is linked directly to a workgroup switch on each floor. Another option is to link the switches in a daisy chain. In this approach, the basement core switch is linked directly to the first floor switch, the first floor switch is linked directly to the second floor switch, and so forth. This lab shows the application latency introduced by connecting building switches in different ways.
Overview
The First Bank of Paradise’s Operations building has 10 floors, each having many users connected to a 10Base-T workgroup switch in the floor’s telecommunications closet. The users share an Oracle server and seven file and print servers in the basement. In Scenario 1, the switches on each floor are daisy chained to the core switch in the basement. We will see that this daisy chain approach introduces high application latency to users on the highest floor. In Scenario 2, the daisy chain topology is retained, but the core switch is moved to the fifth floor. We will see that this reduces latency on the highest floor but increases it on the bottom floor. In Scenario 3, the core switch is kept in the basement, but a collapsed-backbone topology is used, in which the core switch in the basement is linked directly to the workgroup switch on each floor.
Lab Instructions Step 1: Open Lab 1
1. Start IT Guru. 2. Select File � Open…
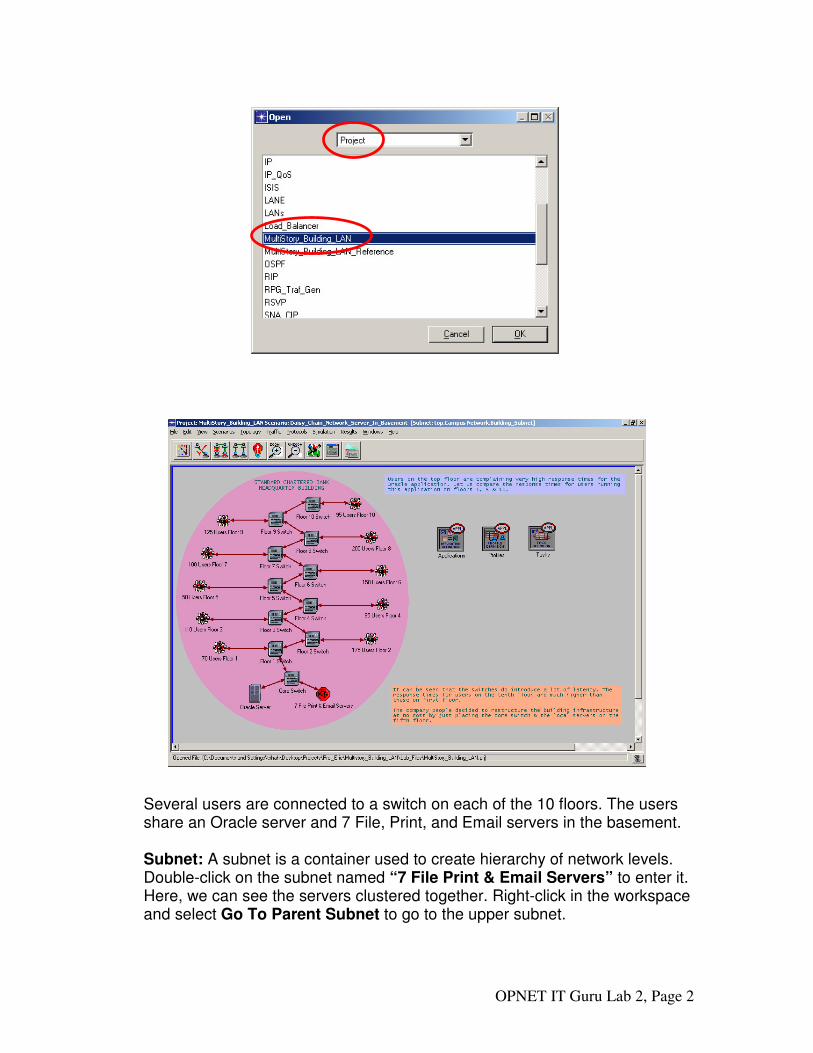
3. Scroll down to the project named MultiStory_Building_LAN, select it and
click OK.
OPNET IT Guru Lab 2, Page 2
Several users are connected to a switch on each of the 10 floors. The users share an Oracle server and 7 File, Print, and Email servers in the basement. Subnet: A subnet is a container used to create hierarchy of network levels. Double-click on the subnet named “7 File Print & Email Servers” to enter it. Here, we can see the servers clustered together. Right-click in the workspace and select Go To Parent Subnet to go to the upper subnet.
OPNET IT Guru Lab 2, Page 3
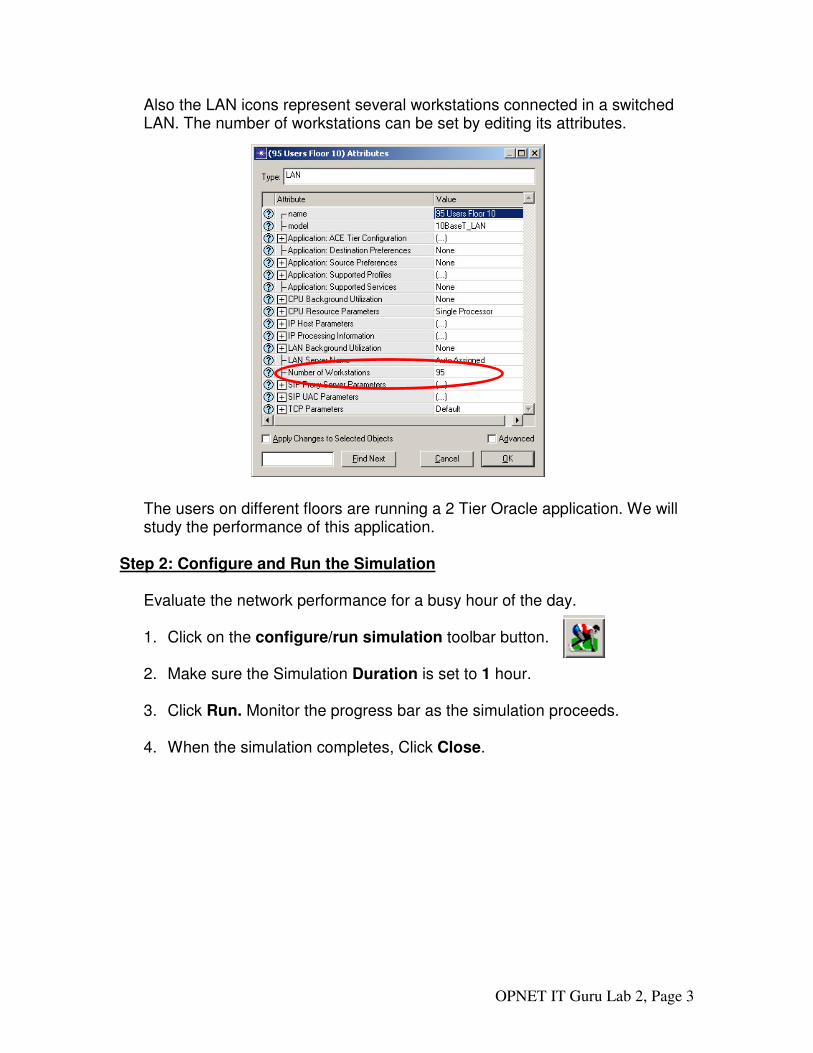
Also the LAN icons represent several workstations connected in a switched LAN. The number of workstations can be set by editing its attributes.
The users on different floors are running a 2 Tier Oracle application. We will study the performance of this application.
Step 2: Configure and Run the Simulation Evaluate the network performance for a busy hour of the day. 1. Click on the configure/run simulation toolbar button.
2. Make sure the Simulation Duration is set to 1 hour.
3. Click Run. Monitor the progress bar as the simulation proceeds.
4. When the simulation completes, Click Close.
OPNET IT Guru Lab 2, Page 4
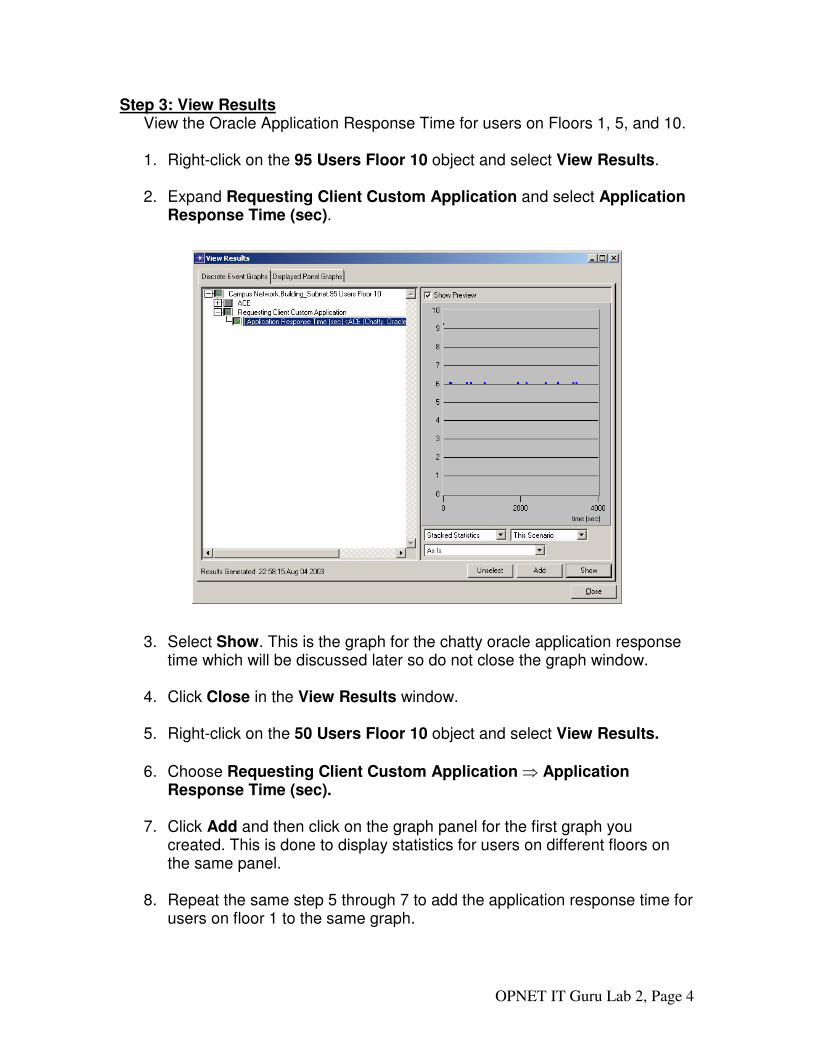
Step 3: View Results View the Oracle Application Response Time for users on Floors 1, 5, and 10. 1. Right-click on the 95 Users Floor 10 object and select View Results. 2. Expand Requesting Client Custom Application and select Application
Response Time (sec).
3. Select Show. This is the graph for the chatty oracle application response
time which will be discussed later so do not close the graph window.
4. Click Close in the View Results window. 5. Right-click on the 50 Users Floor 10 object and select View Results. 6. Choose Requesting Client Custom Application � Application
Response Time (sec).
7. Click Add and then click on the graph panel for the first graph you created. This is done to display statistics for users on different floors on the same panel.
8. Repeat the same step 5 through 7 to add the application response time for
users on floor 1 to the same graph.
OPNET IT Guru Lab 2, Page 5
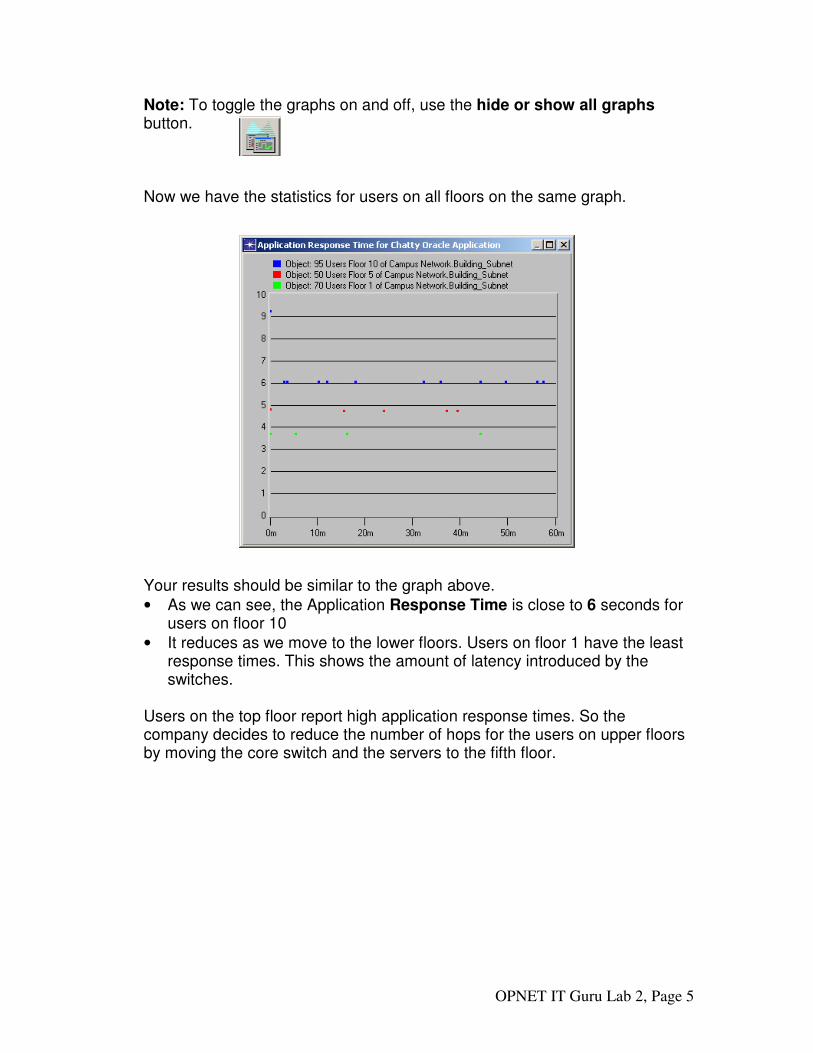
Note: To toggle the graphs on and off, use the hide or show all graphs button. Now we have the statistics for users on all floors on the same graph.
Your results should be similar to the graph above. • As we can see, the Application Response Time is close to 6 seconds for
users on floor 10 • It reduces as we move to the lower floors. Users on floor 1 have the least
response times. This shows the amount of latency introduced by the switches.
Users on the top floor report high application response times. So the company decides to reduce the number of hops for the users on upper floors by moving the core switch and the servers to the fifth floor.
OPNET IT Guru Lab 2, Page 6
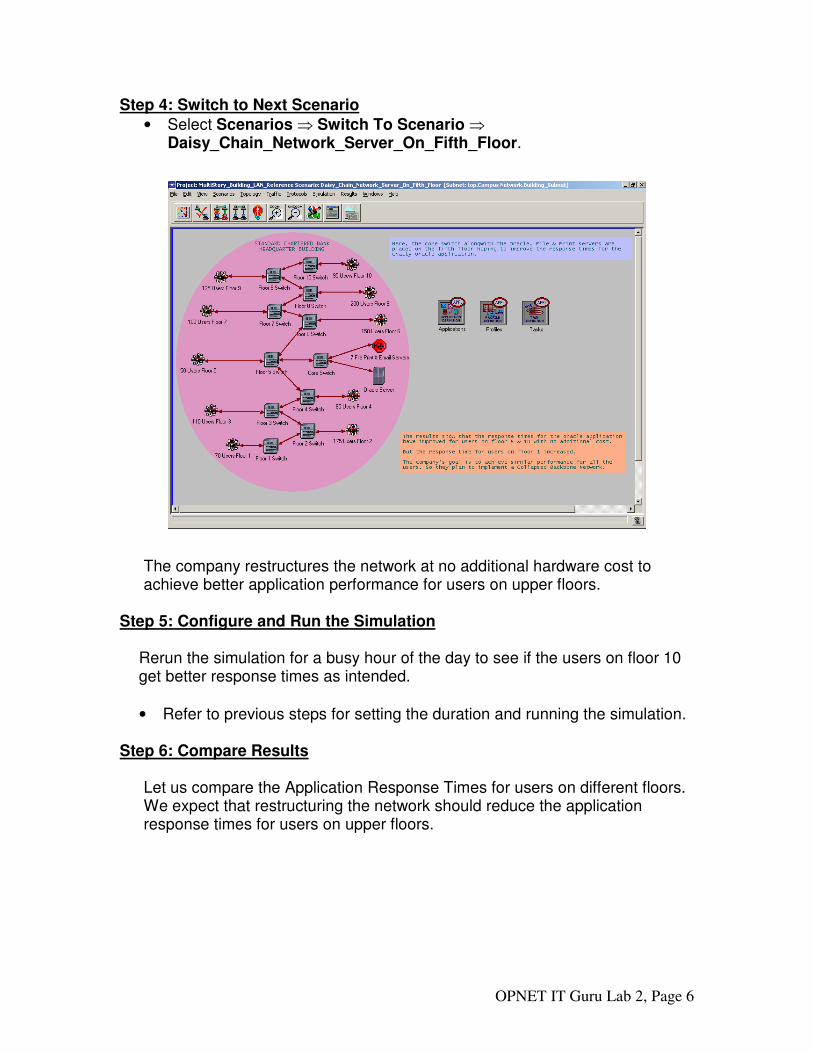
Step 4: Switch to Next Scenario • Select Scenarios � Switch To Scenario �
Daisy_Chain_Network_Server_On_Fifth_Floor.
The company restructures the network at no additional hardware cost to achieve better application performance for users on upper floors.
Step 5: Configure and Run the Simulation
Rerun the simulation for a busy hour of the day to see if the users on floor 10 get better response times as intended.
• Refer to previous steps for setting the duration and running the simulation.
Step 6: Compare Results
Let us compare the Application Response Times for users on different floors. We expect that restructuring the network should reduce the application response times for users on upper floors.
OPNET IT Guru Lab 2, Page 7
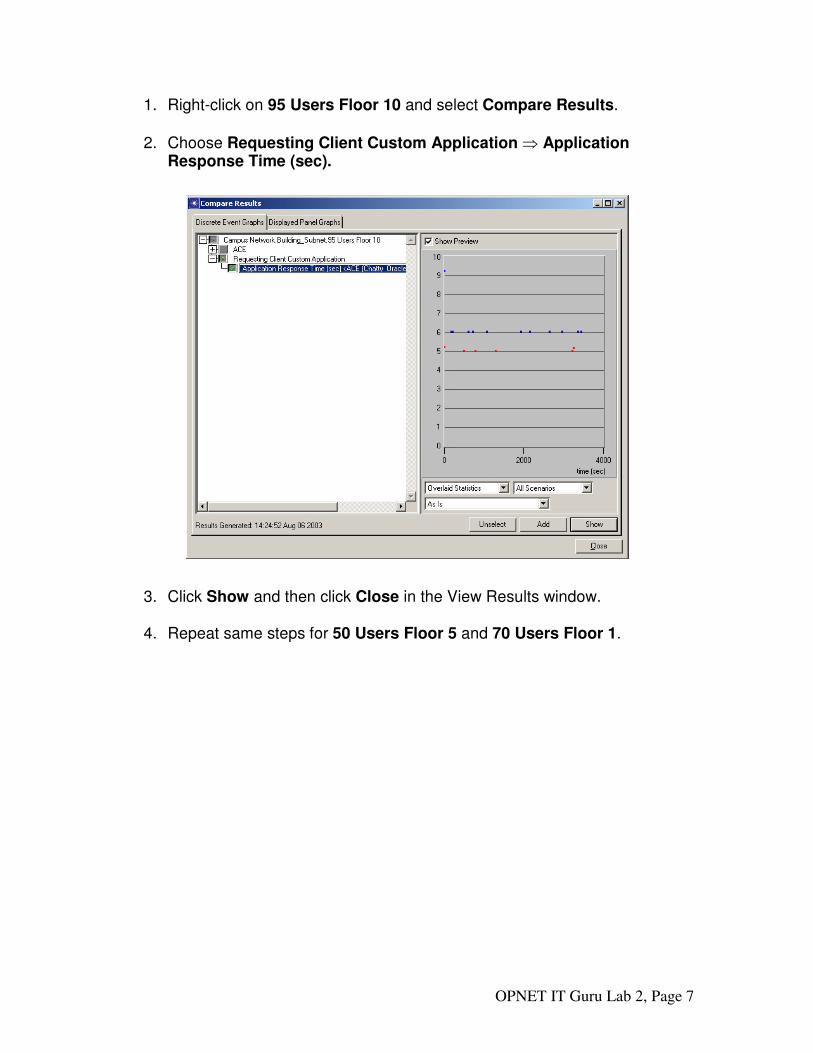
1. Right-click on 95 Users Floor 10 and select Compare Results. 2. Choose Requesting Client Custom Application � Application
Response Time (sec).
3. Click Show and then click Close in the View Results window.
4. Repeat same steps for 50 Users Floor 5 and 70 Users Floor 1.
OPNET IT Guru Lab 2, Page 8
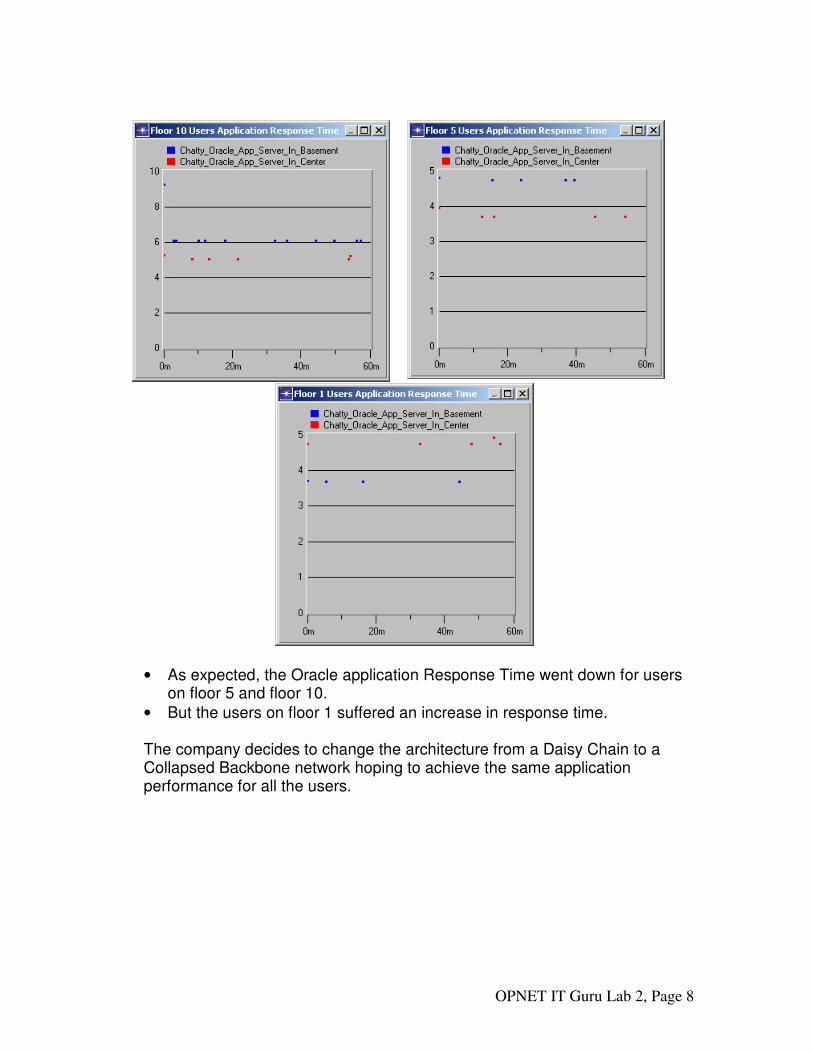
• As expected, the Oracle application Response Time went down for users
on floor 5 and floor 10. • But the users on floor 1 suffered an increase in response time. The company decides to change the architecture from a Daisy Chain to a Collapsed Backbone network hoping to achieve the same application performance for all the users.

OPNET IT Guru Lab 2, Page 9
Step 7: Switch to Next Scenario • Select Scenarios � Switch To Scenario �
Collapsed_Backbone_Network.
Step 8:Configure and run the simulation
Rerun the simulation for a busy hour to evaluate the network performance.
• Refer to previous steps for setting the duration and running the simulation.
Step 9: Compare Results
Let us compare the Response Times for all 3 scenarios. This will give us a clear picture of the best architecture for this kind of a network. Follow the same instructions as in Step 6 to get the graphs.

OPNET IT Guru Lab 2, Page 10
Conclusion
• Prepare a brief report giving your conclusions. Do not simply repeat the
results of the simulations. • Give your recommendation for what the firm should do. Consider relative
cabling costs in your recommendation.