la&-- b 3 b canada-manitoba soi1 survey b soils and...
TRANSCRIPT

L A & - - - -
3 1 b b CANADA-MANITOBA b Soi1 Survey b b b Soils and Salinity b Conditions in the ) Pasquia Lake Area b b 1 Report R-28
Government Gouvernment 19 of Canada du Canada Government of Manitoba
SOILS REPORT N0 . R28 1984
SOIL AND SALINITY CONDITIONS
in the
PASQUIA LAKE AREA
of
POLDER III, PASQUIA LAND SETTLEMENT PROJECT
by
G .F . MILLS, R .G . EILERS AND N . LINDBERG
CANADA-MANITOBA SOIL SURVEY
AGRICULTURE CANADA
MANITOBA DEPARTMENT OF AGRICULTURE
DEPARTMENT OF SOIL SCIENCE, UNIVERSITY OF MANITOBA------------------------------------------------------------------

PREFACE
This interim report and map dealing with soil and salinity conditions inPasquia Lake and adjacent areas of Polder III in the Pasquia Land SettlementProject is one in a series of soil survey reports covering special interestareas in Manitoba . These reports reflect an awareness by various governmentagencies that a knowledge of the development and distribution of the soils ofManitoba is the key to understanding their properties, behaviour and responseto management . This awareness requires that soils be described both in termsof their basic properties and the nature of the environmental setting in whichthey are found . Thus when areas such as Pasquia Lake are considered for agri-cultural development or other uses, the basic reference document is an accu-rate and reliable soil map .
The land resource information included in this study consists of a recon-naissance soil survey of 2 304 ha within Pasquia Lake, an area which was notsurveyed as part of the earlier survey of the Pasquia Map Area (Soil ReportNo . 11, 1960) . Proposed development of Pasquia Lake for agricultural use hascreated a need for soil information within the lake bed . In addition a moredetailed assessment of the salinity status of the soi~ls both in Pasquia Lakeand in surrounding areas of Polder III, is required to assess the impact ofproposed drainage improvements on soil salinity in the area . Some 9 583 ha ofland both in Pasquia Lake and in adjacent areas of Polder III were covered bythe special salinity study .
During the course of the Pasquia Lake survey a significant amount of sitespecific soil data was generated that for practical reasons cannot be includedin this report . These data are stored in the Canada Soil Information System(CanSIS) data bank . This computerized system of data management permits auto-mated manipulation and statistical evaluation of large volumes of data forsoil characterization and interpretations . In addition, the cartographic fileof CanSIS provides a capability to produce derived maps of various kindsquickly and inexpensively . The types of derived maps that can be generatedfrom the basic soil map include interpretations for agricultural capability,suitability for cereal and forage crops as well as a number of single featuremaps for soil characteristics such as drainage, texture of surface depositsand distribution of salinity . Various interpretive maps and single featurederivative maps can be made available on request to The Canada-Manitoba SoilSurvey, Department of Soil Science, Room 362, Ellis Building, University ofManitoba, Winnipeg, Manitoba, R3T 2N2 .
The Canada-Manitoba Soil Survey trusts that this report and accompanyingmap will be of value to all individuals and agencies involved with the use ofland within the study area .

ACKNOWLEDGMENTS
The soil and salinity survey of Pasquia Lake, and the salinity study of ad-jacent lands in Polder III of the Pasquia Land Settlement Project was conduct-ed as a joint research project of the Canada Department of Agriculture, Mani-toba Department of Agriculture and the Soil Science Department, University ofManitoba .
Acknowledgement is made to the following persons :
Mr . Harvey Anderson and field staff of the Engineering Construction Branch,Manitoba Department of Natural Resources, The Pas, for the excellent coopera-tion received during the field survey . The provision of all-terrain vehiclesmade possible the extensive field program carried out during this study .
Mr . Lloyd Wasylkoski and Mr . Keith Kristjanson for assistance during fieldsurveys .
R .E . Smith, Director, Canada-Manitoba Soil Survey for reviewing the manu-script . -
R . DePape for preparation of sketches and maps .
P . Haluschak, R . Mirza and J . Madden for laboratory analysis .
D . Sandberg for inputting the text, typing of tables and preparation of thereport .

SUMMARY
The soil survey of Pasquia Lake covers 2 304 hectares in Polder III of thePasquia Land Settlement Project at The Pas in west central Manitoba . The soilsurvey of Pasquia Lake and the salinity survey of the lake bed and adjacentareas of Polder III were conducted to determine the agricultural potential ofPasquia Lake and the impact of drainage improvement on salinity in the area .
Pasquia Lake consists of a partially drained delta marsh underlain by alevel to depressional fluviolacustrine plain . The marsh is inactive becausedrainage and flood control works in the area have modified the influx of for-eign waters carrying sediments to the marsh . Surface waters drain from pe-ripheral shoreline areas of the lake throughout the summer permitting harvestof native hay . Central portions of the marsh are inundated throughout theyear and support typical hydrophytiC vegetation . The marsh provides excellenthabitat for waterfowl production although present water levels in the lake bedare no longer optimum for production of fur bearers such as muskrat .
The soils in the surveyed area consist mainly of Rego Gleysols developed inclayey textured stratified fluvial and fluviolacustrine deposits . Surfacedrainage varies from poor to very poor . Under present drainage conditions thesoils in Pasquia Lake are non-saline . Soils in the west end of the lake bedhowever, do have higher than desirable salinity and comprise approximately 687hectares or 30 percent of the lake basin .
The entire lake bed is presently non-arable and rated in Agricultural Capa-bility Classes 6W and 7W . Drainage improvement to standards in place in Pold-ers I and II would increase the Agricultural Capability to Class 3W and 4W,suitable for growth of various annual crops and perennial forage crops . Slowdrainage and water-logging may always be a problem in some areas of the lakebed .
Proposed drainage improvement measures must take into account the potentialfor salinization in the west end of Pasquia Lake . Salinity analysis indicatethe source of salinity as being strongly saline areas immediately west of thelake bed . Management of both ground and surface waters is important in real-izing the potential agricultural capability of Pasquia Lake bed and adjacentlands in Polder III . Drainage works in Pasquia Lake should be designed tocontrol the spread of salinity from the local areas of high concentration lo-cated west of the lake . Soil management and cropping practices developed forsoil areas with potential for salinization are recommended .

CONTENTS
PREFACE . . . . . . . . . . . . . . . . . . . . . . . . . . . . . . . . . . ii
ACKNOWLEDGEMENTS . . . . . . . . . . . . . . . . . . , , , . , , . . . .
SUMMARY . . . . . . . . . . . . . . . . . . . . . . . . . . . . . . . . . . iv
PART page
1 . INTRODUCTION . . . . . . . . . . . . . . , , , . , , , , , , , , , , , 1
2 . GENERAL DESCRIPTION OF THE STUDY AREA . . . . . . . . . . . . . . , , . 2
Location of the Study Area . . . . . . . . . . . . . . . . . . , , . 2Relief and Drainage . . . . . . . . . . . . . . . . , , , . , , , , 2Bedrock Geology . . . . . . . . . . . . , . . , , , , , , , , , , , , 2Surficial Geology . . . . . . . . . . . . . . . , , , . , , , , , , 3Climate . . . . . . . . . . . . . . . . . . . . . . . . . . . . . . 5Vegetation . . . . . . . . . . . . . . . . . . . . . . . . . . . . . 5Soils . . . . . . . . . . . . . . . . . . . . . . . . . . . . . . 5Groundwater and Surface Water . . . . . . . . . . . . . , . . , , , 6Present Land Use . . . . . . . . . . . . . . . . , . , . , , . , , , 6
3 . METHODS OF INVESTIGATION . . . . . . . . . . . . . . . . . , , , . , , 7
Field Surveys . . . . . . . . . , 7Soil Sample Analyses . . . . . . . 8Interpretation of Salinity Analyses . . . . . . . . . . . . . , . . 10
4 . SOIL CONDITIONS IN PASQUIA LAKE . . . . . . . . . . . . . . . . , . . . 11
Surficial Materials in Pasquia Lake . . . . . . . . . . . . 11Description of Soil Series and Mapping Units in Pasquia Lake . . . . 18
BIG LAKE SERIES (1 542 ha) . . . . . . . . . . . . . , 18Big Lake Series, drained phase (322 ha) . . . . . . . . . . . . . 21Big Lake Series, modal phase (1 220 ha) . . . . . . . . . . . . . 21
LE PAS SERIES (724 ha) . . . . . . . . . . . . . . . . . . . . 21PASQUI A SERIES (8 ha) . . . * . . . , , . , , . . . , . . 2 3
Pasquia Series, Drained Phase (8ha)
. . . . . . . . . . . . . . 23
5 . SALINITY CONDITIONS IN POLDER III . . . . . . . . . . . . . . . . . . , 24
Concentration and Distribution of Soluble Salts . . . . . . . . . . 24Chemical Composition of Salts . . . . . . . . . , , , , , . , 31Surface Water and Groundwater Chemistry . . . . . . . . . . , . . 37Detailed Salt Load Transect . . . . . . . . . . . . . . , , . , , . 40

Summary of Soluble Salt Analysis . . . . . . . . . . . . . . . . . . 43
6 . SOIL CAPABILITY, PRODUCTIVITY AND MANAGEMENT . . . . . . . . . . . . . 45
Agricultural Capability Classification . . . . . . . . . . . . . . . 45Agricultural Capability . . . . . . . . . . . . . . . . . . . . . . 48Soil Productivity . . . . . . . . . . . . . . . . . . . . . . . . . 48Soil Management . . . . . . . . . . . . . . . . . . . . . . . . . . 48
REFERENCES . . . . . . . . . . . . . . . . . . . . . . . . . . . . . . . . 50
Appendix pace
A . GLOSSARY . . . . . . . . . . . . . . . . . . . . . . . . . . . . . . . 51
B . SOIL HORIZON DESIGNATIONS . . . . . . . . . . . . . . . . . . . . . . . 66
ORGANIC HORIZONS . . . . . . . . . . . . . . . . . . . . . . . 66MASTER MINERAL HORIZONS . . . . . . . . . . . . . . . . . . . 67LOWER-CASE SUFFIXES . . . . . . . . . . . . . . . . . . . . . 67
C . DESCRIPTION OF LANDFORMS . . . . . . . . . . . . . . . . . . . . . . . 73
GENETIC MATERIALS . . . . . . . . . . . . . . . . . . . . . . . . 7 3Unconsolidated mineral component . . . . . . . . . . . . . . . . 73Qualifying Descriptors . . . . . . . . . . . . . . . . . . . . . 74Organic component . . . . . . . . . . . . . . . . . . . . . . . . 74
GENETIC MATERIAL MODIFIERS . . . . . . . . . . . . . .~
. . . 75Particle size classes for unconsolidated mineral materials . . . 75Fiber classes for organic materials . . . . . . . . . . . . . . . 76
SURFACE EXPRESSION* . . . . . . . . . . . . . . . . . . . . . . 76Consolidated and Unconsolidated mineral surface classes . . . . . 76Organic surface classes . . . . . . . . . . . . . . . . . . . . . 77
D . DETAILED SOIL DESCRIPTIONS . . . . . . . . . . . . . . . . . . . . . . 78
E . SOLUBLE SALT ANALYSIS OF SOIL SAMPLES SUBMITTED TO THE MANITOBASOIL TESTING LABORATORY . . . . . . . . . . . . . . . . . . . . . 87
F . GUIDES FOR ASSESSING SOIL SUITABILITY FOR AGRICULTURE . . . . . . . . 101

LIST OF TABLES
Table a e
1 . Parent Materials, Soils and their Estimated Extent in Pasquia Lake . . 20
2 . Chemical composition of salts in Cross-section D-D1 . . . . . . . . . . 32
3 . Chemical composition of salts in Cross-section E-E1 . . . . . . . . . . 33
4 . Chemical composition of salts in Cross-section F-F1 . . . . . . . . . . 34
5 . Chemical composition of salts in Cross-section G-G1 . . . . . . . . . . 35
6 . Chemical Analysis of Waters in Polders II, III and IV . . . . . . . . . 38
Agricultural Capability Subclass Limitations . . . . . . . . . . . . . 46

LIST OF FIGURES
Fi gure a e
1 . Location of Study Area . . . . . . . . . . . . . . . . . . . . . . . . 4
2 . Location of Groundtruth Sites and Cross-Sections in Pasquia Lakeand Polder III . . . . . . . . . . . . . . . . . . . . . . . . . . 9
3 .
4 .
Near Surface Stratigraphy along Cross-Section A-A' Through PasquiaLake . . . . . . . . . . . . . . . . . . . . . . . . . . . . .
Near Surface Stratigraphy along Cross-Section B-B' Through PasquiaLake . . . . . . . . . . . . . . . . . . . . . . . . . . . . .
.
.
.
.
13
14
5 . Near Surface Str_atigraphy along Cross-Section C-C' Through PasquiaLake . . . . . . . . . . . . . . . . . . . . . . . . . . . . . . . 15
6 . Drill logs from the Central Portion of Pasquia Lake . . . . . . . . . 16
7 . Drill logs from the western portion of Pasquia Lake . . . . . . . . . 17
8 . Average Electrical Conductivity (mS/cm) to 1 .2M depth . . . . . . . . 26
9 . Electrical Conductivity (mS/cm) . . . . . . . . . . . . . . . . . . . 27
10 . Electrical Conductivity (mS/cm) . . . . . . . . . . . . . . . . . . . 28
11 . Electrical Conductivity (mS/cm) . . . . . . . . . . . . . . . . . . . 29
12 . Electrical Conductivity (mS/cm) . . . . . . . . . . . . . . . . . . . 30
13 . Drill log and chemical analysis of Pasquia series, moderately,saline phase (Site 178) . . . . . . . . . . . . . . . . . . . . . . 36
14 . Detailed Salt Study Through Section of Le Pas Map Unit(SW14-54-28W) . . . . . . . . . . . . . . . . . . . . . . . . . . . 42
15 . Family particle-size cla.sses . . . . . . . . . . . . . . . . . . . . . 65
16 . Soil Textural Classes . . . . . . . . . . . . . . . . . . . . . . . . 65

PART 1
INTRODUCTION
Proposals for drainage upgradingin Polder III of the Pasquia LandSettlement Project at The Pas haveidentified a need for additionalstudies to determine the nature anddistribution of soils in PasquiaLake . A progress report submitted bythe agriculture sector of the WorkingGroup on Pasquia Land SettlementProject in September 1981 indicatedthat a full analysis of benefits fromdrainage is not possible until fur-ther soil studies are completed, par-ticularly a more accurate assessmentof the severity and nature of poten-tial salinity problems- in the area .
The objectives of this soil inves-tigation were :
1 . To map and classify the soils inPasquia Lake .
2 . To assess the salinity status ofsoils in Pasquia Lake and sur-rounding areas of Polder III .
3 . To assess the possible impacts ofimproved drainage on the agricul-tural potential of soils in Pasq-uia Lake .
PART 2
GENERAL DESCRIPTION OF THE STUDY AREA
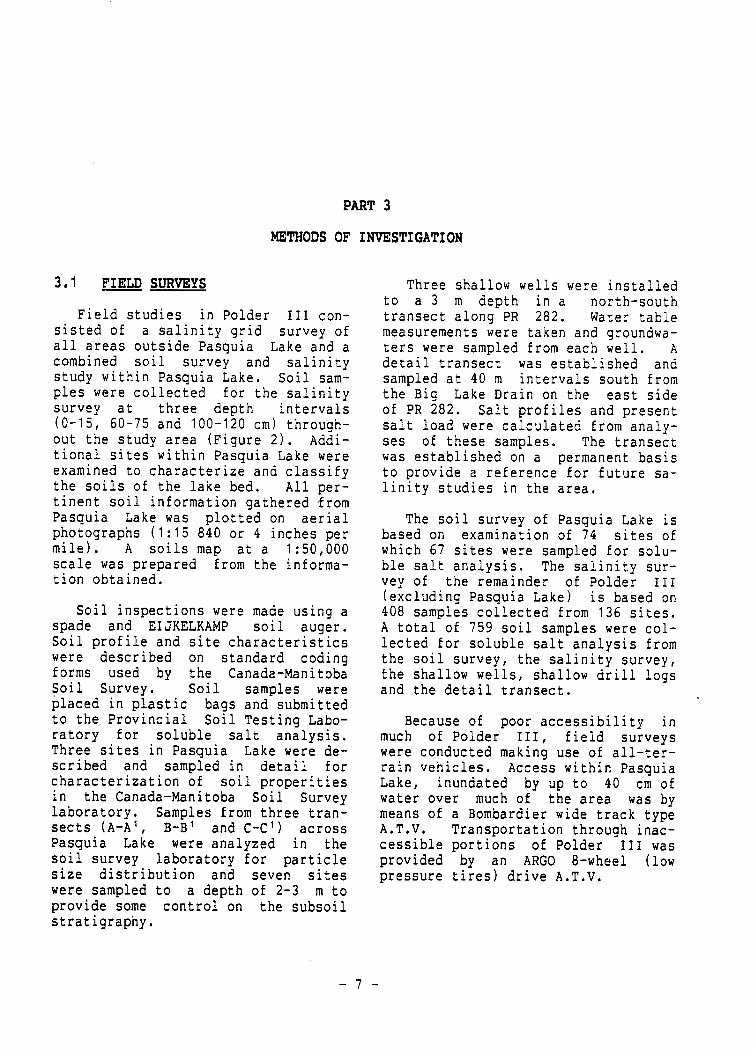
2 .1 LOCATION OF THE STUDY AREA
Pasquia Lake is located in PolderIII in the southern portion of thePasquia Land Settlement Project atThe Pas in west-central Manitoba(Figure 1) . The study area includesTownship 54, Range 27, and part ofTownship 54, Range 28, all west ofthe Principal Meridian . The areacovered by the soil survey is 2 304hectares ; the area covered by the sa-linity survey is 9 583 hectares .
2 .2 RELIEF AND DRAINAGE
The portion of Polder III examinedin this study is characterized bylevel to depressional fluvial andfluviolacustrine deposits rangingfrom sand to clay in texture . Sur-face runoff from the study area isslow due to the lack of relief andinternal soil drainage is slow due tothe high clay content of the soils .Elevations in the study area rangefrom 258 m a .s .l . (860 feet a .s .l .)along Nels Creek in the south to 255m a .s .l . (849 feet a .s .l .) in thecentral part of Pasquia Lake . Localrelief is greatest near the leveesand the former shoreline of PasquiaLake . The levee along Nels Creek is1 to 3 meters in height and the Pasq-uia Lake shoreline and levees alongsmaller streams range from 0 .5 to 2meters in height . The major portionof Polder III is level to depression-al and Pasquia Lake is entirely de-pressional . Surface waters pond in
Pasquia Lake throughout most years .Natural water movement through thebasin is extremely slow from west toeast as the general gradient of thelake bed is less than 0 .1 m/km be-tween the inlet and outlet .
The natural drainage throughoutmost of Polder III is slow . The fewstream channels in the Polder gener-ally do not facilitate surface drain-age because of the damming effect ofthe built up levees . Drainage inportions of Polder III has been im-proved as part of the development ofthe Pasquia Land Settlement Project .The initial drainage plan for theProject considered Pasquia Lake to bea retention basin for excess waters .Consequently, reclamation of PasquiaLake was not undertaken and a largeproportion of the lake bed is coveredwith water throughout the year .
2 .3 BEDROCK GEOLOGY
The study area is underlain bylimestone and dolostone of Paleozoicage at depths of 25 m . Indicationsare that under Pasquia Lake, thedepth to bedrock ranges from 40 m to65 m (Rutulis, 1981) . Stratigraphicrelationships between the variousbedrock types in the study area aredescr~ibed in the report on Groundwa-ter Availability in The Pas Area(Pederson, 1973) .

2 .4 SURFICIAL GEOLOGY
The Pasquia Lake study area issituated within the Saskatchewan Del-ta subsection of the Cumberland LakeLowland . The portion of the Saskat-chewan Delta in the study area is alevel to depressional plain charac-terized by weakly to moderately cal-careous, dominantly clayey, fluvialand fluviolacustrine (alluvial) de-posits . Very slight local relief oc-curs along the shorelines of the lakebed and on gently undulating levees .
The bedrock in the study area isoverlain by glacial till ranging inthickness from a few meters to about30 m . The till is overlain by la-custrine clay which ranges from 25 m
to 40 m thick in the area under Pasq-uia Lake . The lacustrine clay bedsare overlain by fluvial deposits con-sisting mainly of clay and silt ma-terials . The fluvial deposits areabout 10 m thick throughout most ofthe study area . Stratigraphic rela-tionships between the surface fluvialdeposits and the underlying lacust-rine clay, glacial till and bedrockis described in the reports on theGroundwater Availability in The PasArea (Pederson, 1973) and the Ground-water Conditions in the Pasquia LakeArea (Rutulis, 1981) . The nature anddistribution of the near surface flu-vial deposits have been described inthe Soils Report for the Pasquia Area(Ehrlich et . al ., 1960) .

U. S. A .
Figure 1 : Location of Study Area

2 .5 CLIMATE
The climate of the Pasquia Lakearea has been described by Koppen asa Dfb type (Koppen, 1936) . The areahas summer temperatures that arewarmer and winter temperatures thatare colder and an annual range thatis much greater than the world aver-age for the same latitude . The areais subhumid with a definite summermaximum of precipitation .
The meteorological station at ThePas airport is the only long term re-cording station available close tothe study area (AES, 1982) . Mean an-nual air temperature based on the1951-1980 climate normals is -0 .6°C .The warmest month is July and thecoldest month is January with averagetemperatures of 17 .7°C and -22 .7°Crespectively . Mean annual precipita-tion is 454 mm with approximately 63percent occurring during the growingseason (May 1 to September 30), Julyis the wettest month (70 .2 mm) andFebruary the driest month (15 .4 mm) .
Other climatic variables are alsoimportant to plant growth . Climaticdata from The Pas indicate that theaverage frost free period is 114 daysbased on 0°C . The average date ofthe last spring frost is May 27 andthe date of the first fall frost isSeptember 19 . The killing frost freeperiod based on -2 .2°C more closelyrepresents the actual growing seasonavailable fro agriculture crops . Thekilling frost-free season estimatedfrom analysis of climatic data fromThe Pas is 133 days with the date ofthe last spring killing frost averag-ing May 14 while the first fall kill-ing frost occurs on the average onSeptember 25 . Growing degree daysprovide an indication of heat accumu-lation for crop growth . Based on the1951-1980 climate normals, the areaaround The Pas accumulates 1361 grow-ing degree days above 50°C .
Soil temperature studies in Mani-toba (Mills et . al ., 1977) indicatethe area around The Pas is classifiedin the moderately cold Cryoborealclimatic zone . This is an area char-acterized by a mean annual soil temp-erature between 2°C and 5 .5°C and amean summer soil temperature between8°C to less than 10°C based on soiltemperatures measured at a depth of50 cm .
2 .6 VEGETATION
The Pasquia Lake basin is charac-terized mainly by marsh vegetation .The dominant species are sedge ( Carex§p .), reedgrass ( Calamagrostis sp .),bullrushes ( Scirpus sp .), and cattail( Typha sp .)on slightlVegetation
. Clumps of willow oy better drained sion peripheral areas of
ccurtes .the
lake basin has been modified by fireand haying and is characterized bysedges, reedgrasses, and whitetop( Scoachloa sp .) .
2 .7 SOILS
The soils of Polder III exclusiveof Pasquia Lake and Big Lake havebeen mapped at a scale of 1 :63 360and described in Soil Report No . 11for the Pasquia Map Area (Ehrlich et .al ., 1960) . The soils in Polder IIIhave developed in recent fluvial (al-luvium) and fluviolacustrine depositsranging from sand to clay in texture .The dominant mineral soils are poorlydrained Rego Gleysols ; minor areas ofimperfectly drained Regosol soils oc-cur as narrow bands on the -lightertextured and drained levees adjacentto larger streams . Extensive areasof organic soils occur west of BigLake . The organic soils are mainlyMesisols developed on moderately de-composed sedge peat .

The soils of Pasquia Lake are de-scribed and classified as part of thepresent study . The soil map of Pasq-uia Lake at a scale of 1 :50,000 ispresented at the back of this report .
2 .8 GROUNDWATER AND SURFACE WATER
Groundwater characteristics of ThePas area have been described inGroundwater Availability Studies Re-port No . 9 (Pederson, 1973) . Ground-water conditions in the Pasquia Lakearea have been summarized and inter-preted to evaluate the effect ofdraining the lake on groundwater andsoil conditions in the drained areaand vicinity (Rutulis, 1981) .
Surface water and shallow ground-water in Polder III is generallyfresh . Deep groundwater systemsfound in underlying bedrock aquifersconsist of 2 main systems, a freshwater system recharging from thenortheast and a saline flow systementering the area from the southwest .Deep layers of lacustrine and fluvio-lacustrine sediments effectively sealmost of the deep groundwater flowsystems from the surface . Upwardmovement of saline waters appears tooccur where the lacustrine clay isthin . Upward movement of this ground-water has affected soils in Polder IVand the southwest portion of PolderIII . In addition, some shallow wellsin this area are also saline . Someobservations on the extent and per-sistence of surface waters in PasquiaLake are included in the descriptionof soil conditions in the lake basin .Chemical characteristics of surfacewater and groundwater sampled as partof this study are described in thesection on surface water and ground-water chemistry .
2 .9 PRESENT LAND USE
Drainage improvement in portionsof Polder III has been sufficient topermit cereal and improved foragecrop production . Poorly and verypoorly drained areas bordering thelake basin are used for native hayproduction and limited native grazingfor cattle production . Use of thesepoorly drained soils for such purpos-es is seasonal as they are often toowet for grazing or haying in earlysummer .
Most of Pasquia Lake supportsmarsh vegetation providing suitablehabitat for water fowl production .The lake is also used as a stagingarea for migrating water fowl . Pasq-uia Lake has been an excellent pro-ducer of muskrats in past years whenthere was a sufficient water level toover winter muskrats . Trapping hasbeen carried out in Pasquia Lake bylocal farmers and townspeople fromThe Pas (Robertson and Jones, 1981) .
PART 3
METHODS OF INVESTIGATION
3 .1 FIELD SURVEYS
Field studies in Polder III con-sisted of a salinity grid survey ofall areas outside Pasquia Lake and acombined soil survey and salinitystudy within Pasquia Lake . Soil sam-ples were collected for the salinitysurvey at three depth intervals(0-15, 60-75 and 100-120 cm) through-out the study area (Figure 2) . Addi-tional sites within Pasquia Lake wereexamined to characterize and classifythe soils of the lake bed . All per-tinent soil information gathered -fromPasquia Lake was plotted on aerialphotographs (1 :15 840 or 4 inches permile) . A soils map at a 1 :50,000scale was prepared from the informa-tion obtained .
Soil inspections were made using aspade and EIJKELKAMP soil auger .Soil profile and site characteristics
Three shallow wells were installedto a 3 m depth in a north-southtransect along PR 282 . Water tablemeasurements were taken and groundwa-ters were sampled from each well . Adetail transect was established andsampled at 40 m intervals south fromthe Big Lake Drain on the east sideof PR 282 . Salt profiles and presentsalt load were calculated from analy-ses of these samples . The transectwas established on a permanent basisto provide a reference for future sa-linity studies in the area .
were described on standard coding the soil survey, the salinity survey,forms used by the Canada-Manitoba the shallow wells, shallow drill logsSoil Survey . Soil samples were and the detail transect .placed in plastic bags and submittedto the Provincial Soil Testing Labo- Because of poor accessibility inratory for soluble salt analysis .Three sites in Pasquia Lake were de-scribed and sampled in detail forcharacterization of soil properitiesin the Canada-Manitoba Soil Surveylaboratory . Samples from three tran-sects (A-A', B-B' and C-C') acrossPasquia Lake were analyzed in thesoil survey laboratory for particlesize distribution and seven siteswere sampled to a depth of 2-3 m toprovide some control on the subsoilstratigraphy .
The soil survey of Pasquia Lake isbased on examination of 74 sites ofwhich 67 sites were sampled for solu-ble salt analysis . The salinity sur-vey of the remainder of Polder III(excluding Pasquia Lake) is based on408 samples collected from 136 sites .A total of 759 soil samples were col-lected for soluble salt analysis from
much of Polder III, field surveyswere conducted making use of all-ter-rain vehicles . Access within PasquiaLake, inundated by up to 40 cm ofwater over much of the area was bymeans of a Bombardier wide track typeA .T .V . Transportation through inac-cessible portions of Polder III wasprovided by an ARGO 8-wheel (lowpressure tires) drive A .T .V .

3 .2 SOIL SAMPLE ANALYSES
The soil samples for the salinitysurvey were analyzed by the Provin-cial Soil Testing Laboratory at theUniversity of Manitoba . The soilanalyses included pH, electrical con-ductivity, calcium, magnesium, sodiumand potassium cations ; sulfate, chlo-ride and bicarbonate anions and mois-ture percent at saturation . Allanalysis were conducted on a saturat-ed paste extract according to stan-
dard and routine analytical proce-dures . The soil analyses report fromthe Soil Testing Laboratory is pre-sented in Appendix E .
Selected samples from the soilsurvey of Pasquia Lake were analyzedby the Soil Survey laboratory forparticle size distribution in accor-dance to standard procedures . Theresults of this analyses provide con-trol on the range in soil textureused to describe soil mapping units .

DEEP DRILL SITESITE DESCRIPTIONSITE DESCRIPTION ANDSALINITV SAh1PLE
SALINITY SAMPLE
DETAIL SOIL DESCRIPTIONWELL
PASOUIA LAKE- - SOIL CROSS-SECTION---- SALINITY CROSS-SECTION
Miles
1000
Metres
R. 26
R .28 R .27
TP 54
TP 55
Figure 2s Location of Groundtruth Sites and Cross-Sections in Pasquia Lakeand Polder III
3 .3 INTERPRETATION OF SALINITYANALYSES
All soils contain salts dissolvedin the soil solution . Soluble saltsin soil are transported by water .The concentration of salt in the soilsolution increases as water movesalong the flow path . It also in-creases as water is removed from thesoil by evaporation and transpira-tion . In the Pasquia Lake basin lossof water through these processes re-sults in a suction gradient in thesoil that produces upward movement ofwater and dissolved salt and subseq-uent concentration of soluble saltson or near the soil surface . Underthese conditions the direction of in-creasing salt concentration is alsoan indicator of the direction ofgroundwater movement .
The most common method of investi-gating salinity is to determine theelectrical conductivity (EC) of thesoil solution . The EC value increas-es with increasing concentrations ofdissolved salts . The distributionpattern of EC is indicative of thedirection of groundwater movement .The type of salinity is determined bythe kind and concentration of the ma-jor soluble salts in solution .
The soluble salt content ofgroundwater is determined by the so-lubility of the particular salt in
water . Highly soluble salts such assodium chloride dissolve rapidly andremain in solution longer than otherless soluble salts . The chloride ionconcentration and distribution pat-tern is often used as a naturaltracer in groundwater studies to de-termine groundwater flow directionand rate . Chloride ions are goodtracer ions because they are not af-fected by ion exchange or precipita-tion processes in soils and becausemost soils in Manitoba generally con-tain low levels of chloride salts .
The distribution patterns of solu-ble ions can also be used as an indi-cator of groundwater movement . Thechemical properties of groundwaterare determined in part by the chemis-try of the flow medium or geologicdeposits through which it moves . Acomparison of the chemistry of thesoil solution to that of groundwatercan often show whether or not ground-waters have affected the soils par-ticularly if the ionic composition ofthe groundwaters is chemically dif-ferent from that of the soil solu-tion . In such cases the presence offoreign ions in the soil solution isinterpreted as evidence that ground-water flow from a different sourcearea has moved into the soil . Thisprocedure has been used extensivelyin tracer studies and has been usedto interpret the salinity analysis inthis study .

PART 4
SOIL CONDITIONS IN PASQUIA LAKE
Pasquia Lake consists mainly of aDelta Marsh underlain by a level todepressional fluviolacustrine plain .The marsh is inactive because drain-age and flood control works in thesurrounding areas have largely elimi-nated the influx of surface watertransporting sediment into the area .Although natural drainage in the lakehas been altered as part of the agri-cultural development of the Pasquiaarea, central portions of the marshremain inundated throughout the yearand support typical hydrophytic vege-tation . Surface waters usually drainfrom peripheral shoreline areas ofthe lake during the summer thus per-mitting harvest of native hay forlivestock in the Pasquia area . Thevegetation in these areas has beenaffected by haying operations andfire .
The soils in Pasquia Lake wereclassified according to the CanadianSystem of Soil Classification and aregrouped into three soil series . Fur-ther classification was made in eachseries to recognize variation inpresent drainage conditions . Thedistribution of these soils is indi-cated on the Soil Map of PasquiaLake . Representative soil profilesare described in the section on SoilSeries and Mapping Units .
In the numerous tests for saltsconducted on the soils of PasquiaLake, the average electrical conduc-tivity measurements of soil profilesto 120 cm exceeded 2 mS/cm in threeareas and exceeded 4 mS/cm at onlyone site . These data indicate thatsoils in the lake basin are either
nonsaline or only slightly affectedby soluble salts . Consequently sa-line phases were not recognized onthe soil map . However, a discussionof the impact of drainage improvementon soil salinity in Pasquia Lake ispresented as part of the second ob-jective of this study . Discussion ofthe salinity analyses from PasquiaLake and the surrounding areas inPolder III is included in the sectionon Salinity Conditions .
4 .1 SURFICIAL MATERIALS IN PAS UIALAKE
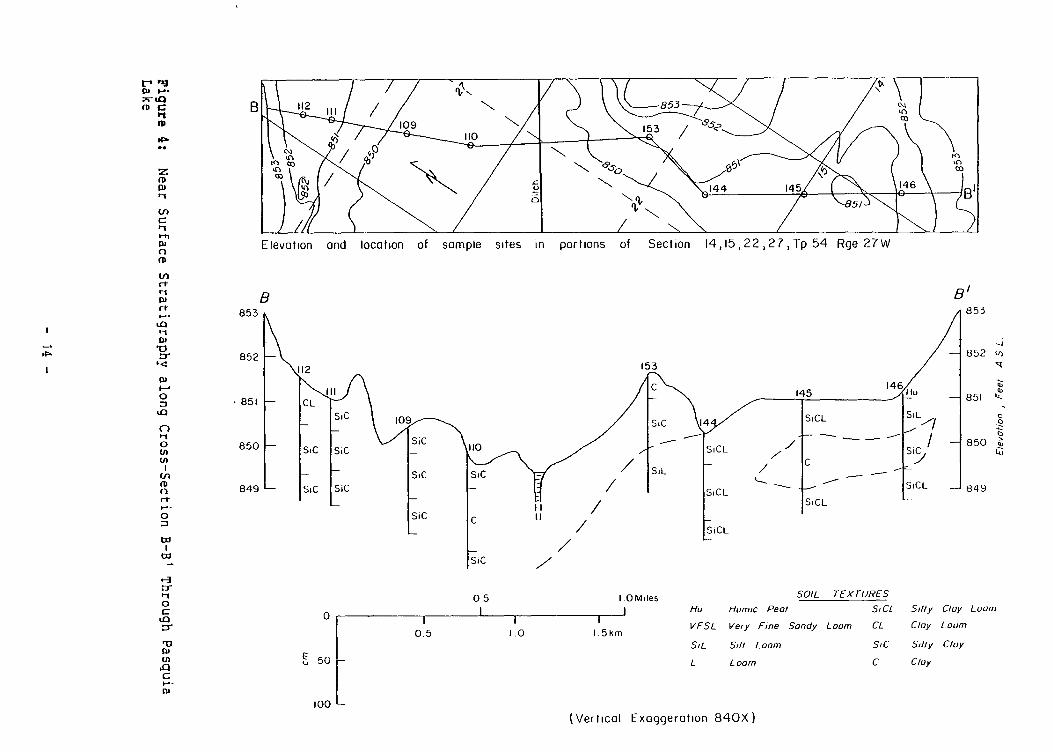
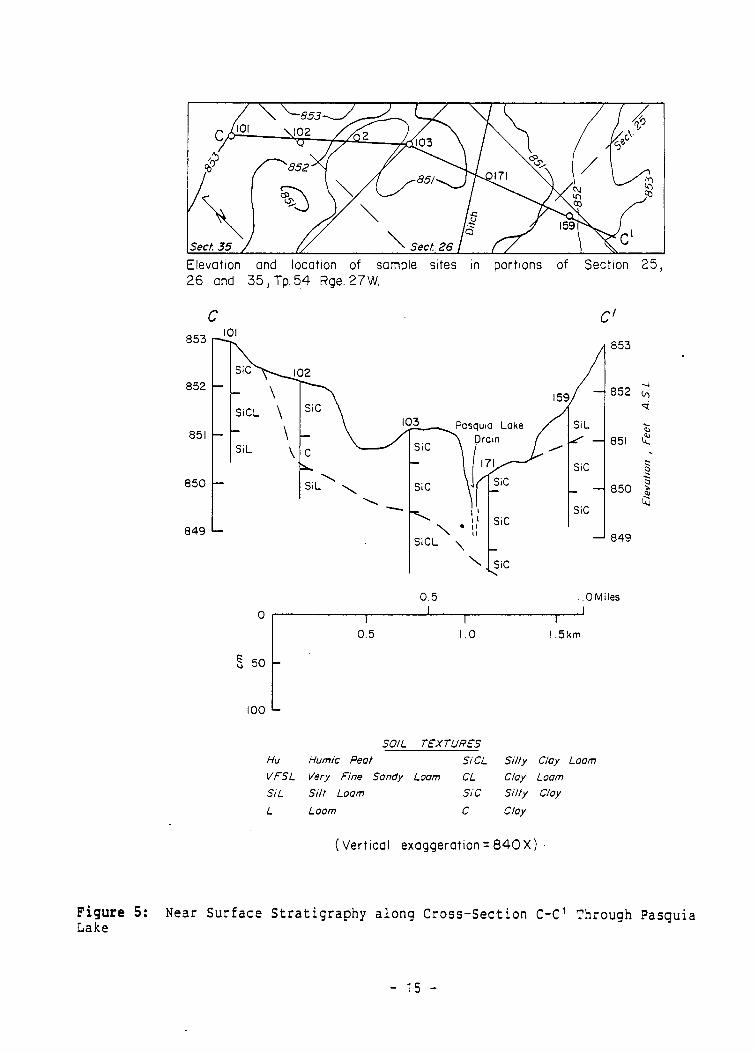
Soil materials in Pasquia Lakeconsist entirely of recent fluvialand fluviolacustrine deposits . Thenear surface stratigraphy of thesedeposits is shown in cross-sectionA-A'? B-B' and C-C' (Figures 3,4 and5 respectively) . Gleysolic soilswith weak horizon development occuron these sediments under drainageconditions ranging from poor to verypoor . Excess water and lack of aera-tion produce anaerobic conditionswhich in turn inhibit soil profiledevelopment . The roots of hydrophy-tic vegetation have produced, how-ever, some soil structure to a depthof 30-35 cm below the mineral soilsurface . Soil structure below thisrooting zone is absent or massive incharacter . Clayey strata below therooting zone are virtually imperme-able . The soils are stratified withtextures ranging from fine sand toclay . Sandy strata to a 1 metredepth are thin and very discontinu-ous . The dominant soil textures are
11

clayey with clay and silt particlesize comprising greater than 90 per-cent of the materials . The propor-tion of clay and silt materials areusually codominant .
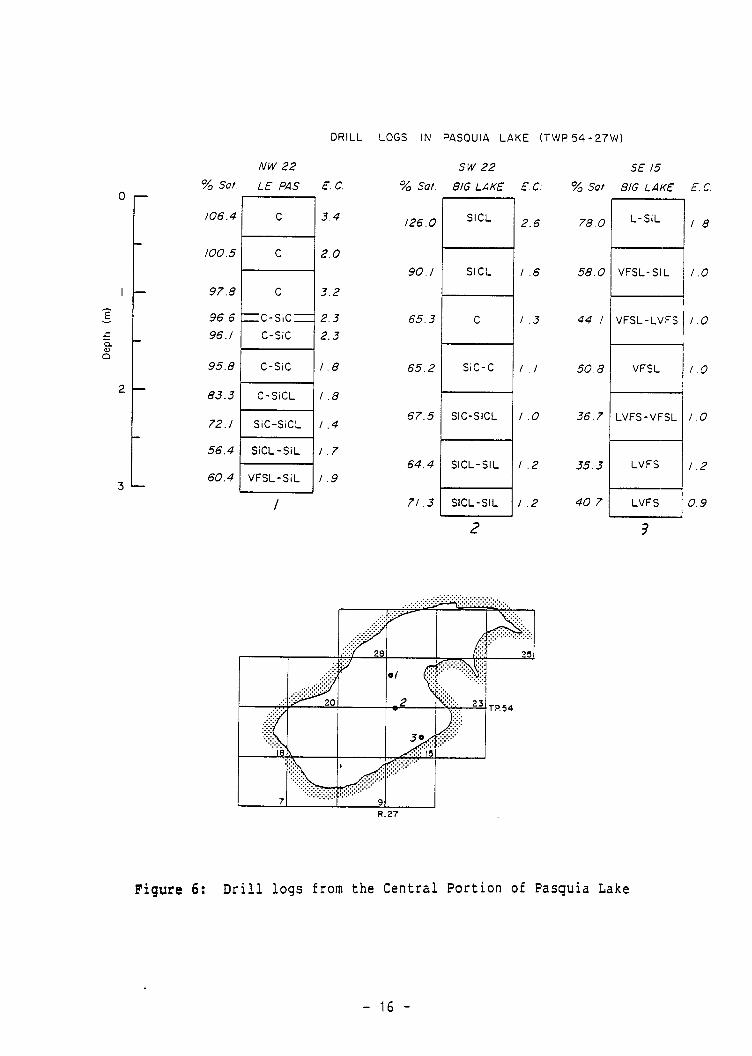
Drill logs from selected locationsin Pasquia Lake are shown in Figures6 and 7 . These logs indicate thestratigraphy of the soil materials toa depth of 3 M . All sites are char-acterized by stratified materialsusually decreasing in clay content at
depths below 1 M . Stratification atlower depths ranges from layers ofloamy very fine sand to silty clayloam with very fine sand and siltdominating at sites 1 and 3 (Figure6) and sites 4,5 and 7 (Figure 7) .The depth at which the coarser tex-tured layers are encountered variesthroughout the lake basin . Howeversandy and silty materials appear, tooccur at lower depths in both the BigLake and Le Pas soils .

Elevations and location of sample sites in portions of Sec tion 9,16,17,20, Tp.54 Rge.27W .
A At853.0 853J
852 v852 a
127 136SiCL az
851 - Hu 4851
Sic \126 124125 135 cSiL
50 -Hu ic~
SiCL c134, csic sic
130\
- 850 l4Hu /
Sicsic I-1 /
'C I _=! sic CL sic C849 - C IIC II 849
VFSL-C C c
sicSiL
sic
sic /SiL
0.5 I .OMiles SOlL TEXTURES
0 Nu Humic Peot 51CL Silty Cloy Loom
0.5 1 .0 I .Skm VFSL Very Fine Sondy Loom CL Cloy Loom
SiL Silt Loom sic Silty Cloy
L Loom C Cloy
100( Vertical Exaggeration 840X )
Figure 3 : Near Surface Stratigraphy along Cross-Section A-A' Through PasquiaLake
rftja b--x- wmnro
za
CrtMaro
a B853 853- "
rYa
852 ui852112 153 Q
III0 851 CLC 145 14 ~" 851 '~
'p sic 109 sic 14SiL// oSiCL
sic850 sic Sic _ 110 SiCL ~~ SIC850
Cn SiC Sir H / SiLc
iCL J~~ ~~~rO I L 84gI~849 sic Sit- SiCL
FS
n l-r* / CLr- IIO sic 11 ~-C
ISiCLtAl
Ou
nOCkO
a
CI,-
pi
sic
05 I .OMiles SOIL TEXTURESNu Numic Peol Si CL Silly Cloy Loom
0 I I 1 VFSL Very Fine Sondy Loom CL Cloy Lourn0.5 1 .0 1 .5km
SiL Sill Loom sic Silly Cluy
50 r L L oom C Cluy
100 L
( Vertlcal Exaggerotlon 840X )
Elevation and location of sample sites in portions of Section 25,26 and 35 , Tp . 54 Rge . 27 W.
C C101853 r- 853
sic ' 102852 852 c~159
SiCL sic Q103 Pasquia Lake L
851 \ Drain ~ _1 851 LZSiL C SiC171
r
csic 0850 ~SiL sic S i C 850
Wsic
sic849
rS,CLJ 849
0
50
100
0.5 I .0 Miles1 J
0 .5 1 .0 1 .5km
SOIL TEXTURESHu Humic Peot SiCL Silty CloyVFSL Very Fine Sandy Loom CL Cloy LoomSiL Silt Loom sic Silly Cloy
L Loom C Cloy
(vertical exaggeration= 840X)
Loom
Figure 5 : Near Surface Stratigraphy along Cross-Section C-C' Through PasquiaLake
- 15 -
0 -% Sot.
NW 22
LE PAS
DRILL
E. C.
LOGS IN
% Sot .
PASOUIA L
SW 22
BIG LAKEr
106 .4 c 3.4 126 .0 SICL
100.5 c 2.0
97.8 c 3 2
90 .1 SICL
96.696 .1
.
: C-Sic= 2.3:~--C-Sic 2.365.3 C
95.8 C-Sic / .8 65.2 Sic-C
2 83.3 C-SiCL / .8
72.1 SiC-SiCL / .467.5 SIC-SICL
56.4 SiCL-SiL / .7
60.4 VFSL-SiL / .964 .4 SICL-SIL
/ 71 .3 SICL-SIL
SE 15
E. C : % Sot SIG LAKE E . C.
Z 3
R.27
AKE (TWP 54-27W)
Figure 6 : Drill logs from the Central Portion of Pasquia Lake

DRILL LOGS IN PASQUIA LAKE (TWP54-27W)r"-WGrt NE 18 SE 17 NE 16 NE 9
% Sol. LE PAS E. C . % Sol . LE PAS E. C. % Sol. BIG LAKE E. C. ~ Sol. BIG LAKE ECJ D
84.4 SIC 2.2 /12 .8 SICL 3.4 / SIL 2.4/24.8 L-SIL 3 .8
n85 .5 SICL / " 9
98.1 SIC / .793 .8 C 2.8
8/ .8 SiC-SiCL 3.30 96.7 SIC-C / .2 83 .2 SIC-C / .5cLa
90 .9 C-Sic 2./r�n E /O/ .6 SIC-C / .O 65.3 SICL 1 .6 88.0 C-SIC / .3o "
L 79 .8 C-SiCL / .8n
(Dp 56.1 VFSL / .5 66.4 SiL-L 2.0 70 .7 SIC / ./ 64 ./ SiCL 2 . 4
rn 2 62 .6 SiL-SiCL / .6
m 48.7 VFSL / .4 58.7 SIL-VFSL / .3 62 .4 SiCL 2 ./n 74 ./ SiCL-SiL / .8
0 63.6 SiCL / .949.3 VF SL / .5 59 .1 VFSL-SIL / ./ ~ 5/ .7 VFSL-SICL 2./
rr
p" 38/ .9 SICL-L 2./
82.0 SIL-VFSL / .5 6 66.2 SICL-SIL / .4 62 .2 SiL / .60
aN
Cwrwxm
7 S
R . 27

4 .2 DESCRIPTION 0_F SOIL SERIES ANDMAPPING UNITS IN PAS UIA LAKE
The soils of Pasquia Lake aregrouped according to parent materialand drainage in Table 1 . The classi-fication of each soil series at thesubgroup level is indicated in thetable as is the estimated total hec-tarage occupied by each series . Theestimates include areas mapped as theindividual series and the area cov-ered by each series within complexmapping units . Phases of soil seriesindicative of altered drainage condi-tions have separate areal estimates .The percentage of the total area inPasquia Lake covered by each soil se-ries and phase is also given .
Because horizon development isvery weak or absent on these soils,soil series separations for mappingare based primarily on texture . Var-ying degrees of poor drainage arerecognized taking into account esti-mated periods of inundation and soilsaturation and the natural vegetativeassociations observed during fieldstudies . This range of drainage isshown as map unit separations of eachsoil series . The three soil seriesmapped in Pasquia Lake, namely BigLake, Le Pas and Pasquia are classi-fied as Rego Gleysol carbonated phasesoils . The distribution of thesesoils and associated range in drain-age is shown on the soil map at theback of this report .
BIG LAKE SERIES (1 542 ha)
The Big Lake series are poorlydrained to very poorly drained soilswith silt loam to silty clay loam andsilty clay textures . The depositsmay be stratified with layers of veryfine sand and clay resulting frompast flooding and sedimentation . Asa result of these floods the soilsare usually stratified with bands ofpeat or muck . The soils in this
series are classified as Rego Gley-sols, carbonated phase . Organicbuild-up on the soil surface is usu-ally restricted to a very thin layerof muck comprised of annual accumula-tion of leaves and stems of reeds,sedges and aquatic mosses . The lackof organic accumulation on the sur-face is the result of past frequentflooding and sedimentation . Theseprocesses have retarded continuousorganic matter production by coveringpeat or muck with mineral sedimentsduring the periods of inundation .Root development to 30-35 cm has pro-duced some soil structure . However,below this root zone, soil structureis massive and permeability of theclayey materials is virtually nil .
Gleying is characteristic of thesesoils with iron mottling being mostcommon in near surface layers affect-ed by periodic aeration . Soil pHvaries from mildly to strongly alka-line . Lower pH values occur in thelayers containing an abundance of or-ganic substances . The soils are de-veloping in moderately calcareoussediments . The carbonate content islowest in those layers with greateraccumulation of organic matter . A1-though some salts occur in the BigLake soils average electrical conduc-tivity values to a depth of 1 .2 m donot exceed 4 MS/cm .
The Big Lake soils occur mainlyalong the peripheral shoreline areasof Pasquia Lake occupying greatestareal extent in the south portion ofthe study area . The Big Lake soilsin the study area differ only slight-ly from soils of the Le Pas series .The Big Lake soils contain more siltand slightly less clay than the LePas soils . Drainage of the Big Lakesoils varies with position in PasquiaLake . Better drained soils occur atthe slightly higher elevation associ-ated with the very gently slopingshoreline . Very poor drainage is en-countered in the level to depression-
18

al areas in central portions of the In this soil series one drainagelake . Representative soils of the phase and three drainage variantsBig Lake series are described in Ap- were mapped . These are briefly de-pendix D . scribed in the following sections :

TABLE i
Parent Materials, Soils and their Estimated Extent in Pasquia Lake
PercentArea of Study(ha) Area
A . Soils developed on recent fluvial deposits
1 . Moderately calcareous coarse loamy (FSL, LFS)stratified alluvial deposits
a) Poorly drained
Pasquia series, drained phase (RegoGleysol, carbonated phase) . . . . . . . . . . . . . . . . . . . . 8 0 .35
2 . Moderately calcareous fine loamy to clayey(SiL, SiCL,SiC) stratified alluvial deposits
a) Poorly drained
Big Lake series, drained phase (RegoGleysol, carbonated phase) . . . . . . . . . . . . . . . . . . . . 322 13 .98
b) Poorly to very poorly drained
Big Lake series, modal phase (RegoGleysol, carbonated phase) . . . . . . . . . . . . . . . . . . . . 1220 52 .95
3 . Moderately calcareous clayey (C,SiC) stratifiedalluvial deposits
a) Poorly to very poorly drained
Le Pas series, modal phase (RegoGleysol, carbonated phase) . . . . . . . . . . . . . . . . . . . . 724 31 .42
B . Miscellaneous materials
a) Open water 30 1 .30
TOTAL AREA . . . . . . . . . . . . . . . . . . . . . . . . . ., . . . . . . . . . . . . . . . . . . . . . . 2304 100 .00

Big Lake Series , drained phase (322ha)
The drained phase of Big Lake se-ries occurs on slightly higher groundalong the west and north shorelinesof Pasquia Lake . Surface runoff ismoderately good due to the slightlyelevated position of these soils inrelation to the adjacent soils . Inspite of this favourable relief ahigh water table in the spring andoften in the summer or fall imparts asevere soil drainage problem . Nativevegetation consists of sedges withclumps of willow . Some upper slopeareas of Big Lake drained phase soilshave been cultivated and grow im-proved forage or annual crops .
B'ci Lake Series , modal hase (_1 220ha)
This soil phase is the most exten-sive of the units mapped in PasquiaLake . The largest block occurs inthe level to depressional central andsouthern portion of the study area .These soils are similar to the BigLake drained phase soils differingonly in their naturally poor surfacedrainage . A representative profileof the Big Lake modal phase is de-scribed in Appendix D .
The range of drainage conditionassociated with the modal phase isdescribed by three drainage variantsbased on estimated periods of inunda-tion and saturation :
Bg Lake _1 (648 ha) : This variant ispoorly drained with a subaquic mois-ture regime in which surface water isseldom present . The surface soil issaturated for extended periodsthroughout the growing season butusually not in excess of 4 months .The native vegetation is hydrophytic,consisting of continuous cover of
sedge and whitetop ; clumps of willowalso occur . Harvest of native hayoccurs on these soils during latesummer to early fall .
B'ci Lake _2 (341 ha) : This very poorlydrained variant has an aquic moistureregime . The soils are seasonallyflooded for extended periods early inthe growing season but surface wateris absent by the end of the growingseason in most years . If surface wa-ter is absent the soil is at or nearsaturation for moderately long peri-ods . The native vegetation is hydro-phytic consisting of mixed stands ofbullrush, cattail, sedge and willow .There is no present agricultural useof these soils .
Big Lake 3 (232 ha) : This variant isvery poorly drained with a peraquicmoisture regime . The soils are semi-permanently flooded as surface waterpersists through the growing seasonin most years . When surface water isabsent, the soil surface is saturatedor nearly saturated for very longperiods (>10 months) . Native vegeta-tion on these soils consists of con-tinuous cattail with patches ofphragmites and bullrush . There is nopresent agriculture use of thesesoils .
LE PAS SERIES (724 ha)
The Le Pas series consists ofpoorly to very poorly drained soilsdeveloping on moderately calcareousclayey fluvial and fluviolacustrinedeposits . These soils, classified asRego Gleysols, carbonated phase havelittle or no horizon development .Root development in the upper 30-35cm has produced a fine granular soilstructure . However, below this root
- 21 -

zone, soil structure is absent andthe clayey material is virtually im-permeable . Most Le Pas soils inPasquia Lake lack organic accumula-tion on the surface . Frequent flood-ing and sedimentation have retardedcontinuous organic matter productionby covering the peat or muck withmineral sediments during the periodsof inundation . As a result of thesefloods the profiles are stratifiedwith bands of peat or muck as well asbanding of the clay matrix with thinlayers of silty and sandy sediments .Gleying and iron staining are charac-teristic of these soils . pH is vari :able throughout the profile rangingfrom neutral to strongly alkaline .Lower pH values generally occur inthe layers containing an abundance oforganic substances . In these layers,the lime carbonate is correspondinglylow . Although some salts occur inthe Le Pas soils, average electricalconductivities exceed 4 mS/cm at onlya few locations near the western mar-gin of the lake bed .
The Le Pas soils occur in level todepressional central portions ofPasquia Lake . Extensive areas of LePas soils occur with soils of the BigLake series as a complex area whichis semipermanently flooded . The LePas soils mapped in Pasquia Lake dif-fer from the Big Lake soils only inslightly greater clay content andsomewhat less stratification .
The modal phase Le Pas soils rep-resenting the central concept of theseries was mapped in the Pasquia LakeBasin . Natural drainage of the LePas soils varies with position in thelake bed . The better drained soilsoccur on very gently sloping areasnear the north shore of the lake andthe poorest drainage is encounteredthroughout the central area . A rep-resentative soil of Le Pas series,modal phase is described in AppendixD .
The range of drainage conditionsassociated with the modal phase of LePas series is described by fourdrainage variants based on estimatedperiods of inundation and saturation .These are briefly described in thefollowing sections .
_Le _Pas _1 (151 ha) : This variant ispoorly drained with a subaquic mois-ture regime . The soils are saturatedto the surface for extended periods(up to 4 months) during the growingseason, but surface water is seldompresent . The native vegetation ishydrophytic consisting of continuouscover of sedge and whitetop withclumps of willow . Native hay is har-vested from these soils during dryseasons .
Le Pas _2 (154 ha) : This very poorlydrained variant has an aquic moistureregime . The soils are seasonallyflooded for extended periods early inthe growing season . Surface water isabsent by the end of the growing sea-son in most years . If surface wateris absent, the soils are saturatedfor moderately long periods . Nativevegetation is hydrophytic consistingof mixed stands of bullrush, cattail,sedge and willow . There is no pres-ent agricultural use of these soils .
Le _Pas _3 (349 ha) : This soil variantis very poorly drained with a pera-quic moisture regime . The soils aresemipermanently flooded with surfacewater persisting through the growingseason in most years . When surfacewater is absent, the soils are satu-rated for very long periods (>10months) . Native vegetation on thesesoils is continuous cattail coverwith patches of phragmites and bull-rush . There is no present agricul-tural use of these soils .
-22-

_Le _Pas _4 (70 ha) : The soils of thisvariant are associated with patchesof open water in the most depression-al portions of Pasquia Lake . Thesesoils have an aqueous moisture regimein which water covers the land sur-face at all times of the year in allyears . Vegetative growth consists ofpatches or clumps of cattail, phrag-mites, bullrushes and pondweed
PASQUIA SERIES ($ ha)
The Pasquia series consists ofpoorly drained, moderately calcareoussoils developing on coarse loamy flu-vial deposits . These soils havebands of peat within the profilewhich may be stratified with thinlayers of silt or clay in the sandymatrix . The soils of this series areclassified as a Rego Gleysol, carbo-nated phase . These soils, like theBig Lake and Le Pas series have lit-tle or no soil profile development .However, some structure~in the upper30-35 cm of their profiles and thelack of thick clayey strata in theirsubsoils make these soils much more,permeable and drainable than eitherthe Big Lake or Le Pas series .
PasQuia Series , Drained Phase (8 ha)
The Pasquia soils in the studyarea are associated with a low leveealong a small stream channel enteringthe northern portion of Pasquia Lake .The slightly elevated land surface onthe levee results in better surfacedrainage recognized as a drainedphase . The surface of these soils ischaracterized by a thin muck layeroften with more silt and clay thanoccurs in the subsoil . The soils aremoderately calcareous and the predom-inant textural fraction consists offine sand . Iron mottling isprominent throughout the soil pro-files . Native vegetation consistsprimarily of willows, sedges andreeds . The moisture-regime of thedrained phase is perhumid . Thesesoils are saturated for very shortperiods (<2 months) and unsaturatedthrough the remainder of the growingseason . The soils are moist all yearand seldom dry . Surface runoff ismoderately good due to the slightlyelevated position of these soils .Salinity in the surface soil is lowbut subsoil salinity is more vari-able . Analyses of representativePasquia soils is included in the De-tailed Soil Survey of Pasquia MapArea in Northern Manitoba (Ehrlichet . al ., 19b0) .

PART 5
SALINITY CONDITIONS IN POLDER III
The soil salinity data resultingfrom the study of soils in PasquiaLake and surrounding areas of PolderIII are included in Appendix E, andsummarized and interpreted in thefollowing sections . Analysis of sur-face and groundwaters sampled duringthe study are discussed in the sec-tion on surface water and groundwaterchemistry .
5,1 CONCENTRATION AND DISTRIBUTIONOF SOLUBLE SALTS
The concentration and distributionpattern of soluble salts in the soilsis shown in Figures 8, 9, 10, 11 and12 . The average EC values to a depthof 1 .2 m shown in Figure 8 indicatethat all of Pasquia Lake under pres-ent drainage condition's is non-saline(EC values <4mS/cm) . However astrongly saline area (EC values inexcess of 15 mS/cm) occurs about 0 .8km west of Pasquia Lake . Areas ofweakly saline soils (4-8 mS/cm) occuraround this strongly saline "hotspot" and at other locations west ofPasquia Lake . The higher salinityconcentrations in these areas haveaffected the west end of Pasquia Lakewhere average EC values of 2-4 mS/cmare indicated . Saline levels from2-4 mS/cm are sufficient to restrictthe yields of very sensitive crops .Salinity levels between 4 and 8 mS/cmare sufficient to restrict the yieldsof many common crops (USDA Handbook60) . Salinity concentrations between2-4 mS/cm are also noted north of thePasquia Lake Drain . Approximately687 hectares in Pasquia Lake (30
percent of the lake basin) presentlyare affected by average EC valuesranging from 2-4 mS/cm .
Salinity cross-sections D-D' andE-E' (see Figure 2 for location) il-lustrate changes in soluble salt con-centration measured to the west ofPasquia Lake as compared to concen-trations measured within the lake ba-sin . In cross-section D-D', (Figure9) soils at sites 52 and 32 occuroutside the lake basin and have largeconcentration of soluble salts in themid-portion of each soil, decreasingto the surface and at lower depths .In contrast, the highest concentra-tions of salts in Pasquia Lake occurat the soil surface although they areslightly lower than those to thewest . In addition all sites exhibitincreasing salt concentrations to-wards the ground surface . This indi-cates that salt is moving upward un-der present drainage conditions andis being concentrated at the soilsurface . The dominant soluble ionsin the cross-section are calcium,magnesium and chloride .
Cross-Section E-El (Figure 10) in-dicates that a gradient of increasingsalinity extends from Pasquia Laketowards the strongly saline "hotspot" at Site 177 . Moderately salineconditions occur along the shoreline(Site 133) and the influence from the"hot spot" appears to extend for atleast 1 .5 km into the lake . The saltprofiles at all sites along thistransect also show increasing concen-trations towards the ground surfaceindicating a gradual upward migrationof soluble salts .
24

Soils along the east side of PR282(Cross-section F-F', Figure 11) inPolder III have undergone some drain-age improvement . Soils sampled fromor close to better drained naturallevees (Site 6 and 57, Figure 11) arenon-saline although EC values in-crease slightly with increasingdepth . Soils at Sites 75 and 46 havehighest concentrations of solublesalts at the surface and generallydecreasing concentrations with in-creasing depth . Site 75 is moderate-ly saline (EC values of 9-15 mS/cm)and Site 45 is weakly saline (EC val-
ues of 4-8 mS/cm) . These patternsindicate that salt is accumulating atthe surface of the more poorlydrained depressional sites .
Cross-Section G-G' (Figure 12) inthe central portion of Pasquia Lakeshows soluble salt concentrations ofless than 4 mS/cm . The soils atthese sites are a11 non-saline al-though the EC gradient still increas-es to the surface indicating upwardmovement or at least lack of any sig-nificant leaching .

_ .sa : PASQUIA LAKE BEDDRAIN
- - ISOLINESs SITE NUMBER02.8 ELECTRICAL CONDUCTIVITY
2z
AVERAGE ELECTRICAL CONDUCTIVITY
<2 m5/cm 4-8 mS/cm
2-4 ms/cm ® 8-15 mS/cm
> 16 m5/cm
R 28 R .27
Figure 8 : Average Electrical Conductivity (mS/cm) to 1,2M depth
TP 54
R. 26
TP 55
-2b-

17 860
~ 856z
85217Lu 848JW
WESTD
EASTDI
Posquio L/02
. ~129 p\ \- .iDroih //-g /l0
I I ~ / TJU
~4 2 ~~-I- 90
52 32 129 /19 /l0 /02O 4.7 1 .8 3.5 2 .7 3 .0 2 .8
t; 30N. S. '~ N S.~ N. S. N . S. N. S. N . S.
60 7.2 5.0 ~ 2.%./.9
./7j ~/7j
W 90O 4.2 3.2 / .2 / .3 / .5 1 0 .8120
CROSS - SECT10N D - D' Sectlbn 9 - 54 - 28W to 35 - 54 - 27W
Isolines - - -Sample Sites : 52, 32, 129, 119 , //0 , 102 liert. exog . 1 : 3150
Site No. Soil Type
52 Posqulo droined soline
32 Le Pas modal phose129 Big Lake SiCL119 Big Lake CL - SiCllO Le Pas SiC - C102 Big Lake SiCL - SiC
phase
Figure 9 : Electrical Conductivity (mS/cm)

J
Q 860
~ 856Z~ 852Q~ 848
' SOUTHWEST NORTHEASTE Eif
030
60
90
/20
/30
PASOUIA LAKE
/37
t77 /33 /30 /37 144O24.0 12.5 3.4 2.4 2 .1
30N. S. N. S. I N . S N . S. ' N. S.
60 is.o 1 .2 'I-2 . 8 I ~1 .9 / .590
/20 18 .0 2.8 / .8 1 .5 0.9
CROSS - SECTION E - E' SECTION 7 - 54 - 27W to 22 - 54 - 27Wlsolines - - -Somple Sites : 177, 133, 130, /37, 144 liert. exog. t :t250
Site No. Soil Type-177 Le Pos modot phose133 Big Loke SiL - SiC130 Le Pas SiC137 Big Loke SiL - SiCL144 Big Loke SiCL
Figure 10 : Electrical Conductivity (mS/cm)

Q 860
~`� 856z
852Q848W
JW
WO
06 75 46 570.8 /0.0 5.5 0.5
30N. S. N. S. N. S. N. S
60 777 6.5 3.8 -2.090
0.8 6.0 4.8 3.2/20
CROSS- SECTION F - F' SECTION 2 - 54 - 28W to 23 - 54 - 28W
Isolihes -- -
Sample Sites 6, 75, 46, 57 Vert. ezog . 1,1250
Site No. Soil Type
6 Posquio drclned phase
75 Le Pas modal phase
46 Le Pas modal phase57 Nels FSL
NORTH SOUTHF F~
57
Figure 11 : Electrical Conductivity (mS/cm)

J
Q
~ 856
0Z 852
Q 848WJW
0
30
60
0 90
/20
NORTH SOUTHG G'
lll ll0 /44 /46/ .7 3 .0 2 ./ / .6
N S. N. S. N S. N. S.
%.8
L ~_ -
F-1 .6
0 .9 7(Tr
CROSS-SECTION G - G' SECTION 14 - 54 - 27w to 27 - 54 - 27w
Isofines - - -
Site No.
Somple Sites /// , //0 , 144, 146
Soil Type
lll Le PCs Sic - Cll0 Le Pas SiC144 8ig Loke SiCL146 8ig Loke SiL - SiC
Verf. exog. l:800
Figure 12 : Electrical Conductivity (mS/cm)

5 .2 CHEMICAL COMPOSITION OF SALTS
The chemical composition of thesalts determined from the four cross-sections in Polder III is summarizedin Tables 2,3,4, and 5 . The datafrom Cross-section G-G' (Table 5)provide an indication of the back-ground levels of cations and anionsin the soils in the central and east-ern portions of Pasquia Lake . Therange in concentration of calcium,magnesium and sulfate ions from thesesites is similar at all other siteswithin the lake basin (Cross-sectionD-D', Table 2 and Cross-section E-E',Table 3) . These ions also increasein concentration towards the soilsurface at all sites .
The composition of soluble saltsin the soils of the west end of Pasq-uia Lake indicates that the probablesource for the salinity is from mod-erately to strongly saline groundwa-ters . Discharge of deep seated sa-line water occurs in the vicinity ofSite 177, (Cross-section E-E', Figure10) and Site 178 (Figure 13) . Thisis indicated by the distribution pat-tern and abnormally high concentra-tions of the sodium and chloride ionsin the soil solution at Site 177 (Ta-ble 3) and Site 178 (Figure 13) . Itis known that the groundwater in thebedrock underlying this area is ofvery poor quality and contains mainlysodium chloride salts (Pederson,1973) . The area affected by thisseepage condition extends approxi-mately 1 .5 to 3 km into the lake ba-sin as indicated by the compositionof salts at Sites 133 and 130 (Table3) .
The source of the salinity in thesoils west of Pasquia Lake is alsolikely from deep-seated groundwaterderived from underlying bedrock for-mations . The high concentration ofsodium chloride salts contained inthe soil solution at Sites 75 and 46(Table 4) likely are a result of dis-charge from this deep seated a#ifer .The chemical composition of the saltsat Site 178 is shown in the drill login Figure 13 . The sodium and chlo-ride values from this site show asimilar relationship to the solublesalt composition of Site 177 andSites 130 and 133 in the west end ofPasquia Lake . Based on the concen-tration and chemical composition ofsalts in the soil solution it appearsthat the localized area immediatelywest of Pasquia Lake is affected bydischarge of strongly saline deep se-ated groundwaters .
The stratigraphy observed to 4 me-tres at Site 178 (Figure 13) indi-cates the lacustrine clay is thin orabsent in the upper 4 .5 m of sedi-ment . Where the clay barrier atdepth is thin or absent and if thereare strong artesian pressures in theunderlying formation, deep-seated sa-line groundwaters will tend to dis-charge to the ground surface . Later-al seepage of saline water couldoccur eastwards into Pasquia Lake andmay account for the distribution pat-tern and high sodium and chlorideconcentration in soils of the lak-ebed . Hydrologic investigations todeeper depths could help to betterexplain the salinity conditions inthis area .

TABLE 2
Chemical composition of salts in Cross-section D-D1
Site No . Depthcm Ca** Mg
Concentration,Na
meq ./1SO
4C1 HCO- 3
SAR
52* 0-15 24 .8 18 .5 13 .5 5 .2 49 .5 5 .6 2 .960-75 22 .3 15 .3 12 .9 5 .7 49 .0 2 .9 3 .0105-120 - - - - - - -
32* ` 0-15 10 .5 4 .4 5 .1 2 .2 19 .6 4 .5 , 1 .860-75 33 .5 14 .1 7 .5 1 .5 55 .9 3 .4 1 .5105-120 ' 17 .9 7 .2 4 .1 0 .5 30 .9 4 .0 1 .2
129 0-15 26 .5 13 .7 8 .1 10 .5 29 .4 3 .0 ' 1 .860-75 10 .8 5 .2 4 .1 2 .8 21 .0 3 .6 ~ 1 .4105-120 5 .6 3 .0 3 .1 1 .9 13 .7 3 .3 1 .3
119 0-75 16 .1 8 .9 9 .4 6 .8 27 .0 3 .8 2 .660-75 9 .2 5 .2 5 .4 3 .4 23 .5 3 .8 2 .2105-120 4 .5 2 .5 3 .3 1 .6 19 .6 3 .5 1 .8
110 0-15 29 .2 13 .4 6 .9 12 .9 13 .7 3 .9 1 .560-75 - - - - - - -105-120 - - - - - - -
102 0-15 19 .6 12 .6 7 .0 9 .7 22 .0 5 .9 1 .760-75 9 .9 5 .3 4 .5 4 .2 20 .1 5 .1 1 .6
I-- 105-120 - - 4 .5 - 2 .1 2 .7 1 .4 17 .1 4 .2 1 .5
Sites located outside of Pasquia Lake basin
~ Ca = Calcium S04 = SulfateMg = Hagnesium C1 = ChlorideNa = Sodium HC03= Bicarbonate
SAR = Sodium adsorption ratio

TABLE 3
Chemical composition of salts in Cross-section E-E1
Site No .
177',
Depthcm
0-15
Ca`*
24 .1
Mg
25 .2
Concentration,Na
247 .9
meq ./1S04
4 .4
C1--
288 .7
HCO35 .4 I= ~
~
SAR
--49 .8 i
60-75 13 .7 11 .5 133 .1 2 .0 169 .1 3 .3 ~ 37 .4 ;105-120 16 .1 13 .0 130 .5 1 .9 174 .5 3 .7 ~ 34 .1
133 ~ 0-15 19 .5 18 .3 101 .4 12 .2 113 .2 4 .3 I 23 .360-75 - -- - - - - I -
105-120 5 .6 3 .4 25 .5 3 .0 30 .4 4 .1 II
-
130 0-15 24 .3 13 .7 8 .2 10 .7 25 .0 4 .1 1 .960-75
105-120 10 .4 5 .9 5 .1 4 .7 22 .0 3 .3 1 .8 I
137 0-15 17 .0 8 .6 6 .7 7 .2 17 .6 4 .2 1 .960-75105-120 12 .5 6 .6 5 .1 5 .4 12 .7 4 .2 1 .6
144 0-15 13 .6 7 .1 4 .7 5 .3 16 .2 4 0 1 .4 i60-75
~
105-120 5 .1 2 .9 3 .8 1 .3 10 .8 3 .6 1 .9
; Site located outside of Pasquia Lake basin
Ca = Calcium S0 SulfateMg = Magnesium
4C1 Chloride
Na = Sodium BicarbonateHCO3
SAR = Sodium adsorption ratio

TABLE 4
Chemical composition of salts in Cross-section F-F'
Site No .* Depthcm Ca**
Concentration,Mg Na
meq ./1S04 C1 HC03
SAR
6 0-15 5 .2 2 .1 2 .1 0 .2 11 .3 3 .5 1 .160-75105-120 4 .7 2 .2 2 .0 1 .3 5 .9 3 .6 1 .1
75 0-15 48 .4 45 .5 35 .8 11 .1 107 .0 3 .6 5 .260-75 41 .0 26 .0 24 .0 12 .4 60 .0 3 .2 4 .1105-120 32 .6 15 .4 20 .2 8 .9 53 .9 3 .1 4 .1
57 0-15 3 .7 2 .4 1 .3 0 .2 0 .5 5 .7 0 .860 .75 3 .6 3 .3 12 .1 0 .6 27 .5 4 .0 6 .5105-120
All sites located outside of Pasquia Lake basin
^^ Ca = Calcium so = SulfateMg = Magnesium C14 = ChlorideNa = Sodium = Bicarbonate
HCO3

TABLE 5
Chemical composition of salts in Cross-section G-G1
Site No .* Depthcm Ca** Mg
Concentration, meq ./1Na S04 C1 HC03
_ S.I,
111 i 0-15 I 13 .2 5 .() 3 .3 5 8 10 .8 4 .2 1 .160-75
~-
i-
105-120 I 6 .6 3 .5 3 .1 2 .9 10 .8 4 .1 ; 1 .4
110 0-15 29 .2 13 .4 6 .9 12 .9 13 .7 3 .9 ' 1 .560-75 - - - - - - -105-120 - - - - - - I -
144 I 0-15 13 .6 7 .1 4 .7 5 .3 16 .2 4 .0 411 60-75 - - - - - - _- i105-120 5 .1 2 .9 3 .8 1 .3 10 .8 3 .6 1 .9
146 0-15 8 .7 5 . : 6 .7 3 .4 16 .7 4 .7 2 .660-75 - - - - - - -
105-120 3 .4 1 .9 4 .6 1 .0 14 .7 4 .0 2 .8
All sites located in Pasquia Lake basin
^^ Ca = Calcium so = SulfatEMg = ~Iagnesium C14 = ChloriceNa = Sodium
HCO3= Bicarbinate

ElectricalConductivity Depth Texture EC Soluble Salts meq ./1 .
; MS/cm (m) mS/cm Ca Mg Na SAR SO4 C1 HCO3 ' pH
" 2 iFSL-1- 12 .4 8 .8I 12 .9 130 .4 39 .4 9 . 5 ± 150 .8' 5 . 0 99 .0 ;
" 4 L-VFSL
,
,
.6 ~ ~ -;.- -
.8-
SiL-SiCL:
3 .6 ' 3 . 2 .8 ' 49 .627 . 1 ; 2 .1-
'
1 50 .8 4 . 8 8 .2,SiCL
,
1 .0 ---y---' SicL-SiL 3 .9
,I 4 .0! 3 .5 1 5L .8 28 .2 ; 2 .8, 47 .7 7 .9 8 .2
. 4 SiL
" 6, LFS-FSL 6 .7,
2 .9~ ~ 51 "8 .3142 .8 11 3 .4~ 83 .9 5 .5 8 .2
FSL2 .0
; , 2L-SiL 5 . 3 1 .6~-3 .3 72 .21 46 .0 ! 1 .61 68 .91 8 .9 ~ 8 .4
" 4.6
SiL-
p ~~ ~
-~-, -
~SiL 5 .3, 4 . :1 79 .2 41 .0 1 .7 ; 79 .31 7 .6 8 .2 '.8
SiL3 .0 . _` - - -{- ----~ i.2 CL-Hu 9 .9~ 19 .3! 18 .9 1 102 .71-23 .4 ~ 23 .9~ 70 .5~, 2 .5 ' 7 .9I4
. 6 C
! " 8 Hu-SiCI
10 .61 17 .4I 21 .1 ~106 .6~24 .2 I 21 .7!I
80 .81 0 .8 j 7 .8
i 4 .0CL -SiCL
--~,.2 VFSL ; .0 12 .8 12 .3 92 .21 26 .0 13 .5 77 .2 2 .8 1 i .9 J
l J2 4 6 8 10 I 2 . 4 - ~. -- ~ i
Figure 13 : Drill log and chemical analysis of Pasquia series, moderately,saline phase (Site 178)

5 .3 SURFACE WATER AND GROUNDWATERCHEMISTRY
Groundwater characteristics of ThePas areA have been described inGroundwater Availability Studies Re-port No . 9 (Pedersen, 1973) . Avail-able groundwater data for the PasquiaLake area has been summarized and in-terpreted to assess the impact thatdrainage improvement might have ongroundwater and soil conditions inthe lake bed (Rutulis, 1981) . Thesestudies indicate that surface watersand most shallow groundwaters inPolder III are generally fresh .
Samples of groundwater from shal-low observation wells in PoldersII,III and IV were analyzed in con-junction with the soil survey ofPasquia Lake (Table 6) . The shallowgroundwaters in Polders II and IIIare nonsaline (Electrical conductivi-ty values range from EC 0 .67-2 .7 mS/cm . The salt concentration of most
of these waters increased slightlythrough the growing season . Samplesof the shallow groundwater in PolderIV were moderately saline (E .C . valueranging from 6 .47-7 .68 mS/cm) . Astrongly saline, deep-seated ground-water flow system is known to enterthe Pasquia area from the southwest(Pedersen, 1973), which could par-tially account for the higher levelsof salinity .
The trend to increasing salinityin the shallow groundwater system tothe south west (Polder IV) and theincreased occurrence of surface soilsalinity in Polders III and IV indi-cate that some mixing of the shallowand regional flow systems takes placein Polder IV and portions of PolderIII . This observation supports Rutu-lis, (1981) who stated that some mix-ing of waters takes place between theregional system and of some of themore local flow systems .

TABLE 6
Chemical Analysis of Waters in Polders II, III and IV
Name Location Date and Sample No . pHEC
ms/cm
GROUNDWATER*
Polder IV
Well No . 6 SW 26-53-28W 83-6-27 6 .9 7 .68
" 83-7-2 7 .0 7 .75
83-8-31 6 .47
Polder III
Well No . 1 SE 2-54-28W 83-7-2 6 .9 1 .41
" 83-8-31 1 .30
Well No . 2 SW 14-54-28W 83-7-2 6 .7 1 .97
" 83-8-31 2 .70
Well No . 3 NW 23-58-28W 83-7-2 7 .1 0 .70
" 83-8-31 0 .93
Polder II
Well No . 4 NW 36-54-28W 83-7-2 7 .2 0 .67
" 83-8-31 1 .13
Well No . 5 NW 5-55-27W 83-7-2 7 .1 0 .90
" 83-8-31 1 .80
SURFACE WATER - POLDER III
Drains and natural waterways
Big Lake Drain at PR 282 83-8-31 1 .02.
Pasquia Lake Drain - west end 83-6-30-1 7 .3 0 .86
" " 83-8-31 0 .96
- centre 83-6-20-5 7 .6 0 .80
" 83-8-30 0 .98 i
- east end 83-6-29 7 .8 0 .78 I
" " ~ 83-9-1 0 .98 '
Pasquia River SW 24-54-27W 8-9-1 0 .49
* Water from the saturated soil zone collected from shallow
(approximately 3m) observation wells

Table 6 . cont'd
Name Location Date and Sample No . pHECMS/cm
SURFACE WATER - POLDER III cont'd
Area southwest of Pasquia Lake Bed
SAL 175 NW 5-54-27W 83-6-30 7 .6 -~2 .24
176 SE 7-54-27W 83-6-30 7 .3 5 .83
179 NE 7-54-27W 83-6-30 8 .0 1 .11
Pasquia Lake Bed
West end NE 8-54-27W 83-6-30-1 7 .2 1 .26
NW 17-54-27W 83-6-18-2 7 .2 0°.81
SE 17-54-27W 83-6-18-3 7 .3 1 .09
" 83-8-30-3 1 .63
NE 8-54-27W 83-6-30-2 7 .2 1 .31
NW 8-54-27W 83-6-30-4 7 .8 1 .29
SW 17-54-27W 83-7-1-1 7 .3 1 .23
Central NW 22-54-27W 83-8-30-1 1 .02
NE 16-54-27W 83-9-1-1 1 .09 iSW 22-54-28W 83-9-1-4 0 .64
East end SW 26-54-27W 83-6-20-5 6 .9 0 .85 I,
NE 25-54-28W (Dugout) 8 .5 0 .56

Analysis of selected surface watersamples taken in conjunction with thesoil survey of Pasquia Lake are pre-sented in Table 6 . All surface wa-ters sampled are non saline exceptfor an area southwest of the PasquiaLake bed (Site SAL 176) . Although anincrease in electrical conductivityis noted in samples taken from eastto west in the Pasquia Lake drain andfurther west in the Big Lake drain atProvincial Road 282, sampling datesvaried and differences are veryslight . Pasquia River waters up-stream from the Pasquia Lake draincontrol have lowest EC values of 0 .49m5/cm indicating that surface watersmoving slowly from west to eastacross Polder III and Pasquia Lake doaccumulate and transport some dis-solved salts .
Surface waters from the areasouthwest of Pasquia Lake are largelyponded and stagnant . The higher ECvalues from these sites may reflectthe slow discharge of saline ground-water to the soil surface in thisarea .
Surface waters in Pasquia Lake areshallow, extending up to 0 .4 m indepth . Much of the lake bed is inun-dated throughout the year and the wa-ters are stagnant except along thePasquia Lake drain which permits veryslow flowage to the east . The sur-face waters are non saline (EC valuesfrom 0 .56-1 .63 mS/cm) although aslight trend showing gradually in-creasing levels of dissolved salt inthese waters occurred from east towest across the lake bed . Surfacewaters from the west end of the lakebasin are likely affected by the mod-erate levels of soil salinity and byslow discharge of deep seated ground-water .
5 .4 DETAILED SALT LOAD TRANSECT
Large scale drainage reclamationwas initiated in the Pasquia LandSettlement Project in 1953 and thearea has been extensively croppedsince 1956 . Salinity at that timewas generally of minor extent partic-ularly in Polder I and II and ofslightly more widespread occurrencein Polders III and IV (Ehrlich et .al ., 1960) . The impact of drainageimprovement and subsequent croppingon salinity levels in the area isdifficult to assess from availabledata .
To adequately assess the agricul-tural potential of the Pasquia Lakebasin and surrounding areas of PolderIII it was necessary to combine spe-cial salinity studies with the soilsurvey . The soil survey of the Pasq-uia Lake basin evaluated the agricul-tural potential of the area followingdrainage improvement . The main em-phasis of the salinity survey was toassess the present status of salinityin the lake bed and surrounding areasof Polder III . A second aspect ofthe salinity study included estab-lishment of a permanent benchmarksite to provide a reference point formonitoring change in soil salinityover time . Because reductions or in-creases in soil salinity usually oc-cur slowly, particularly on cla.yeyimpermeable soils such as in PolderIII, a benchmark site must be moni-tored over a period of years . An ac-cessible portion of Polder III whichhas undergone drainage improvementand which has a range of soil salini-ty was selected as a benchmark site(SW14-54-28W) .
The site, in an area of Le Paspeaty phase soils was sampled at 9:0 mintervals in a detail transect southfrom the Big Lake drain along theeast side of Provincial Road ?.82 .Topography along the transect rangesfrom depressional adjacent to the Big
-40-

Lake drain to very gently sloping atthe south end . The naturally poordrainage of the area has been im-proved by the Big Lake drain andditches along PR 282 . Soil samplestaken from 7 sites at 5depths,(0-15,15-30,30-60,60-90 and90-120 cm) consisted of 5 replicatesfrom a 2 metre square at Sites AA1,AA4 and AA7 and single samples at theremaining sites . Total salt analysis
were carried out on all samples . To-tal salt load on a weight per volumebasis was calculated from the saltanalysis . Measurement of total saltload in soils provides a sensitivemethod of monitoring changes in thetotal salt content of the soil . Thepresent level and distribution, pat-tern of salt measured at the~~bench-mark site is summarized in Figure 14 .

sALr OrsrRraurloNNorrh :EleCtncol Conductivity, ms/cm/ South
AAl AAZ AA3 AA 4 AAS AA6 AA7
SEDGES
SOIL I I CLUMPS I WILLOWAND
BERM i BARE -L NAT1VE PQSTURE w WILLOW J CON,-IIVUOUS
0 /2_5~7 4~
E~6-5J5 J4
2_4 L22~ 3 4~3
_07 CL141 12 2
0-7/ 0-30 ` - .- _ . - -
6.4~60
4~
4.6 ',
5 5
3.8L2 J_~
5 O
5.9L
3 .2_~
3 9 2 8
I
2.0
490
, .
r
. ~ .L
~~6.0i '4 .9 3 4 2 4 3.2 /,6I / 2E 120
AA1 AA2 AA3 AA4 AAS AA6 AA7
0 5 10I__ . l I _- I-----1_ . ._L1
5 10 5 10 5 10
E'lectr1col Conductivity
0
0I I I I I I _ I .I5 10 5 10 5 IO
(MS/cm)
SALr LOAD .Site NumOer
DEPTH AAl' AA2 AA3 AA4' AAS AA6 AA7`
0-60cm i 353 .3 57 .4 33 .0 48.4 26 6 15 9 15 .9 ,
60-120cm 39 .4 36.2 30.6 22.0 22.5 14 3 9.6
rotol 397 .7 93 .6 63.6 70.4 49.1 30 .2 25 .5 1
Sites 1, 4 B 7 ore on overoge of 5 sub-slfes from o 2 meter squore.
t /0.6m . /ho
t/0.6m./no .
Ill . 2m . /ho.
Figure 14 : Detailed Salt Study Through Section of Le Pas Map Unit:(SW14-54-28W)

The distribution pattern of saltsin the surface 0-60 cm of soil in thetransect shows a horizontal gradientfrom moderately saline soils adjacentto the Big Lake drain (Site AA1) toweakly saline soils (Site AA2) andnon saline soils at sites AA3-AA7 .Slightly greater local relief andbetter drainage associated with thenon saline soils increases the poten-tial for downward leaching of saltsfrom the soil surface and developmentof non saline conditions .
The vertical salt profile in thesaline soils at Sites AA1 and, AA2show a decrease in salt concentrationwith increasing depth . These saltprofiles are characteristic of soilsaffected by discharge of salinegroundwater . This observation sup-ports (Rutulis 1981) who states thatmuch of the area in Polder III is af-fected by a piezometric surface fromthe underlying bedrock aquifer thatis higher than the water tables andis generally near or above the groundsurface . The remaining sites (AA3 toAA7) although non saline at the sur-face are characterized by one or twozones of salt accumulation in thesubsoil . These zones of salt accumu-lation reflect the long term averagedepth to the saturated soil zone (wa-ter table) and the average distanceabove the water table affected bystrong capillary rise . Fluctuationof these zones can result in severallayers of salt accumulation . Whenthe depth to the saturated zones ex-ceeds the distance of strong effec-tive capillarity of the soil the po-tential for surface leaching isincreased .
Change in soil salinity with timecan be monitored by calculating thetotal weight of salt per unit volumeof soil . The salt load values fromthe transect indicate accumulationsof salt in the upper 60 cm of themoderately saline soil and a signifi-cantly greater total weight of saltto 1 .2 meters than that observed in
the weakly and non saline soils .Distribution of salt in the weaklyand non saline soils is relativelyuniform as the weight of salt withinthe upper 60 cm accounts for approxi-mately 50 to 700 of the total saltload in the profile .
The salt load values calculatedfrom this transect can be used as areference for future salinity stud-ies . Changes in soil salinity re-sulting from drainage improvement canbe assessed by repetitive sampling ofthe benchmark site in future years .
5 .5 SUMMARY _OF SOLUBLE SALTANALYSIS
EC values obtained from PasquiaLake indicate that under presentdrainage conditions soils in the lakebasin are non-saline . However, mostsoils analyzed from Pasquia Lake showslight increases in concentration ofsoluble salts toward the soil sur-face . This trend is also evident insaline phase soils occurring in Pold-er III outside Pasquia Lake . Soilson better drained levees often showno vertical trend in concentration,being relatively uniform and non sa-line throughout the depth examined .
These data indicate that a generalupward trend in groundwater movementdominates throughout much of PolderIII and appears to affect PasquiaLake as well . Groundwater studies(Pederson, 1973) in the flood plainof the Saskatchewan River indicatethe piezometric surface from the un-derlying bedrock aquifer is higherthan the water tables and is general-ly near or above the ground surface .This study also refers to two flowsystems in this bedrock aquifer, afresh water system recharging in thenortheast and a saline flow systementering the area from the southwest .The occurrence of strongly saline
-43-

"hot spots" immediately west of Pasq-uia Lake appear to be the result ofthe saline groundwater componentslowly discharging to the surface .Higher than normal salinity levelsoccur in the western end of PasquiaLake surrounding these "hot spots" .This indicates that some seepage hasoccurred from the strongly salineareas into Pasquia Lake . The upwardmoving groundwater west of the lakemay be under sufficient pressure to"leak" into the lake basin in the af-fected area . Under existing poorlyand very poorly drained conditionsthe area affected by salts extendsinto Pasquia Lake between 1 to 3 km .
A gradient in salt concentrationwas observed in surface waters sam-pled from west to east across PasquiaLake . Although surface waters arenon-saline, average EC values fromthe west end of Pasquia Lake (1 .23MS/cm) decrease to 0 .91 mS/cm in cen-tral portions and 0 .70 mS/cm in theeast .
Calcium and magnesium ion concen-trations measured from strong salinesoils west of Pasquia Lake generallyfall within the range of concentra-tions determined from soils in non-saline portions of the lake basin .The distribution pattern of the sodi-um ion shows a marked concentration(25 to 80 fold increase) in the sa-line "hot spot" west of the lake ascompared to the range of concentra-tion measured from non-saline areas
in the lake basin . The chloride ionshows a 12 to 25 fold increase inconcentration in the strongly salinesoil as compared to background levelsmeasured at non-saline soils in Pasq-uia Lake . The salt affected area inthe west end of Pasquia Lake has so-dium and chloride ion concentrationsintermediate between the source areaand non-saline soils in the easternportion of the lake basin .
Sulphate ions are a minor compo-nent of the soluble salts in the up-per 1 .2 metres of soil materials inthe study area . The sulfate concen-tration generally increases to thesurface in all soils sampled in thelake basin but does not show anychanges in concentration relative tothe strongly saline "hot spot" . Adrill log in the saline area west ofPasquia Lake sampled to 4 .3 m doesindicate a marked increase in concen-tration of sulfate at about 3 .0 m .Sulfate ion concentrations of thismagnitude were not measured in thenear surface soils (upper 1 .2 m) atany location in Polder III .
The pH of the soil extracts fromall samples are less than 8 .5 exceptfor two sites west of PR 282 . Soilwith pH values less than 8 .5 areclassified as non-alkali . The aver-age pH value for surface soils inPolder III is 7 .8 (7 .1 to 8 .5) .These pH values are typical of calca-reous soils in the Pasquia area .
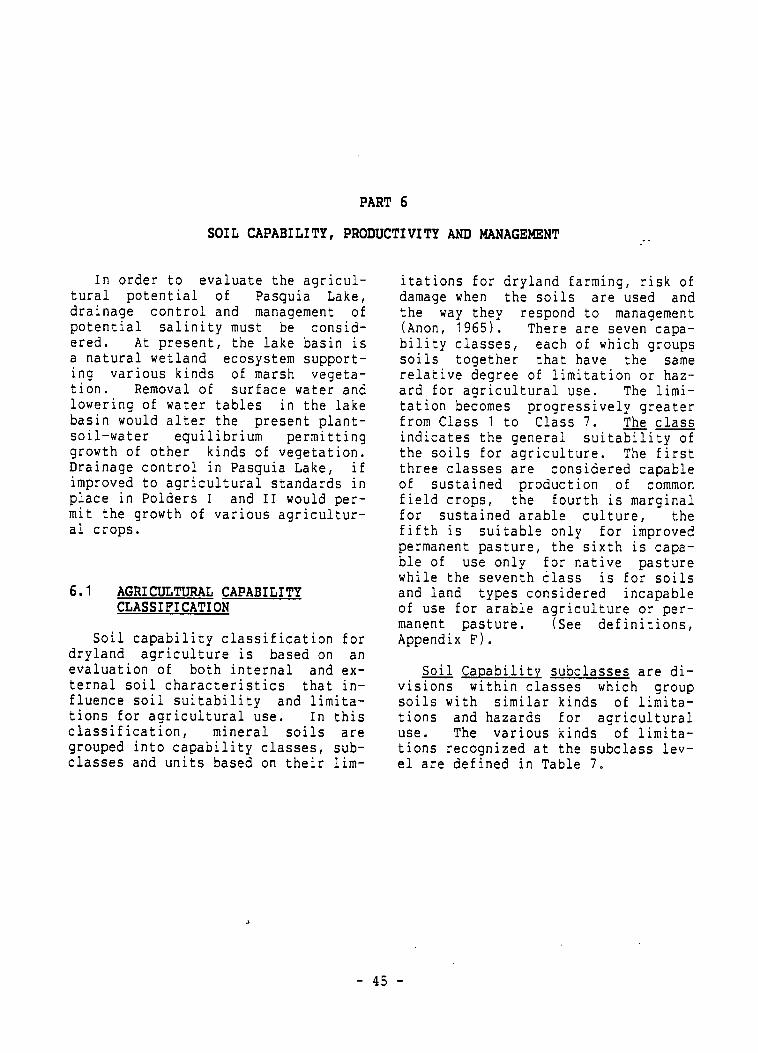
PART 6
SOIL CAPABILITY, PRODUCTIVITY AND MANAGEMENT
In order to evaluate the agricul-tural potential of Pasquia Lake,drainage control and management ofpotential salinity must be consid-ered . At present, the lake basin isa natural wetland ecosystem support-ing various kinds of marsh vegeta-tion . Removal of surface water andlowering of water tables in the lakebasin would alter the present plant-soil-water equilibrium permittinggrowth of other kinds of vegetation .Drainage control in Pasquia Lake, ifimproved to agricultural standards inplace in Polders I and II would per-mit the growth of various agricultur-al crops .
6 .1 AGRICULTURAL CAPABILITYCLASSIFICATION
Soil capability classification fordryland agriculture is based on anevaluation of both internal and ex-ternal soil characteristics that in-fluence soil suitability and limita-tions for agricultural use . In thisclassification, mineral soils aregrouped into capability classes, sub-classes and units based on their lim-
itations for dryland farming, risk ofdamage when the soils are used andthe way they respond to management(Anon, 1965) . There are seven capa-bility classes, each of which groupssoils together that have the samerelative degree of limitation or haz-ard for agricultural use . The limi-tation becomes progressively greaterfrom Class 1 to Class 7 . The classindicates the general suitability ofthe soils for agriculture . The firstthree classes are considered capableof sustained production of commonfield crops, the fourth is marginalfor sustained arable culture, thefifth is suitable only for improvedpermanent pasture, the sixth is capa-ble of use only for native pasturewhile the seventh class is for soilsand land types considered incapableof use for arable agriculture or per-manent pasture . (See definitions,Appendix F) .
Soil Capability subclasses are di-visions within classes which groupsoils with similar kinds of limita-tions and hazards for agriculturaluse . The various kinds of limita-tions recognized at the subclass lev-el are defined in Table 7 .

TABLE 7
Agricultural Capability Subclass Limitations
C - Adverse climate : This subclass denotes a significant adverse climate forcrop production as compared to the "median" climate which is defined asone with sufficiently high growing season temperatures to bring-fieldcrops to maturity, and with sufficient precipitation to permit crops tobe grown each year on the same land without a serious risk of partial ortotal crop failures .
D - Undersirable soil structure and/or low permeability : This subclass isused for soils difficult to till, or which absorb water very slowly orin which the depth of rooting zone is restricted by conditions otherthan a high water table or consolidated bedrock .
E - Erosion : Subclass E includes soils where damage from erosion is a limi-tation to agricultural use . Damage is assessed on the loss of produc-tivity and on the difficulties in farming land with gullies .
F - Low fertility : This subclass is made up of soils having low fertilitythat either is correctable with careful management in the use of ferti-lizers and soil amendments or is difficult to correct in a feasible way .The limitation may be due to lack of available plant nutrients, high ac-idity or alkalinity, low exchange capacity, high levels of carbonates orpresence of toxic compounds .
I - Inundation by streams or lakes : This subclass includes soils subjectedto inundation causing crop damage or restricting agricultural use .
L - Coarse wood fragments : In the rating of organic soils, woody inclusionsin the form of trunks, stumps and branches (>10 cm diameter) in suffi-cient quantity to significantly hinder tillage, planting and harvestingoperations .
M - Moisture limitation : This subclass consists of soils where crops areadversely affected by droughtiness owing to inherent soil characteris-tics . They are usually soils with low water-holding capacity .
N - Salinity : Designates soils which are adversely affected by the presenceof soluble salts .
P - Stoniness : This subclass is made up of soils sufficiently stony to sig-nificantly hinder tillage, planting, and harvesting operations . Stonysoils are usually less productive than comparable non-stony soils .
R - Consolidated bedrock : This subclass includes soils where the presenceof bedrock near the surface restricts their agricultural use . Consoli-dated bedrock at depths greater than 1 metre from the surface is notconsidered as a limitation, except on irrigated lands where a greaterdepth of soil is desirable .
-46-

T - Topography : This subclass is made up of soils where topography is alimitation . Both the percent of slope and the pattern or frequency ofslopes in different directions are important factors in increasing thecost of farming over that of smooth land, in decreasing the uniformityof growth and maturity of crops, and in increasing the hazard of watererosion .
W - Excess water : Subclass W is made up of soils where excess water-otherthan that brought about by inundation is a limitation to their use foragriculture . Excess water may result from inadequate soil drainage, ahigh water table, seepage or runoff from surrounding areas .
X - Cumulative minor adverse characteristics : This subclass is made up ofsoils having a moderate limitation caused by the cumulative effect oftwo or more adverse characteristics which singly are not serious enoughto affect the class rating .

6 .2 AGRICULTURAL CAPABILITY
The soils of the Pasquia Lake ba-sin in the undrained native state arerated in agricultural capabilityclasses 6W and 7W . Proposed drainageimprovement for Pasquia Lake if im-plemented on a large scale projectbasis, should raise the agriculturalcapability to Class 3W and 4W . Fol-lowing drainage improvement, moder-ately severe to severe limitations ofexcess wetness resulting from the ex-tremely level terrain in the lake ba-sin and the slow internal drainage ofthe dominantly clayey textured soilswill continue to affect the agricul-tural use of the area .
All soils in the Pasquia Lake bedare presently non-saline . Howeverapproximately 687 ha in the west endof the lake basin are affected bysomewhat higher than desirable levelsof soil salinity (electrical conduc-tivity values of 2-4 mS/cm) . Possi-ble impact of drainage improvement onsoil salinity in the lake basin mustbe considered in assessing the agri-cultural potential of the area .
6 .3 SOIL PRODUCTIVITY
The productivity of soils in thePasquia Lake basin is expected to becomparable to long term yields ob-tained in the agriculturally devel-oped portions of Polders I and II .The results of field crop demonstra-tion trials conducted in the PasquiaLand Settlement Project from 1957 to1970 are summarized in Table 8 . .These data indicate that yield ofspring wheat, durum wheat, barley,oats, flax, rapeseed and potatoesgrown under good management can beexpected to yield better than, or aswell as the same crops grown in com-parable variety trials elsewhere inthe Province . At the latitude of ThePas however, it is important to rec-ognize that early seeding of
spring-sown crops is an essentialpart of good management .
In addition, adequate levels offertility should be maintained' foroptimum production of all crops onall soils . Recent farm experience inthe Project indicates that where goodsoil management is applied, on-farmcrop production ranges from 60 to 85percent of the experimental plotyields . These yields are potentiallyeconomic and compare favourably withfarm crop yields from southern Mani-toba .
6 .4 SOIL MANAGEMENT
On the basis of anticipated con-tinuing soil limitations followingdrainage improvement, optimum agri-cultural use of the Pasquia Lake ba-sin will be achieved by integrationof crop production with livestockproduction . Livestock enterprises inthe area can utilize tame foragesgrown on those soil areas not wellsuited for continuous production ofcereal and oil seed crops .
If optimum yields are to be ob-tained on soils in the Pasquia Lakebasin, cropping practices and landuse should be flexible enough to ac-comodate specific soil conditions .For example, forage crops are recom-mended as an alternative to annualcrops in locally wet areas that re-main somewhat poorly drained afterreclamation and which cannot be seed-ed early in the season . The betterdrained phases of Big Lake and Le Passoils around the periphery of thelake basin can be utilized to grow awider range of crops including annualcereal and oilseed crops .
Drainage control in the PasquiaLake basin will be most effective inremoving surface waters . The effecton lowering the water tables in thearea will be very slow because of the
48

high clay content and low permeabili-ty of the soils . Removal of surfacewater from the lake bed may also in-crease removal of water from the soilby evaporation and transpiration .Loss of water through these processescould accelerate upward movement ofwater and salt . If such upward move-ment occurs to a greater extent thandownward leaching, the net effectwill be to increase the concentrationof soluble salts at or near the soilsurface .
Drainage improvement and subseq-uent land use should take into -ac-count the potential for salinizationin the west end of Pasquia Lake . TheBig Lake and Le Pas soils in thisarea of the lake bed are character-ized by higher than desirable levelsof salinity and require special man-agement until trends in salt levelsare determined . Drainage waters fromthis area should be isolated and re-moved separately to help contain anytendency for salinity to spread fur-ther into the lake . Until the trend
in salinity concentration is known .These soils should be used for pas-ture or forage production . Suchcrops tend to tolerate salt betterthan most cereal crops . In addition,they provide more shade to the soilsurface reducing evaporation and re-move water from within the so,jl forlonger periods of the year providingroom for downward leaching of solublesalts .
Depressional areas in the centralportion of the lake basin which areprone to water logging will be bestutilized for production of water tol-erant forage crops such as reed ca-nary and tall wheatgrass or alsikeclover . Slightly better drainedsoils along the margin of the lakebasin may be utilized for growing awider range of crops including annualcereals and oilseeds in addition toforage crops . A fallow-grain systemof agriculture should be avoided onall soils as summerfallow mayincrease salinity levels at the soilsurface .
Table 8 . Mean Yields of Crops Grown Experimentally in the Pasquia Project inComparison with all other Zonal Mean Yields of Crops Grown in CropAdaptation Trials Throughout the Province, 1956-1970 .
Pasquia Other Provincial Trials Duration of record
Spring Wheat 47 .6 b .p .a . 31 .7 b .p .a . 14 Year MeanDurum Wheat 52 .2 b .p .a . 36 .5 b .p .a . 12 Year MeanBarley 75 .9 b .p .a . 51 .7 b .p .a . 12 Year MeanOats 77 .3 b .p .a . 69 .2 b .p .a . 11 Year MeanFlax 28 .6 b .p .a . 19 .8 b .p .a . 15 Year MeanRapeseed (Argentine) 2201 lbs/ac 1619 lbs/ac 11 Year MeanRapeseed (Polish) 1588~lbs/ac 1276 lbs/ac 11 Year MeanPotatoes 302 b .p .a . 300 b .p .a .
Source : Ellis J .H ., 1971 . Report of Field Crop Experiments in the PasquiaArea, 1956-1970 . Man . Dept . of Mines and Natural Resources, Wpg .,Man .
-49-

REFERENCES
AES, 1982 . Canadian Climate Normals,1951-1980 . Temperature ; Volume3, Precipitation ; Volume 4, DegreeDays ; and Volume 6, Frost .Atmospheric Environment Service,Environment Canada .
Anon, 1965 . Soil CapabilityClassification for Agriculture .Report No . 2 Canada LandInventory . Canada Dept . RegionalEconomic Expansion . Ottawa .16pp .
Canada Soil Survey Committee, 1978 .The Canadian System of SoilClassification . Canada Dept . Agr .Publ . 1646, 154pp .
Cowardin, Lewis M ., Virginia Carter,Francis C . Golet and Edward T .LaRoe, 1979 . Classification ofWetland and Deepwater Habitats ofthe United States . Fish andWildlife Service . Publ . No .FWS/OBS . U .S . Dept . Interior .
Mills, G .F ., C . Tarnocai and C .F .Shaykewich, 1977 . Characteristicsand Distribution of SoilTemperature Regimes in Manitoba,Canada . Papers presented at the.21st Annual Manitoba Soil ScienceMeeting, University of Manitoba,Winnipeg . pp . 56-85 .
Pederson, A ., 1973 . GroundwaterAvailability in The Pas Area .Groundwater Availability StudiesReport No . 9 . Water ResourcesBranch, Dept . of Mines, Resourcesand Environmental Management .33pp . and maps .
Robertson, D . and B . Jones, 1981 .Pasquia and Big Lakes WildlifeAssessment, August, 1981 .Appendix B in Pasquia LandSettlement Project Progress Reportprepared for Working Group onPasquia Land Settlement Project .Manitoba Department of NaturalResources .
Ehrlich, W .A ., L .E . Pratt, F .P .LeClair and J .A . Barr . 1960 .
Rutulis, M . 1981 . GroundwaterConditions in the Pasquia Lake
Report of Detailed Soil Survey ofPasquia Map Area in NorthernManitoba . Manitoba Soil SurveyReport No . 11 .
Ferguson, W .S ., and B .J . Gorby, 1962 .Soil Salinity Studies, Pasquia
Area in Pasquia Land SettlementProject Progress Report preparedfor Working Group on Pasquia LandSettlement Project . ManitobaDepartment of Natural Resources .
USDA Handbook No . 60 . 1954 .Development Project . Papers Diagnosis and Improvement ofpresented at the sixth Annual Saline and Alkali Soils . UnitedManitoba Soil Science Meeting, States Salinity Laboratory Staff .Winnipeg .
Koppen, W . and Geiger, (1936)"Handbuch der Klimatologie" . BondI ., Teil C ., Gebuder Borntraeger,Berlin .
-50-

Appendix A
GLOSSARY
AASHO classification (soil engineer-ing) - The official classifica-tion of soil materials and soilaggregate mixtures for highwayconstruction used by the AmericanAssociation of State Highway Of-ficials .
Acid soil - A soil having a pH lessthan 7 . See pH and Reaction,soil .
soil that can be readily absorbedand assimilated by growingplants .
Available soil moisture - The portionof water in a soil that can bereadily absorbed by plant roots :generally considered to be thatwater held in the soil up to ap-proximately 15 atmospheres pres-sure .
Alkaline soil - A soil having a pHgreater than 7 . See Reaction,soil .
Alluvium - A general term for all de-posits of rivers and streams .
Arable soil - Soil suitable for plow-ing and cultivation .
Association - A sequence of soils ofabout the same age, derived fromsimilar parent material, and oc-curing under similar climaticconditions but showing differentcharacteristics due to variationsin relief and in drainage .
1 /3 Atmosphere Moisture - The mois-ture percentage on dry weight ba-sis of a soil sample that hasbeen air dried, screened, satu-rated and subjected to a soilmoisture tension of 345 cm of wa-ter through a permeable membranefor a period of 48 hours . It ap-proximates the soil moisture re-tention capacity .
Available nutrient - That portion ofany element or compound in the
Bearina capacity - Capacity of soil(in moist to wet conditions) tosupport loads such as buildings,people, vehicles, and animals .
Bedrock - The solid rock that under-lies soil and regolith or that is
exposed at the surface .
Boulders - Stones which are largerthan 60 cm in diameter .
Bulk density - The weight of oven drysoil (105 degrees C) divided byits volume at field moisture con-ditions, expressed in grams percubic centimeter .
Buried soil - Soil covered by an al-luvial, loessial, or other depos-it, usually to a depth greaterthan the thickness of the solum .
Calcareous soil - Soil containingsufficient calcium carbonate (of-ten with magnesium carbonate) toeffervesce visibly when treatedwith hydrochloric acid .
Calcium Carbonate E uivale_nt - Refersto the percent of carbonates in
- 51 -

the soil expressed on the basisof calcium carbonate . Terms usedto express the carbonate contentsof soils are :
noncalcareous . . . . . . .<7aweakly calcareous . . . . 1-50moderately calcareous . .6-150strongly calcareous . . 16-250v . strongly calcareous . 26-400extremely calcareous . . . >40%
Capillary fringe - A zone of essen-tially saturated soil just abovethe water table . The size dis-tribution of the pores determinesthe extent and degree of the ca-pillary fringe .
Carbon -nitrogen ratio (C/N ratio) -The ratio of the weight of organ-ic carbon to the weight of totalnitrogen in a soil or in an or-ganic material .
Cation Exchange Capacity (_CEC) - Ameasure of the total amount ofexchangeable cations that can beheld by a soil . Expressed inmilliequivalents per 100g ofsoil .
Clay - As a soil separate, the miner-al soil particles less than 0 .002mm in diameter : usually consist-ing largely of clay minerals . Asa soil textural class, soil ma-terials that contain 40 or morepercent clay, less than 45 per-cent sand and less than 40 per-cent silt .
Cobbles - Rock fragments 8 to 25 cmin diameter .
Color - Soil colors are compared witha Munsell color chart . The Mun-sell system specifies the rela-tive degrees of the three simplevariables o£ color : hue, valueand chroma . For example : 10YR6/4 means a hue of 10YR, a valueof 6, and a chroma of 4 .
Complex ( soil ) - A mapping unit usedin detailed and reconnaissancesoil surveys where two or moresoil series that are so intimate-ly intermixed in an area that itis impractical to separate themat the scale of mapping used .
Concretions - Hard grains, pell~ets ornodules from concentration ofcompounds in the soil that cementsoil grains together .
Conductivity , electrical - A physicalquantity that measures the readi-ness with which a medium (irriga-tion water and soil extracts)transmits electricity . It ex-presses the concentration of saltin terms of the conductance (re-ciprocal of the electric resis-tance in ohms) in millisiemensper cm .
Consistence ( soil ) - The mutual at-traction of the particles in asoil mass, or their resistence toseparation or deformation . It isdescribed in terms such as loose,soft, friable, firm, hard,sticky, plastic or cemented .
Consumptive _use factor (_CU) - The ra-tio of consumptive use of waterby a crop to potential evapotran-spiration . and transpiration .An actively growing crop thatcompletely covers the soil over alarge area and that has an amplesupply of readily available soilwater has a consumptive use fac-tor of 1 .0 .
Consumptive _use _of water - The sum of.the depths of water transpired bythe plants and evaporated fromthe soil surface and from inter-cepted precipitation . It may beless or greater than potentialevapotranspiration .
Contour - An imaginary line connect-ing points of equal elevation onthe surface of the soil .
-52-
Cover - This term generally has oneof the following meanings :
1 . Vegetation or other materialproviding protection
2 . In forestry, low growingshrubs and herbaceous plantsunder trees (i .e ., groundcover vs . tree cover)
3 . Any vegetation producing aprotective mat on or justabove the soil surface .
Creep ( soil ) - Slow mass movement ofsoil and soil material down rath-er steep slopes primarily underthe influence of gravity, butaided by saturation with waterand by alternate freezing andthawing .
Decile portion - A one-tenth portion .As used in the soil map symbolA7-B3 means that the A soils cov-er seven tenths and the B soilscover three tenths of the mapunit .
Delta - A fluvial or glaciofluvialfan shaped deposit at the mouthof a river that empties into alake or sea .
Deflocculate - To separate or tobreak up soil aggregates into in-dividual particles by chemical orphysical means or both .
Degradation (of soils ) - The changingof a soil to a more highlyleached and more highly weatheredcondition, usually accompanied bymorphological changes such as thedevelopment of an eluviated lightcolored (Ae) horizon .
Dispersion - Is rated high, moderateor low depending on how readilythe soil structure breaks down orslakes because of excess mois-ture . A rating of high indicatesthat soil aggregates slake
readily ; a rating of low indi-cates that aggregates are resis-tant to dispersion and remainclumped together .
Drainage ( soil ) - (1) The rapidityand extent of the removal of wa-ter from the soil by runoff andflow through the soil to=under-ground spaces . (2) As a condi-tion of the soil, it refers tothe frequency and duration ofperiods when the soil is free ofsaturation .
Drainage in soil reports isdescribed on the basis of actualmoisture content in excess offield capacity and length of thesaturation period within theplant root zone . The terms areas follows :
Very rapidly drained - Water isremoved from the soil very rapid-ly in relation to supply . Excesswater flows downward very rapidlyif underlying material is pervi-ous . There may be very rapidsubsurface flow during heavyrainfall provided there is asteep gradient . Soils have verylow available water storage ca-pacity (usually less than 2 .5 cm)within the control section andare usually coarse in texture, orshallow, or both . Water sourceis precipitation .
Rapidly drained - Water is re-moved from the soil rapidly inrelation to supply . Excess waterflows downward if underlying ma-terial is pervious . Subsurfaceflow may occur on steep gradientsduring heavy rainfall . Soilshave low available water storagecapacity (2 .5-4 cm) within thecontrol section, and are usuallycoarse in texture, or shallow, orboth . Water source is precipita-tion .
- 53

Well drained - Water is removedfrom the soil readily but notrapidly . Excess water flowsdownward readily into underlyingpervious material or laterally assubsurface flow . Soils have in-termediate available water stor-age capacity (4-5 cm) within thecontrol section, and are general-ly intermediate in texture anddepth . Water source is precipi-tation . On slopes subsurfaceflow may occur for short dura-tions but additions are equaledby losses . These soils are usu-ally free of mottles within 1100cm of the surface but may be mot-tled below this depth . Soil ho-rizons are usually bright col-ored .
Moderately well drained - Wateris removed from the soil somewhatslowly in relation to supply .Excess water is removed somewhatslowly due to low perviousne5s,shallow water table, lack of gra-dient, or some combination ofthese . Soils have intermediateto high water storage capacity(5-6cm) within the control sec-tion and are usually medium tofine in texture . Soils are com-monly mottled in the 50 to 100 cmdepth . Colors are dull brown inthe subsoil with" stains and mot-tles .
Imperfectly drained - Water isremoved from the soil sufficient-ly slowly in relation to supplyto keep the soil wet for a sig-nificant part of the growing sea-son . Excess water moves slowlydownward if precipitation is ma-jor supply . If subsurface wateror groundwater, or both, is themain source, flow rate may varybut the soil remains wet for asignificant part of the growingseason . Precipitation is themain source if available waterstorage capacity is high ; contri-
bution by subsurface flow orgroundwater flow, or both, in-creases as available water stor-age capacity decreases . Soilshave a wide range in availablewater supply, texture, and depth,and are gleyed phases of welldrained subgroups . These soilsgenerally have mottling bel'ow thesurface layers and generally haveduller colors with depth, gener-ally brownish gray with mottlesof yellow and gray .
Poorly drained - Water is removedso slowly in relation to s,upplythat the soil remains wet for acomparatively large part of thetime the soil is not frozen . Ex-cess water is evident in the soilfor a large part of the time .Subsurface flow or groundwaterflow, or both, in addition toprecipitation are main watersources ; there may also be aperched water table, with precip-itation exceeding evapotranspira-tion . Poorly drained soils havea wide range in available waterstorage capacity, texture, anddepth, and are gleyed subgroups,Gleysols, and Organic soils .
Very poorly drained - water isremoved from the soil so slowlythat the water table remains ator on the surface for the greaterpart of the time the soil is notfrozen . Excess water is presentin the soil for the greater partof the time . Groundwater flowand subsurface flow are major wa-ter sources . Precipitation isless important except where thereis a perched water table withprecipitation exceeding evapo-transpiration . These soils havea wide range in available waterstorage capacity, texture, anddepth, and are either Gleysolicor Organic .
-54-

Dryland farming - The practice ofcrop production in low rainfallareas without irrigation .
Eluvial horizon - A horizon fromwhich material has been removedin solution or in water suspen-sion .
Eolian - Soil material accumulatedthrough wind action .
Erosion - The wearing away of theland surface by detachment andtransport of soil and rock ma-terial through the action of mov-ing water, wind or other geolog-ical processes . The ratings oferosion are :
Erosion 1 slightly eroded -soil with a suffi-cient amount of the Ahorizon removed thatordinary tillage willbring up and mix theB horizon or otherlower lying horizonswith surface soil inthe plow layer .
Erosion 2 moderately eroded -soil with all of theA horizon and a partof the B or otherlower lying horizonsremoved . The plowlayer consists mainlyof the original hori-zons below the A orbelow the originalplow layer .
Erosion 3 severely eroded -soils have practical-ly all of the origi-nal surface soil re-moved . The plowlayer consists mainlyof C horizon materi-al, especially onknolls and steep up-per slope positions .
Evapotranspiration - The combinedloss of water from a given area,and during a specific period oftime, by evaporation from thesoil surface and transpirationfrom plants .
Field "Moisture Eauivalent - The mini-mum moisture content at which adrop of water placed on asmoothed surface of the soil willnot be absorbed immediately bythe soil, but will spread outover the surface and give it ashiny appearance .
Flood lain - The land bordering astream, built up of sedimentsfrom overflow of the stream andsubject to innundation when thestream is at flood stage .
Fluvial deposits - All sediments pastand present, deposited by flowingwater, including glaciofluvialdeposits .
Frost heave - The raising of the sur-face caused by ice in the sub-soil .
Friable - Soil aggregates that aresoft and easily crushed betweenthumb and forefinger .
Glaciofluvial deposits - Materialmoved by glaciers and subsequent-ly sorted and deposited bystreams flowing from the meltingice . These deposits are strati-fied and may occur in the form ofoutwash plains, deltas, kames,eskers and kame terraces .
Gleyed soil - An imperfectly or poor-ly drained soil in which the ma-terial has been modified by re-duction or alternating reductionand oxidation . These soils havelower chromas or more prominentmottling or both in some horizonsthan the associated well-drainedsoil .
-55-

Gleysolic - An order of soils devel-oped under wet conditions andpermanent or periodic reduction .These soils have low chromas orprominent mottling or both, insome horizons .
Gravel - Rock fragments 2 mm to 7 .5cm in diameter .
Ground Moraine - An unsorted mixtureof rocks, boulders, sand, siltand clay deposited by glacialice . The predominant material istill ; most till is thought tohave accumulated under the ice bylodgment, but some till has beenlet down from the upper surfaceof the ice by ablation . Resort-ing and modification may havetaken place to some extent bywave-action of glacial melt wa-ters . The topography is mostcommonly in the form of undulat-ing plains with gently slopinghills and enclosed depressions .
Groundwater - Water beneath the soilsurface, usually under conditionswhere the voids are completelyfilled with water (saturation),
Halophytic vegetation - vegetationthat grows naturally in soilshaving a high content of varioussalts . It usually has fleshyleaves or thorns and resemblesdesert vegetation .
Horizon ( soil ) - A layer in the soilprofile approximately parallel tothe land surface with more orless well-defined characteristicsthat have been produced throughthe operation of soil formingprocesses .
Horizon boundary - The lower boundaryof each horizon is described byindicating its distinctness andform . The distinctness dependson the abruptness of verticalchange (thickness) . The form re-fers to the variation of the
boundary plane
Distinctnessabrupt - less than 2 cmclear - 2 to 5 cmgradual - 5 to 15 cmdiffuse - more than 15 cm
Form -smooth - nearly plainwavy - pockets are wider thandeepirregular - pockets are deeperthan widebroken - parts of the horizon areunconnected with other parts
Humic layer - A layer of highly de-composed organic soil materialcontaining little fibre .
Hydraulic Conductivity - Refers tothe effective flow velocity ordischarge velocity in soil atunit hydraulic gradient . It isan approximation of the perme-ability of the soil and is ex-pressed in cm per hour . Theclasses are described in generalor specific terms as :
High >15 Very rapid >50Rapid 15-50
Medium 0 .5-15 Mod . rapid 5 .0-15Moderate 1 .5--5 .0Mod . slow 0 .5-1 .5
Low <0 .5 Slow 0 .15-0 .5Veryslow 0 .015-0 .15Extremely-slow < .015
Hydrologic c ycle - The conditionsthrough which water naturallypasses from the time of precipi-tation until it is returned tothe atmosphere by evaporation andis again ready to be precipitat-ed .
Hydrophyte - Plants growing in wateror dependent upon wet or saturat-ed soil conditions for growth .
56

Illuvial horizon - A soil horizon inwhich material carried from anoverlying layer has been precipi-tated from solution or depositedfrom suspension . The layer ofaccumulation .
Impeded drainage - A condition thathinders the movement of water bygravity through the soils .
Inclusion - Soil type found within amapping unit that is not exten-sive enough to be mapped sepa-rately or as part of a complex .
Infiltration - The downward entry ofwater into the soil
Irrigation - The artificial applica-tion of water to the soil for thebenefit of growing crops .
Irrigation requirement (_IR) - Refersto the amount of water exclusiveof effective precipitation thatis required for crop production .
Lacustrine deposits - Material depos-ited by or settled out of lakewaters and exposed by lowering ofthe water levels or elevation ofthe land . These sediments rangein texture from sand to clay andare usually varved (layered annu-al deposits) .
Landforms - See Description of Land-forms
Landscape - All the natural featuressuch as fields, hills, forest,water, etc ., which distinquishone part of the earth's surfacefrom another part .
Leaching - The removal from the soilof materials in solution .
Li uid limit (upper plastic limit ) -The water content correspondingto an arbitrary limit between theliquid and plastic states of con-
sistency of a soil . The watercontent at this boundary is de-fined as that at which a pat ofsoil cut by a groove of standarddi~mensions will flow together fora distance of 1 .25 cm under theimpact of 25 blows in a standardliquid limit apparatus . ,
Lineal shrinkage - This is the de-crease in one dimension expressedas a percentage of the originaldimension of the soil mass whenthe moisture content is reducedfrom a stipulated percentage(usually field moisture equiva-lent) to the shrinkage limit .
Mapping Unit - Any delineated areashown on a soil map that is iden-tified by a symbol . A mappingunit may be a soil unit, a mis-cellaneous land type, or a soilcomplex .
Marsh - Periodically flooded or con-tinually wet areas having thesurface not deeply submerged . Itis covered dominantly with sedg-es, cattails, rushes or other hy-drophytic plants .
Mature soil - A soil having well-de-veloped soil horizons produced bythe natural processes of soilformation .
Mesophyte - Plants requiring interme-diate moisture conditions and arenot very resistant to drought .
Microrelief - Small-scale, local dif-ferences in relief includingmounds, swales or hollows .
Millieauivalent (_me) - One-thousandthof an equivalent . An equivalentis the weight in grams of an ionor compound that combines with orreplaces one gram of hydrogen .The atomic or formula weight di-vided by valence .
-57-

Mottles - Irregularly marked spots orstreaks, usually yellow or orangebut sometimes blue . They are de-scribed in order of abundance(few, common, many), size (fine,medium, coarse) and contrast(faint, distinct, prominent) .Mottles in soils indicate pooraeration and lack of good drain-age .
Organic carbon - Carbon derived fromplant and animal residues .
Organic matter - The fraction of thesoil which consists of plant andanimal residues at various stagesof decomposition, cells and tis-sues of soil organisms and subs-tances synthesized by the soilpopulation . It is determined onsoils that have been sievedthrough a 2 .0 mm sieve . It isestimated by multiplying the or-ganic carbon by a factor of 1 .72 .
Outwash - Sediments "washed out" be-yond the glacier by flowing waterand laid down in thin beds orstrata . Particle size may rangefrom boulders to silt .
Ovendry soil - Soil that has beendried at 105 degrees C until ithas reached constant weight .
Parent material - The unaltered oressentially unaltered mineral ororganic material from which thesoil profile develops by pedogen-ic processes .
Particle size , soil - The grain sizedistribution of the whole soilincluding the coarse fraction .It differs from texture, whichrefers to the fine earth (lessthan 2mm) fraction only . In ad-dition, textural classes are usu-ally assigned to specific hori-zons whereas soil familyparticle-size classes indicate acomposite partic.le size of a partof the control section that may
include several horizons . SeeTextural Triangle at end of Glos-sary .
The particle-size classes forfamily groupings are as follows :
FraQmental Stones, cobble~s andgravel, with too little fineearth to fill interstices largerthan 1 mm .
Sandy - skeletal Particles coarserthan 2 mm occupy 350 or more byvolume with enough fine earth tofill interstices larger than 1mm ; the fraction finer than 2 mmis that defined for the sandyparticle-size class .
Loamy - skeletal Particles 2 mm-25cm occupy 35% or more by volumewith enough fine earth to fillinterstices larger than 1 mm ; thefraction finer than 2 mm is thatdefined for the loamy particle-size class .
Clayey- skeletal Particles 2 mm-25cm occupy 35% or more by volumewith enough fine earth to fillinterstices larger than 1 mm ; thefraction finer than 2 mm is thatdefined for the clayey particle-size class .
Sandy The texture of the fineearth includes sands and loamysands, exclusive of loamy veryfine sand and very fine sand tex-tures ; particles 2 mm- 25 cm oc-cupy less than 35% by volume .
Loamy The texture of the fineearth includes loamy very finesand, very fine sand, and finertextures with less than 35% clay ;particles 2 mm-25 cm occupy lessthan "s5o by volume .
Coarse - loamy . A loamy particlesize that has 15% or more byweight of fine sand (0 .25-0 .1 mm)
58

or coarser particles, includingfragments up to 7 .5 cm, and hasless than 18% clay in the fineearth fraction .
Fine- loamy . A loamy particlesize that has 150 or more byweight of fine sand (0 .25-0 .1 mm)or coarser particles, includingfragments up to 7 .5 cm, and has18-35o clay in the fine earthfraction .
Coarse- silty . A loamy particlesize that has less than 15% offine sand (0 .25-0 .1 mm) or coar-ser particles, including frag-ments up to 7 .5 cm, and has lessthan 18% clay in the fine earthfraction .
Fine -silty . A loamy particlesize that has less than 150 offine sand (0 .25-0 .1 mm) or coar-ser particles, including frag-ments up to 7 .5 cm, and has18-35o clay in the fine earthfraction .
Clayey . The fine earth contains35% or more clay by weight andparticles 2mm-25 cm occupy lessthan 35% by volume .
Fine -clayey . A clayey particlesize that has 35-60o clay in thefine earth fraction .
Very - fine-clayey . A clayey par-ticle size that has 600 or moreclay in the fine earth fraction .
Ped - An individual soil aggregatesuch as granule, prism or blockformed by natural processes (incontrast with a clod which isformed artificially) .
Pedolo4y - Those aspects of soil sci-ence involving constitution, dis-tribution, genesis and classifi-cation of soils .
Percolation - The downward movementof water through soil ; specifi-cally, the downward flow of waterin saturated or nearly saturatedsoil at hydraulic gradients of1 .0 or less .
Permafrost -
1 . Perennially frozen materialunderlying the solum .
2 . A perennially frozen soil ho-rizon .
Permafrost table - The upper boundaryof permafrost, usually coincidentwith the lower limit of seasonalthaw (active layer) .
Permeability - The ease with whichwater and air pass through thesoil to all parts of the profile .See hydraulic conductivity .
pH - The intensity of acidity andalkalinity, expressed as the neg-ative logarithm of the hydrogenion concentration . A pH of 7 isneutral, lower values indicateacidity and higher values alka-linity (see Reaction, soil) .
Phase , soil - A soil phase is used tocharacterize soil and landscapeproperties that are not used ascriteria in soil taxonomy . Themajor phase differentiae are :slope, erosion, deposition, sto-niness, textcalcareousnes
ure,s .
salinity, and
Plastic Limit - The water contentcorresponding to an arbitrarylimit between the plastic and thesemisolid states of consistencyof a soil .
Plasticity Index - The numerical dif-ference between the liquid andthe plastic limit . The plastici-ty index gives the range of mois-ture contents within which a soilexhibits plastic properties .
-59-
Potential evapotranspiration (PE) - the exchangeable-sodium percent-The maximum quantity of water ca- age is less than 15, and the pHpable of being lost as water va- is usually less than 8 .5 . Ap-por, in a given climate, by a proximate limits of salinitycontinuous stretch of vegetation classes are :covering the whole ground andwell supplied with water . non-saline 0
weakly saline 4mod . saline 8strongly saline
to 4 ms/cmto $_mS/cm
to 15 ms/cm>15 ms/cm
Profile , soil - A vertical section ofthe soil through all its horizonsand extending into the parent ma-terial .
Reaction , soil - The acidity or alka-linity of a soil . Soil reactionclasses are characterized as fol-lows :
extremely acid pH <4 .5very strongly acid 4.5 to 5 .0strongly acid 5 .1 to 5 .5medium acid 5 .6 to 6 .0slightly acid 6 .1 to 6 .5neutral 6 .6 to 7 .3mildly alkaline 7 .4 to 7 .8mod . alkaline 7 .9 to 8 .4strongly alkaline 8 .5 to 9 .0very stronglyalkaline >9 .0
Regolith - The unconsolidated mantleof weathered rock and soil ma-terial on the earth's surface .
Relief - The elevation of inequali-ties of the land surface whenconsidered collectively .
Runoff - The portion of the totalprecipitation on an area thatflows away through stream chan-nels . Surface runoff does notenter the soil . Groundwater ru-noff or seepage flow from ground-water enters the soil beforereaching the stream .
Saline Soil - A nonalkali soil con-taining soluble salts in suchquantities that they interferewith the growth of most cropplants . The conductivity of thesaturation extract is greaterthan 4 millisiemens/cm (ms/cm),
Salinization - The process of accumu-lation of salts in the soil .
Salt -Affected Soil - Soil that hasbeen adversely modified for thegrowth of most crop plants by thepresence of certain types of ex-changeable ions or of solublesalts . It includes soils havingan excess of salts, or an excessof exchangeable sodium or both .
Sand - A soil particle between 0 .05and 2 .0 mm in diameter . The tex-tural class name for any soilcontaining 85 percent or more ofsand and not more than 10 percentof clay .
Saturation Percentage - The moisturepercentage of a saturated soilpaste, expressed on an oven dryweight basis .
Se_epaqe -
1 . The escape of water downwardthrough the soil .
2 . The emergence of water fromthe soil along an extensiveline of surface in contrastto a spring where wateremerges from a local spot .
Series , soil - A category in the Can-adian System of Soil Classifica-tion . It consists of soils thathave soil horizons similar intheir differentiating character-istics and arrangement in theprofile, except for surface tex-
60

ture and are formed from aparticular type of parent materi-al .
Shrinkage limit - This is the mois-ture content at which an equilib-rium condition of volume changeis reached and further reductionin moisture content will notcause a decrease in the volume ofthe soil mass .
Shrinkage ratio - This is the ratiobetween the volume change and acorresponding change in moisturecontent . It equals the apparentspecific gravity of the driedsoil .
Silt - (a) Individual mineral parti-cles of soil that range in diame-ter between 0 .05 to .002 mm . (b)Soil of the textural class siltcontains greater than 80 percentsilt and less than 12 percentclay .
Slickenside - Smoothed surfaces alongplanes of weakness resulting fromthe movement of one mass of soilagainst another in soils dominat-ed by swelling clays .
Sodium-Adsoription Ratio (_S ._A ._R .) - Aratio for soil extracts and irri-gation waters used to express therelative activity of sodium ionsin exchange reactions with othercations in the soil SAR =Na/((Ca+Mg)/2)'/1 where the ca-tion concentrations are expressedas milliequivalents per litre .
Soil - The unconsolidated mineral ma-terial on the immediate surfaceof the earth that serves as anatural medium for the growth ofland plants . Soil has been sub-jected to and influenced by ge-netic and environmental factorsof : parent material, climate (in-cluding moisture and temperatureeffects), macro- and micro-organ-
isms, and topography, all actingover a period of time .
Solum - The upper horizons of a soilabove the parent material and inwhich the processes of soil for-mation are active . It usuallycomprises the A and B horizons .
Stones - Rock fragments greater than25 cm in diameter .
Stoniness - The percentage of landsurface occupied by stones . Theclasses of stoniness are definedas follows :
Stones 0 . Nonstony -- Land havingless than 0 .01% of surface occu-pied by stones .
Stones _1 . Slightly stony -- Landhaving 0 .01-0 .10 of surface occu-pied by stones . Stones 15-30 cmin diameter, 10-30 m apart . Thestones offer only slight to nohindrance to cultivation .
Stones 2 . Moderately stony --Land having 0 .1-30 of surface oc-cupied by stones . Stones 15-30cm in diameter, 2-10 m apart .Stones cause some interferencewith cultivation .
Stones _3 . Very stony -- Land hav-ing 3-15a of surface occupied bystones . Stones 15-30 cm in diam-eter, 1-2 m apart . There aresufficient stones to constitute aserious handicap to cultivation .
Stones _4 . Exceedingly stony --Land having 15-500 of surface oc-cupied by stones . Stones 15-30cm in diameter, 0 .7-1 .5 m apart .There are sufficient stones toprevent cultivation until consid-erable clearing has been done .
Stones _5 . Excessively stony --Land having more than 500 of sur-face occupied by stones . Stones
- 61 -

15-30 cm in diameter, less than0 .7 m apart . The land is toostony to permit cultivation .
Storage Capacity - Refers to the max-imum amount of readily availablewater that can be stored withinthe rooting zone of a crop in agiven soil . For practical irri-gation purposes, 50 percent ofthe total soil water betweenfield capacity and wilting pointmay be considered as readilyavailable .
Stratified materials - Unconsolidatedsand, silt and clay arranged instrata or layers . In stratifiedmaterials, a bed is a unit layerdistinctly separable from otherlayers and is one or more cmthick but a lamina is a similarlayer less than 1 cm thick .
Structure - The combination or ar-rangement of primary soil parti-cles into aggregates of secondarysoil particles, units or peds,which are separated from eachother by surfaces of weakness .Structure is expressed in termsof grade, size class and shapetyne . Grade refers to the dis-tinctness of aggregate develop-ment, and is described as struc-tureless, weak, moderate orstrong . Structureless refers tothe absence of observable aggre-gation of definite order.ly ar-rangement ; the term amorphous isused if soil is massive or cohe-rent, single-grained if noncohe-rent . The weak to strong aggre-gates vary in size and aredescribed by class as fine, medi-um, coarse, and very coarse de-pending on the shape types . Theshape types refers to the domi-nant configuration of the aggre-gates and the way they are accom-modated . The general shape typesare plate-like, block-like andprism-like . The terms are :
Platy - Having thin, plate-likeaggregates with faces mostly hor-izontal
Prismatic - Having prism-likeaggregates with tops and edges,appear plane, level and somewhatangular . _
Columnar - Having prism-likeaggregates with vertical edgesnear the top of columns, notsharp .
Granular - Having block-likeaggregates that appear as spher-oids or polyhedrons having planeor curved surfaces which haveslight or no accommodation to thefaces of the surrounding peds .
Blocky - Having block-likeaggregates with sharp, angularcorners
Subanaular blocky - Havingblock-like aggregates with round-ed and flattened faces and round-ed corners .
By convention an aggregate isdescri bed in the order of gr ade,class and type, e .g . strong, me-dium, blocky . In the parent ma-terial of soils the material withstructural shapes may be desig-nated as pseudo-blocky, pseudo-platy, etc .
Soil Survey - The systematic examina-tion, description, classifica-tion, and mapping of soil in anarea .
Sulfate Hazard - Refers to the rela-tive degree of attack on concreteby soil and water containing var-ious amounts of sulfate ions . Itis estimated from electrolytemeasurements and salt analysis onselected profiles and soil sam-ples, and by visual examinationof free gypsum within the profile
-62-
during the course of soilinvestigation .
Swam - S ee Des cription of Landforms
Texture , soil - The relative propor-tions of the fine earth (lessthan 2 mm .) fraction of a soil .Textural classes are usually as-signed to specific horizonswhereas family particle sizeclasses indicate a composite par-ticle size of a portion of thecontrol section that may includeseveral horizons . See TextureTriangle at end of Glossary .
The size range of the constit-uent primary particles are asfollows :
Very coarse sand .Coarse sand . . .Medium sand . . .
Di...
ameter (mm). .2 .0-1 .0. .1 .0-0 .5. 0 .5-0 .25
Fine sand . . . . . .0 .25-0 .10Very fine sand . . . .0 .10-0 .05Silt . . . . . . . . 0 .05-0 .002Clay . . . . . . . . . .< 0 .002Fine clay . . . . . . < 0 .0002
Till , glacial - Unstratified glacialdeposits consisting of clay,sand, gravel, and boulders inter-mingled in any proportion .
Tilth - The physical condition ofsoil as related to its ease oftillage, fitness as a seedbed,and its impedance to seedlingemergency and root penetration .
Topography - Refers to the percentslope and the pattern or frequen-cy of slopes in different direc-tions . A set of 10 slope classesare used to denote the dominantbut not necessarily most abundantslopes within a mapping unit .
Slope Slope Percent Approx .Class Name slope degrees1 level 0-0 .5 02 nearly level .5-2 .5 .3-1 .53 very gentle 2-5 1-3
4 gentle 6-9 3 .5-55 moderate 10-15 6-8 .56 strong 16-30 9-177 very strong 31-45 17-248 extreme 46-70 25-359 steep 71-100 35-4510 very steep >100 >45
Underground runoff - (or .'seep-age)-Water flowing towards streamchannels after infiltration intothe ground .
Unified Soil Classification System(engineering) - A classificationsystem based on the identifica-tion of soils according to theirparticle size, gradation, plas-ticity index and liquid limit .
Urban Land - Areas so altered or ob-structed by urban works or struc-tures that identification ofsoils is not feasible .
Variant , soil - A soil whose proper-ties are believed to be suffi-ciently different from otherknown soils to justify a new se-ries name, but comprising such alimited geographic area that cre-ation of a new series is not jus-tified .
Varve - A distinct band representingthe annual deposit in sedimentarymaterials regardless of originand usually consisting of twolayers, one thick light coloredlayer of silt and fine sand laiddown in the spring and summer,and the other a thin, dark col-ored layer of clay laid down inthe fall and winter .
Water balance , soil - Is' the dailyamount of readily available waterretained by the soil . The dailysoil-water balance is decreasedby the amount that the daily con-sumptive use exceeds the dailyrainfall . When daily rainfallexceeds the consumptive use, thedaily balance increases by the
63
amount of the difference unlessthe soil-water balance is atstorage capacity, in which casethe excess is assumed to be lostby runoff or deep percolation .
Water table - (groundwater surface ;free water surface ; groundwaterelevation) Elevation at which thepressure in the water is zerowith respect to the atmosphericpressure .
of a soil to hold water againstthe force of gravity in a freelydrained soil .
Weathering - The physical and chemi-cal disintegration, alterationand decomposition of rocks andminerals at or near the earth'ssurface by atmospheric agents .
Xerophyte - Plants capable of surviv-ing extended periods of soildrought .
Water - holding capacity - The ability

loo
90
80
70rJ 60V1-- 50ZwV 40zy 30
2010
0
finesiitrl
CoarseSilty
0 10 20 30 40 50 60 70 80 90 100
PER CENT SAND
(and gravel where applicable)
Texture Class ClassGroup Symbol Name
Coarse S sandLS loamy sand
Moderately SL sandy loamcoarse LVFS loamy very fine
sand
Medium Si siltSiL silt loamL loomVFSL very fine sandy
loam
Moderately SCL sandy clay loamfine CL clay loam
SiCL silty clay loom
Fine SC sandy clayC claysic silty clay
Very fine HC heavy clay
Figure 15 : Family particle-size Figure 16 : Soil Textural Classesclasses

Appendix H
SOIL HORIZON DESIGNATIONS
ORGANIC HORIZONS
Organic horizons are found in or-ganic soils, and commonly at the sur-face of mineral soils . They may oc-cur at any depth beneath the surfacein buried soils, or overlying geolog-ic deposits . They contain more than170 organic carbon (approximately 30%organic matter) by weight . Twogroups of these horizons are recog-nized, 0 horizons and the L, F, and Hhorizons .
0 This is an organic horizon devel-oped mainly from mosses, rushes,and woody materials .
Of The fibric horizon is theleast decomposed of all theorganic soil materials . Ithas large amounts of well-preserved fiber that arereadily identifiable as tobotanical origin . A fibrichorizon has 400 or more ofrubbed fiber by volume and apyrophosphate index of 5 ormore . If the rubbed fibervolume is 750 or more, thepyrophosphate criterion doesnot apply .
Om The mesic horizon is the in-termediate stage of decompos-tion with intermediateamounts of fiber, bulk densi-ty and water-holding capaci-ty . The material is partlyaltered both physically andbiochemically . A mesic hori-zon is one that fails to meetthe requirements of fibric orof humic .
Oh The humic horizon is the mosthighly decomposed of the or-ganic soil materials . It hasthe least amount of fiber,the highest bulk density, andthe lowest saturated water-holding capacity . It is verystable and changes very lit-tle physically or chemicallywith time unless it isdrained . The humic horizonhas less than 10% rubbed fi-ber by volume and a pyro-phosphate index of 3 or less .
LFH These organic horizons developedprimarily from leaves, twigs,woody materials and a minor com-ponent of mosses under imperfect-ly to well drained forest condi-tions .
L This is an organic horizoncharacterized by an accumula-tion of organic matter inwhich the original structuresare easily discernible .
F This is an organic horizoncharacterized by an accumula-tion of partly decomposed or-ganic matter . The originalstructures in part are diffi-cult to recognize . The hori-zon may be partly comminutedby soil fauna as in moder, orit may be a partly decomposedmat permeated by fungal hy-phae as in mor .
H This is an organic horizoncharacterized by an accumula-tion of decomposed organic
-66-

matter in which the originalstructures are indiscernible .This material differs from 2 .the F horizon by its greaterhumification chiefly throughthe action of organisms . Itis frequently intermixed withmineral, grains, especiallynear the junction with the 3 .mineral horizon .
MASTER MINERAL HORIZONS
Mineral horizons are those thatcontain less than 30% organic matterby weight as specified for organichorizons .
C
A This is a mineral horizon or ho-rizons formed at or near the sur-face in the zone of leaching orremoval of materials in solutionand suspension or of maximum insitu accumulation of organic mat-ter, or both . Included are :
R1 . horizons in which organic
matter has accumulated as aresult of biological activity(Ah) ;
2 . horizons that have been elu-viated of clay, iron, alumi-num, or organic matte'r, orall of them (Ae) ; W
3 . horizons having characteris-tics of 1) and 2) above buttransitional to underlying Bor C (AB or A and B) ;
4 . horizons markedly disturbed Lby cultivation or pasture(Ap) . b
B This is a mineral horizon or ho- crizons characterized by one ormore of the following :
1 . an enrichment in silicateclay, iron, aluminum, or hu-mus, alone or in combination
(Bt,Bf,Bfh,Bhf, and Bh) ;
a prismatic or columnarstructure that exhibits pro-nounced coatings or stainingsand significant amount of ex-changeable Na (Bn) ;
an alteration by hydrolysis,reduction , or oxidation togive a change in color orstructure from horizons aboveor below, or both, and doesnot meet the requirements of1) and 2) above (Bm,Bg) .
This is a mineral horizon or ho-rizons comparatively unaffectedby the pedogenic processes opera-tive in A and B, excepting (i)the process of gleying, and (ii)the accumulation of calcium andmagnesium carbonates and more so-luble salts (Cca,Csa,Cg, and C) .Marl and diatomaceous earth areconsidered to be C horizons .
This is consolidated bedrock thatis too hard to break with thehands or to dig with a spade whenmoist and that does not meet therequirement of a C horizon . Theboundary between the R layer andoverlying unconsolidated materialis called a lithic contact .
This is a layer of water in Gley-solic, organic, or Cryosolicsoils . It is called a hydriclayer in organic soils .
OWER-CASE SUFFIXES
Buried soil horizon .
A cemented (irreversible) pedo-genic horizon . The ortstein of aPodzol, and a layer cemented bycalcium carbonate and a duripanare examples .
-67-

ca A horizon with secondary carbo-nate enrichment where the concen-tration of lime exceeds thatpresent in the unenriched parentmaterial . It is more than 10 cmthick, and if it has a CaC03equivalent of less than 15 per-cent it should have at least 5percent more CaC03 equivalentthan the parent material (IC) .If it has more than 15 percentCaC03 equivalent it should have1/3 more CaC03 equivalent thanIC . If no IC is present, thishorizon is more than 10 cm thickand contains more than 5 percentby volume of secondary carbonatesin concretions or soft, powderyforms .
cc Cemented (irreversible) pedogenicconcretions .
e A horizon characterized by theeluviation of clay, iron, alumi-num, or organic matter alone orin combination . When dry, it isusually higher in color value by1 or more units than an underly-ing B horizon . It is used with A(Ae) .
f A horizon enriched with amorphousmaterial, principally A1 and Fecombined with organic matter . Itusually has a hue of 7 .5YR orredder or its hue is 10YR nearthe upper boundary and becomesyellower with depth . When moist,the chroma is higher than 3 orthe value is 3 or less . It con-tains 0 .60 or more pyrophosphate-extractable Al+Fe in texturesfiner than sand and 0 .40 or morein sands (coarse sand, sand, finesand, and very fine sand) . Theratio of pyrophosphate-extracta-ble A1+Fe to clay (less than0 .002mm) is more than 0 .05 andorganic C exceeds 0 .5% . Pyro-phosphate-extractable Fe is atleast 0 .30, or the ratio of or-ganic C to pyrophosphate-extrac-table Fe is less than 20, or both
9
68
are true . It is used with Balone (Bf), with B and h (Bhf),with B and g (Bfg), and with oth-er suffixes . The criteria for"f" do not apply to Bgf horizons .The following horizons are dif-ferentiated on the basis of or-ganic carbon content : Bf - 0 .5%to 50 organic carbon . Bhf-morethan 5% organic carbon .
A horizon characterized by graycolors, or prominent mottling, orboth, indicative of permanent orperiodic intense reduction .Ghromas of the matrix are gener-ally 1 or less . It is used withA and e (Aeg) ; with B alone (Bg) ;with B and f (Bfg) ; with B, h,and f (Bhfg) ; with B and t (Btg) ;with C alone (Cg) ; with C and k(Ckg) ; and several others . Insome reddish parent materials,matrix colors of reddish hues andhigh chromas may persist despitelong periods of reduction . Inthese soils, horizons are desig-nated as g if there is gray mot-tling or if there is markedbleaching on ped faces or alongcracks .
Aeg This horizon must meet thedefinitions of A,e, and g .
Bg These horizons are analo-gous to Bm horizons butthey have colors indicativeof poor drainage and peri-odic reduction . They in-clude horizons occurringbetween A and C horizons inwhich the main features are(i) colors of low chroma,that is : chromas of 1 orless, without mottles onped surfaces or in the ma-trix if peds are lacking ;or chromas of 2 or less inhues of 10YR or redder, onped surfaces or in the ma-trix if peds are lacking,accompanied by more

prominent mottles thanthose in the C horizon ; orhues bluer than 10Y, withor without mottles on pedsurfaces or in the matrixif peds are lacking . (ii)colors indicated in (i) anda change in structure fromthat of the C horizons .(iii) color indicated in(i) and illuviation of claytoo slight to meet the re-quirements of Bt ; or accu-mulation or iron oxide tooslight to meet the limitsof Bgf . (iv) colors indi-cated in (i) and removal ofcarbonates . Bg horizons
Bfg,
with more than half of thesoil material occurring asmottles of high chroma .
Cg, Ckg, Ccag, Csg, Csag When gis used with C alone, orwith C and one of the low-er-case suffixes k, Ga, s,or sa, it must meet the de-finiton for C and for theparticular suffix .
h A horizon enriched with organicmatter . It is used with A alone(Ah) ; or with A and e (Ahe) ; orwith B alone (Bh) ; or with B andf (Bhf) .
occur in some Orthic Humic Ah A horizon enriched with or-Gleysols and some Orthic ganic matter that eitherGleysols . has a color value at least
one unit lower than the un-Bhfg, Btg, and others . When derlying horizon or con-used in any of these combi- tains 0 .5% more organicnations the limits set for carbon than the IC, or
, ,f hf t and others must, oth . It contains lessbe met .
Bgf The dithionite-extractableFe of this horizon exceedsthat of the IC by 10 ormore . Pyrophosphate-ext-ractable A1 + Fe is lessthan the minimum limitspecified for 'f' horizons .This horizon occurs in FeraGleysols and Fera HumicGleysols, and possibly be-low the Bfg of gleyed Pod-zols . It is distinguishedfrom the Bfg of gleyed Pod-zols on the basis of theextractability of the Feand A1 . The Fe in the Bgfhorizon is thought to haveaccumulated as a result ofthe oxidation of ferrousiron . The iron oxideformed is not associatedintimately with organicmatter or with A1, and itis sometimes crystalline .The Bgf horizons are usual-ly prominently mottled,
than 17% organic carbon byweight .
Ahe An Ah horizon that has un-dergone eluviation as evi-denced, under natural con-ditions, by streaks andsplotches of differingshades of gray and often byplaty structure . It may beoverlain by a darker-col-ored Ah and underlain by alighter-colored Ae .
Bh This horizon contains morethan 10 organic carbon,less than 0 .3% pyrophosp-hate-extractable Fe, andhas a ratio of organic car-bon to pyrophosphate-ext-ractable Fe of 20 or more .Generally the color valueand chroma are less than 3when moist .
Bhf Defined under 'f' .
69

k
m
Used as a modifier of the suffix-es e, f, g, n, and t to denote anexpression of, but failure tomeet, the specified limits of thesuffix it modifies . It must beplaced to the right and adjacentto the suffix it modifies . Forexample Bfgj means a Bf horizonwith weak expression of gleying ;Bfjgj means a B horizon with weakexpression of both 'f' and 'g'features .
Aej It denotes an eluvial hori-zon that is thin, discon-tinuous or slightly discer-nible .
Btj It is a horizon with someilluviation of clay, butnot enough to meet the lim-its of Bt .
Btgj, Bmgj Horizons that are mot-tled but do not meet the ncriteria of Bg .
Bfj It is a horizon with someaccumulation of pyrophosp-hate-extractable A1 and Febut not enough to meet thelimits of Bf .
Bntj or Bnj Horizons in whichdevelopment of solonetzic Bproperties is evident but pinsufficient to meet thelimits for Bn or Bnt .
Denotes the presence of carbo-nate, as indicated by visible ef- sfervescence when dilute HC1 isadded. Most often it is usedwith B and m (Bmk) or C (Ck), andoccasionally with Ah or Ap (Ahk,Apk), or organic horizons (Ofk,Omk) .
A horizon slightly altered by hy-drolysis, oxidation, or solution,or all three, to give a change incolor or structure, or both . It sahas :
-70-
1 . Evidence of alteration in oneof the following forms :
a) Higher chromas and redderhues than the underlyinghorizons .
b) Removal of carbonates, ei-ther partially (Bmk) orcompletely (Bm) .
2 . Illuviation, if evident, tooslight to meet the require-ments of a Bt or a podzolicB .
3 . Some weatherable minerals .
4 . No cementation or indurationand lacks a brittle consis-tence when moist . This suf-fix can be used as Bm, Bmgj,Bmk, and Bms .
A horizon in which the ratio ofexchangeable Ca to exchangeableNa is 10 or less . It must alsohave the following distinctivemorphological characteristics :prismatic or columnar structure,dark coatings on ped surfaces,and hard to very hard consistencewhen dry . It is used with B, asBn or Bnt .
A horizon disturbed by man's ac-tivities, such as cultivation,logging, habitation, etc . It isused with A and 0 .
A horizon with salts, includinggypsum, which may be detected ascrystals or veins, as surfacecrusts of salt crystals, by de-pressed crop growth, or by thepresence of salt-tolerant plants .It is commonly used with C and k(Csk), but can be used with anyhorizon or combination of. horizonand lowercase suffix .
A horizon with secondary enrich-

t
ment of salts more soluble thancalcium and magnesium carbonates,in which the concentration ofsalts exceeds that present in theunenriched parent material . The
the fine earth frac-tion, the ratio ofthe clay in the Bthorizon to that inthe eluvial horizon
horizon is 10 cm or more thick . must be 1 .2 or more,The conductivity of the satura- e .g ., 20% clay in-tion extract must be at least 4 crease in the Btms/cm and must exceed that of the
_over Ae .
C horizon by at least one-third .c) If the eluvial hori-
An illuvial horizon enriched with zon has more thansilicate clay . It is used with B 40% total clay inalone (Bt), with B and g (Btg), the fine earth frac-with B and n (Bnt), etc . tion, the Bt horizon
must contain atBt A Bt horizon is one that least 8% more clay
contains illuvial layer- than the eluvial ho-lattice clays . It forms rizon, e .g . Ae 500below an eluvial horizon, clay ; Bt at leastbut may occur at the sur- 58% clay .face of a soil that hasbeen partially truncated .It usually has a higher ra-tio of fine clay to totalclay than IC . It has thefollowing properties :
1 . If any part of an elu-vial horizon remainsand there is no litho-logic discontinuity be-tween it and the Bt ho-rizon, the Bt horizoncontains more total andfine clay than the elu-vial horizons, as fol-lows :
a) If any part of theeluvial horizon hasless than 15% totalclay in the fineearth fraction (2mm)the Bt horizon mustcontain at least 3%more clay, e .g .,Ae10% clay-Bt minimum13% clay .
2 . A Bt horizon must be atleast 5 cm thick . Insome sandy soils whereclay accumulation oc-curs in the lamellae,the total thickness ofthe lamellae should bemore than 10 cm in theupper 150 cm of theprofile .
3 . In massive soils the Bthorizon should haveoriented clays in somepores and also asbridges between thesand grains .
4 . If peds are present, aBt horizon shows clayskins on some of thevertical and horizontalped surfaces and in thefine pores, or showsoriented clays in 1% ormore of the cross sec-tion, as viewed in thinsection .
b) If the eluvial hori-zon has more than15% and less than40% total clay in
5 . If a soil shows alithologic discontinu-ity between the eluvial
- 71 -

horizon and the Brizon, or if onplow layer overlieBt horizon, the B
t ho-ly as thet ho-
rizon need show onlyclay skins in somepart, either in somefine pores or on somevertical and horizontalped surfaces . Thinsections should showthat some part of thehorizon has about 10 ormore of oriented claybodies .
Btj Btj and Btg are defined un-der j and g .
u A horizon that is markedly dis-rupted by physical or faunal pro-cesses other than cryoturbation .Evidence of marked disruptionsuch as the inclusion of materialfrom other horizons, absence ofthe horizon, etc . must be evidentin at least half of the crosssection of the pedon . Such tur-bation can result from blowdownof trees, mass movement of soilon slopes, and burrowing animals .It can be used with any horizon
or subhorizon with the exceptionof A or B alone ; e .g . Aeu, Bfu,BCu .
x A horizon of fragipan character .A fragipan is a loamy subsurfacehorizon of high bulk density andvery low organic matter content .when dry, it has a hard consis-tence and seems to be cemented .When moist, it has moderate toweak brittleness . It frequentlyhas bleached fracture planes andis overlain by a friable B hori-zon . Air dry clods of fragic ho-rizons slake in water .
y A horizon affected by cryoturba-tion as manifested by disruptedand broken horizons � incorpora-tion of materials from other ho-rizons and mechanical sorting inat least half of the cross sec-tion of the pedon . It is usedwith A, B, and C alone or in com-bination with other subscripts,e .g . Ahy, Ahgy, Bmy, Cy, Cgy,Cygj, etc .
z A frozen layer . It may be usedwith any horizon or layer, e .g .Ohz, Bmz, Cz, Wz .

Appendix C
DESCRIPTION OF LANDFORMS
C .1 GENETIC MATERIALS
Unconsolidated mineral component
The unconsolidated mineral compo-nent consists of clastic sedimentsthat may or may not be stratified,but whose particles are not cementedtogether . They are essentially ofglacial or post-glacial origin butinclude poorly consolidated andweathered bedrock .
Anthropogenic - Man-made or man-modi-fied materials, including thoseassociated with mineral exploita-tion and waste disposal .
transported and deposited by windaction .
Fluvial - Sediment generally consist-ing of gravel and sand with a mi-nor fraction of silt and clay .The gravels are typically roundedand contain interstitial sand .Fluvial sediments are commonlymoderately to well sorted anddisplay stratification, but mas-sive, nonsorted fluvial gravelsdo occur . These materials havebeen transported and deposited bystreams and rivers . Finer tex-tured Fluvial deposits of modernrivers are termed Alluvium .
Colluvial - Massive to moderatelywell stratified, nonsorted topoorly sorted sediments with anyrange of particle sizes from clayto boulders and blocks that havereached their present position bydirect, gravity-induced movement .
They are restricted to prod-ucts of mass-wasting whereby thedebris is not carried by wind,water, or ice (excepting snow av-alanches) .
Eolian - Sediment, generally consist-ing of medium to fine sand andcoarse silt particle sizes, thatis well sorted, poorly compacted,and may show internal structuressuch as cross bedding or ripplelaminae, or may be massive . In-dividual grains may be roundedand show signs of frosting .
These materials have been
Lacustrine - Sediment generally con-sisting of either stratified finesand, silt, and clay deposited onthe lake bed ; or moderately wellsorted and stratified sand andcoarser materials that are beachand other nearshore sedimentstransported and deposited by waveaction .
These are materials that ei-ther have settled from suspensionin bodies of standing fresh wateror have accumulated at their mar-gins through wave action .
Marine - Unconsolidated deposits ofclay, silt, sand, or gravel thatare well to moderately well sort-ed and well stratified to moder-ately stratified (in some placescontaining shells) . They havesettled from suspension in saltor brackish water bodies or have
-73-
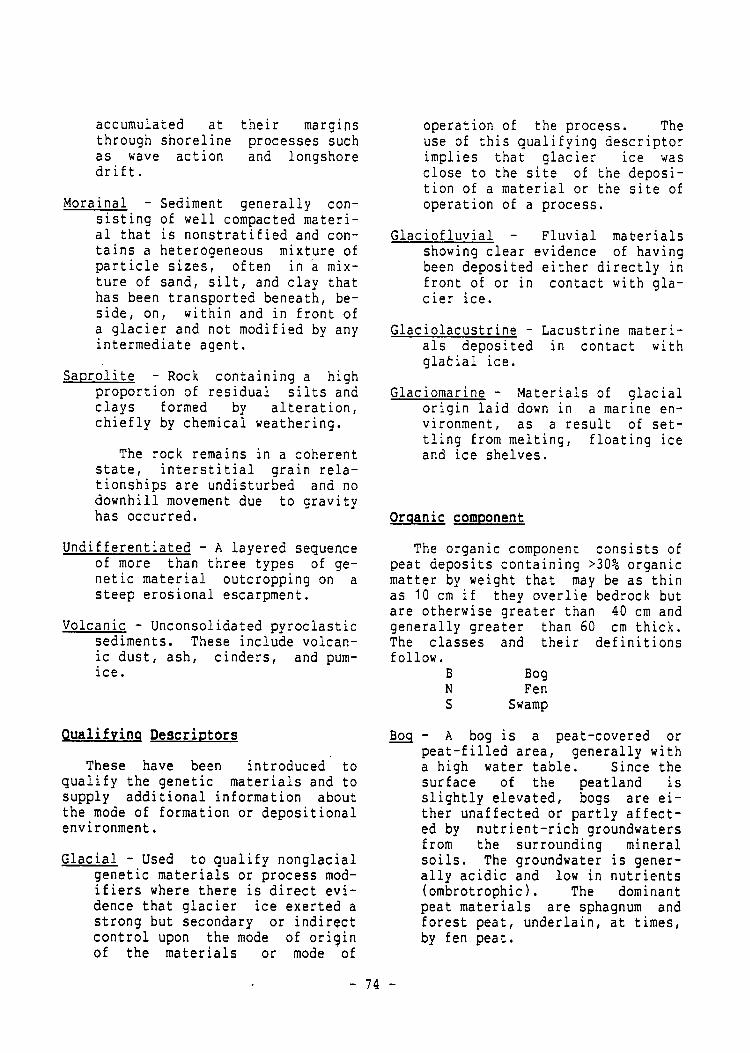
accumulated at their margins operation of the process . Thethrough shoreline processes such use of this qualifying descriptoras wave action and longshore implies that glacier ice wasdrift . close to the site of the deposi-
tion of a material or the site ofMorainal - Sediment generally con- operation of a process .
sisting of well compacted materi-al that is nonstratified and con-tains a heterogeneous mixture ofparticle sizes, often in ~a mix-ture of sand, silt, and clay thathas been transported beneath, be-side, on, within and in front ofa glacier and not modified by anyintermediate agent .
Glaciofluvial - Fluvial materialsshowing clear evidence o£ havingbeen deposited either directly infront of or in contact with gla-cier ice .
Glaciolacustrine - Lacustrine materi-als deposited in contact withglatial ice .
Saprolite - Rock containing a highproportion of residual silts andclays formed by alteration,chiefly by chemical weathering .
The rock remains in a coherentstate, interstitial grain rela-tionships are undisturbed and nodownhill movement due to gravityhas occurred .
Undifferentiated - A layered sequenceof more than three types of ge-netic material outcropping on asteep erosional escarpment .
Glaciomarine - Materials of glacialorigin laid down in a marine en-vironment, as a result of set-tling from melting, floating iceand ice shelves .
Organic component
The organic component consists ofpeat deposits containing >300 organicmatter by weight that may be as thinas 10 cm if they overlie bedrock butare otherwise greater than 40 cm and
Volcanic - Unconsolidated py roclastic generally greater than 60 cm thick .sediments . These include volcan- The classes and th eir definitionsic dust, ash, cinders, and pum- follow .ice . B Bog
N FenS Swamp
Qualifying Descriptors Boc - A bog is a peat-covered or
These have been introduced toqualify the genetic materials and tosupply additional information aboutthe mode of formation or depositionalenvironment .
Glacial - Used to qualify nonglacialgenetic materials or process mod-ifiers where there is direct evi-dence that glacier ice exerted astrong but secondary or indirectcontrol upon the mode of originof the materials or mode of
peat-filled area, generally witha high water table . Since thesurface of the peatland isslightly elevated, bogs are ei-ther unaffected or partly affect-ed by nutrient-rich groundwatersfrom the surrounding mineralsoils . The groundwater is gener-ally acidic and low in nutrients(ombrotrophic) . The dominantpeat materials are sphagnum andforest peat, underlain, at times,by fen peat .
74 -

Fen - A fen is a peat-covered orpeat-filled area with a high wa-ter table, which is usually atthe surface . The dominant ma-terials are shallow to deep, wellto moderately decomposed fenpeat . The waters are mainly richin nutrients (minerotrophic) andare derived from mineral soils .The peat materials are thereforehigher in both nutrients and pHthan the peats associated withbogs .
Swamp - A swamp is a peat-covered orpeat-filled area . The peat sur-face is level or slightly concavein cross section . The water ta-ble is frequently at or above thepeat surface . There is strongwater movement from margins orother mineral sources . The mi-crorelief is hummocky, with manypools present . The waters areneutral or slightly acid . Thedominant peat materials are shal-low to deep mesic to humic forestand fen peat .
C .2 GENETIC MATERIAL MODIFIERS
Material modifiers are used toqualify unconsolidated mineral andorganic deposits . Particle-sizeclasses serve to indicate the size,roundness, and sorting of unconsoli-dated mineral deposits . Fiber class-es indicate the degree of decomposi-tion and fiber size of organicmaterials .
Particle size classes _forunconsolidated mineral materials
Blocky : An accumulation of angularparticles greater than 256mm in size .
Bouldery :An accumulation of roundedparticles greater than 256
mm in size .
Clayey : An accumulation of particleswhere the fine earth frac-tion contains 35% or moreclay (<0 .002 mm) by weightand particles greater than 2mm are less than 35% by vol-ume .
Cobbly : An accumulation of roundedparticles having a diameterof 64-256 mm .
Gravelly :An accumulation of roundedparticles ranging in sizefrom pebbles to boulders .
Loamy : An accumulation of particlesof which fine earth fractioncontains 350 or less clay(<0 .002 mm) by weight andparticles greater than 2 mmare less than 35% by volume .
Pebbly : An accumulation of roundedparticles having a diameterof 2-6_4 mm .
Rubbly : An accumulation of angularfragments having a diameterof 2-256 mm .
Sandy : An accumulation of particlesof which the fine earthfraction contains more than70% by weight of fine sandor coarser particles . Par-ticles greater than 2 mm oc-cupy less than 35% by vol-ume .
Silty : An accumulation of particlesof which the fine earthfraction contains less than15% of fine sand or coarserparticles and has less than35% clay . Particles greaterthan 2 mm occupy less than35% by volume .
-75-

Fiber classes for organic materials
The amount of fiber and its dur-ability are important characterizingfeatures of organic deposits in thatthey reflect on the degree of decom-position of the material . The preva-lence of woody materials in peats asalso of prime importance .
Fibric :The least decomposed of allorganic materials ; there is alarge amount of well-preservedfiber that is readily identi-fiable as to botanical origin .Fibers retain their characterupon rubbing .
Mesic : Organic material in an inter-mediate stage of decompostion ;intermediate amounts of fiberare present that can be iden-tified as to their botanicalorigin .
Humic : Highly decomposed organic ma-terial ; small amounts of fiberare present that can be iden-tified as to their botanicalorigin . Fibers can be easilydestroyed by rubbing .
Woody : Organic material containingmore than 500 of woody fibers .
C .3 SURFACE EXPRESSION
The surface expression of geneticmaterials is thei~r form (assemblageof slopes) and pattern of forms .Form as applied to unconsolidated de-posits refers specifically to theproduct of the initial mode of originof the materials . When applied toconsolidated materials, form refersto the product of their modificationby geological processes . Surface ex-pression also indicates the manner inwhich unconsolidated genetic materi-als relate to the underlying unit .
Consolidated _and Unconsolidatedmineral surface classes
Apron - A relatively gentle slope atthe foot of a steeper slope andformed by materials from thesteeper, upper slope .
Blanket - A mantle of unconsoiidated~materials thick enough to maskminor irregularities in the un-derlying unit but still conform-ing to the general underlying to-pography .
Fan - A fan-shaped form similar tothe segment of a cone and havinga perceptible gradient from theapex to the toe .
Hummockv - A very complex sequence ofslopes extending from somewhatrounded depressions or kettles ofvarious sizes to irregular toconical knolls or knobs . Thereis a general lack of concordancebetween knolls or depressions .Slopes are generally 9-70a (5-35degrees) .
Inclined - A sloping, unidirectionalsurface with a generally constantslope not broken by marked irreg-ularities . Slopes are 2-70a(1-35 degrees) . The form of in-clined slopes is not related tothe initial mode of origin of theunderlying material .
Level - A flat or very gently slop-ing, unidirectional surface witha generally constant slope notbroken by marked elevations anddepressions . Slopes are general-ly less than 20 (1 degree) .
Rolling - A very regular sequence ofmoderate slopes extending fromrounded, sometimes confined con-cave depressions to broad, round-ed convexities producing a wave-lake pattern of moderate relief .Slope length is often 1 .6 km or
-76-

greater and-gradients are greaterthan 50 (3 degrees) .
Rid g ed - A long, narrow elevation ofthe surface, usually sharp crest-ed with steep sides . The ridgesmay be parallel, subparallel, orintersecting .
Stee p - Erosional slopes, greaterthan 700 (35 degrees), on bothconsolidated and unconsolidatedmaterials . The form of a steeperosional slope on unconsolidatedmaterials is not related to theinitial mode of origin of the un-derlying material .
Terraced - Scarp face and the hori-zontal or gently inclined surface(tread) above it .
Undulating - A very regular sequenceof gentle slopes that extendsfrom rounded, sometimes confinedconcavities to broad rounded con-vexities producing a wavelikepattern of low local relief .Slope length is generally lessthan 0 .8 km and the dominant gra-dient of slopes is 2-50 (1-3 de-grees) .
Veneer - Unconsolidated materials toothin to mask the minor irregular-ities of the underlying unit sur-face . A veneer will range from10 cm to 1 m in thickness andwill possess no form typical ofthe material's genesis .
Organic surface classes
Blanket - A mantle of organic materi-als that is thick enough to maskminor irregularities in the un-derlying unit but still conformsto the general underlying topog-raphy .
Bowl - A bog or fen occupying con-cave-shaped depressions .
Domed - A bog with an elevated, con-vex, central area much higherthan the margin . Domes may beabrupt (with or without a frozencore) or gently sloping or have astepped surface .
Floating - A level organic surfaceassociated with a pond or lakeand not anchored to the lake bot-tom .
Horizontal - A flat peat surface notbroken by marked elevations anddepressions .
Plateau - A bog with an elevated,flat, central area only slightlyhigher than the margin .
Ribbed - A pattern of parallel or re-ticulate low ridges associatedwith fens .
Sloping - A peat surface with a gen-erally constant slope not brokenby marked irregularities :
Veneer - A thin (40 cm-1m) mantle oforganic materials which generallyconforms to the underlying topog-raphy . They may or may not beassociated with discontinuouspermafrost .

Appendix D
DETAILED SOIL DESCRIPTIONS
Table 9 . Detailed SoilTypes Sampled
Soil Symbol
Description of SelectedWithin the pasquia Lake
Soil Name
ProfileArea*
Profile Number
BGA Big Lake 2BGA Big Lake 3LPS Le Pas 1
* Profile descriptions have been computer generated from detailed samplesites and analytical information stored in the Canada Soil InformationSystem (CanSIS) data bank .
Analytical Methodology :
Field samples were collected from representative sites . Sampleswere air-dried and ground, and the less than 2 mm size fraction was usedfor subsequent analysis .
pH : (1) 0 .01 M CaC1Z
Organic Carbon : Wet oxidation (Walkley-Black)
Total Nitrogen : Macro-Kjeldahl ; NOZ and N03 not included
Calcite, Dolomite, and CaC03 Equivalent . Pressure method
Extractable Acidity : BaC1Z - Triethanolamine, pH 8 .0
Cation Exchange Capacity : Buffered NH4Ac ; pH 7 .0 solution, done byatomic absorption procedure
Electrical Conductivity : saturated paste, using conductivity cell-cup
Particle Size Analysis : Pipette method . Pretreatment removal of organicmatter and salts . Dispersion with sodiumhexameta-phosphate
Water Content : Pressure membrane method . Samples are ground,sieved, and oven-dried
Atterberg Limits : A .S .T .M . Designation D423-54T,"Procedures for Testing Soils", pages 94-101
-78-

Shrinkage Limit : Evaporation method
Codes for Engineering Classification
AASHO Unified
A-1 10 A-3 = 30 GW = 01 DL 11A-1-a 11 A-4 = 40 GP = 02 MH 12A-1-b 12 A-5 = 50 GM = 03 CH 13A-2 20 A-6 = 60 GC = 04 OH 14A-2-4 24 A-7 = 70 SW = 05 PT 15A-2-5 25 A-7-5 = 75 SP = 06 C1 16A-2-6 26 A-7-6 = 76 SM = 07 GM-GC 17A-2-7 27 A-8 = 80 SC = 08 SM-SC 18
ML = 09 CL-ML 19CL = 10

BIG LAKEBGA MANITOBA 1983 PROFILE NO . 2
NOV 23, 1933
IDENTIFICATION : SURVEYED BY GFM, FOR THE PURPOSE OF SEMI DETAILED SURVEY ; PROVINCIAL SOIL SURVEY, WIIlNIPEG,MAN .
CLASSIFICATION : TAXONOMIC SYSTEM OF THE YEAR 1978, SUBGROUP : REGO GLEYSOL . MINERAL SOIL FAMILY*- FINE LOAMY, MIXED CLAY, ALKALINE,STRONGLY CALCAREOUS, COLD, AQUIC . SOIL MAP UNIT : COMPLEX . SOIL PHASES : LEVEL .
LOCATION : MILITARY GRID REF . 14 ULQ 4729 5203 ; NTS MAP AREA 63F ; NW 30 054 27 W .
CLIMATE : 259 ABOVE MEAN SEA LEVEL . STATION AT PASqUIA PROJECT HAS GOOD RELEVANCE TO THE SOIL SITE .
VEGETATION : MOSSES,SEDGES . KEY SPECIES LISTING : 1 CAREX - SEDGES, 2 SAMBUCUS PUBENS - RED-BERRIED ELDER . CAREX DOMINANT WITH ISOLATED WILLOW SIIRUBS,WATER WILLOW.
SOIL SITE= PARENT MATERIAL 1 : WEAK CHEMICAL WEATHERING, FINE LOAMY AND FINE SILTY (18 TO 35Z CLAY) AND CLAYEY (>35'/. CLAY) ANDSTRATIFIED (MINERAL), MODERATELY TO VERY STRONGLY CALCAREOUS 16-40'/. CAC031, FLUVIOLACUSTRINE, MIXED ; LANDFORM CLASSIFICATION :LACUSTRINE, LEVEL ; SLOPE : 0'/. SIMPLE SLOPE OF CLASS 1 (0-0 .5Z), FACING LEVEL ; SOIL t10ISTURE AND DRAINAGE : AQUIC, VERY POORLYDRAIttED, SLOtJLY PERVIOUS, VERY SLOW SURFACE RUNOFF, SEEPAGE PRESENT, 0 .5 M TO APPARENT WaTERTABLE ; NOi1STONY ; NOtIROCKY ; FRESEIJTLAND USE : MARSH .
t INTERPRETATIONS: CLI AGRICULTURE 6/W .
00o SPECIAL NOTES : PICTURE t(0 6 AND 7 . SITE SAMPLED AS BIG LAKE SERIES,CLAY SUBSTRATE VARIANT
OFH : 5 TO 0 CM ; HORIZON WET ; NATURAL WET/OXIDIZED 5YR 2 .5/2, PRESSED WET/OXIDIZED 5YR 3/2 ; MATERIAL COMPOSITION 10 AND 90%FEATHERMOSS AND SEDGE AND REED, NO AND HIGH DECOMPOSITION ; MUCKY ORGANIC ; NONSTICKY, NONPLASTIC CONSISTENCE ; ABUtIDAN'T, VERYFINE AND MEDIUM, RANDOM, EXPED ROOTS ; MODERATELY POROUS ; VERY WEAK EFFERVESCENCE ; WEAKLY CALCAREOUS ; WAVY, ABRUPT HORIZONBOUNDARY ; NEUTRAL 6.6-7 .3 FIELD PH .
CKG1 : 0 TO 20 CM ; HORIZON WET ; NATURAL WET/OXIDIZED 2 .5Y 4/2 ; MUCKY SILTY CLAY LOAM ; VERY WEAK, FINE, GRANULAR STRUCTURE ;SLIGHTLY STICKY, SLIGHTLY PLASTIC CONSISTENCE ; PLE1JTIFUL, VERY FINE, RANDOM, EXPED ROOTS ; MODERATELY POqOUS, FEW, VERY FINE,RANDOM, EXPED PORES; WEAK EFFERVESCENCE ; MODERATELY CALCAREOUS ; SMOOTH, ABRUPT HORIZON BOUNDARY ; MILDLY ALKALINE 7.4-7 .8 FIELDPH .
CKG2 : 20 TO 30 CM ; HORIZON WET ; NATURAL WET/REDUCED 2 .5Y 4/2 ; SILTY CLAY ; COMMON, FINE, PROMINENT, 7 .5YR 4/4 MOTTLES ;STRUCTURELESS, 11ASSIVE STRUCTURE ; VERY WEAK, FINE TO MEDIUM . GRANULAR SECONDARY STRUCTURE ; STICKY, PLASTIC CONSISTENCE ; FEW,VERY FINE, RANDOM, EY,PED ROOTS; SLIGHTLY POROUS, FEW, VERY FINE . RANDOM, EXPED PORES ; MODERATE EFFERVESCENCE ; MODERATELYCALCAREOUS ; SMOOTH, AORUPT HORIZON BOUNDARY ; MILDLY ALKALINE 7 .4-7 .8 FIELD PI1 .
CKG3~ 30 TO 50 CM ; HORIZON WET ; NATURAL WET/REDUCED 2 .5Y 4/2 ; SILTY CLAY ; FEW, 10YR 4/3 MOTTLES ; WEAK TO MODERATE, MEDIUM,GRAt;ULAR STRUCTURE ; STICKY, PLASTIC COtNSISTENCE ; VERY FEW, MICRO, RANDOM, EXPED ROOTS ; SLIGHTLY POROUS, VERY FEW, MICRO,RANDOM, EXPED PORES ; MODERATE EFFERVESCENCE ; MODERATELY CALCAREOUS; St100TH, GRADUAL HORIZON BOUNDARY ; MILDLY ALKALINE 7.4-7 .8FIELD PH .
CKG4~ 50 TO 80 CM ; HORIZON WET ; NATURAL WET/REDUCED 5Y 4/2 ; SILTY CLAY ; FEW, 2 .5Y 4/4 MOTTLES ; STRUCTURELESS ; MASSIVE STRUCTURE ;VERY STICKY, VERY PLASTIC CONSISTENCE ; SLIGHTLY POROUS, VERY FEW,, MICRO, RANOOtt, EXPED PORES ; tiODERATE EFFERVESCENCE ;MODERATELY CALCAREOUS ; SMOOTH, GRADUAL HORIZON BOUNDARY ; MILDLY ALKALINE 7 .4-7 .8 FIELD Pfl .
CKG5 : 80 TO 110 CM ; HORIZON WET ; NATURAL WET/REDUCED 5Y 4/2 ; SILTY CLAY AND CLAY ; FEW, 2 .5Y 4/4 MOTTLES ; STRUCTURELESS, l1A5SIVESTRUCTURE ; VERY STICKY, VERY PLASTIC CONSISTENCE ; SLIGHTLY POROUS, VERY FEW, MICRO, RAt1D011, EXPED PORES ; I(ODERa7EEFFERVESCENCE ; MODERATELY CALCAREOUS ; MILDLY ALKALINE 7 .4-7 .8 FIELD PH .

BIG LAKEBGA MANITOBA 1983 PROFILE N0 . 2
CHEMICAL DATA (SURVEY)
C .E .C . EXCHANGEABLE CATIONS(ME/100G) BUFFERED (ME/100G)
HORIZON PH1
ORGC(I)
TOTALN
(7.)
CALCCARBEQU .X
CAL-CITE(Z)
DOLO-MITE(Z)
EXTRACID BUFF . PERM .
CHARGCA MG NA K
OFH I 7.0 21 .89 1 .08 8 .3 75 .6 51 .6 13 .9 2 .3 0 .6
CKG1 I 7.6 5 .23 8 .4 4 .2 5 .8 3 .9 40 .0 38 .0 9 .1 0 .3 0 .6
CKG2 I 7 .8 1 .60 0 .11 14 .8 10 .0 4 .4 3 .0 24 .4 34 .0 8 .1 0 .3 0 .5
CKG3 I 7 .8 0 .98 0 .06 9 .7 6 .1 3 .3 3 .7 36 .7 36 .6 8 .7 0 .6 0 .5CF:G4 I 7 .8 1 .01 0 .07 12 .3 8 .2 3 .8 4 .0 39 .6 34 .0 10 .2 0 .9 0 .7CKG5 I 7 .8 0 .88 0 .07 11 .3 8 .1 2 .9 4 .8 41 .6 42 .9 11 .4 0 .6 0 .7
-
CHEMICAL
HORIZO
DATA
N
(SURVEY)ELECCOFlD
(PRiHOS/CM)
Z 1120AT
SATUR
OFH 1CF:G1 ( 0 .6 90 .8CKG2 I 0 .5 73 .9CKG3 I 0 .7 79 .9CKG4 I 0 .9 79 .4CKG5 I 0 .6 92 .7
PHYSICAL DATA ( SURVEY )
PARTICLE SIZE ANALYSIS
NOV 23, 1983
'/. PASSING '/. OF SAMPLERUB UNRUB 70- 50-
_ FIB FIBRE 3" .75" 140 .4 N0.10 V .C . C . MED . F . V .F . TOT . 11U ZU 2U 0 .2U
HORIZON X '/. SIEVE SIEVE SIEVE SIEVE SAND SAND SAtID SAND SAIJD SAtlD SILT SILT CLAY tLAY
OFH I 20 48CF :G1 I 6 60 34
CKG2 I 2 57 411 54 45CKG3 I
CK.G4 I 2 45 53
CKG5 I 0 40 60

BIG LAKEBGA MANITOBA 1983 PROFILE 140. 3
NOV 23, 1983
IDENTIFICATION : SURVEYED BY GFM, FOR THE PURPOSE OF SEMI DETAILED SURVEY ; PROVINCIAL SOIL SURVEY, WINIIIPEG,MAN . EXTENSIVE .
CLASSIFICATION : TAXONOMIC SYSTEM OF THE YEAR 1978, SUBGROUP : REGO GLEYSOL . MINERAL SOIL FAMILY : FINE CLAYEY, MIXED CLAY, ALKALINE,STRONGLY CALCAREOUS, COLD, AQUIC .
LOCATIOta : MILITARY GRID REF . 14 ULQ 4354 5130 ; NTS MAP AREA 63F ; SE 28 054 27 W .
CLIMATE : 259 ABOVE MEAN SEA LEVEL.
VEGETATION: SEDGE-RUSH . KEY SPECIES LISTING: 1 CAREX - SEDGES . SCHOACLOA,SCIRPUSPATCHES OF PHRAGI1ITES .
SOIL SITE : PARENT MATERIAL 1 : WEAK CHEMICAL WEATHERING, FINE LOAMY AND FINE SILTY (18 TO 357. CLAY) AND CLAYEY (>357. CLAY) ANDSTRATIFIED (MINERAL), MODERATELY TO VERY STRONGLY CALCAREOUS (6-40'/. CAC03), FLUVIOLACUSTRINE, MIXED ; LANDFOR11 CLASSIFICATIOlt :LACUSTRINE, LEVEL ; SLOPE : 0 .1Z SIMPLE SLOPE OF CLASS 1 (0-0 .5'/.), FACING SOUTHEAST, SITE AT LOWER SLOPE POSITION ; SOIL MOISTUREAIID DRAINAGE : AQUIC, POORLY ORAIIIED, SLOWLY PERVIOUS, VERY SLOW SURFACE RUNOFF, SEEPAGE PRESENT, 0 .9 M TO APPARENT IIATERTABLE ;t70tISTONY ; NOtIROCKY ; PRESENT LAND USE : MARSH .
INTERPRETATIONS : CLI AGRICULTURE 6/W .
SPECIAL NOTES*- HIGHER OM CONTENT IN CKG 6 AND 7
OFM: 10 TO 0 CM ; HORIZON WET ; MATRIX MOIST 7 .5YR 3/2, RUBBED WET/OXIDIZED l0YR 3/2 ; ORGANIC ; tIONSTICKY, NONPLASTIC COtISISTEI ;CE ;ABUNDANT, FINE AND COARSE, RANDOM, EXPED ROOTS ; HIGHLY POROUS ; WEAKLY CALCAREOUS ; SI100TI1, CLEAR HORIZON BOUNDARY ; IIEUTRAL6 .6-7 .3 FIELD PH .
CKG1~ 0 TO 40 CM ; HORIZON WET ; MATRIX MOIST l0YR 3/2 ; SILTY CLAY ; WEAK, FINE TO MEDIUM, GRANULAR STRUCTURE ; STICKY, PLASTICCONSISTENCE ; ABUNDANT, FINE AND MEDIUM, RANDOM, EXPED ROOTS ; SLIGHTLY POROUS ; WEAK EFFERVESCENCE ; MODERATELY CALCAREOUS ;GRADUAL HORIZON BOUNDARY ; MILDLY ALKALINE 7 .4-7 .8 FIELD Pit .
CKG2 : 40 TO 60 CM ; HORIZON WET ; MATRIX MOIST l0YR 3/3 ; SILTY CLAY ; STRUCTURELESS, MASSIVE STRUCTURE ; VERY WEAK, MEDIUM,SUBAtaGULAR BLOCKY SECOtiDARY STRUCTURE ; VERY STICKY, PLASTIC CONSISTENCE ; VERY FINE, VERTICAL, EXPED ROOTS ; SLIGHTLY POROUS ;P10DERATE EFFERVESCENCE ; MODERATELY CALCAREOUS ; GRADUAL HORIZON BOUNDARY ; MODERATELY ALKALINE 7 .9-8 .4 FIELD Pit .
CKG3~ 60 TO 80 CM ; HORIZON MOIST ; MATRIX MOIST l0YR 4/2 ; SILTY CLAY ; STRUCTURELESS, MASSIVE STRUCTURE ; WEAK, MEDIUlt SECONDARYSTRUCTURE ; VERY STICKY, PLASTIC COtlSISTEIICE ; VERY FINE, VERTICAL, EXPEL) ROOTS ; SLIGHTLY POROUS ; MODERATE EFFI:RVESCEt ;CE ;MODERATELY CALCAREOUS ; GRADUAL HORIZON BOUNDARY ; MODERATELY ALKALINE 7 .9-8 .4 FIELD Pit .
CKG4 : 80 TO 110 CM ; HORIZON MOIST ; MATRIX MOIST l0YR 4/2, MATRIX MOIST l0YR 3/3 ; SILTY CLAY LOAM ; COMMON, COARSE, PROIIIItE11T,2 .5Y 4/4 MOTTLES ; STRUCTURELESS, MASSIVE STRUCTURE', STICKY, PLASTIC CONSISTENCE ; SLIGHTLY POROUS ; MODERATE EFFERVLSCCIICE ;MODERATELY CALCAREOUS ; GRADUAL HORIZOtl BOUNDARY ; MODERATELY ALKALINE 7 .9-8 .4 FIELD Pit .
CKGS : 110 TO 150 CM ; HORIZON MOIST ; MATRIX MOIST 2 .5Y 4/2 ; SILTY CLAY LOAM ; FEW, FINE, DISTINCT, l0YR 3/4 MOTTLES ; STRUCTURELESS,MASSIVE STRUCTURE ; STICKY, PLASTIC CONSISTE11CE ; SLIGHTLY POROUS ; MODERATE EFFERVESCENCE ; MODERATELY CALCAREOUS ; GRADUALHORIZON BOUNDARY ; MODERATELY ALKALINE 7 .9-8 .4 FIELD P)1 .
CKG6 : 150 TO 200 CPL; HORIZON MOIST ; MATRIX MOIST 5Y 3/1 ; MATERIAL COMPOSITIOtd 30 AllD 70Z FEATIIERt10S5 AND SEDGE AllD Rt:CD, i :0 AmMODERATE DECOMPOSI(IOIJ ; SILT LOAM ; STRUCTUPELESS, MASSIVE SIRUCTUtdE ; SLIGHTLY STICKY, SLIGIITLY PLASTIC COtJSISICNCL ; IIOOLRATELYPOROUS ; t(OD[RATE EFFERVESCENCE ; t100LRATELY CALCAREOUS ; SIi00Tll, GRADUAL HORIZON GOUtHIARY ; (tILDLY ALKALINE 7 .4-7 .t1 FIELD PH .
_CKG7~ 200 TO 250 C11 ; IIORIZON MOIST ; MATRIX MOIST 5Y 3/1 ; LOAM ; STRUCTURELESS, MASSIVE STRUCIURE ; SLIGHTLY STICKY, SLIGIIfLY PLASTIC-. CONSISTENCE ; MODERATELY POROUS ; ti0DERATE EFFERVESCEIICE ; MODERATELY CALCAREOUS ; MILDLY ALKALINE 7.4-7.8 FIELD PI1 .

BIG LAKEBGA MANITOBA 1983 PROFILE N0 . 3
CHEMICAL DATA (SURVEY)
C .E .C . EXCHANGEABLE CATIONS(ME/100G) BUFFERED (ME/100G)
HORIZON PH1
ORGC(Zl
TOTALN
('/.1
CALCCARB
Ec)U.7.
CAL-CITE(7.)
DOLO-MITE(Ll
EXTRACID BUFF . PERM .
CHARGCA MG NA K
OFM I 7 .1 36 .49 1 .50 12 .8 94 .4 63 .1 16 .0 3 .2 1 .0CKG1 I 7 .7 7 .26 0 .53 13 .7 10 .5 2 .9 5 .2 55 .2 42 .7 12 .0 1 .5 0 .6CKG2 I 7 .9 1 .74 0 .09 13 .4 7 .9 5 .1 3 .2 32 .6 27 .7 8 .7 1 .0 0 .7CKG3 I 7 .9 1 .35 0 .06 13 .4 8 .1 4 .9 2 .8 30 .0 27 .0 8 .8 1 .3 0 .7CKG4 I 7 .9 1 .00 0 .05 17 .5 10 .9 6 .0 3 .2 30 .0 27 .9 8 .3 0 .7 0 .6CF:G5 ~ 7 .9 1 .23 0.07 15 .7 8 .4 6 .7 2 .7 31 .3 25 .5 8 .7 0 .5 0 .6CKG6 ~ 7 .8 0 .94 0 .06 16 .8 9 .4 6 .8 1 .9 21 .3 22 .7 6 .4 0 .8 0 .4CKG7 I 7 .5 1 .13 0 .08 11 .4 6 .0 4 .9 2 .2 22 .6 21 .2 6 .1 0 .4 0 .4
CHEMICAL DATA (SURVEY)
ORIZON ( ELECCOPlD
M1IFIOS/CM)
'/. H20AT
SATUR A G
WATERNA EXTRACT DETERMINATI
K C03 HC03
ONS
CL 04
OF11 IClCG1 ~ 3 .1 123 .6 21 .0 11 .8 7 .8 1 .9 21 .6 4 .2CKG2 ~ 2 .1 75 .2 12 .1 7 .2 5 .6 3 .0 10 .5 6 .7CKG3 I 1 .6 80 .4 7 .2 4 .9 4 .5 1 .7 7 .7 4 .9CKG4 ~ 1 .3 80 .0CI~G5 ( 1 .1 79 .3Ct:G6 ~ 1 .0 72 .1CKG7 ~ 1 .1 60 .9
N03
NOV 23, 1983
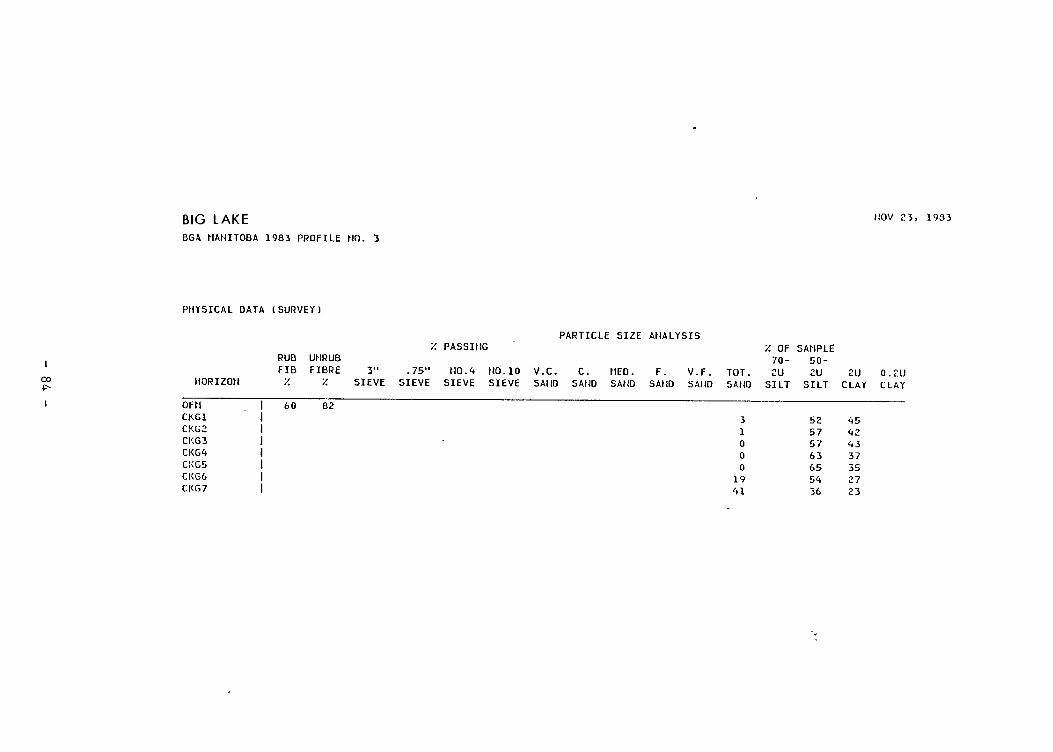
BIG LAKEBGA HANITOBA 1983 PROFILE N0 . 3
PHYSICAL DATA (SURVEY)
PARTICL E SIZE ANALYSISZ PASSING Z OF SAMPLE
l RUB UNRUB 70- 50-FIB FIBRE 3" .75" N0.4 N0.10 V.C . C . t1ED . F . V .F . TOT . ^lU 2U 2U
001
HORIZON '/. '/. SIEVE SIEVE SIEVE SIEVE SAND SAND SAND SAND SAND SAND SILT SILT CLAY4
OFN I 60 82 -CN:G1 I 3 52 45CKG2 I 1 57 42CI<G3 I 0 57 43CKG4 I 0 63 37CKG5 ( 0 65 35CKG6 I 19 54 27CKG7 I 41 36 23
NOV 23, 1983
0 .2UCLAY

LE PASLPS MAtJITOBA 1983 PROFILE NO . 1
NOV 23, 1983
IDENTIFICATION : SURVEYED BY GFt1, FOR THE PURPOSE OF SEMI DETAILED SURVEY ; PROVINCIAL SOIL SURVEY . WINNIPEG,MAN. EXTENSIVE .
CLASSIFICATION*. TAXONOMIC SYSTEM OF THE YEAR 1978, SUBGROUP : REGO GLEYSOL . MINERAL SOIL FAMILY . FINE CLAYEY, MIXED CLAY, ALKALINE,STRONGLY CALCAREOUS, COLD, AQUIC . SOIL MAP UNIT : COMPLEX .
LOCATIOtJ: MILITARY GRID REF . 14 ULQ 4032 4841 ; NTS MAP AREA 63F ; SE 18 054 27 W .
CLIMATE : 260 ABOVE MEAN SEA LEVEL . STATION AT PASqUIA PROJECT
VEGETATION : GRASSES AND FORBES . KEY SPECIES LISTING : 1 CAREX - SEDGES . CAREX,SCATTERED LOW,PHRAGMITES .
SOIL SITE : PARENT MATERIAL 1 : WEAK CHEMICAL WEATHERING, CLAYEY (>35'/. CLAY) AND STRATIFIED (MINERAL), MODERATELY TO VERY STRONGLYCALCAREOUS (6-40'/. CAC03), FLUVIOLACUSTRINE, MIXED ; LAtlDFORM CLASSIFICATION : LACUSTRINE, LEVEL ; SLOPE : 0'/. SIIIPLE SLOPE OF CLASS1 (0-0 .5'/.), FACING LEVEL ; SOIL MOISTURE AND DRAINAGE : AQUIC, POORLY DRAINED, SLOWLY PtRVIOUS, VERY SLOW SURFACE RUt10FF,SEEPAGE PRESENT, 0 .4 M TO APPARENT WATERTABLE ; NONSTONY ; NONROCKY ; PRESENT LAND USE : MARSH .
INTERPRETATIONS : CLI AGRICULTURE 6/W .
SPECIAL NOTES : LARGE CONCENTRATION OF SHELLS AT 40 CM ABOVE STRONGLY IRON STAINED LAYER
CKG1= 0 TO 20 CM ; HORIZON WET ; NATURAL WET/OXIDIZED 2 .5Y 4/2 ; MUCKY SILTY CLAY LOAM ; FEW, FINE, PROMINENT, 7 .5YR 3/4 MOTTLES ;STRUCTURELESS, MASSIVE STRUCTURE ; STICKY, SLIGHTLY PLASTIC CONSISTENCE ; ABUNDANT, FINE AND COARSE, RANDOM, EXPED ROOTS ;SLIGHTLY POROUS ; WEAK EFFERVESCENCE ; MODERATELY CALCAREOUS ; SMOOTH, CLEAR AND ABRUPT HORIZON BOUNDARY ; MILDLY ALKALINE 7.4-7 .8FIELD PH .
CKG2 : 20 TO 40 CM ; HORIZON WET ; NATURAL WET/OXIDIZED 2 .5Y 5/2 ; SILTY CLAY AND CLAY ; FEW, MEDIUM, PROMINENT, l0YR 4/6 MOTTLES ;WEAK TO MODERATE, FINE, ANGULAR BLOCKY STRUCTURE ; WEAK TO MODERATE, FINE, GRANULAR SECONDARY STRUCTURE ; STICKY, PLASTICCONSISTENCE ; FEW, RANDOM, EXPED ROOTS ; SLIGHTLY POROUS ; MODERATE EFFERVESCENCE ; MODERATELY CALCAREOUS ; St100Tii, CLEAR IIORIZONBOUNDARY ; MILDLY ALKALINE 7 .4-7 .8 FIELD PH .
CKG3 : 40 TO 70 CM ; HORIZON WET ; MATRIX MOIST 2 .5Y 4/2 ; SILTY CLAY AND CLAY ; MANY, COARSE, PROMINENT, 7.5YR 4/6 MOTTLES ; WEAK TOMODERATE, FINE, ANGULAR BLOCKY STRUCTURE ; WEAK TO MODERATE, FINE, GRANULAR SECONDARY STRUCTURE ; VERY STICKY, PLASTICCONSISTENCE ; VERY FEW, VERY FINE, RANDOM, EXPED ROOTS ; SLIGHTLY POROUS ; MODERATE EFFERVESCENCE ; MODERATELY CALCAREOUS ; WEAKLYSALINE ; SMOOTH, CLEAR HORIZON BOUNDARY ; MILDLY ALKALINE 7 .4-7 .8 FIELD PH .
CKG4 : 70 TO 90 CM; HORIZON WET ; MATRIX MOIST 2 .5Y 4/2 ; SILTY CLAY LOAt1 ; 2 .5Y 4/4 MOTTLES ; STRUCTURELESS, MASSIVE STRUCTURE ; VERYSTICKY, PLASTIC CONSISTENCE ; SLIGHTLY POROUS; MODERATE EFFERVESCENCE ; MODERATELY CALCAREOUS ; b:EAKLY SALINE ; SMOOTH ItORIZ0ABOUP:DARY ; MILDLY ALKALINE 7 .4-7 .8 FIELD PH .
CKG5 : 90 TO 120 CM ; HORIZON WET ; NATURAL WET/REDUCED 5Y 4/2 .5 ; SILTY CLAY AND CLAY ; COMMON, MEDIUM, PROttINENT, 5Y 4/3 MOTTLES ;STRUCTUI2ELESS, MASSIVE STRUCTURE ; VERY STICKY, PLASTIC COttSISTENCE ; SLIGHTLY POROUS;110D[RA1E EFFERVESCENCE ; M0D[F2AiCLYCALCAREOUS ; WEAKLY SALINE ; SMOOTH, ABRUPT HORIZON BOUt ;DARY ; MILDLY ALKALINE 7 .4-7 .8 FIELD PII .
CKG6 : 120 TO 135 CM ; HORIZON WET ; NATURAL ItET/REDl1CED 5Y 4/1 ; SILT LOAM ; FEN, MEDIUM, PROISIt.ENT, l0YR 4/4 MOTTLES ; STRI)CfURELESS,MASSIVE STRUCTURE ; SLIGHTLY STICKY, PLASTIC CONSISTENCE ; MODERATELY POROUS ; MODERATE EFFERVESCENCE ; S7ROt1GLY CALCl.12LOUS ;WEAKLY SALINE ; MODERATELY ALKALINE 7 .9-8 .4 FIELD P11 .

LE PASLPS MANITOBA 1983 PROFILE NO . 1
CHEMICAL DATA (SURVEY)
C .E .C . EXCHANGEABLE CATIONS
HORIZON PH1
ORGC
(7.)
TOTALN
(7.)
CALCCARB
EQU .7.
CAL-CITElZl
DOLO-MITE(7.1
EXTRACID
01E/100G )
BUFF . PERM .CHARG
BUF
CA
FERED
MG
l t1E/100G
NA
1
K
CKG1 ~ 7 .8 1 .85 0 .10 11 .6 6 .8 4 .5 3 .0 46 .1 29 .6 9 .4 2 .3 0 .6CKG2 ~ 7 .8 1 .21 0.07 11 .6 7 .6 3 .8 3 .8 41 .3 34 .8 11 .5 3 .4 0 .6CKG3 ~ 7.7 1 .25 0 .08 13 .5 8 .0 5 .0 3 .4 38 .5 38 .5 10 .5 3 .7 0 .6CKG4 ~ 7 .7 2 .17 0 .09 13 .6 9 .5 3 .8 3 .6 39 .4 33 .4 9 .9 4 .2 0 .6Ct:G5 ~ 7.7 1 .40 0.07 14 .4 9 .5 4 .5 3 .2 34 .9 33 .0 9 .3 4 .2 0 .5CKG6 ~ 7 .9 1 .19 0 .05 16 .1 8 .5 7 .0 1 .5 20 .7 25 .4 6 .5 3 .6 0 .4
CHEMICAL DATA (SURVEY )
WATER EXTRACT DETERMINATIONS
HORIZOtl (
ELECCOI:D
MP11i05/CM)
X H20AT
SATUR CA MG NA K C03 HCO3 CL 504
CKG1 I 1 .4 78 .0CKG2 ~ 3 .3 86 .4 11 .6 7 .0 15 .9 1 .2 29.0 6 .3CKG3 ~ 4 .1 89 .7 14 .5 8.3 19 .3 0 .9 36 .6 3 .6CKG4 ~ 4 .9 86 .5 21 .4 11 .6 23 .3 1 .4 45 .0 4 .9CKG5 ~ 6 .4 75 .8 30 .4 14 .8 28 .6 3 .2 55 .5 6 .9CKGe ~ 7 .8 49 .5 35 .2 17 .4 34 .5 1 .5 78 .6 0 .8
PHYSICAL DATA (SURVEY)
N03
10RIZOt!
'/. PASSING
3" .75" N0.4 N0SIEVE SIEVE SIEVE SI
PARTICLE SIZE ANALYSIS.10 V .C . C . MED . F . V .F .EVE SAND SAND SAND SAND SAIJO OT .SAND
I OF SAMPLE70- 50-2U 2USILT SILT 2UCLAYCKG1 ~ 3 66 31CI:G2 ~ 1 43 56
_ CKG3 I 1 46 !i3_CKGy G 1 60 39C1:G5 ~ 3 55 41CKG6 ~ 1 19 20 60 20
0 .2UCLAY

Appendix E
SOLUBLE SALT ANALYSIS OF SOIL SAMPLES SUBMITTED TO THE MANITOBASOIL TESTING LABORATORY
NOTES RE APPENDIX E
1 . Sites sampled from the Pasquia Lake bed :
- site numbers 101-182 excluding sites 143, 147-151, 160-162, 165-167, and174-179
- these sites are coded as "IN" in Appendix E
2 . Sites sampled from areas of Polder III outside Pasquia Lake :
- site numbers 1-100 and 201-217 and the sites excluded from 1 above
- these sites are coded "OU" in Appendix E
3 . Site numbers 218-236 inclusive are sampled from a detailed transect locat-ed in the SW14-54-28 WPM for the purpose of monitoring change in salinitystatus in a representative soil area from Polder III .

SALINITY DATA FOR SITES IN FOLDER III 7I50 WEDNESDAY, JUNE 201 1984OF THE PASQUIA PROJECT
SITE LOC UP LOW GTR SECT TWF RGE HEAD ELECOND FH H20SAT CA MG NA K C03 HC03 C1- S04 SAR
1 OU 0 15 NE 21 54 29 W 0~3 8~2 96,0 ,1 OU 60 75 NE 21 59 29 W 1 .1 8 .0 76 .9 . . . . . . . .1 OU 100 115 NE 21 54 28 W 0.8 8 .1 38 .1 . , . .: OU 0 15 NE 21 54 28 W 0 .5 8,3 122~9 . . . . . ,2 OU 60 75 NE 21 54 28 W 1 .0 8 .1 91 .4 , , .2 OU 100 115 NE 21 54 28 W 1 .1 8.0 70 .8 . . , . . .3 OU 0 15 NW 22 54 28 W 1 .7 7~7 71 .9 . . .3 OU 60 75 NW 22 54 28 W 0 .7 7 .9 46 .8 . . . . .3 DU 100 115 NW 22 54 28 W 1 .4 7~8 41~7 . .4 OU 0 15 NW 23 54 28 W 0 .3 8 .1 110 .1 . . 1 1 . . .4 OU 60 75 NW 23 54 1-8 W 0 .2 8 .2 63~7 . . . . .4 OU 100 115 HW 23 54 28 W 0 .6 8.4 114 .7 . . . . . .5 OU 0 15 NE 22 54 28 W 1 .1 8~2 89 .8 . . . , .5 OU 60 75 NE 22 54 28 W 0 .9 8.2 62 .5 . . . . .5 OU 100 115 NE 22 54 28 W 0 .5 8 .3 41 .9 . . . . .6 OU 0 15 NW 23 54 28 W 0.8 8 .0 55 .3 5.2 2.1 211 0 .1 , 3 .5 11~3 0 .2 1~106 OU 60 75 NW 23 54 28 W 1 .7 B .2 91 .1 . . 1 . 1 , . .6 OU 100 115 NW 23 54 28 W 0.8 8 .1 56 .5 4,7 2.2 2 .0 0 .1 . 3 .6 5.9 1 .3 1~087 OU 0 15 NW 23 54 28 W 1~1 8.2 72 .6 . . . . . 1 .7 OU 60 75 NW 23 54 28 W 0.8 8 .2 41 .6 . . 1 . . . 1 . ' .7 OU 100 115 NW 23 54 28 W 1 .4 7.9 37 .5 . . . . . , . .8 OU 0 15 NW 24 54 28 W 0 .5 8 .4 80,6 . . . . . . .8 OU 60 75 NW 24 54 28 W 1 .4 8.0 40 .6 . . . . . . .8 OU 100 115 NW 24 54 28 W 1 .4 7 .8 50 .3 . . . . . .9 OU 0 15 NE 15 54 28 W 1 .7 8 .2 162.9 . . . . . . . .9 OU 60 75 NE 15 54 28 W 2 .1 8 .1 105.9 . . . , . . . .9 OU 100 115 NE 15 54 28 W 1 .6 8.2 108 .1 . . . . . .
10 OU 0 15 SE 15 54 28 W 8 .7 1 .7 190.7 47 .2 36 .5 28 .8 1 .4 . 4 .2 81~9 12 .8 4 .4510 OU 60 75 SE 15 54 28 W 4 .3 8.1 98 .2 24 .3 16,9 16 .1 0~8 . 3 .1 37 .7 8~1 3 .5511 OU 0 15 SW 10 54 28 W 2~7 7.9 178.0 . . . . . . .11 OU 60 75 SW 10 54 28 W 2 .3 8.2 89~5 . . . . .11 OU 100 115 SW 10 54 28 W 2 .2 8 .2 90 .8 . . . . . .12 OU 0 15 NE 10 54 28 W 2,2 8.0 190 .3 . . . , .12 OU 60 75 NE 10 54 28 W 2 .3 8.2 112.0 . . . , . .12 OU 100 115 NE 10 54 28 W 1 .7 8.2 99 .6 . 1 1 1 . . 1 . .13 OU 0 15 NW 15 54 28 W 4 .4 8.1 83 .2 . . . . . . . .13 OU 60 75 NW 15 54 28 W 2 .0 8.1 70 .0 . . . . . . .13 OU 100 115 NW 15 54 28 W 1 .4 8 .0 111 .4 . . . . . .14 OU 0 15 SW 22 54 28 W 0,6 8,5 80 .9 . . . . .14 OU 60 75 SW 22 54 28 W 1 .2 8.3 45 .2 . . . . . . . 1 .14 OU 100 115 SW 22 54 28 W 2 .7 7.8 50 .0 . . . . . . . .15 OU 0 15 SW 22 54 28 W 0 .6 8.5 103.1 . . . . . .15 OU 60 75 SW 22 54 28 W 0 .7 8.4 53 .5 . . . . . . .15 OU 100 115 SW 22 54 28 W 0 .9 8.2- 95.7 . . . . . . . . .16 OU 0 15 SW 21 54 28 W 0.6 8.4 95 .6 . . . . , . . .16 OU 60 75 SW 21 54 28 W 1 .1 8.2 85 .4 . < . . . . . . .16 OU 100 115 SW 21 54 28 W 0.9 8.2 42,9 . . . . . . . . .17 OU 0 15 SW 21 51 28 W 0 .3 8.0 93 .6 . e . . . . . , .17 OU 60 75 Sii 21 54 28 W 0,4 7 .9 44 .5 . . . . . . .17 OU 100 115 SW 21 54 28 W 0 .4 7.9 37 .8 , . . . . . . . .18 OU 0 15 SW 16 54 28 W 0 .5 8,0 64 .3 . . . . . . . .18 OU 60 75 SW 16 54 28 W 0 .5 8~0 68 .7 . . . . . . . .18 OU 100 115 SW 16 54 28 W 0.7 7 .8 68 .1 . . . . . . .19 OU 0 15 SE 16 54 28 W 2 .7 7.8 79 .7 . . . . . .
14
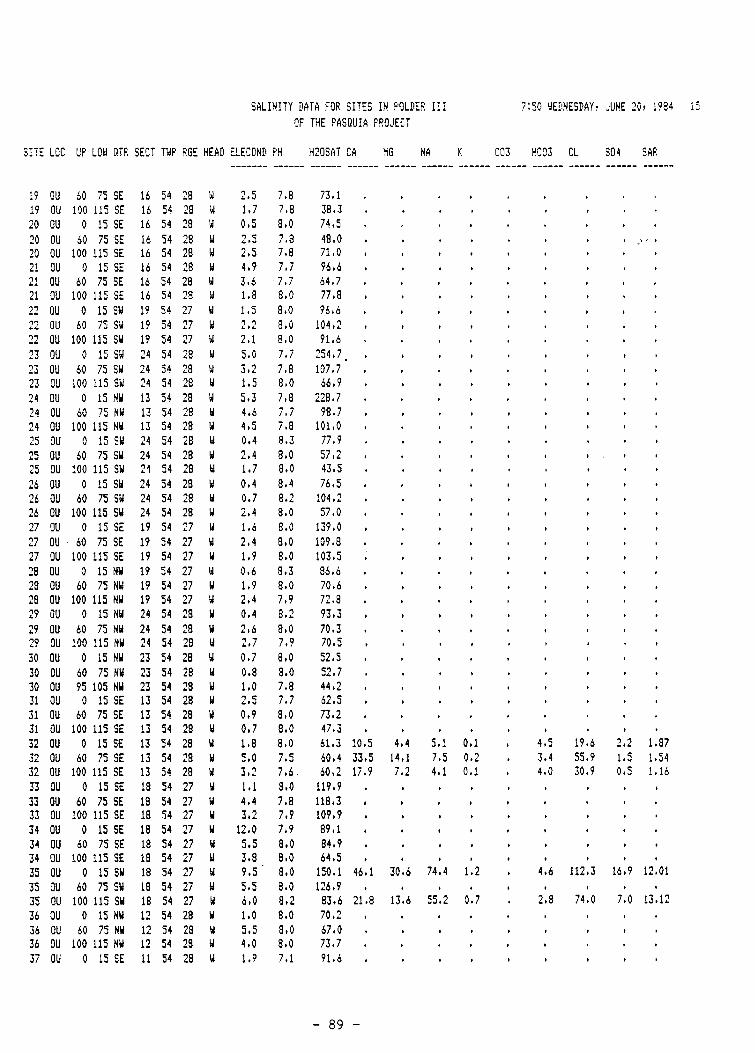
SALINITY DATA FOR SITES IN POLDER III 7~50 YEIONESDAY? JUNE 20r 1984 15OF THE PASOUIA PROJECT
SITE LOC UP LOW OTR SECT TWP RGE HEAD ELECOND-------
FH------
H20SAT------
CA------
?iG------
NA------
K------
C03-----
NC03- ------
CL------
S04 SAR------ ------
19 OU 60 75 SE 16 54 28 W 2 .5 7,8 73 .119 OU 100 115 SE 16 54 28 W 1 .7 7 .8 38 .3 . . , . , , , . ,20 OU 0 15 SE 16 54 28 W 0 .5 8 .0 74,520 OU 60 75 SE 16 54 28 W 2.5 7,8 48 .0 . . . , . , , . _ ,20 OU 100 115 SE 16 54 28 W 2 .5 7 .8 71 .0 . . . . , , . , "21 OU 0 15 SE 16 54 28 W 4 .9 7 .7 96 .6 , , . . . , , , .21 OU 60 75 SE 16 54 28 W 3 .6 7 .7 64 .721 OU 100 115 SE 16 54 28 W 1 .8 8 .0 77 .8 , , . . , , , , .22 OU 0 15 Sid 19 54 27 W 1,5 8 .0 96.622 OU 60 75 SW 19 54 27 W 2 .2 8 .0 104 .2 . , . . . , . . ,22 OU 100 115 SW 19 54 27 W 2 .1 8 .0 91 .6 , . , . . , . . ,23 OU 0 15 SW 24 54 28 W 5.0 7 .7 254 .1
~23 OU 60 75 SW 24 54 28 W 3 .2 7 .8 107.7 , . . , . , . , .23 OU 100 115 SW 24 54 28 W 1 .5 8 .0 66 .9 . , . , , . . , .24 OU 0 15 NW 13 54 28 W 5 .3 7 .8 228 .7 . . , . . , , , ,24 OU 60 75 NW 13 54 28 W 4 .6 7.7 98 .7 . . , . . , , . .24 OU 100 115 NW 13 54 28 W 4 .5 7 .8 101 .0 . . . , . , " " "25 OU 0 15 SW 24 54 28 W 0.4 8,3 77 .9 . . . . . . , . "25 OU 60 75 SW 24 54 28 W 2,4 8 .0 57 .2 . . , . , , . " "25 OU 100 115 SW 21 54 28 W 1 .7 8.0 43 .5 , . , . . , . . "26 OU 0 15 SW 24 54 28 W 0 .4 8 .4 76 .526 OU 60 75 SW 24 54 28 W 0.7 8 .2 104,226 OU 100 115 SW 24 54 28 W 2 .4 8 .0 57 .027 OU 0 15 SE 19 54 27 W 1 .6 8 .0 139 .0 . , . , , , , . .27 OU 60 75 SE 19 54 27 W 2 .4 8 .0 109 .8 . , . . , . . , ,27 OU 100 115 SE 19 54 21 Y 1 .9 8 .0 103 .5 ~ . . , . , , . .28 OU 0 15 NW 19 54 27 W 0,6 8 .3 86.6 . , . . . , , , ,28 OU 60 75 NW 19 54 27 W 1 .9 8 .0 70 .6 . . . . . , , . ,28 OU 100 115 NW 19 54 27 bl 2 .4 7 .9 72,8 , . , . . , , , .29 OU 0 15 N61 24 54 28 W 0 .4 8 .2 93 .3 . , . . . . , . .29 OU 60 75 NW 24 54 28 H 2,6 8 .0 70 .329 OU 100 115 NW 24 54 28 W 2.7 7,9 70 .5 . , . . . , , " ,30 OU 0 15 NW 23 54 28 W 0 .7 8,0 52 .530 OU 60 75 NW 23 54 28 W 0.8 8.0 52,7 , , , . . . . , .30 OU 95 105 NW 23 54 28 W 1 .0 7 .8 44,2 , , . . . , . . "31 OU 0 15 SE 13 54 28 W 2.5 7 .7 62 .5 . , . . , , , . "31 OU 60 75 SE 13 54 28 W 0 .9 8,0 73 .231 OU 100 115 SE 13 54 28 W 0 .7 8 .0 47,3 , . . . , . " . ,32 OU 0 15 SE 13 54 28 W 1 .8 8 .0 61 .3 10 .5 4.4 5 .1 0 .1 , 4,5 19,6 2.2 1 .8732 OU 60 75 SE 13 54 28 W 5 .0 7 .5 60,4 33 .5 14,1 1 .5 0 .2 . 3.4 55 .9 1 .5 1 .5432 OU 100 115 SE 13 54 28 Y 3 .2 7 .6 . 60 .2 17 .9 7.2 4 .1 0 .1 , 4,0 30 .9 0.5 1,1633 OU 0 15 SE 18 54 27 a 1 .1 8 .0 119 .9 . , , , . . . , .33 OU 60 75 SE 18 54 27 W 4 .4 7 .8 118.3 . . , . . . , , ,33 OU 100 115 SE 18 54 27 W 3.2 7 .9 109 .9 . . . . . . . , .34 OU 0 15 SE 18 54 27 W 12 .0 7 .9 89 .1 . . . . . . " . .34 OU 60 75 SE 18 54 21 W 5.5 B.0 84 .9 , . . . . . . . .34 OU 100 115 SE 18 54 27 W 3.8 8,0 64 .5 . . . . . . " " "35 OU 0 15 SW 18 54 27 W 9.5 8.0 150 .1 46 .1 30 .6 74 .4 1 .2 , 4.6 112 .3 16 .9 12 .0135 OU 60 75 SW 1B 54 27 W 5 .5 8 .0 126 .9 . . . . . . , " "35 OU 100 115 SW 18 54 27 a 6 .0 8,2 83 .6 21 .8 13 .6 55 .2 0 .1 . 2.8 74 .0 7 .0 13 .1236 OU 0 15 NW 12 54 28 W 1 .0 8 .0 70 .236 OU 60 75 NY 12 54 28 W 5.5 8.0 67.0 , . . . . . , , ,36 OU 100 115 Nil 12 54 28 W 4 .0 8 .0 73 .7 , . . . , , , , .37 OU 0 15 SE 11 54 28 W 1,9 7,1 91 .6 . . . . . . . . .
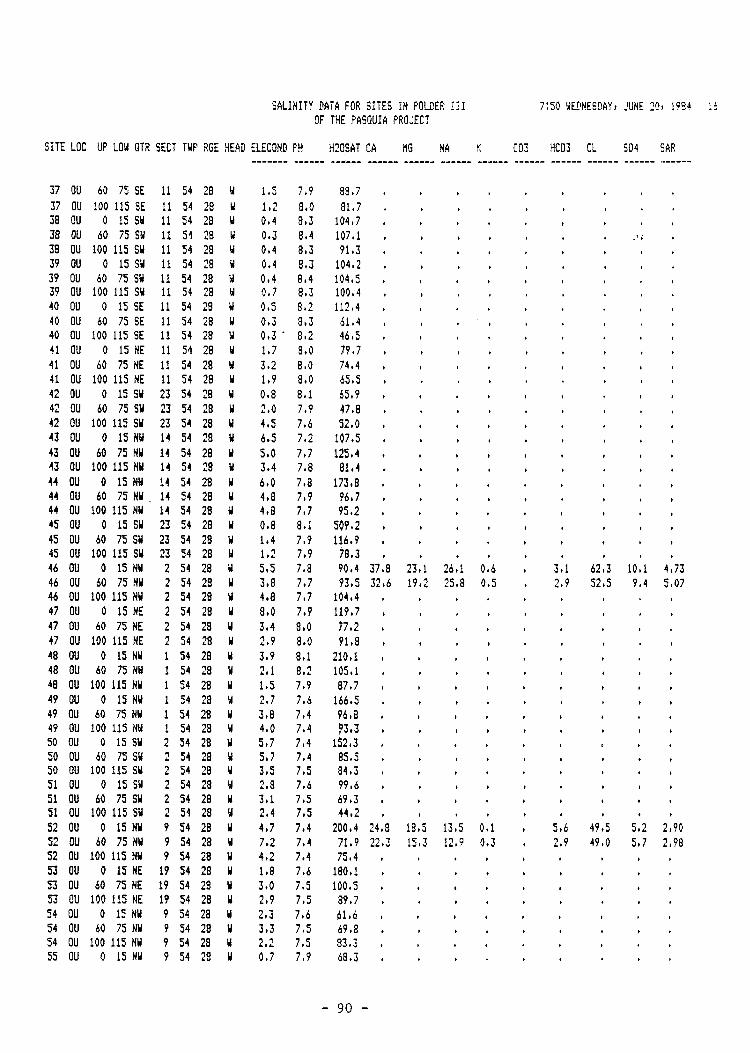
SALINITY DATA FOR SITES IN POLDER' III 7 ;50 ~lEPNEEIIAYY jUNE ?^r 1984 '.6OF THE PASQUIA PROJECT
SITE LOC UP LOW QTR SECT TWP RGE HEAD ELECONP-------
PH------
H20SAT------
CA------
KG------
NA------
K------
C03-----
HCO3- ------
CL------
5504 SAR------ -------
37 OU 60 75 SE 11 54 28 W 1 .5 7 .9 88 .7 . . . . . . . .37 OU 100 115 SE 11 54 28 W 1 .2 8.0 81 .7 . . . . , . . . .38 OU 0 15 SW 11 54 28 W 0 .4 8 .3 104o7 . , . . , . . , ,38 OU 60 75 SW 11 59 28 a 0.3 8.4 107 .1 . . . . , . , _ . .38 OU 100 115 SW 11 54 28 W 0 .4 8 .3 91 .3 . , . . . . , , .39 OU 0 15 SW 11 54 28 W 0.4 8.3 104 .2 . . . . , , , , ,39 OU 60 75 SW 11 54 28 W 0 .4 8 .4 104 .5 . . . , . . . ,39 OU 100 115 SW 11 54 28 W 0.7 8 .3 100.4 . . . . , . , . .40 OU 0 15 SE 11 54 28 W 0 .5 8.2 112 .4 . , , . . . , , .40 OU 60 75 SE 11 54 28 W 0 .3 8 .3 61 .4 , . . . . . , , .40 OU 100 115 SE 11 54 28 W 0 .3 " 8 .2 46 .5 . . . . . . . . .41 OU 0 15 HE 11 54 28 W 1 .7 8 .0 79 .7 . . . . . , , . .41 OU 60 75 NE 11 54 28 bl 3 .2 8~0 74 .4 . , . . . . , . .41 OU 100 115 NE 11 54 28 W 1 .9 8 .0 65 .5 . . . . . . .42 OU 0 15 SW 23 54 28 W 0.8 8.1 65 .9 . . . . . . , . .42 OU 60 75 SW 23 54 28 W 2 .0 7 .9 47 .8 . . . . . . . , .42 OU 100 115 SW 23 54 28 W 4.5 7.6 52 .0 . . . . . . . . .43 OU 0 15 NW 14 54 28 W 6.5 7.2 107.5 . . . , . . . . .43 OU 60 75 NW 14 54 28 W 5.0 7.7 125 .4 . . . . , . . , .43 OU 100 115 NW 14 54 28 W 3 .4 7.8 81 .4 . . . . , . . . .44 OU 0 15 NW 14 54 28 W 6 .0 7 .8 173.8 . . . , . . , . .44 OU 60 75 NW _ 14 54 28 W 4 .8 7.9 96 .7 . . . . . . . , ,44 OU 100 115 NW 14 54 28 W 4 .8 7 .7 95 .2 . . . . , . , .45 OU 0 15 SW 23 54 28 W 0.8 8 .1 509 .2 . . , . . . . . .45 OU 60 75 SW 23 54 28 W 1 .4 7 .9 116.9 , . . , . . , . .45 OU 100 115 SW 23 54 28 a 1 .2 7.9 78 .3 . . . . . . . . .46 OU 0 15 NW 2 54 28 W 5 .5 7 .8 90 .4 37,8 23 .1 26 .1 0.6 . 3.1 62 .3 10 .1 4,7346 OU 60 75 NY 2 54 28 W 3 .8 7 .7 93 .5 32 .6 19 .2 25 .8 0.5 , 2 .9 52 .5 9 .4 5.0746 OU 100 115 NW 2 54 28 W 4 .8 7 .7 104.4 . . . . . . . , .47 OU 0 15 NE 2 54 28 W 8 .0 7 .9 119 .7 . . . . . . , . .47 OU 60 75 HE 2 54 28 W 3 .4 8.0 17 .2 . . , . , . , . .47 OU 100 115 NE 2 54 28 W 2 .9 8 .0 91 .8 . . . , . . . .48 OU 0 15 NW 1 54 28 W 3.9 8.1 210 .1 . . . . . . . . .48 OU 60 75 NW 1 54 28 Y 2 .1 8 .2 105.1 . . , . . . . . .48 OU 100 115 NW 1 54 28 W 1 .5 7.9 87 .7 . . . . . . . . .49 OU 0 15 NW 1 54 28 W 2 .7 1 .6 166.5 . . . . . . . . .49 OU 60 75 NW 1 54 28 W 3.8 7 .4 96 .8 . . . . . . . . .49 OU 100 115 N61 1 54 28 W 4 .0 7 .4 93 .3 . . , . . . . . .50 OU 0 15 SW 2 54 28 W 5.7 7 .4 152 .3 . . . . . . . . .50 OU 60 75 SW 2 54 28 W 5 .7 7 .4 85 .5 . . . . . . . . .50 OU 100 115 SW 2 54 28 W 3 .5 7 .5 84 .3 . . . . . . . . .51 OU 0 15 SW 2 54 28 W 2 .8 7 .6 99 .6 . . . . . . . . .51 OU 60 75 SW 2 54 28 W 3.1 7 .5 69 .3 . . . . . . . . .51 OU 100 115 SW 2 59 28 W 2 .4 7 .5 44 .2 . . . . . . . . .52 OU 0 15 NW 9 54 28 W 4.7 7 .4 200 .4 24 .8 18 .5 13 .5 0 .1 . 5 .6 49 .5 5 .2 2.9052 OU 60 75 NW 9 54 28 W 7 .2 7 .4 71 .9 22 .3 15 .3 12~9 0 .3 . 2 .9 49 .0 5 .7 2.9852 OU 100 115 NW 9 54 28 W 4.2 7 .4 75 .4 . . . . . . . .53 OU 0 15 NE 19 54 28 W 1.8 7.6 180 .1 . . . . . . . . .53 OU 60 75 NE 19 54 28 W 3.0 7 .5 100.5 . . . . . . . . .53 OU 100 115 NE 19 54 28 4 2.9 7.5 89 .7 . . . . . . . . .54 OU 0 15 NW 9 54 28 W 2 .3 7 .6 61 .6 . . . . . . . .54 OU 60 75 NW 9 54 28 W 3.3 7.5 69 .8 . . . . . . . . ,54 OU 100 115 NN 9 54 28 W 2.2 7 .5 83 .3 . , . . , . . . .55 OU 0 15 NW 9 54 28 W 0.7 1 .9 68 .3 . . . . . . . . ,

SALINITY DATA FOR SITES IN FOLDER 111 7 :50 WEDNESDAY? JUNE '-Or 1984 17OF THE PASQUIA PROJECT
SITE LOC UP LOW QTR SECT TWF RGE HEAD ELECOND FH H20SAT CA MG NA K C03 HCO3 CL S04 SAR------- ------ ------ ------ ------ ------ ------ ------ ------ ------ ------ ------
55 OU 60 75 NW 9 54 28 W 7,1 7 .3 58 .1 , , . . . , . .55 OU 100 115 NW 9 59 28 W 7.0 7 .2 62 .4 . . . . , . . . .56 OU 0 15 NW 9 54 28 W 0 .6 8.0 84,0 , . . , . , , . .56 OU 60 75 NW 9 54 28 W 3 .6 7 .7 72 .8 , , . . . . . . , .56 OU 100 115 NW 9 54 28 W 5 .7 7 .5 74 .9 , . , , . . , . ,57 OU 0 15 SW 2 54 28 W 0.5 1 .9 . 3 .7 2 .4 1 .3 0 .2 , 5.7 0,5 0,2 0 .7457 OU 60 75 SW 2 54 28 W 2 .0 7 .8 52 .7 3,6 3 .3 12,1 0,1 . 4.0 27 .5 0 .6 6 .5157 OU 100 115 SW 2 54 I'8 W 3.2 7.7 45 .1 , . . . , . . .58 OU 0 15 SW 2 54 28 W 0,4 8,0 66 .2 , . , . , . . . .58 OU 60 75 SW 2 54 28 W 0.6 8.1 81 .858 OU 100 115 SW 2 54 28 W 0.4 8 .0 54 .6 , . . . , . . . ,59 OU 0 15 SE 2 54 28 W 0 .6 8.0 56 .5 . . , , . , . . .59 OU 60 75 SE 2 54 28 W 0.7 7 .9 39 .459 OU 100 115 SE 2 54 28 W 0 .9 7 .8 41 .4 . , . . . . , . .60 OU 0 15 SW 1 54 28 W 0 .5 7,7 104 .6 . , , . , . , . .60 OU 60 75 SW 1 ~54 28 W 0.4 1 .9 68 .4 , . . , . . , , ,60 OU 100 115 SW 1 54 28 W 0,4 7 .9 85 .8 . . . , , . , . ,61 OU 0 15 SE 1 54 28 W 1 .6 7 .1 56 .3 . , . . . , , , .61 OU 60 75 SE 1 54 28 W 0,5 7 .9 57 .3 , . . . . . , , .61 OU 100 115 SE 1 54 28 W 1 .5 7.7 57.2 . , . , . , . . .62 OU 0 15 SW 6 54 27 W 0 .4 7 .9 69,562 OU 60 75 SW 6 54 27 W 1,1 7 .8 53 .2 . . . . , , . . .62 OU 100 115 SW 6 54 27 W 0,7 7 .9 67 .1 . . . , . , . . .63 OU 0 15 SE 6 54 27 W 0,4 7.9 .75,7 . . . , , , . , ,63 OU 60 75 SE 6 54 27 W 1 .5 7 .8 63 .4 . . . . , . . .63 OU 100 115 SE 6 54 27 W 0 .5 1 .9 66 .8 . . , . , . . . .64 OU 0 15 SW 5 54 27 W 0 .8 7 .9 61 .7 , , . . . . . . ,64 OU 60 75 SW 5 54 27 W 0 .9 8 .0 80 .0 . , . , . , . . ,64 OU 100 115 SW 5 54 27 W 1 .1 7 .7 64 .7 , . , , . , . . ,65 OU 0 15 SE 5 54 28 W 0 .7 7,8 65 .1 . , , , . , . . ,65 OU 60 75 SE 5 54 28 W 4 .0 7 .5 56 .1 , . . . , . , , .65 OU 100 115 SE 5 54 28 W 2 .3 1 .6 53 .966 OU 0 15 SW 4 54 27 W 0 .8 7 .7 73 .1 , . . , . , , . ,66 OU 60 75 SW 4 54 27 W 0 .5 7 .8 76 .3 . . . . , , . . .66 OU 100 115 SW . 4 54 27 W 0 .7 7,3 79 .1 , . . . . , , , .67 OU 0 15 SE 4 51 27 W 0,4 7,9 67 .1 , . . , , , . , .67 OU 60 75 SE 4 54 27 W 0,7 7 .9 63 .8 , , . . . , . , .67 OU 100 115 SE 4 54 27 W 0 .6 8 .1 61 .6 , . , . ' . , . . ,68 OU 0 15 NW 3 54 27 W 0.6 8.1 60,.3 . , . , . . , . ,68 OU 60 75 NW 3 54 27 W 0 .4 8.1 34,7 . . . . , . . . ,68 OU 100 115 NW 3 54 27 W 0.3 8.1 35 .6 , , . , , . . . .69 OU 0 15 SE 10 54 27 W 0 .6 1,9 71,0 , . . . . . , . ,69 OU 60 75 SE 10 54 27 W 2 .0 7 .8 50 .8 . . . , . . . . ,69 OU 100 115 SE 10 54 27 W 1 .8 7 .9 47,6 , . , . . , . . .70 OU 0 15 NW 11 54 27 W 0 .4 8 .0 65 .2 , . . . , , , . .70 OU 60 75 NW 11 54 27 W 0 .6 7 .8 76 .670 OU 100 115 NW 11 54 27 W 0.8 7 .7 70,071 OU 0 15 SE 14 54 27 W 0 .2 8.0 71 .9 , , . . . . . . ,71 OU 60 75 SE 14 54 27 W 0.2 8 .0 66 .2 . , , . , , . . ,71 OU 100 115 SE 14 54 27 W 0 .2 8 .0 90,0 , , , . . . , . .72 OU 0 15 NE 14 54 27 W 0 .4 8 .0 73 .5 , , . . . . . , ,72 OU 60 75 NE 14 54 27 W 1 .2 7.8 S6 .9 . , . . . . . , ,72 OU 100 115 NE 14 54 27 W 0 .9 8 .0 55 .5 . . , , . . , , .73 OU 0 15 SW 14 54 28 W 2,6 7.7 1-47 .0 , . . , . , , . .

SALINITY DATA FOR SITES IN POLDER III 7 :50 WEDNESDAY! JUNE ?0r 1984 13OF THE PASOUIA PROJECT
SITE LOC UP LOW 1TR SECT TWP RGE HEAD ELECONP-------
PH------
H20SAT------
CA------
MG------
NA------
K------
C03-----
HCO3- ------
CL------
E04------
SAR-------
73 OU 60 75 SW 14 54 28 W 7 .0 7,5 127,1 , .73 OU 100 115 SW 14 54 28 W 5 .0 7,1 100.0 . . , " "74 OU 0 15 NE 14 54 28 W 4.9 7.5 199,974 OU 60 75 NE 14 54 28 W 4 .8 7.6 93 .4 . . . . " _74 OU 100 115 NE 14 54 28 W 4.5 7,5 78,0 . . "75 OU 0 15 SW 14 54 28 4 10 .0 7.6 144 .0 48 .4 45 .5 35 .8 1,4 . 3,6 107,0 11,1 5,2275 OU 60 75 SW 14 54 28 W 6,5 7,7 87,5 41,0 26 .0 24,0 0.7 , 3 .2 60,0 12,4 4,1575 OU 100 115 SW 14 54 28 W 6 .0 1.7 80 .2 32 .6 15 .4 20 .2 0 .5 , 3 .1 53,9 8,9 4.1276 OU 0 15 SW 11 54 28 W 1,1 8 .0 79,076 OU 60 75 SW 11 54 28 W 0 .5 8.1 52 .2 , . .76 OU 100 115 SW 11 54 18 W 0,8 8,1 71 .4 , . ,77 OU 0 15 NE 1 54 28 W 9 .0 7 .5 127,7 45 .2 34 .3 36 .1 1,1 . 4 .5 96,6 9,0 5,73
77 OU 60 75 NE 1 54 28 W 6 .5 7 .6 72,4 , "77 OU 100 115 NE 1 54 28 W 7,0 7 .7 72,4 39,6 22,7 33 .0 0,7 , 2,7 83 .3 5,7 5,91
78 OU 0 15 NE 1 54 28 W 3 .4 7.8 180 .578 OU 60 75 NE 1 54 28 W 2.3 8 .0 74,0 . . .78 OU 100 115 NE 1 54 28 W 2 .6 8,0 79,1 , . . " "79 OU 0 15 NE 6 54 ?7 W 6.0 7 .7 392 .3 34,9 28.3 26 .0 0.5 , 4,6 57 .4 6,8 4,6379 OU 60 75 NE 6 54 27 W 4 .5 7 .8 74,479 OU 100 115 NE 6 54 27 W 3.1 7,8 273 .3 16 .0 6.7 12 .1 0 .4 , 2 .6 32,8 ' 2 .4 3.5980 OU 0 15 NE 6 54 27 W 4,8 7,6 94 .8 . , , . "80 OU 60' 75 NE 6 54 27 W 5.4 7 .7 72 .8 . , ,80 OU 100 115 NE 6 54 27 W 5.5 7 .7 66,381 OU 0 15 SE 8 54 27 W 0.8 7,8 109,781 OU 60 75 SE 8 54 27 W 1 .9 7,8 109,7 . , . , "81 OU 100 115 SE 8 54 27 W 2 .5 7,7 89 .1 . , . " "82 OU 0 15 NW 10 54 27 W 0,6 7,6 114,6 . . . "82 OU 60 75 NW 10 54 27 W 2,3 7.3 79,082 OU 100 115 NW 10 54 27 W 3 .1 7,2 59 .0 . . " " "83 OU 0 15 NW 10 54 27 W 0 .4 7 .6 159,783 OU 60 75 NW 10 54 27 W 1 .0 7,3 70,183 OU 100 115 NW 10 54 27 W 1 .0 7,3 51,284 OU 0 15 SE 9 54 27 W 0 .4 7,5 199,584 OU 60 75 SE 9 54 27 W 1 .2 7 .3 62 .3 . , ,84 OU 100 115 SE 9 54 27 W 0,5 7,4 46 .4 , . . , "85 OU 0 15 NE 10 54 27 W 4 .4 1,1 267 .3 , , ,85 OU 60 75 NE 10 54 27 W 3 .8 7,1 90,5 , .85 OU 100 115 NE 10 54 27 W 1,8 7 .2 90 .1 . . "86 OU 0 15 NE 10 54 27 W 1 .1 7,4 =36 .7 . . . . " "86 OU 60 75 NE 10 54 27 W 1 .4 1,4 33 .686 OU 100 115 NE 10 54 27 W 1,6 7 .4 i2 .887 OU 0 15 NW 24 54 27 W 1,4 7,6 101 .3 . , "87 OU 60 75 NW 24 54 27 W 0.5 7,6 69,8 . , . "87 OU 100 115 NW 24 54 27 W 0 .6 7.7 67 .9 . . . " " "88 OU 0 15 NE 24 54 27 W 0,6 7 .7 75 .2 , ,88 QU 60 75 NE 24 54 27 H 0 .7 7 .7 51 .4 . . . " "88 OU 100 115 NE 24 54 27 W 0,6 7 .7 45 .589 OU 0 15 SW 25 54 27 W 0 .5 7 .7 80,2 , . "89 OU 60 75 SW 25 54 27 W 0,5 7 .8 90 .089 OU 100 115 SW 25 54 27 W 0.4 1 .9 69 .4 . . " " "90 OU 0 15 NW 30 54 26 W 0 .6 7,7 93,1 , . "90 OU 60 75 NW 30 54 16 W 0.5 7 .7 55 .5 . . "90 OU 100 115 NW 30 54 26 W 0 .4 7 .8 40 .791 OU 0 15SW 31 54 26 W 0.3 ,',8 70 .9

SALINITY DATA FOR SITES IN FOLDER III 1150 WEDNESDAYr JUNE 20~ 1984 19OF THE PASQUIA PROJECT
SITE LOC UP LOW OTR SECT TWF RGE HEAD ELECOND-------
FH-----
H20SAT- ------
CA------
MG------
NA-----
K- -----
C03- ------
HCO3-----
CL- ------
S04------
SAP------
91 OU 60 75 SW 31 54 26 W 0~3 7 .8 75 .691 OU 100 115 SW 31 54 26 W 0 .4 7~8 65 .5 . . . . . , . , ,92 OU 0 15 HW 31 54 26 W 0 .3 7 .8 73 .6 . . . , . , , , ,92 OU 60 75 NW 31 54 26 W 0.4 7.8 66 .2 . . . . . . , ,92 OU 100 115 NW 31 54 26 W 0.4 .7 .7 71 .1 . . . . . , ,
_, ,
93 QU 0 15 NW 31 54 26 W 0.9 7 .1 156.8 . . . , , . , ,93 OU 60 75 NW 31 54 26 W 1 .4 7,4 72~593 OU 100 115 NW 31 54 26 W 0.7 7 .5 50.3 . , . . , .94 OU 0 15 SE 6 55 26 W 0 .3 7~7 84 .3 ~ . . , , .94 OU 60 75 SE 6 55 26 W 2 .1 7.4 67~0 . . . . , , , ,94 OU 100 115 SE 6 55 26 W 1 .5 7~5 60 .7 . . . . , . , ,95 OU 0 15 SW 6 55 26 W 0 .4 7 .7 18 .6 . . . , , , . . .95 OU 60 75 SW 6 55 26 W 0 .9 7 .4 76 .495 OU 100 115 SW 6 55 26 W 0 .5 7 .6 71 .0 . . . , . . , . .96 OU 0 15 SE 6 55 ?6 W 00 7 .7 82~9 . . . . . . , .96 OU 60 75 SE 6 55 26 W 1~1 7 .6 58 .1 . . . . . , . , ,96 OU 100 115 SE 6 55 26 W 0.6 7 .8 60 .3 . . . . . . , ,97 OU 0 15 NE 35 54 27 W 0.6 7.7 107.2 . . . . . . . , .97 OU 60 75 NE 35 54 27 W 0 .9 7~6 68 .8 . . . . . . , , ,97 OU 100 115 HE 35 54 27 W 1 .3 7.6 83 .6 . . . . , . . ,98 OU 0 15 NW 35 54 27 W 0 .6 7 .7 99 .8 1 . . 1 . , . . ,98 OU 60 75 NW 35 54 27 W 0.6 7~8 80 .5 . . . . . . . , ,98 OU 100 115 NW 35 54 27 W 0 .8 7~7 74,6 . . . , , , . , ,99 OU 0 15 SE 34 54 27 W 2 .5 7 .6 134 .7 . . , , . . , . ,99 OU 60 75 SE 34 54 27 W 1~2 7 .6 97 .2 , , . . . , . .99 OU 100 115 SE 34 54 27 W 0 .6 7 .7 82 .4 . . , . . . , .
100 OU 0 15 SW 34 54 27 W 0 .4 7~8 71 .5 . . . . . . . . ,100 OU 60 75 SW 34 54 27 W 0 .3 7 .9 62 .8 . . . . . . . , ,100 OU 100 115 SW 34 54 27 W 0.4 7 .8 57 .4 , , . . . . , , ,101 IN 0 15 SW 35 54 27 W 0 .5 8 .0 109 .7101 IN 60 75 SW 35 54 27 W 0.8 7~8 70 .9 1101 IN 100 115 SW 35 54 27 W 0.5 7.9 82 .3 1 . . , , . , . ,102 IN 0 15 SW 35 54 28 W 2~8 7 .5 157 .8 19~6 12 .6 7~0 0.1 5 .9 22~0 9~7 1 .74102 IN 60 75 SW 35 54 28 W 1 .2 7.8 92 .8 9 .9 5.3 4 .5 0 .4 . 5~1 20 .1 4 .2 1 .63102 IN 100 115 SW 35 54 28 W 0 .8 8 .0 68 .6 4 .5 2.1 2 .7 0 .3 4 .2 17 .5 1 .4 1 .49103 IN 0 15 SE 35 54 28 W 1 .7 7 .1 121 .1 . . . . . , , ,103 IN 60 75 SE 35 54 28 W 1 .4 7 .8 86 .5 . . . . . . . . ,103 IN 100 115 SE 35 54 28 W 1 .0 7 .8 76 .0 . . . . . , . ,104 IN 0 20 NE 27 54 27 W 3 .0 7 .5 146.3 29 .5 16 .2 5 .0 0 .8 . 4 .0 20 .6 15 .8 1 .05104 IN 20 50 NE 27 54 27 W 1 .5 7 .7 89 .4 , , . , . . . ,104 IN 50 170 NE 27 54 27 W 1 .1 7 .8 97~8 9~7 4 .4 3 .7 0 .5 . 3 .4 13 .7 5~2 1 .39105 IN 0 30 SE 27 54 27 W 0.9 7.9 97 .9 . . . , . . .105 IN 60 75 SE 27 54 27 W 0 .8 7.9 98 .5 . . . . . . . . ,105 IN 105 120 SE 27 54 27 W 1 .0 7 .9 63 .9 . . . . . . . , .106 IN 0 30 SE 27 54 27 W 1 .1 7.7 91 .5 . . , . . , . . ,106 IN 60 75 SE 27 54 27 W 1 .7 7 .5 99 .9 . . . ~ . . . . . .106 IN 105 120 SE 27 54 27 W 0 .8 7.8 80 .4 . . . . . , . , ,107 IN 0 20 NE 27 54 27 W 2.3 7.7 144 .4 . . . . . . . , .107 IN 60 75 NE 27 54 27 W 1 .4 7 .8 108 .3 . . . , . . , .107 IN 105 120 NE 27 54 27 W 1 .1 8.0 86 .6 . . . . . . , . .108 IN 0 20 NE 27 54 27 W 0 .7 8 .0 65 .9 . . . . , . . . .108 IN 25 90 NE 27 54 27 W 0 .7 8.0 55 .0 . . . . , , . . .108 IN 105 120 NE 27 54 27 W 0 .5 8 .0 71 .5 . . . . . . . , ,109 IN 0 20 SW 27 54 27 W 2 .0 7~5 108 .4 . . . . . , , . .

SALINITY DATA FOR SITES IN POLDER III 7 ;50 WEDNESDAY, JUNE '?^? '.' :4 20OF THE PASOUIA PROJECT
SITE LOC UP LOW OTR SECT TWP RGE HEAD ELECONIi-------
PH N20SAT------ ------
CA------
MG------
MA K------ ------
C03 HCO3 CL------ ------ ------
S04 SAP.------ ------
109 IN 60 75 SW 27 54 27 W 1 .5 7.8 92 .2 . . . . . . . .109 IN 105 120 SW 27 54 27 W 1 .3 7 .8 88 .5 . . . . . . . , "110 IN 0 20 SW 27 54 27 W 3.0 7.7 107 .5 29 .2 13 .4 6.9 0 .8 . 3 .9 13 .7 12 .9 1 .50110 IN 60 75 SW 27 54 27 W 1 .3 7 .9 105 .7 . . . . . . . . .110 IN 105 120 SW 27 54 27 W 1 .5 7 .9 95 .7III IN 0 20 NW 27 54 27 W 1 .1 7 .8 126.0 13 .2 5 .9 3 .3 0.4 . 4.2 10 .8 5.81.07111 IN 65 80 NY 27 54 27 W 1 .8 8.1 93 .4 . . . .111 IN 105 120 NY 27 54 27 W 1 .1 8 .1 89 .7 6.6 3 .5 3.1 0.3 . 4.1 10 .8 2.9 1-78112 IN 0 20 NW 27 54 27 W 1 .9 8.0 92 .6 . . . . . . . . ,112 IN 60 15 NW 27 54 27 W 0 .8 8 .1 86 .3' . . . . . . . . .112 IN 105 120 NY 27 54 27 W 0 .7 8.1 75 .4 . . . . . . . ,113 IN 0 20 SE 28 54 27 W 2 .5 7 .7 101 .1 . . . . . . . . .113 IN 60 75 SE 28 54 27 W 1 .9 7 .8 101 .1 . . . . . . . .113 IN 105 120 SE 28 54 27 W 2 .0 7 .8 62 .8 . . . . . . . .114 IN 0 20 NE 21 54 27 W 2 .9 7.8 151 .8 . . . . . . . . .114 IN 60 75 NE 21 54 27 W 2,2 7 .9 105 .6 . . . . . . . . .114 IN 105 120 NE 21 54 27 W 2 .3 7.8 89 .9 . . . . . . . .115 IN 0 20 NY 22 54 27 W 3 .4 7 .7 106.4 29 .7 14 .6 10 .4 0.9 . 3.9 29 .4 0.1 2 .21115 IN 60 75 NY 22 54 27 W 2.0 7.9 100 .5 . . . " .115 IN 105 120 NY 22 54 27 W 3 .2 7 .8 97 .8 30 .6 15 .3 7 .5 1 .1 . 3.1 22 .1 16 .3 1 .57116 IN 0 20 SE 28 54 27 W 1 .1 7.8 129 .1 . . . . . . . . .116 IN 60 75 SE 28 54 27 W 1 .6 7.8 82 .5 . . . . " " " "116 IN 105 120 SE 28 54 27 W 1 .3 7.8 81 .5 . . . . . . . . .117 IN 0 20 SE 28 54 27 W 0 .5 7.9 97 .9 . . . . . . . . .117 IN 60 75 SE 28 54 27 W 0 .5 7 .8 57 .8 . . . . . . . . .117 IN 105 120 SE 28 54 27 W 0 .6 1.7 56 .9 . . . . . . . . .118 IN 0 20 NY 21 54 27 W 3.2 7 .4 126 .7 26 .6 14 .1 7 .2 0 .5 . 3 .7 20 .6 12 .9 1 .60118 IN 60 75 NW 21 54 27 W 2~1 7.8 95 .6 13 .8 6.6 4.0 0 .5 . 3 .8 21 .1 6 .7 1 .25118 IN 105 120 NW 21 54 27 W 1 .9 7.7 97 .2 11 .9 6.2 4 .3 0 .5 . 3 .7 18 .1 5 .1 1 .43119 IN 0 20 SE 21 54 27 W 2 .7 7.5 108.4 16 .1 8 .9 9.4 0.7 . 3 .8 27 .0 6.8 2.66119 IN 60 75 SE 21 54 27 W 1 .9 7 .7 .68 .4 9 .2 5 .2 5 .4 0.5 . 3 .8 23 .5 3 .4 2 .01119 IN 105 120 SE 21 54 27 W 1 .3 7 .8 75 .2 4.5 2 .5 3 .3 0.3 . 3 .5 19 .6 1 .6 1 .76120 IN 0 25 NY 21 54 27 W 1 .6 7.7' 159 .0 . . . . . . . " "120 IN 60 75 NY 21 54 27 W 1 .4 7 .8 82 .2 . . . . . . " " "120 IN 105 120 NW 21 54 27 W 1 .1 7 .8 84 .7 . . . . . . " "121 IN 0 25 SW 28 54 27 W 0 .7 7 .7 111 .3 . . . . . . . . ,121 IN 60 75 SW 28 54 27 W 0.7 7.9 83 .2 . . . . . . ,121 IN 105 120 SW 28 54 27 W 0 .5 7 .9 83 .8 . . . . . . . .122 IN 0 20 SE 20 54 27 W 0.7 7 .8 73 .5 . . . . . . . . .122 IN 60 75 SE 20 54 27 W 0 .7 1.8 56 .7 . . . . . . . . .122 IN 105 120 SE 20 54 27 W 0.9 7.7 50 .6 . . . . . . . . .123 IN 0 20 SE 20 54 27 W 3.4 7.4 108.1 32 .0 14 .8 9.4 0.8 . 6 .7 25 .0 14 .9 1 .94123 IN 60 75 SE 20 54 27 W 2 .5 7.8 94 .4 . . . . . . .123 IN 105 120 SE 20 54 27 Y 2 .1 1 .9 102.8 16 .0 8 .3 6.1 0.7 . 3.8 20 .6 6.8 1.75124 IN 0 20 NY 17 54 27 W 2 .9 7.7 128 .5 . , < . . . . . .124 IN 60 75 NY 17 54 27 W 2 .8 7 .8 99,2 . . . . . " " . "124 IN 105 120 NY 17 54 27 W 1 .9 7 .9 103,8 . . . . . . . . "125 IN 0 20 NE 17 54 27 W 2 .7 7 .7 102.3 . . . . " " " " "125 IN 60 75 HE 17 54 27 W 2 .3 7 .6 96,9 . . . . . . . . .125 IN 105 120 NE 17 54 27 W 1 .9 7 .9 98 .6 . . . . . " " "126 IN 0 20 SW 20 54 27 W 3 .0 7.7 92,1 . . . . " " " "126 IN 60 75 SW 20 54 27 W 2 .3 7 .8 99 .2 . . . . " " "126 IN 105 120 SW 20 54 27 W 1 .8 7.9 119»9 . . . . . . . . "127 IN 0 15 SY 20 54 27 W 1 .6 7 .9 104.4 . . . . . . . . .
-94-

SALINITY DATA FOR SITES IN POLDER III 7 :50 WEPNESDAYY JUNE 201 1984 21OF THE PASQUIA PROJECT
SITE LOC UP LOW QTR SECT TWP RGE HEAD ELECONP-------
PH------
H20SAT------
CA------
MG------
NA------
K------
C03------
HC03-----
CL- ------
S04 SAR------ ------
127 IN 60 75 SW 20 54 27 W 2.7 7 .8 97 .4127 IN 105 120 SW 20 54 27 W 1 .4 7.4 82.3128 IN 0 20 NW 17 54 27 W 2,2 7 .5 84 .4128 IN 60 75 NW 17 54 27 W 1 .7 7.5 98 .1128 IN 105 120 NW 17 54 27 W 1 .2 7,6 96 .7 , . . , . , , . ,129 IN 0 20 NW 17 54 27 W 3.5 7,3 112,1 26 .5 13,7 8 .1 0 .5 . 3.0 29 .4 10 .5 1,81129 IN 60 75 NW 17 54 27 W 2,1 7 .4 94,0 10 .8 5.2 4,1 0,6 , 3 .6 ?1,0 2.8 1,45129 IN 105 120 NW 17 54 27 W 1 .2 7 .6 91 .1 5 .6 3 .0 3 .1 0 .4 , 3,3 13 .7 1 .9 1 .49130 IN 0 20 SE 17 54 27 W 3,4 7 .4 112.8 24 .3 13,1 8 .2 0.7 4 .1 25 .0 10 .7 1~88130 IN 60 80 SE 17 54 27 W 2 .8 7 .5 93 .8 . . , , . .130 IN 105 125 SE 17 54 27 W 1 .8 7,6 92 .6 10 .4 5 .9 5 .1 0 .6 , 3.3 22,0 4 .7 1 .79131 IN 0 20 NE 8 54 27 W 3.1 7 .5 107,8 , . . . . . . , .131 IN 30 50 NE 8 54 27 W 2 .9 7,5 88 .0 , . , . , . , . .131 IN 90 110 NE 8 54 27 W 1 .8 7 .7 88 .5 . . . . , . . .132 IN 0 20 NW 8 54 27 W 3 .5 7,6 89,4132 IN 60 70 NW 8 54 27 W 3 .5 7 .6 82 .3 , . . , . , , . .132 IN 105 120 NW 8 54 27 W 2,1 7,8 80 .2 , . , . . , , . ,133 IN 0 15 NW 8 51 27 W 12 .5 7 .4 67,5 19 .5 18 .3 101 .4 0 .4 , 4 .3 113 .2 12 .2 23.32133 IN 60 80 NW 8 54 27 W 1 .2 7,8 231 .5133 IN 105 120 NW 8 54 27 W 2 .8 7 .6 71 .3133 IN 120 125 NW 8 54 27 W 2 .2 7,6 75 .7 5 .6 3 .4 25 .5 0 .1 , 4,1 30,4 3.0 12 .02134 IN 0 15 NW 9 54 27 W 2 .0 7 .5 121 .3134 IN 60 75 NW 9 54 27 W 1 .2 7 .6 67 .4134 IN 105 120 NW 9 54 27 W 1 .4 7.6 63 .7135 IN 0 20 NE 9 54 27 W 1 .4 7,6 119,3 , , , , . . . . .135 IN 60 80 NE 9 54 27 W 1 .2 7,7 89 .3135 IN 105 120 NE 9 54 27 W 1 .1 7 .7 92 .5136 OU 0 20 NE 9 54 27 W 0 .8 7.8 80.9 . . , . , _ . , . .136 OU 60 75 NE 9 54 27 W 1 .8 7 .5 65 .2 , . , , . , . . ,136 OU 105 120 NE 9 54 27 W 1 .1 7.6 77,1 . . . , , . . . ,137 IN 0 20 NE 16 54 27 W 2 .4 7,5 111 .1 17,0 8 .6 6 .7 0 .7 . 4 .2 17 .6 7 .2 1 .87137 IN 60 15 NE 16 54 27 W 1 .9 7,5 85.5 , , , , . . . , .137 IN 105 120 NE 16 54 27 W 1 .5 7 .6 83 .2 12 .5 6,6 5 .1 0 .6 , 4 .2 12,7 5,4 1~65138 IN 0 20 SE 16 54 27 W 3.4 7 .4 112 .8138 IN 60 75 SE 16 54 27 W 1 .5 7,6 89,8138 IN 95 110 SE 16 54 27 W 1 .2 7 .7 81 .7 , . . , . . . , ,139 IN 0 20 NE 9 54 27 W 2 .6 7.6 113 .2139 IN 60 70 NE 9 54 27 W 0 .8 1 .8 80 .9 . , . . . . , , ,139 IN 105 120 NE 9 54 27 W 1 .0 7,8 8 .3140 IN 0 20 SW 22 54 27 W 2,6 7 .5 126 .0 . , . . , . , , ,140 IN 95 110 SW 22 54 27 W 1 .6 7 .6 90 .1 . . . . . . . . ,140 IN 130 150 SW 22 54 27 W 1 .3 7 .8 92 .2141 IN 0 20 NE 15 54 27 W 3 .0 7 .6 59 .7 . . , . . . . . ,141 IN 50 60 NE 15 54 27 W 1 .8 7 .7 63 .3 . . . , , . . ,141 IN 105 120 NE 15 54 27 W 1 .6 7 .5 47 .1 . . . , . , . . ,142 IN 0 20 SE 15 54 27 W 1 .3 7 .7 54 .9 , . , , . , . . ,142 IN 60 75 SE 15 54 27 W 1 .2 7 .7 157,6142 IN 105 120 SE 15 54 27 W 1 .0 7,7 64 .8 . . . . , . . . ,143 OU 5 25 SE 15 54 27 W 1 .2 7 .5 86 .5143 OU 60 75 SE 15 54 27 W 0 .8 7.5 90,8 . , . . . . . . ,143 OU 105 120 SE 15 54 27 W 0,6 7 .5 74 .4144 IN 0 20 SE 22 54 27 W 2,1 7 .3 123.2 13 .6 7 .1 4 .7 0 .4 , 4,0 16 .2 5 .3 1 .46144 IN 60 75 SE 22 54 27 W 1 .5 7 .5 66 .2 . . . . . , , , .144 IN 105 120 SE 22 54 27 W 0 .9 7.6 42 .8 5 .1 2 .9 3 .8 0 .2 1 3.6 10,8 1 .3 1 .90

SALINITY DATA FOR SITES IN POLDER III 7 ;50 WEDNESDAYi JUNE 20? 1984OF THE PASGUIA PROJECT
SITE LOC UP LOW OTR SECT TWF RGE HEAD ELECOND FH H20SAT CA MG NA K C03 HC03 CL S04 SAR
145 IN 0 1.0 NE 15 54 27 W 1~0 7~6 122,5145 IN 60 75 NE 15 54 27 W 0.5 1 .8 102 .0145 IN 100 110 NE 15 54 27 W 0 .6 7.8 75 .3146 IN 0 20 NW 14 54 27 W 1 .6 7 .5 101 .1 8 .7 5 .1 6.7 0 .2 . 4 .7 16 .7 3~4 2 .55146 IN 60 75 NW 14 54 27 W 1 .6 7 .5 84 .5 . . . , . ,
'146 IN 95 110 NW 14 54 27 W 0.8 7.6 78 .4 3 .4 1 .9 4 .6 0 .2 . 4 .0 14 :7 1 .0 2~83147 OU 0 20 NW 14 54 27 W 0 .5 7 .7 71 .9147 OU 60 75 NW 14 54 27 W 2.0 7 .4 79~9 . . . . , , , , ,147 OU 105 120 NW 14 54 :7 W 0 .7 7~6 65 .9148 OU 0 15 NE 14 54 27 W 0 .5 7 .7 181 .8 . .148 OU 60 75 NE 14 54 27 W 0 .5 M 94 .4148 OU 100 115 NE 14 54 27 W 0 .5 7.8 90 .1149 OU 0 15 NE 14 54 27 W 0 .5 7 .8 94,9149 OU 60 75 NE 14 54 27 W 0.3 7.9 58 .6 . . ,149 OU 100 115 NE 14 54 27 W 0 .2 7 .8 57 .6150 OU 0 20 SW 23 54 27 W 0 .5 7 .6 96 .4 . . . . , , ,150 OU 60 75 SW 23 54 27 W 0 .5 7 .8 97 .6150 OU 105 120 SW 23 54 27 W 0 .9 7 .7 100.4151 OU 0 15 SW 21 54 27 W 0 .8 7.1 73 .3151 OU 60 75 SW 21 54 27 W 2 .2 7 .5 77 .6 . . . . . , , , ,151 OU 100 115 SW 21 54 27 W 1 .4 7 .5 84 .0152 IN 0 20 SE 20 54 27 W 1 .0 7.6 111 .7152 IN 60 75 SE 20 54 27 W 0 .8 7~1 82 .2152 IN 105 120 SE 20 54 27 W 0.9 7 .7 55 .2153 IN 0 20 NE 22 54 27 W 0 .7 7 .8 93 .9 . , . . . , , , ,153 IN 60 75 NE 22 54 27 W 0 .8 7 .8 79 .0 . . . . . , , , ,153 IN 105 120 NE 22 54 27 W 0.8 7.7 69 .1155 IN 0 20 NE 22 54 27 W 0.8 7 .8 67~9 . . . . , , , , ,155 IN 60 75 NE 22 54 27 W 0.7 7~8 81 .3155 IN 105 120 NE 22 54 27 W 0.8 1.8 71 .4156 IN 0 20 SW 26 54 27 W 0.7 7 .8 118.7156 IN 60 15 SW 26 51 27 W 0.6 7.8 99 .4 . . . . ,156 IN 105 120 SW 26 54 27 W 0 .8 7 .8 60 .9157 IN 0 20 SW 26 54 27 W 1 .1 7 .8 246.2 . . . . , , , , ,157 IN 60 75 SW 26 54 27 W 1 .9 7~6 80 .4 . . . . , , , , ,157 IN 105 120 SW 26 54 27 W 1 .2 7 .8 89 .5 . . , . . , , , ,158 IN 0 20 NE 23 54 27 W 0.7 7.8 94 .0 , . . . , . , , ,158 IN 60 75 NE 23 54 27 W 0 .8 1 .8 77 .6158 IN 105 120 NE 23 54 27 W 0.7 7 .8 78 .3 . . . . . , , , ,159 IN 0 20 SE 26 54 27 W 0.8 7.9 89 .0 . . . . , , , , ,159 IN 60 75 SE 26 54 27 W 0.5 7~9 70 .8 . , , ,159 IN 105 120 SE 26 54 27 W 1 .2 7 .9 82 .8 . . . . , , , , ,160 DU 0 20 SE 25 54 27 W 0.5 8 .2 70 .0160 OU 60 75 SE 25 54 27 W 0.5 8 .1 81 .5 . . . . , , , , ,160 OU 105 120 SE 25 54 27 W 0 .6 8.0 72 .5 . . . . . , , , ,161 OU 0 20 SW 31 54 26 W 3 .0 7 .6 106.3 9.7 10 .9 11 .4 0.1 . 5.7 27 .9 1 .8 3.55161 OU 60 75 SW 31 54 26 W 1 .0 7.8 72 .1 . . . . . , , , ,161 OU 105 120 SW 31 54 26 W 0 .8 7 .8 70 .0 4 .7 1 .9 3.0 0 .2 . 3 .9 15 .7 0 .5 1 .65162 OU 0 20 SE 36 54 27 W 2 .0 7.8 97 .2 . . . . . , , , ,162 OU 60 75 SE 36 54 27 W 1 .1 7.8 76 .6 . . , . .162 OU 105 120 SE 36 54 27 W 0.9 7 .8 64 .4 . . . ,163 IN 0 15 SE 36 54 27 W 1 .1 1 .8 113 .0 . . . , , . , , ,163 IN 50 75 SE 36 54 27 W 1 .0 7 .7 102 .4163 IN 75 120 SE 36 54 27 W 0.7 7 .9 90 .4 . . . , , , , , ,

SALINITY DATA FOR SITES IN POLDER III 1150 WEDNESDAYr JUNE 20r 1984 23OF THE PASQUIA PROJECT
SITE LOC UP LOW OTR SECT TWF tiGE HEAD ELECOND-------
FH-----
H20SAT- ------
CA------
MG------
NA------
K------
C03-----
HC03- -----
CL- ------
S04 SAR------ ------
164 IN 0 20 SE 36 54 27 W 2 .1 7,6 113 .9 . '164 IN 20 70 SE 36 54 27 W 1 .5 7 .7 93 .0 . . , . . . , ,164 IN 70 120 SE 36 54 27 W 1 .0 7 .8 82 .8 . , . . . , . , ,165 OU 0 15 NE 25 54 27 W 0.5 8.0 105 .7 . . . . , . , . ,165 DU 50 80 NE 25 54 27 W 1 .3 7 .8 48 .1 . . . . , , ,
_. ' ,
165 OU 80 120 NE 25 54 27 W 1,6 7.7 61 .1 . , , . . . , . .166 OU 0 15 NE 25 54 27 W 0 .7 7 .9 114 .2 . , , . . . . , .166 OU 60 75 NE 25 54 27 W 1 .4 7,7 90 .0 . . . . . . . . ,166 OU 75 120 NE 25 54 27 W 0 .8 7 .8 85 .4167 OU 0 15 NW 25 54 27 W 1 .5 7,9 103 .3 . , , . . . . . .167 OU 50 85 NW 25 54 27 W 0,5 8 .0 71 .3167 Oli 110 120 NW 25 54 27 W 0 .4 8 .0 62 .6 . . , . . , . , .168 IN 0 20 SE 36 54 27 W 1,4 7 .8 122 .5 . , . . . . . . .168 IN 60 85 SE 36 54 27 W 1 .8 8.0 94 .8 . . , . . . , . ,168 IN 105 120 SE 36 54 27 W 0 .9 7 .9 77 .1 , . . . , , , , .169 IN 0 20 NW 25 51 27 W 1 .4 7.9 114 .6 . . . . , . , , "169 IN 60 75 NW 25 54 27 W 1 .1 7,9 81 .4 . , . . . , , . ,169 IN 105 120 NH 25 54 27 W 1 .0 7 .9 86 .9 . . . . . . . . ,170 IN 0 20 NW 25 54 27 W 1 .7 7 .9 99,7 . . . . , . . , .170 IN- 55 70 NW 25 54 27 W 0 .9 7 .9 79 .7 . , . , . . . . .170 IN 105 120 NW 25 54 27 W 0 .7 7 .8 75 .0171 IN 0 20 NE 26 54 27 W 1 .7 8 .0 157 .7171 IN 60 75 NE 26 54 27 W 1 .1 7 .7 97 .3 , . . . . . , , ,171 IN 105 120 NE 26 54 27 W 0 .9 7 .7 90 .2 . . . . . . . . .172 IN 0 20 NE 8 54 27 W 3.9 7 .8 127 .0 29 .9 17 .2 12,1 0 .8 . 3 .4 25 .0 14 .3 2 .49172 IN 60 75 NE 8 54 27 W 3 .8 7 .5 92 .0 . . . , , . . . .172 IN 105 120 NE 8 54 27 W 2 .2 7,7 90 .7 24 .8 11 .8 8 .3 0 .9 . 3 .4 17,6 10 .2 1 .94173 IN 0 20 NE 8 54 27 W 6 .7 7 .8 116 .4 41 .3 26 .0 20 .1 0.5 . 3 .3 46 .1 15 .6 3.47173 IN 60 75 NE 8 54 27 W 4 .0 7 .6 83,1 , . . , , , , . ,173 IN 105 120 NE 8 54 27 W 3 .0 7 .5 77 .3 17 .8 10 .0 11 .1 0.8 . 3 .0 37 .7 2 .5 2.98174 OU , , SW 8 54 27 W 4 .1 7.6 171 .1 27 .4 15 .3 19,2 0 .8 , 3 .9 21 .6 14 .9 4 .16174 OU 0 20 SW 8 54 27 W 5 .7 7 .8 94 .6 . . . . , . . . .174 OU 60 75 SW 8 54 27 W 4 .3 7 .5 87,1 30 .8 14 .1 20 .1 0 .6 . 2 .5 39 .7 10 .4 4 .24174 OU 105 120 SW 8 54 27 W . , . . , , . . . . . ,175 OU 0 30 NW 5 54 27 W 2 .7 7 .7 161 .4 8 .8 4 .8 18 .1 0 .6 . 5 .6 27 .0 2 .4 6,94175 OU 30 90 NW 5 54 27 W 8.6 7 .7 88 .4 . . . . , , . . .175 OU 90 120 NW 5 54 27 W 8,2 7 .5 69 .6 21 .4 13 .7 59 .6 0,8 . 2 .7 85 .8 3 .6 14 .23176 OU 0 15 SE 7 54 27 W 4 .3 7 .5 307 .1 16 .1 8.7 2 .1 0 .6 . 6 .1 39 .7 3.4 0 .60176 OU 60 75 SE 7 54 27 W 6 .8 7 .7 107 .7 . . . . , . , . .176 OU 100 120 SE 7 54 27 W 6.5 7 .7 79 .9 26 .4 14 .0 34 .6 0 .7 . 2 .7 73 .5 3 .4 7 .70177 OU 0 30 SE 7 54 27 W 24,0 7.6 76 .7 24,1 25 .2 247 .9 0 .4 . 5 .4 288.7 4 .4 49,93177 OU 60 75 SE 7 54 27 W 16 .0 7 .9 67 .6 13 .7 11 .5 133 .1 0 .2 , 3 .3 169.1 2 .0 37 .50117 OU 100 115 SE 7 54 27 W 18 .0 8.1 66 .1 16 .1 13 .0 130.5 0.5 , 3.7 174,5 1 .9 34 .21178 OU 0 20 SE 7 54 27 W 8 .8 8 .0 49 .3 . . . . . . , , .178 OU 60 75 SE 7 ~54 27 W 3 .9 7 .6 96 .4 . . . . . . , , .178 QU 105 120 SE 7 54 27 4J 3 .5 7 .7 120 .3 . . . . . . " " .179 OU 0 20 NE 7 54 27 W 11 .2 7 .2 173 .4 , . . . . . . . .179 OU 20 100 NE 7 54 27 W 9 .0 8 .2 121 .5 . , . . . . . . .179 OU 100 120 NE 7 54 27 W 7 .7 8.1 112 .6 . . . . , , , , .180 IN 0 15 NW 8 54 27 W 2 .3 8 .1 102 .5 . . , , . . . . ,180 IN 60 75 NW 8 54 27 W 1 .9 7 .6 94 .8 . . , . , . . . .180 IN 100 115 NW 8 51 27 W 1 .7 1.6 97.0 . . . . , . . , .181 IN 0 20 SE 8 54 27 W 3 .0 - 7 .6 117 .2 . , . . . . . . .181 IN 60 75 SE 8 54 27 W 2 .3 7.4 92 .1 . . . . . . . . .

SALINITY DATA FOR SITES IN POLDER III 7 :50 WEDNESDAYr JUNE 207 1984 24OF THE PASOUIA PROJECT
SITE LOC UP LOW GTR SECT TWP RGE HEAD ELECOND-------
PH H20SAT C------ ------
A-----
MG- ------
NA------
K------
C03------
HC03------
CL------
S04------
SAR-------
181 IN 105 120 SE 8 54 27 W 1 .9 7,5 86 .8 , . , . . , , , ,182 IN 0 15 SW 17 54 27 W 3.3 7.6 120 .7 ,182 IN 55 75 SY 17 54 27 W 2 .5 7,7 98 .0182 IN 105 125 SW 17 54 27 W 1 .7 7,8 99 .8201 OU 0 15 NE 28 54 27 W 0,4 7 .8 78 .6201 OU 60 75 NE 28 54 27 W 1 .1 7 .6 75 .3201 OU 100 115 NE 28 54 27 W 0 .9 7,7 59,4202 OU 0 15 SW 28 54 27 W 0 .6 1,8 59 .1202 OU 60 75 SW 28 54 27 W 0 .5 1 .8 52 .0202 OU 100 115 SW 28 54 27 W 0 .3 7 .9 56 .4,203 OU 0 15 NE 20 54 27 W 0 .9 7 .7 65 .1203 -OU 60 75 NE 20 54 27 W 1 .3 7,751:6203 OU 100 115 NE 20 54 27 W 1 .4 7 .6 49 .1204 OU 0 15 NW 20 54 27 W 2 .8 7 .5 136.3 , . ,204 OU 60 75 NW 20 54 27 W 3,8 7.4 89 .8 , . . . . . , , ,204 OU 100 115 NW 20 54 27 W 1 .1 7 .6 76 .1 . , . . . , . , .205 OU 0 15 NE 19 54 27 W 0.5 7,9 13 .3205 OU 60 75 NE 19 54 27 W 0 .6 7.9 73 .0 . . , , , . , . ,205 OU 100 115 NE 19 54 27 W 3.8 7.4 52 .1 , . , , . , . .206 OU 0 15 NW 19 54 27 W 9 .0 7.3 91 .0 . . . , . , . , ,206 OU 60 75 NW 19 54 27 W 5.8 7.4 99 .6 , , . , . . . , ,206 OU 100 115 NW 19 54 27 W 3 .4 7.5 98 .4 . . . , . . , , ,207 OU 0 15 NE 19 54 27 W 8.4 7,3 138 .2 , . , , . , . , .207 OU 60 75 NE 19 54 27 W 4 .2 7.6 135.9207 OU 100 110 NE 19 54 27 W 3,7 7 .7 89 .1208 OU 0 15 SE 3 54 27 W 1 .2 7.8 85 .4208 OU 60 75 SE 3 54 27 W 1 .5 7,9 94 .6208 OU 100 115 SE 3 54 27 W 1 .8 1.8 76 .6 . , . . , . , , .209 OU 0 15 NW 3 54 27 W 0 .4 7 .9 100 .8 . . , . , , ,209 OU 60 75 NW 3 54 27 W 0.4 8,0 91 .0 . . , . . . , , .209 OU 100 115 NW 3 54 27 W 0 .4 8 .0 94 .5 , . . . , , . , ,210 OU 0 15 NW 3 54 27 W 0.9 7.8 155 .0210 OU 60 75 NW 3 54 27 W 0 .8 7 .7 94 .3210 OU 100 115 NW 3 54 27 W 0.8 7 .8 86 .8211 OU 0 15 NE 3 54 27 W 0 .6 7 .7 89 .4211 OU 60 75 NE 3 54 27 W 0.8 7 .7 89 .6211 OU 100 115 NE 3 54 27 W 0 .3 7 .9 62,0 , , . . . , ,212 OU 0 15 NY 31 54 26 W 1 .3 7,6 97 .1 . . . " , . " "212 OU 60 75 HW 31 54 26 a 0 .3 7 .9 68 .2212 OU 100 115 NW 31 54 26 W 0.9 7 .7 78,2 . . . . , . , . ,213 OU 0 15 SE 25 54 27 W 1 .2 7,7 100 .5213 OU 60 75 SE 25 54 27 W 0.5 7.8 89 .5 . , . . , . , . ,213 OU 100 115 SE 25 54 27 W 0 .4 7,9 73 .7 , . , . . , , . ,214 OU 0 15 SE 26 54 27 W 0.6 1.8 97 .9 , . , . , , . .214 OU 60 75 SE 26 54 27 W 1 .0 1,7 74 .9 . . . . , , , , .214 OU 100 115 SE 26 54 27 W 0.5 7,8 69 .5 . . , , , , . , .215 OU 0 15 SW 25 54 27 W 0 .3 7 .9 66 .8 . , , . . . , , ,215 OU 60 75 SW 25 54 27 W 0 .8 7 .7 71 .0 . , . . , . . . ,215 OU 100 115 SW 25 54 27 W 0 .4 7 .8 61 .0216 OU 0 15 SW 25 54 27 W 0.8 7 .6 72 .7216 OU 60 75 SW 25 54 27 W 0,8 7 .6 64,5216 OU 100 115 SW 25 54 27 W 0.4 7,8 55 .9 . . . . , , . .217 OU 0 15 NE 23 54 27 W 0 .4 7 .9 68,0217 OU 60 75 NE 23 54 27 W 1 .3 7,1 43 .7 , _ , , . . . . . .

UO
'00
rODVV
~1
~V~VON "
-1)
pi
r.j~jva
1,)t)
pi
I'ara
roJ-
roJ-
rpJ
roJ-
LA
VI
UI~
CACAabaA
~.aW
i.JlWW
!N."1
~~N
n)N
r;N~NNN
~JN
!JOo
O~O
-~o
.~p~
p~p
a~Dco
OO
p~pV
ffs
a-o
o~UIo0o
oO
~O
t--N
Tm
coA
coCDN
OO
aaom
nli.>w
r-`-o
CAo-a
~o
~v
Z
'~
C4+rJ
t"WWW
r..)rJW
CNrJ
r-WA
rJ
rJ
(.J
rJ
rJ
ArJW
WW
CnW
OTV
C"+pOVOAVVPWaNP
[D
tJCA
.O
~O
Z;;W
4.rW
WP
p0WA
CDA
1"-`TO
.p
'
caoooooC=booC
:)ooC
:~ooooo00000000000o
C=3ooo000000000000
C3CZ)CmooC
:)C:
)C:
)c
cc
cc
cc
cccccc
cc
cc
cc
cc
cc
r-c
cccc
cc
cc
C=cccccccc
cc
cc
cc
cccc
cc
4--
oinooooC`~npooo~~+lGOOO~ooooocnooooinpooovloooocnGOOOinocooCnoooocnopp
c
p.W
r-.N
pOTW
rJ
`O
OPW
`-`rJ
~OUPW
N~O
OPW
rJ
pOT
C.W
IJ`OUW
r+N
.pPW
rJ
`OUP
41N
~OT
oocnoooocnooopcnooooinoooorlcoooisopoccnpoooinocooiooo
o~nooooni
r °s
Lnul
crl
ulul
encn
ul!n
enrn
cnEn
cncn
encn
cnul
cncn
ulEnM
cnul
cn!n
cntn
cncn
unLn
cnCn
crl
rncn
Enul
crn
vlcn
Lnul
cncrlvlW
crlcn
crlz
ss>zsssac+cgssssss=ssg,c=scs
>ti`csssscsscssssslcscssgcscss==s=m
o
....
.-
.--
"--
~-
" --
"-~r-
"-~-
"--~-
...
r--
.--
t-"-
"~
" --
t--
"--r-
"--~-
"r"-"
r-
" --
"--
r--
"--
" --
r--
"--
~--
"-"
.-
r--
.-.
~--
rJ
a.c.aAAAaaaiaaaaaaaAAaaa
..~Aaa
,aaAA
.aaaAAa
.aAaAaaaaaAaaaaAaaw
Cn
Cn
CJI
CA
CnCA
Cn
CALn
CJiCACn
Cn
Cn
Cn
Cn
LnCn
UI
CJlCn
CJl
CllCn
CllCn
UICA
CA
C11
VICA
Cn
CA
C!1
C11VI
UI
CJI
Ul
CnCn
CIICA
Cn
C71
CJI
Cn
CA
CJlCn
C11
rJ,VI
m --1
AAAAAA
.AA
.AAAAAaAA
sAAAAAaAAAAAAAAA
.LAAAAAAA
raa
.sAAAA
.A
.LAAaa
-0'
NN
rJ
!JN
rJNN
A)
fJ
IJNN
rA)
rJN
rJN
r`]f".)
1JNNN
rJNNNNNNN
rJ
rJ
rJNN
rJ
fl.)N
rJ
rJ
rJ
rJ
rJN
rJ
rJNNN
tJ
rJN
fD
OO
CY]m
COOD
CO
ODCO
OD
COWW
Rl
t7DW
00
OD
OOOD
OO
CD
CO
CD
CO
CD
C7000
COOD
CA
~D
CO
OD
CDOD
l7DCO00
~OOD
CD
C1DW
OD
C7DCDW
00W
t]DW
CpV
.'O
SS
yCSSSSSSSSSgSSS
iCSESSSSSSSSSSSSSS
>ESgTSgSSSgSgSSS=SgSgg
S tC
.-~oA
C.r
rJavAwwaya
...N
cnNW
.fw
cnww
rJa
cn~'
cnPATy
vl-o
LnoP
LACAo
CAPy
o-~
o-oPy
C)Po
oPcn
oPv
IJ1--
1 1r m n
o~o
.-m
inwm
CAivAo00
-9.ow
.arJa
.--mNs
oCAT~
CACAAo
CAo-
cnoo
rJos
.:o
-oT
~o00o
r�1inoAAA
tnA
1 1 1 1o z ~
CoD r H
VyVyVVVyVVVPVVVy
VVyVyVyVyVyVVyyy
VVVVVVVVVyVVV~lVV
VVyVyVPaOrJWWt-'rJA
AW~`0AANNr~NANOOr+C.n
P"A.aA(nwwAuCA1sCAO,Avo
(nLnaU)~~p.D~(nppvPp,P1 1 1 I 1 1
~ 2Y H '-<
0 'tl^
rUl
Cn
TW
WPa
t--
r-WW
r-
rJAW
_aV
r~
.OON
aOpOVWWp
!JP
.pCAOW
~D
U1V
`0WVPa
f-.P
CATO
r+
CACAPOOwaPO
~`
CA
VITO
r.V"T
r+W
NOVpa
~Oa
CO
NWV
"aP,
.bIJVNT
CAW
9DAaapr
p,O
CLW
~O
LnCG
CO
OP
Q7O
FANa
.LAp
OPOWWP
I 1N O U3
D
2D
mn
iZ'
>~d
co
.AN
("WOVGwV
C-+
rJVy
rJWWW
'JWWA
'JOD
O~-
`.-
+rJ
co
OP
OOOOOOOOOOGOOGvOOGOO
c?OpOp
"O
c~OpOOO
r+O
NO`
CD
t"V
~O
r+
CAW
cowW
CArJWW
`O
1--W
CA
OP1-~
CA
CAO
CAo
t-'CAVAp
Nrpi
t+w
AN
t+
,.rW
rJ
4JrJ
N!JA
r+Vy
VITT
OC1
DVAN
VICDWWA
r`N~
C11
OLn
.~/V
rJa
t-.TOV
.pCA
Vm
~pr+rv
(~"nv
Cn
O-A
Cn
.pr~w
CA~`NNW
Cx)
`Cl
`ClrJVWA
coT
rJ
+p
c.l
__
rJr
N`+
N~-"!J
~`-`r+~
rJ
JN
r.)
C"
1N)
aAy
OfJr...t"
IJy
-O
f"JO
`O
rJ
CAWa
.pW
C"J
OCl
r~+TTP
p]H.
rJ>
PCD
CAV
CDW
OP
`G
G-A
p.A
CnCn"yA
CA"
4J
C.lA
Cnya
!JlOPV
Cn
LA
OUl
OT
C1Ty
`pA
EnVVT
Ln
Ati
.pwWWW
Cn
C.WW
3LtJ
:11W
C4W
C,WrJWW
rJ
rJ~WWWWWWWN
PJW
!.l
f+P
C.1
V`
CO
`Ow~
rJ!JWWW~
'~OtJ
OPCn
.-"NV
'17
O~yV
rV>
~--A
OP
CO
~--
CO
P4+.-
rJ
Pa
9-rJ
rJww
Ln
"-
NsP
waN
tV
rJaT
CA
CnvPvmmwy
yamv
opo
-ao
.-W
aocov
rJo
ao-ow
~o.o
aoN
.a~o
~ow
o-ul
.--
~,l
~orJVo
Nw
...CA-om
"oo--owc
.w"--mCnv.-PrJ
~cn
.o.---oo
.--
.o.a
CAmorJ
COut--
VCn
t+
tllN
CJIVANWPP
rJ
4+
rJU.
PJHvN
CJINamv
`ClNNa
t-JWWv
CA
ovwv
rJ~
CA"O
CAmWa
c"+w
-Awy
!4ov
coo
"y
vto
CA.-
-v
.--o-
.--
rJo
~0
.OO~yWONP
t-'
.~
C.1rJN"
rJWAWA
AA
CAWVWW
Cn
CD
1-+W
NrJ
Ty
O W W
yV
O]W
.taA
00a
WCn
4/NNW
pWWW
~O
!~+
.Wp
1"~
1D
1
D CH
bm
Q~VWA
#,,)1"OW
~ClAOAAA
.pAA
~O
."O1 1
ll
T
I~
_
Oa
t-.
1--
rJrJ
tNr
r+
~CA
V~TaA
"'
rJO
1`J-0.
.`
..r+
rJ
.p
NWy
!J
G'7
1!T
lT
WUI
wr
r~
C-
(r
CJ,
p,
tll
"1
C7O
V)
(,.t
Op
a`O
.I4
+J
'OoT
Lny
p.
1--
Ir
Im
,z
aa__
wwNww
rJw
4J
PaWw
"owN
PJw
Ln
1D
O`O`OV~OrJ U`O`OrJCDO rJWrJOT
CO>O
I rr+a
OPa
4d
CA
cnaW
C.1
~Ow
ppCn
Wr+
~-`~p
i ,T
.OOO
.-"'OOOO~O
c~OO~JOOO
,....
1
PCnUW
CA
`OVV~Aa
CAyN
C.l
!,nCn
OPp
1 1
r70 f.l
1S
CA
NI~JNWWWW
FJWWN
PJ
rJw
rJN
rJ
t-JrJ
_iO
O
aCD
OPA
CJI
tJO
CC)LnW
OT
'-OWW
OfJP
~O
.L
1S+
l,
m,
zCO
CAPw
o-
Coom
rJPv
ro
--ONPTy
-O~
1m [Jl
cn-oApaa
cno
rJ-o
cncn
rJom
ula
rJA
1 1D
w4+y-ovw
.a~
.--oPo
cooPa
o.rJCnrJ,
....i ,Cn
WNN
VI
C11Wat
CAW
rJWaya
[..~WwT
.
1o
1A
1c 2 m
4+A
-oCD
.--
CAv~m
-o.--
.--a
rTyo
rJa)a
IJ
c,7
wN
.--rJN
!.+ti
~-N
rJw
~-
--
rJrJw
rJ
1--wwN
.--
.--ww
rJ
rJwT
cn
cn
.c.
cnT
cnAa
cnTPP
cnP
CTl'J
Cn
UTw
~lrJ
CACnW
4.1VO
Q-CnV
lUl
"rJ
rJ
AJW
-OrJAy
~O4+
_n
P-)y
rJ
COW
4d
r.)
CAA
rJCAO
C"!
.nLn
CAV
ODUP
CP
!~r
-OW
OO
ppO
.t~O
.~
JsWO
COWWN
CA
tJOA
r-"
CU
CO
fJ
C-1w
rJA
l>
to
.tsyOo
rJ
cn
~T
cn
cnTP
CA
Cno-P
7J
.--
~WOD
CD
r~J
.LV
Go
O-
CO
Cll
r+O
~paO
`-`
CO
tJ Cn

fJ
IJfJ
rJ
rJ
rJI
rJ
rJ
rJ
r4J.)WrJ
rJ
rJ
PJ
fJ
PJ
f WJr'WWWW
'E'4-~
rJ
rJrJr
;!J
fJ
tJWrWJ
rJ
r'J
rJNN
rJ
;.;
rJ
rJ
rJ
ff. :J
1'.)
rJ
ItJ
f.]N
mW
WW
-.4
tJ
WL.l
L.J
WWWW
WC-!W
WtW
CJ
"(
tJ
JrJN
JfJ
r.7
HUUUUU
LA
C .nC
.11LA
LrlA
3+raa
`+.C"J
.JC
"J(.J
[JN
t"J
.JC"JW
[.J
CA
f,)rJ
rJfJ
fJMM
f'-`
f+
1-"r~d
._.
.t7J
"O"4
'-O
..O`O
CO
R7
^irn
LmOOoOpoUpp
r.3ppo
r-:)p
r~o
f"~op
rpop
r~j
r=,CD
1:nu
(~u
1~o
t=Co
:>-7
IDu
L0lo
r--
._CCCCCCCCCCCCCCCCCCCCCCCCCCCCC
r=C
r=C
r_CCC
1_C
r-C-
C7
'-O
0,
!`OPW
~O
O-
CN
'"OUW
"OCUW
r_"
<"O
fr
1>;
`.O~
1.-J
"--O
Cr'CN
"-
.O
p.
.~Od
tnOOp
c~
f.nd
._~GU
UIGd
~O
rJldG
CG
c~VIp
>..
;r_nr~
?O
a?
tn~
.c'
7(.n
fJ
"OTW
N-O
CJ"W
"-'fJ
`OPW
"~
rJ
~!JCP
C"J
"-'
rJ
'~Oo"W
tJ
'.O
U-
r"M
rJ
"Of,nWM
1+)
"O
IT
C.J-
rJ
"Oq
rJvOG
LnGdd
<?
LnpO
c>O
r,.nOGG
rJ
Ln
c?OGG
r..n
":~
"DO)
c.n
.,_O
r.~d
C.nv
a?d
C~
c.nd
r~
g
..f)
If)tn
(>7Ln
(n
U"J
J7
f)']
rJ)(n
tn
(n
t17n
I1)
(JyIn
rf)
rJ'1
rn
tn
rJ]rn
rn
rJ1rn
trl
tfJCn
r_r1
tn
nrf)
..,
r!)
tL~s
>C
ta.>_~
>rSs
>~S
><
T~g
magL
.Eg
*=S
71:sgg
iCg
37-=
:E:::s
IC
>_
'sS
tC
J=
a-.s
E-Y:
"-r
r;J]
.J~AaAAAaAAAYaaAaaa
.vaAaAA
.4A
.LAAaY>AAAAAYAAAd
.4
m -1
rf
CnLA
(.n
t71CA
(jl
cul
cnCA
Ln
CJ7
VI
VICn
uls
cnLn
CAcllLn
r_ .ntn
LnLA
cnrns
Lnr
nLn
r .nCA
f .n
I:n1
ulr_ncn
AaAAaa
."sAaAa
.LaAaa
.LaaA
.LAAAaaa
.a
.~,a
.GA4A
.4
.4
2n
.L
.4Ay
.LA4
T
rJ
r'JPJ
fJrJN
rJ
rJ
rJrJ
rJ
r'J
r'.)
rJrJ
rJ
rJ
tJ
fJN
fJ
r'J!J
r'JrJ
tj
rJN
r,.)
tjN
rJ
tIN
rJ
PJ
I. .J
r~)
rJ
r.)
f.)
f.)
-al
r0
ODCO
CJOCD
CO
Cp
tA
CO9D
COOD
C10
00
CC)CD
Cp
S1D
CD
fp
rTlWW
CA
CO
toID
ODw
00
CO
CO
CO
CO
CO
C'a
1:0rAt
.0~Coca
K-.) rr,
sssss
Jsss
>Lsssgsgssss
>isssssss
»=ssss
acss
J=~-ssss
ar:
m s
1f+,
r-c>c
"-~dM
Mo~M
r--rJ
~-"-
.JM
.'M
f.~l
1~JM
~~WW
Ln
rJc
fJw
tnr
._M
r,M<
MJGM
.-"rJY
1m
n1
r'_
.Ja
iNcn
'oCO
rJr-n
-"JIn
c.lnIAa
tn
ou
CAM
i_n
"--
"J~J
rJAd
<~v
CDrn
rJ
rJA
fJ
"o"u
r+
'-JAV
'.JANmW
1 1O 2
u)="
r-
V~l
'~l
12
S.J
rJrJW
tJ
(.J
r.)
"-`
1'JWaWWAAa
rNfJAAAA
C.JAW
rJrJ
Or+~
f.)
a-"
O%:A
C.J
fs.J
~~
fl.A
.L-A
t1-<
1O
1-'-"
fJ
f.)A
P'~lCAW
VI
'J~
'-O`JV
(JIO
r.JN
r)
rJ
a>V
O"P
CD
'+7
_
r-"
IJ
.OpN
Uw
JIP
MW
"OWJ
'-JV
.a
S"1
h7A
'"J
'1
fN
r_"
1_q
r .nA
CD
'O~ .
Jd
7a
CllVIV
r~
O-
Cp
'".J
n! m
:1)A
r.-"O
"rn~
r-
'"O`J
rJ
~J
1~
Cn
1W
L.nV
P)
MLarn
r+n
OU
P.:
1
~,.
."G
LnU
r~c~fJ
1 I 1N O
-n^ D
-CS
"(T
Ic>
. .MM
r_JP
r-,_aO
"W
'-A
WM
~l
LnA
1'."
.Jtj
~J
V7
COA
CJOP
(.J
GJA
Ca
r+
1-'fN
rTLO
fr!
e.?a
f.r.ca
^J
~"1~
r1)
jyti
t-r
D-T~
1~
I:n
r~iO
p_
fJlV
-O
~AAUP
rJ
fJ
""n
~J~J
LnY
_ G'O
Cn
1.~
s.Ln
M"O
P_
.4
"'+Ly
PO
1"...
;o
...J~'
41P
-J1
Cl1
r..9
`f!LAQ
CA
1-`
oYW
Q7A
AW
lilW
Co
~J
II"
DJ
dd
rrl
r-
Ln
f.J
r
`O
Cll1J
'MI"
L.JFJ'
~O
"-.Jtj
~J
r-"
r.)
WLnr
"]CJ
~'J
rJ
"::J
r)
t V
j j
T"
C Dr~7
I.,J
fJA
fJ
"+PJ
S.JAH
r~
..,a~
.4
iJl
.aJCAW
.LL
Q"
LJw
!~M
WrJ
b+
PJ
"OA
(.JY
tj
DJ
rJpJ
."_
O1.
"rJ
rJ
Snr7
rJlf-.Jr+A ""Jc7 A f.0177'.OOZ .JWSnM r.)
'"J J
Mr.
JcoM
tn
I-o
fJCJYM
1:0CA
rA
fyrJ
+PJ
t.J~ .J~ Pi 1f?7
_-T-J
r- -
1r
"rn
zLT.(J) PWMLn'-JPr-~. p.P(JIr-J
r.".A
U.1" rJOIJIO. COaMCOr+fJ I-J"Z'fJt+J'vI-n"-"
CO ~OLnrJv7 LJM ia
Or'
Jr~MYA
c_A
l.l00
CAO
"f!
"-`
f.J
'riJ
"OA
CD
(_ntj
Ln
.Jc~
!_n
_..
1_.n
t"J
f.J
~J
1 I
OOt-d
".>
O~
NfJ
CdFJa
FJ
tj
fl)
r+WI
rJ
rJ
f"J
Lq
rJ
-fJCJrJG
rJ
fJ
..
.r;1"
tj
I'JA
."
tj
YOAfLJI4iJ
~.f
"I
..O
.a
Ln
IrV
-LY
Ln
j 1
[.J
rJrJrJwA
!-1pJW
I~J
rJ
rJ
rJ
-J
Crl
(.n
rJM
,..o
r..
~ :r
!a
Co
fJ
rJA
rJ
vroJ
1f"
rJIJNY
tJ
~rJ
.r
(.o
r .nVA
W.La
fJ
h)
.-"
rJ
rJ
r.,
rJ
rJ
F.l
f.J
fJ
~"1
'L-
t,rCL
r"
~N
fJ
":"1
L1
1~.J
"1
w
'
.
r)
mISw
;o.4
"A
r_]
IJ
rJ
(.if
" J"
r~
.rJ
1r-
n
IrJ
""J
"".Jw
Lrl~1
f-J
'+1
VI
f_n
CCr
~lP.)
U)
r_~
f .U
rA
~J
.-.
IJIN
"J()
:1CD
C.n
FJPY
rJ
l_n
.-
~lCr
r+
:.1'nL
r.J
f.J
-.1
~J~
I I1"
SNw
:.JMM
fJ
.Y-
:".JW
L .JM
iFJ
_4J
1.-.
.f.)
C.J
LnM
a]
LnV
f.(7W
r-a
fJ
fJl
r_n
'.r
"'_rJl
t-JVfJP._Ir-'1 I 11].L
r :Z
wV
-OW
C~
~`
"-~
Lrl
'"1a
r,J
.4
r.n
-O
rA
S.n
'V
"'~
LJ
.la
..1--.4UP
C.!
'~J
Vl
~.a
.4
-01.JrJ
'1
UIO
u.I
-1A
y"-I1 ~1
r~l
NfJN
.'~J
fJ
C.J
f.J
.--
'
.O
J:"AP
~J
"OPJ
r.fN
r.n
+"O
fAW
1-J
r"n
L'n
O_>
r~J
r.J
r~".L
:n
".J
rJ
rO
rJ
Ln
-J
CL
1n
`-1
1.!
7~
Ixl
1;LJ
.->IJ
!J
rn
f.J
Js"
LO
"Op
.C"WA
.4
1
r .JNGJ"-"JC"J "u 1.4L " JLO1_n Cl-'OS"J
r-"
rJ
CA
-AW
J n"
C"J :n
CJ
".--
.:f
JIJ
~+
IJ
IJ
tJ
"-'PJ
f.)
I~.,
1 1 1 1S
~O
.O 0

Appendix F
GUIDES FOR ASSESSING SOIL SUITABILITY FOR AGRICULTURE
Definitions of the Agricultural Capability Classes
Class 1
Soils in this class have no important limitations for c rop use . The soilshave level or gently sloping topography ; they are deep, well to imperfectlydrained and have moderate water holding capacity . The soils are naturallywell supplied with plant nutrients, easily maintained in good tilth and fer-tility ; soil are moderately high to high in productivity for a wide range ofcereal and special crops .
Class 2
Soils in this class have moderate limitations that reduce the choice ofcrops or require moderate conservation practices . The soils have good waterholding capacity and are either naturally well supplied with plant nutrientsor are highly responsive to inputs of fertilizer . They are moderate to highin productivity for a fairly wide range of crops . The limitations are not se-vere and good soil management and cropping practices can be applied withoutserious difficulty .
Class 3
Soils in this class have moderate limitations that restrict the range ofcrops or require moderate conservation practices . The limitations in Class 3are more severe than those in Class 2 and conservation practices are more dif-ficult to apply and maintain . The limitations affect the timing and ease oftillage, planting and harvesting, the choice of crops and maintenance of con-servation practices . The limitations include one or more of the following :moderate climatic limitation, erosion, structure or permeability, low fertili-ty, topography, overflow, wetness, low water holding capacity or slowness inrelease of water to plants, stoniness and depth of soil to consolidated bed-rock . Under good management, these soils are fair to moderately high in pro-ductivity for a fairly wide range of field crops .
Class 4
Soils in this class have severe limitations that restrict the choice ofcrops or require special conservation practices or both . These soils havesuch limitations that they are only suited for a few crops, or the yield for arange of crops may be low, or the risk of crop failure is high . The limita-tions may seriously affect such farm practices as the timing and ease of til-lage, planting and harvesting, and the application and maintenance of conser-
- 101 -

vation practices . These soils are low to medium in productivity for a narrowrange of crops but may have higher productivity for a specially adapted crop .The limitations include the advance effects of one or more of the following :climate, accumulative undesirable soil characteristics, low fertility, defi-ciencies in the storage capacity or release of soil moisture to plants, struc-ture or permeability, salinity, erosion, topography, overflow, wetness, stoni-ness, and depth of soil to consolidated bedrock .
Class 5
Soils in this class have very severe limitations that restrict their capa-bility to producing perennial forage crops, and improvement practices arefeasible . These soils have such serious soil, climatic or other limitationsthat they are not capable of use for sustained production of annual fieldcrops . However, they may be improved by the use of farm machinery for theproduction of native or tame species of perennial forage plants . Feasible im-provement practices include clearing of bush, cultivation, seeding, fertiliz-ing and water control .
Some soils in Class 5 can be used for cultivated field crops provided un-usually intensive management is used . Some of these soils are also adapted tospecial crops requiring soil conditions unlike those needed by the commoncrops .
Class 6
Soils in this class are capable only of producing perennial forage cropsand improvement practices are not feasible . Class 6 soils have some naturalsustained grazing capacity for farm animals, but have such serious soil, cli-matic or other limitations as to make impractical the application of improve-ment practices that can be carried out on Class 5 soils . Soils may be placedin this class because their physical nature prevents the use of farm machin-ery, or because the soils are not responsive to improvement practices, or be-cause stock watering facilities are inadequate .
Class 7
Soils in this class have no capability for arable culture or permanent pas-ture because of extremely severe limitations . Bodies of water too small todelineate on the map are included in this class . These soils may or may nothave a high capability for forestry, wildlife and recreation .
