kuanjin lee, liam wotherspoon, simon nelis and jennifer ... · kuanjin lee, liam wotherspoon, simon...

1
Kuanjin Lee, Liam Wotherspoon, Simon Nelis and Jennifer Eccles. REFERENCES Edbrooke, S.W., Mazengarb, C. and Stephenson, W., 2003. Geology and geological hazards of the Auckland urban area, New Zealand. Quaternary International, 103(1): 3-21. GoogleEarth 2015, Auckland City Waterfront, Viewed 19th October 2015. The original coastline along the Auckland CBD waterfront has been progressively modified. Reclamations began in 1859 to provide additional land and deeper harbours for a growing population and trading port. These fills are highly variable comprising a range of materials including hydraulic fills, construction waste and East Coast Bays Formation (ECBF) rock fill. Due to the variability of these deposits, traditional methods of characterising the seismic response using Cone Penetration Testing or Standard Penetration Tests can give misleading results. These methods only sample a small area and lack the ability to capture the inherent variability of reclaimed fill. Improved understanding of the dynamic behaviour of reclaimed fill in response to earthquake loads will assist with future land use planning, seismic design and retrofit. This research used subsurface investigations, the horizontal-to- vertical spectral ratio (HVSR) method and surface wave testing to characterise the waterfront area. HVSR was used to estimate the site period and relate this to the depth to rock in the region, while surface wave testing was used to define the shear wave velocity of the different stratigraphic units. o At a reduced number of sites, MASW testing was performed using 24 equally spaced 4.5 Hz geophones and a 5.4 kg sledgehammer as a source. Using the same array, P-wave refraction surveys were conducted to establish groundwater depth. To produce a ground response model for the reclaimed land in the Auckland CBD using a compilation of geotechnical, geological and geophysical data. To achieve this, the following targets were set: 1. Understand the history of reclamation and sub-surface geology from historical ground investigations to provide constraints for the surface wave testing. 2. Estimate the site period across reclaimed areas using HVSR. 3. Undertake Multi-Channel Analysis of Surface Waves (MASW) testing to define the shear wave velocity profile in the different types of reclamation fill. Fig 6. Assistant swinging 5.4 kg sledgehammer onto perspex mat (red) on a metal plate to reduce frequency upon impact. Perimeter around testing area is bounded by danger tape. Photo taken at Victoria Park. The HVSR was used to try and understand the response of the soil profile above the ECBF. However, at some of these locations the period measured may not be the period of the overall profile down to the ECBF. In these sites, investigations produced a lower bound estimate of the natural period of the soil profile, rather than the natural period of the overall soil profile. For highly layered sites this may not be appropriate. MASW testing and processing is necessary to constrain the layering characteristics and provide a baseline to estimate the average Vs over a given depth. ACKNOWLEDGEMENTS Gratitude and thanks go out to the following for their support and aid in field investigations: André Bellvé, David Elliott, Jamie Lai, David Bevan and Shannon Hawkins. For their patience and sharing of expertise: Simon Nelis and Liam Wotherspoon. Additionally, thanks to Tonkin and Taylor Ltd for allowing access to their borehole database. o The HVSR peak and subsurface investigation data can be used to estimate the average Vs of the material above an impedance contrast. o HVSR site periods maybe recording the response of the layers above the ECBF or above a shallower impedance contrast. o Ongoing research is required to achieve the objective. Presently, further testing and data analyses are underway to aid in a more complete dynamic characterisation of Auckland CBD reclaimed soils across the reclamation zones. Ongoing research includes: o Continued collation of historic subsurface investigations. o Supplementary HVSR measurements across study site. o HVSR data is being screened as some of these peaks may be the response above shallower impedance contrasts and to further analyse records with multiple peaks. o Further MASW testing and processing where collated subsurface investigation data and associated P-wave refraction surveys will be used in the inversion process to constrain layering characteristics at each site (Fig 6). o Produce geological sections along the seismic lines and interpreted sections combining surface wave testing data and physical data. o Define the site subsoil classes according the New Zealand seismic design standards across the reclaimed land zones. o Compare results collected during surface wave testing with site subsoil classes for seismic design (as in NZS 1170.5:2004) and the implications for the design of buildings. Geologic Unit Stratigraphic Layers Broad Engineering Geologic Description Age FILL Construction Mixture of clay to gravel sized sediments with varying levels of compaction. <174yrs Hydraulic Loosely packed, fine grained, soft to firm cohesive soils such as very soft silty sand and clays. Historic Industrial Waste Recompacted clays to gravel sized particles and construction and building waste including old sea walls and building foundations. Excavated Rock Loose to very loose sands and silts excavated from adjacent ECBF cliffs. TGA Upper Soft to very soft fine sand, silt and clays. <10ka Lower Soft to very stiff silts, sand, clay-silt, peat and colluvium comprising weakly cemented sub- angular siltstone and sandstone derived gravels. 2mya 10ka ECBF Residual Soil Stiff to very stiff silts and clays. 23.5 16mya ECBF Rock Weak to very weak alternating sandstone and siltstone sequences. o Reclamations began in bays closest to the shoreline using local ECBF material from nearby headlands (Fig 2) e.g. - Commercial Bay, Brickfield Bay, Official Bay and Mechanics Bay used material from Stanley Point and Britomart Point. o From the early 1900’s, having depleted local sources, there was a shift to use hydraulic fill sourced from the Waitemata Harbour e.g. - Wynyard Quarter and areas of Britomart Transport Centre. o In the late 1980’s and early 2000’s, mudcrete was used to extend reclamations in the Viaduct Harbour and eastern areas of Wynyard Quarter. These fills overlie Tauranga Group Alluvium (TGA) which thinly overlie shallower depths to rock and thicken in paleo-channels (Fig 3). The ECBF is the underlying bedrock (Edbrooke et al 2003). Details of the stratigraphic layers are found in Table 1. Fig 2. Auckland CBD zones of reclamation, darkening towards present day. Historic sea walls (orange) and Auckland’s original 1840’s shoreline (red), bays (light blue), headlands (yellow), paleo-river/stream channels (white arrows showing direction of flow). (Base Image sourced from GoogleEarth 2015). Table 1. Summary of Geologic Units in Auckland City waterfront o 75 HVSR measurements were made using a 2Hz 3D geophone (Fig 1) to provide a shear wave velocity (Vs) estimate of the reclaimed soil profiles, and identify contrasts between adjacent reclaimed zones using Eqn 1. Eqn 1. = 4 COLLATED SUBSURFACE INVESTIGATIONS Subsurface investigations revealed that the reclaimed soils varied greatly across and within reclamation zones. Sites proximal to the 1840’s shoreline generally contain shallow (0 – 4 m) fill and TGA deposits. However, collated data and geomorphic cues denote ECBF incised paleo-channels up to 20.4 m bgl (Fig 3). In areas such as Britomart (previously known as Commercial Bay), the stratigraphy is highly layered and have sharp changes in both composition and stiffness relative to depth. This site contains assorted and intermixed layers of fill in thicknesses ranging from 0.1 to 4.0 m overlying Upper and Lower TGA and ECBF. PRELIMINARY ANALYSIS In general, the site periods correspond well to the depth to bedrock contours as site period increases with increasing depth to bedrock. In some cases, multiple peaks are visible revealing the response between hydraulic fill over TGA and TGA over ECBF (Fig 5). This zone was reclaimed predominantly with hydraulic fill which overlies TGA and EBCF. Northwest trending paleo-channels containing relatively thick hydraulic fill material (<8 m) and TGA (<17.3 m) within incised ECBF, HVSR measurements reveal an increase in site period with depth to ECBF rock. This is also evident in the Wynyard Quarter Northern extension (Fig 4). Where some measurements were taken at the southern border of the northern reclamation, two peaks were identified (Fig 5). Year 1840 1860 1880 1900 1920 1940 1960 1980 2000 Present Auckland 1840’s Shoreline N 500 m FREEMANS BAY STANLEY POINT OFFICIAL BAY MECHANICS BAY ARCHEON POINT ST GEORGES BAY JUDGES BAY ST BARNABAS POINT CAMPBELLS POINT BRICKFIELD BAY COMMERCIAL BAY BRITOMART POINT HVSR Period (s) A) B) FILL TGA ECBF A) B) x x Fig 5. HVSR over southern border of northern reclamation of Wynyard Quarter ( ), showing 2 impedance contrasts (x). Location in Fig 3. WYNYARD QUARTER 1905–1931 o CPT, SPT, borehole and laboratory test data were collated across the reclaimed land from historical ground investigations to develop representative soil profiles. Fig 1. HVSR testing set up. Photo taken on Quay St. Period (s) Period (s) Period (s) Period (s) HVSR HVSR HVSR HVSR Mean ±1 = 0.24sec = 0.3sec = 0.11sec = 0.34sec HVSR HVSR HVSR Period (s) Period (s) Period (s) Increasing depth to ECBF and site period Fig 4. HVSR spectral peaks. Locations in Fig 3. = 0.62sec = 0.56sec = 0.44sec Mean ±1 Mean ±1 Fig 3. Depth to ECBF and HVSR measurement locations ( ). Representative HVSR spectral peaks displayed (Images 1-4. Outlined area (dashed yellow perimeter on the left) is a case study: Wynyard Quarter 1905 -1931 (Images 5 –8). Base mage sourced from GoogleEarth 2015. N 500 m Auckland 1840’s Shoreline Depth to ECBF (m) 0 2 4 6 8 10 12 14 16 18 20 Site Period, T (sec) 0 0.1 0.2 0.3 0.4 0.5 0.6 0.7 0.8 15 minute records were taken as this was considered an adequate length to clearly identify the expected period of the soil profile above ECBF in the area. Data was then processed using Geopsy software to constrain a spectral average at each location.

Upload: donguyet

Post on 27-Jul-2018

215 views

Category:

Documents


0 download

TRANSCRIPT

Kuanjin Lee, Liam Wotherspoon, Simon Nelis

and Jennifer Eccles.

REFERENCESEdbrooke, S.W., Mazengarb, C. and Stephenson, W., 2003. Geology and geological hazards of the

Auckland urban area, New Zealand. Quaternary International, 103(1): 3-21.GoogleEarth 2015, Auckland City Waterfront, Viewed 19th October 2015.

The original coastline along the Auckland CBD waterfront has been progressively modified. Reclamations began in 1859 to provide additional land and deeper harbours for a growing population and trading port. These fills are highly variable comprising a range of materials including hydraulic fills, construction waste and East Coast Bays Formation (ECBF) rock fill. Due to the variability of these deposits, traditional methods of characterising the seismic response using Cone Penetration Testing or Standard Penetration Tests can give misleading results. These methods only sample a small area and lack the ability to capture the inherent variability of reclaimed fill. Improved understanding of the dynamic behaviour of reclaimed fill in response to earthquake loads will assist with future land use planning, seismic design and retrofit.

This research used subsurface investigations, the horizontal-to-vertical spectral ratio (HVSR) method and surface wave testing to characterise the waterfront area. HVSR was used to estimate the site period and relate this to the depth to rock in the region, while surface wave testing was used to define the shear wave velocity of the different stratigraphic units.

o At a reduced number of sites, MASW testing was performed using 24 equally spaced 4.5 Hz geophones and a 5.4 kg sledgehammer as a source. Using the same array, P-wave refraction surveys were conducted to establish groundwater depth.

To produce a ground response model for the reclaimed land in the Auckland CBD using a compilation of geotechnical, geological and geophysical data.

To achieve this, the following targets were set:1. Understand the history of reclamation and sub-surface

geology from historical ground investigations to provide constraints for the surface wave testing.

2. Estimate the site period across reclaimed areas using HVSR.3. Undertake Multi-Channel Analysis of Surface Waves (MASW)

testing to define the shear wave velocity profile in the different types of reclamation fill.

Fig 6. Assistant swinging 5.4 kg sledgehammer onto perspex mat (red) on a metal plate to reduce frequency upon impact. Perimeter around testing area is bounded by danger tape.

Photo taken at Victoria Park.

The HVSR was used to try and understand the response of the soil profile above the ECBF. However, at some of these locations the period measured may not be the period of the overall profile down to the ECBF. In these sites, investigations produced a lower bound estimate of the natural period of the soil profile, rather than the natural period of the overall soil profile.

For highly layered sites this may not be appropriate. MASW testing and processing is necessary to constrain the layering characteristics and provide a baseline to estimate the average Vs over a given depth.

ACKNOWLEDGEMENTSGratitude and thanks go out to the following for their support and aid in field investigations: André Bellvé, David Elliott,

Jamie Lai, David Bevan and Shannon Hawkins. For their patience and sharing of expertise: Simon Nelis and Liam Wotherspoon. Additionally, thanks to Tonkin and Taylor Ltd for allowing access to their borehole database.

o The HVSR peak and subsurface investigation data can be used to estimate the average Vs of the material above an impedance contrast.

o HVSR site periods maybe recording the response of the layers above the ECBF or above a shallower impedance contrast.

o Ongoing research is required to achieve the objective.

Presently, further testing and data analyses are underway to aid in a more complete dynamic characterisation of Auckland CBD reclaimed soils across the reclamation zones.

Ongoing research includes:o Continued collation of historic subsurface investigations. o Supplementary HVSR measurements across study site.o HVSR data is being screened as some of these peaks may be

the response above shallower impedance contrasts and to further analyse records with multiple peaks.

o Further MASW testing and processing where collated subsurface investigation data and associated P-wave refraction surveys will be used in the inversion process to constrain layering characteristics at each site (Fig 6).

o Produce geological sections along the seismic lines and interpreted sections combining surface wave testing data and physical data.

o Define the site subsoil classes according the New Zealand seismic design standards across the reclaimed land zones.

o Compare results collected during surface wave testing with site subsoil classes for seismic design (as in NZS 1170.5:2004) and the implications for the design of buildings.

Geologic UnitStratigraphic

LayersBroad Engineering Geologic Description Age

FILL

ConstructionMixture of clay to gravel sized sediments with

varying levels of compaction.

<174yrs

HydraulicLoosely packed, fine grained, soft to firm cohesive

soils such as very soft silty sand and clays.

Historic IndustrialWaste

Recompacted clays to gravel sized particles and construction and building waste including old sea

walls and building foundations.

Excavated RockLoose to very loose sands and silts excavated from

adjacent ECBF cliffs.

TGA

Upper Soft to very soft fine sand, silt and clays. <10ka

LowerSoft to very stiff silts, sand, clay-silt, peat and colluvium comprising weakly cemented sub-

angular siltstone and sandstone derived gravels.

2mya–

10ka

ECBF

Residual Soil Stiff to very stiff silts and clays. 23.5–

16myaECBF RockWeak to very weak alternating sandstone and

siltstone sequences.

o Reclamations began in bays closest to the shoreline using local ECBF material from nearby headlands (Fig 2) e.g. - Commercial Bay, Brickfield Bay, Official Bay and Mechanics Bay used

material from Stanley Point and Britomart Point.o From the early 1900’s, having depleted local sources, there was a shift to

use hydraulic fill sourced from the Waitemata Harbour e.g.- Wynyard Quarter and areas of Britomart Transport Centre.

o In the late 1980’s and early 2000’s, mudcrete was used to extend reclamations in the Viaduct Harbour and eastern areas of Wynyard Quarter.

These fills overlie Tauranga Group Alluvium (TGA) which thinly overlie shallower depths to rock and thicken in paleo-channels (Fig 3). The ECBF is the underlying bedrock (Edbrooke et al 2003). Details of the stratigraphic layers are found in Table 1.

Fig 2. Auckland CBD zones of reclamation, darkening towards present day. Historic sea walls (orange) and Auckland’s original 1840’s shoreline (red), bays (light blue), headlands (yellow), paleo-river/stream channels (white arrows showing direction of flow). (Base Image sourced from

GoogleEarth 2015).

Table 1. Summary of Geologic Units in Auckland City waterfront

o 75 HVSR measurements were made using a 2Hz 3D geophone (Fig 1) to provide a shear wave velocity (Vs) estimate of the reclaimed soil profiles, and identify contrasts between adjacent reclaimed zones using Eqn 1.

Eqn 1. 𝑉𝑠 = 4𝐻

𝑇

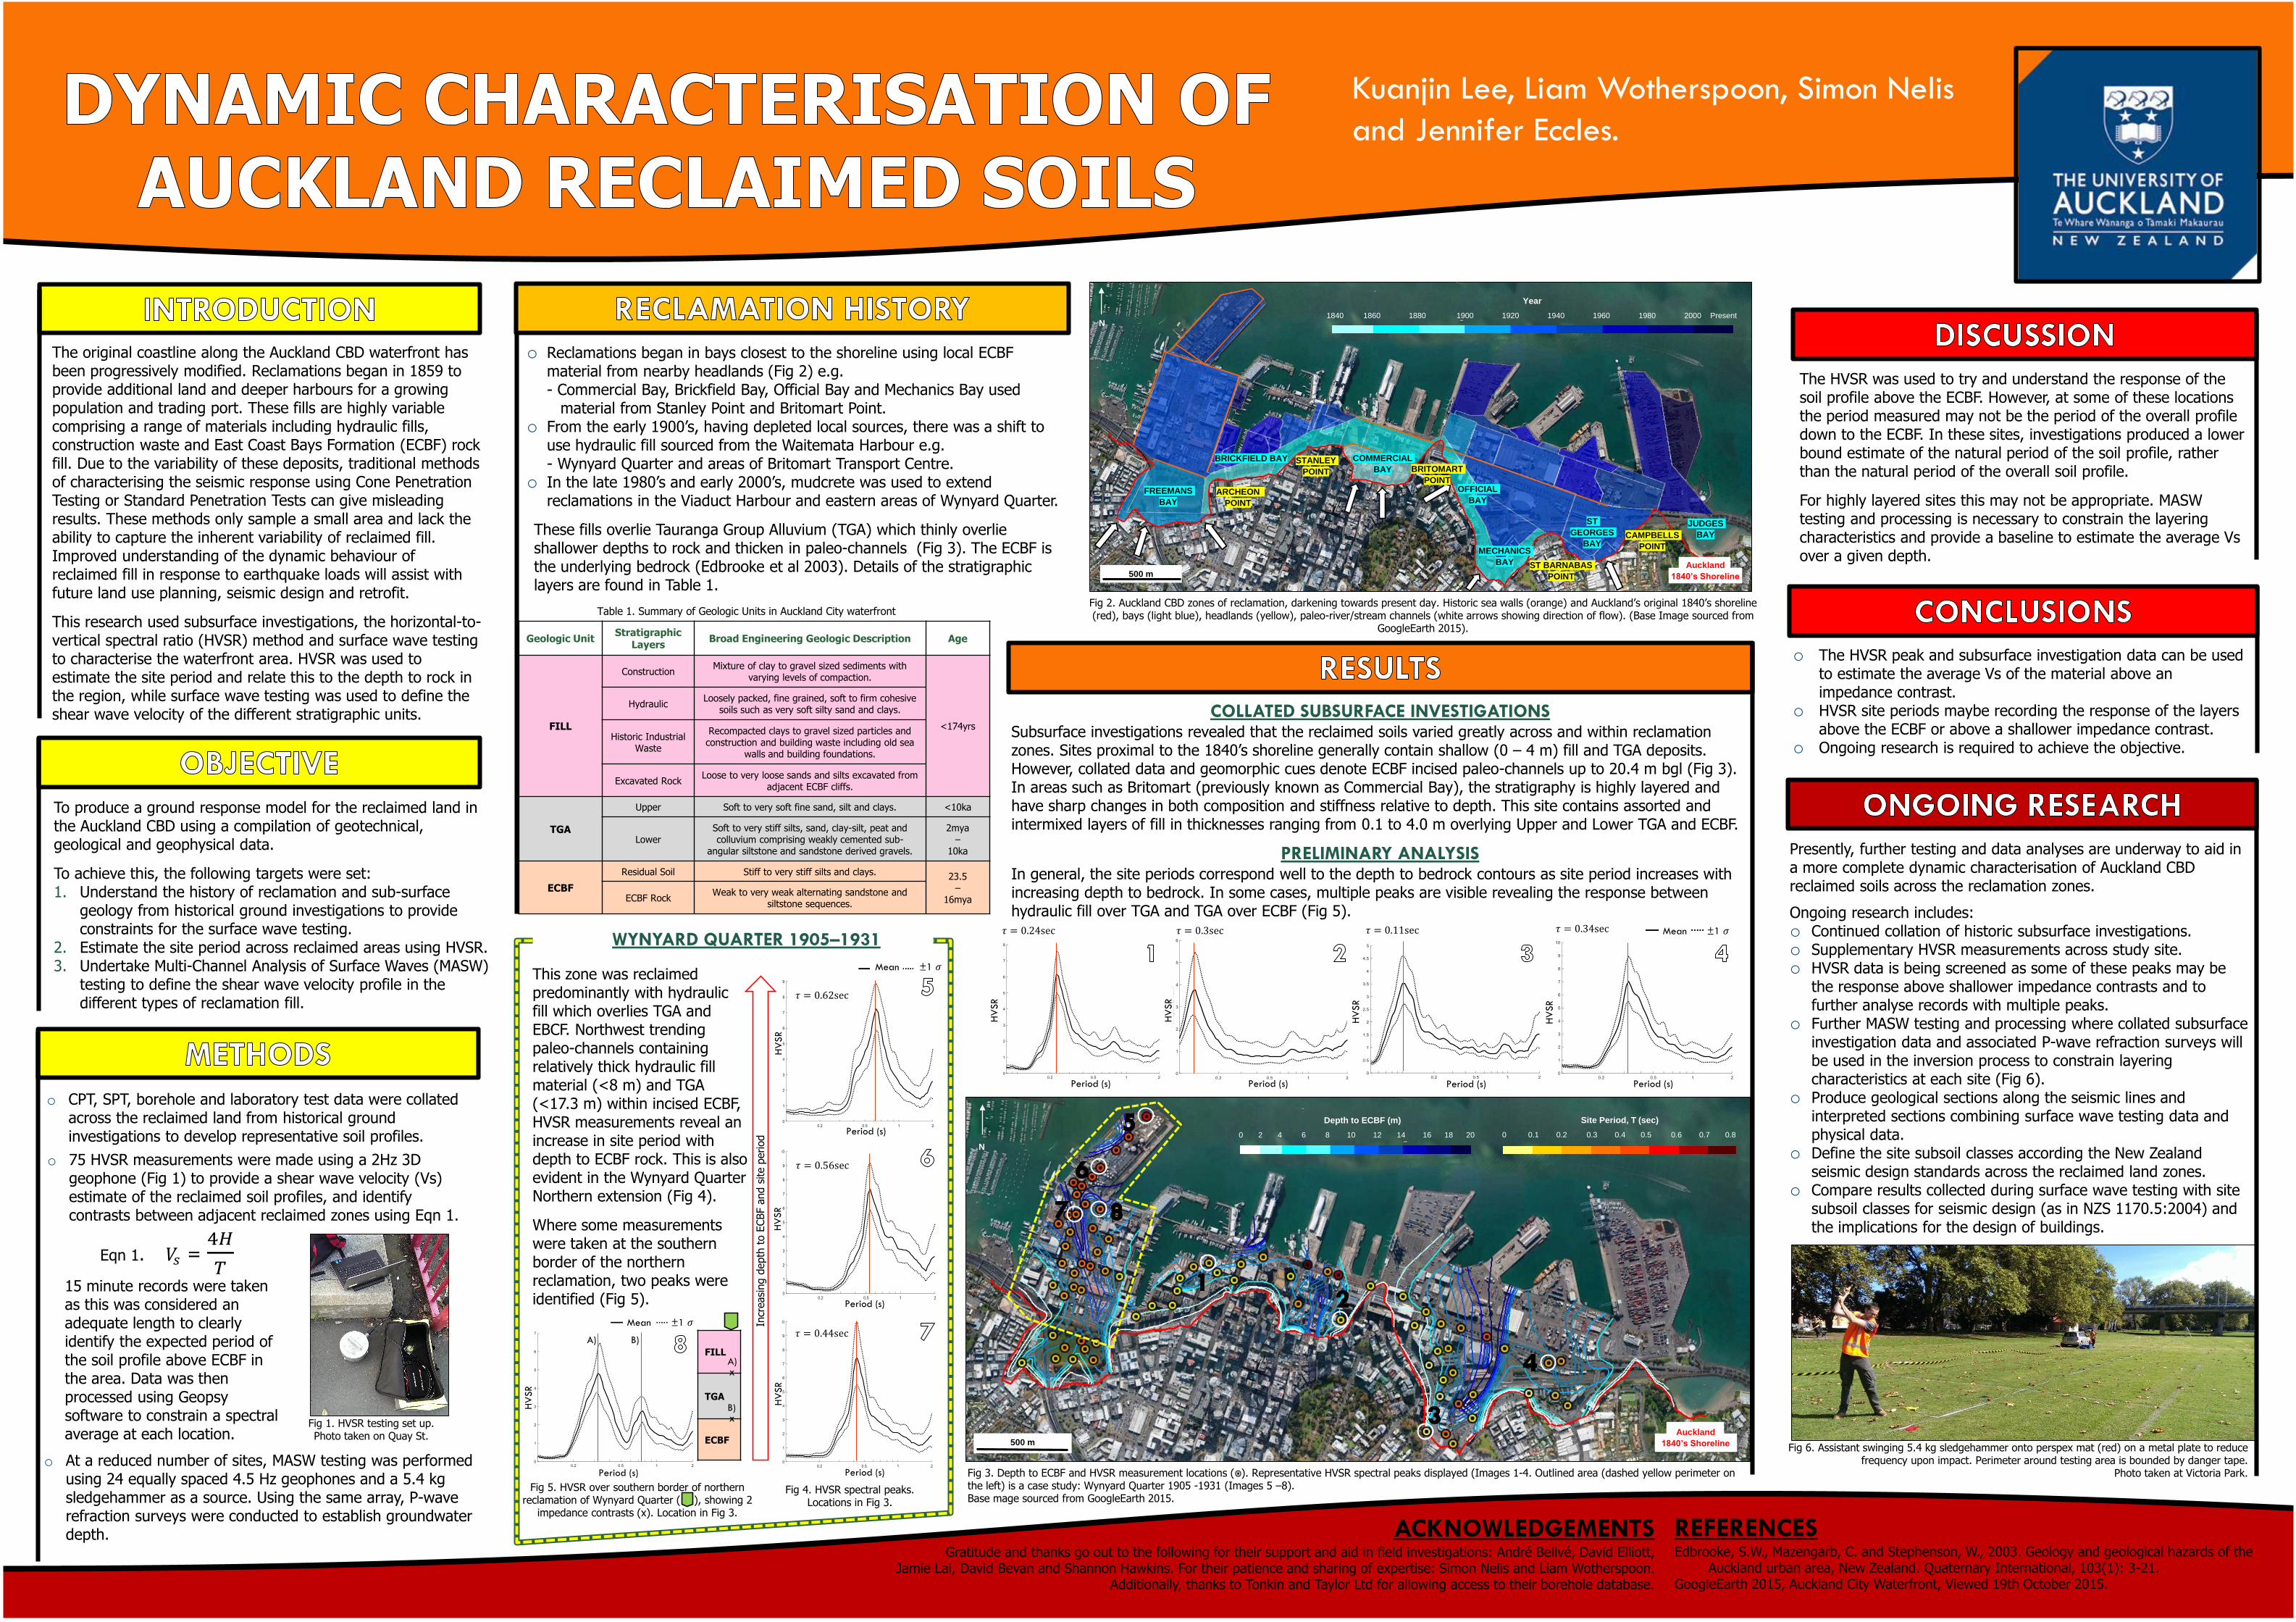
COLLATED SUBSURFACE INVESTIGATIONSSubsurface investigations revealed that the reclaimed soils varied greatly across and within reclamation zones. Sites proximal to the 1840’s shoreline generally contain shallow (0 – 4 m) fill and TGA deposits. However, collated data and geomorphic cues denote ECBF incised paleo-channels up to 20.4 m bgl (Fig 3). In areas such as Britomart (previously known as Commercial Bay), the stratigraphy is highly layered and have sharp changes in both composition and stiffness relative to depth. This site contains assorted and intermixed layers of fill in thicknesses ranging from 0.1 to 4.0 m overlying Upper and Lower TGA and ECBF.

PRELIMINARY ANALYSISIn general, the site periods correspond well to the depth to bedrock contours as site period increases with increasing depth to bedrock. In some cases, multiple peaks are visible revealing the response between hydraulic fill over TGA and TGA over ECBF (Fig 5).

This zone was reclaimed predominantly with hydraulic fill which overlies TGA and EBCF. Northwest trending paleo-channels containing relatively thick hydraulic fill material (<8 m) and TGA (<17.3 m) within incised ECBF, HVSR measurements reveal an increase in site period with depth to ECBF rock. This is also evident in the Wynyard Quarter Northern extension (Fig 4).

Where some measurements were taken at the southern border of the northern reclamation, two peaks were identified (Fig 5).

Year

1840 1860 1880 1900 1920 1940 1960 1980 2000 Present

Auckland

1840’s Shoreline

N

500 m

FREEMANS

BAY

STANLEY

POINT

OFFICIAL

BAY

MECHANICS

BAY

ARCHEON

POINT

ST

GEORGES

BAY

JUDGES

BAY

ST BARNABAS

POINT

CAMPBELLS

POINT

BRICKFIELD BAY COMMERCIAL

BAY BRITOMART

POINT

HV

SR

Period (s)

A) B)

FILL

TGA

ECBF

A)

B)

x

x

Fig 5. HVSR over southern border of northern reclamation of Wynyard Quarter ( ), showing 2

impedance contrasts (x). Location in Fig 3.

WYNYARD QUARTER 1905–1931

o CPT, SPT, borehole and laboratory test data were collated across the reclaimed land from historical ground investigations to develop representative soil profiles.

Fig 1. HVSR testing set up. Photo taken on Quay St.

Period (s) Period (s) Period (s) Period (s)

HV

SR

HV

SR

HV

SR

HV

SR

Mean ±1 𝜎𝜏 = 0.24sec 𝜏 = 0.3sec 𝜏 = 0.11sec 𝜏 = 0.34sec

HV

SR

HV

SR

HV

SR

Period (s)

Period (s)

Period (s)

Incr

easi

ng d

epth

to E

CBF a

nd s

ite p

eriod

Fig 4. HVSR spectral peaks. Locations in Fig 3.

𝜏 = 0.62sec

𝜏 = 0.56sec

𝜏 = 0.44sec

Mean ±1 𝜎

Mean ±1 𝜎

Fig 3. Depth to ECBF and HVSR measurement locations ( ). Representative HVSR spectral peaks displayed (Images 1-4. Outlined area (dashed yellow perimeter on the left) is a case study: Wynyard Quarter 1905 -1931 (Images 5 –8). Base mage sourced from GoogleEarth 2015.

Auckland

1840’s Shoreline

N

500 m

Auckland

1840’s Shoreline

Depth to ECBF (m)

0 2 4 6 8 10 12 14 16 18 20

Site Period, T (sec)

0 0.1 0.2 0.3 0.4 0.5 0.6 0.7 0.8

15 minute records were taken as this was considered an adequate length to clearly identify the expected period of the soil profile above ECBF in the area. Data was then processed using Geopsysoftware to constrain a spectral average at each location.