krause fund research spring’18 apple inc. … apple watch, ihome and macs. in recent past, apple...
TRANSCRIPT

P a g e | 1
Important disclosures appear on the last page of this report.
Krause Fund Research Spring’18 Technology (Beta) .Current Price: $176 | Target Price: $195-205
Company Overview Apple Inc. (AAPL), a company founded in the 1970’s, is still one of the global leading tech giants today. As a tech company, Apple has been historically focused on the product hardware side with their iPads, iPods, iPhones, Apple Watch, iHome and Macs. In recent past, Apple has been working on growing their software presence. While we would like to acknowledge their new competitive space seems to be moving to the software side, most of our opinions are focused on the shift Apple seems to be making from hardware to software. Over the past few years, Apple has shown consistent overall growth. For example, for the fiscal year ending 09/30/2017, total revenues rose 6.3% to $229.234 billion. . Stock Performance Highlights 52 week High $183.50 52 week Low $140.45 Beta Value 1.24 Average Daily Volume 3.77 M
Share Highlights Market Capitalization $886.58 B Shares Outstanding 5.07 B Book Value per share $27.59 EPS $10.33 P/E Ratio 15 .40 Dividend Yield 1.37% Dividend Payout Ratio 26.01%
Company Performance Highlights ROA 13.87% ROE 37.70% Sales $229.2 B
Financial Ratios Current Ratio 1.28 Debt to Equity 86.3% One Year Stock Performance
xxix
APPLE Inc. (NASDAQ: AAPL) Recommendation: BUY April 16, 2018 AAPL Investment Thesis Apple has been a leader in the smartphone industry since the release of the iPhone 4 in 2010. With the largest market cap of over $860 Billion in the Technology Sector, what is Apples next big move? Apple’s main line of business historically has been smartphone sales, but they are entering the new software/service segment of technology which is a great growth move. Given Apple’s past performance and our positive outlook on revenues, we believe Apple’s current product lines will have an average of 5% year over year growth supporting our buy rating. Drivers of Thesis New iPhone release 2018
• Apple will be releasing 3 new iPhones in September creating a variety that customers historically have enjoyed
• For the next five years we predict an average of 3.62% growth per year
• Expect to see an increase in unit sales due to Apples new reduced-price product line
Added value service segment of business • Increased revenues from new service side of
business • 18% year over year average growth rate for the
next 5 years • “Includes revenue from Digital Content and
Services, AppleCare, Apple Pay, licensing and other services”ii
Risk to Thesis Incompatibility
• Apple product lines are incompatible with third party products
Oversaturated Market • The smartphone market has been saturated
since 2014 and there has been significant market pushback due to increased price points
• Huawei and Xiaomi were the only vendors in the top five to experience growth in the fourth quarter
• Apple has moved from number one in phone sales to number two as of February 2018.vi
Analysts Morgan Baran Matthew Pacyna [email protected] [email protected]

P a g e | 2
Important disclosures appear on the last page of this report.
Executive Summary
We recommend a BUY rating for Apple Inc. The company is poised to grow over our forecast years based on its strength of smartphone market share and introducing new products for consumers to use. Although Apple’s current products are in the mature stages of its lifecycle, Apple is highly involved in introducing the next iteration of technology products that consumers want to use, i.e. AI speaker virtual assistants.
Fueling Apple’s revenue growth is its continuously updated product lines that it offers along with diving into new smart hardware and growing its service side of the business. Apple is set to introduce 3 different iPhones that allows consumers to choose a product at the right price point with the features they would want. Apple is also seeing high growth in its Services division with offerings such as the App Store, iTunes, and its new service of Apple Music which competes against the giant, Spotify. With new competitors coming into the market, we maintain the belief that Apple will continue to produce quality products that live up to their premium price tag.
Based on our valuation methods, the intrinsic value of the company is $199.79 per share, 13.52% above its current market price of $176.00, putting our recommendation as a buy rating.
Economic Outlook
US Real Gross Domestic Product
Real Gross Domestic Product (GDP) is the measure of the market’s total economic output during a given period after adjustments for inflations are made. Real GDP is an important economic indicator because it helps reflect the overall health of the economy. During a time of economic expansion, consumer spending and consumption increases. The result is a larger top and bottom line for companies.
The chart below displays the Real US GDP growth from previous quarters. Real GDP declined .3% from 2017 Q3 to Q4, making the 2017 Real GDP growth rate of 2.3%.
xvi
We believe Real GDP will grow at 2% over the next five years. Currently, growth is being hindered by fears of a protracted United States v. China trade war, upward pressure on inflation, and a rising interest rate environment. Despite the recent selloff in the market, we predict Real GDP to continue to grow steadily. There are catalysts for continued Real GDP growth as well, such as the most recent tax cut and the historically high Consumer Confidence Index (CCI). Even though there was a modest retreat in confidence, the index levels remain high and suggest further strong growth in the months ahead. We predict the tax cut will also stimulate investment and economic expansion, helping push Real GDP forward in a time of a market dip.
Inflation Rate (Consumer Price Index)
The Consumer Price Index (CPI) measures the changes in the prices consumers pay for a basket of selected goods and services. It is an important economic indicator that is released on a monthly basis which helps gauge the inflation rate. The rate is currently at 2.2%.
Below is a chart of the CPI rate as shown as an annual percent change. Inflation has been relatively steady since the recession, and hovering around the Fed’s target inflation rate of 2%.
v
P a g e | 3
Important disclosures appear on the last page of this report.
Going forward, we expect inflation and the CPI to be at 2%. Recently, there has been fears that inflation would elevate substantially, but we do not see validity in these claims. Part of the reason why inflation is speculatively going to be higher is due to the recent tax cut and a rise in wage growth. Although we recognize the rise in wages increased company costs, we don’t believe these costs will be equally translated into increased costs for consumers. In addition, we are currently in a rising interest rate environment. The recent federal funds rate hikes should also keep inflation on the low end in the coming year.
Interest Rates
Interest rates are largely influenced by the Federal Funds Rate: the rate charged to banks for overnight loans. Post-recession, the US has been in a historically low interest rate environment. This environment was created by the Fed in an attempt to stimulate economic growth through decreasing the cost of borrowing. Since late 2015, the Fed has slowly begun to increase this rate. At the last meeting, the recently appointed Fed Chair, Jerome Powell, elected to raise the Federal Funds Rate to its highest level since 2008 at 1.75%.
Looking ahead, we predict that the Fed will have another two rate hikes before the end of the year. Through raising these rates, it should begin to normalize the cost of borrowing and give the Fed some ammunition to use if the economy were to have a pullback. On the downside, it will hurt companies by increasing their cost of debt. Ultimately, we see this as a sign that our economy is healthy and expected to enter a period of steady growth. The increase in rates has been long awaited and should not serve as a shock to corporations or the markets.
Capital Markets Outlook
The US Economy saw a significant amount of growth in 2017, with the S&P 500 rising 23%. Going forward, we are forecasting a reduced, but steady growth rate for the US economy. We believe that a steady Real GDP growth rate, low inflation, recently passed tax legislation and high consumer confidence will push the economy forward in 2018. We forecast the US economy to continue to grow in next year despite the increased volatility in the market from fears of a trade war, a rising interest rate environment, and historically stretched valuations.
One of our growth concerns with Apple in particular is the fact that mega caps stocks don’t have room for further growth. Apple has a significantly large market cap compared to any of its competitors, leading us to believe that a slowdown in growth is in store, especially with a new market rival, Huawei. In addition, the second market competitor, Samsung has increased their market share over the past year.
Industry Analysis
Industry Overview
The Technology Hardware Industry, an easily identifiable space that Apple has had the privilege of being a leader in over the past few years is comprised of products such as computers, smartphones, wearable technology, servers, AI Speakers, TV and electronic computer components. Within the hardware industry we are expecting to see an overall growth of 4%. However, the more significant growth rates are expected to come from the software business with an expected growth rate of 6%.
Technology Hardware is an oversaturated market with stagnant growth in the cellphone and laptop market. Individuals are choosing to replace these items less frequently due to elongated life and less significant upgrades from the consumer benefit standpoint. While the Technology Hardware industry is oversaturated in that area, newer technologies such as the smart watch and AI speakers still have significant room for growth. The new technology of AI and smart watches are newly tapped, which represents an opportunity for significant development.
Technology Software is a consumer driven industry based on needs and convenience. Software is constantly being developed as quickly as possible to meet customer specific demands. The Technology Software industry is known to collect massive amounts of data which recently has been used to maximize customer experience from a corporate standpoint. Recently, software has been developed to coexist seamlessly with new AI technology thus providing maximum convenience though new product development.

P a g e | 4
Important disclosures appear on the last page of this report.
Recent Developments and Industry Trends
AI
A new development in the technology space has been the AI speaker system. With the three main competitors in this space, Apple, Google and Amazon, the push to move toward smart homes has never been greater. AI in general terms is the concept of teaching a machine to think like a human. These speakers are making it easier for different software platforms to interact, making daily tasks even more automated and in some cases easier to complete. Since the release of the first AI speaker, in 2011 with Apple’s Siri, the developments have only increased and proved to be relevant in other product models. As of January 2018, 16% of Americans have an AI speaker in their home.xxvii
MicroLED screen production
The MicroLED technology was invented in the year 2000 by a research group at Texas Tech University.xxv
However, this component was not used in product lines until recently. This feature will allow developers to produce even thinner product screens that are brighter and with greater pixel density. The MicroLED display has been in production for many years as many companies are finally able to utilize this expensive technology. At this point, only Sony and LG have been able to use technology similar to MicroLED by creating OLED screens for their TV’s. Apple is the first to have reported an attempt to capture the MicroLED technology in its products.
The Race to 5G
We are all aware that there is a new network out there called the 5G network which is supposed to increase speeds and reliability when connecting wireless devices to this network. By 2020 the world is expected to run on this new faster network but what we are awaiting to see is who Apple will partner with to make this possible. Currently, Qualcomm, Samsung and Intel are working on microchip technology to compete in the 5G space. The future for Apple will depend on how they tackle the new 5G speeds that can be delivered to their products for consumption of media. We predict that Apple will push high-resolution screens to their products to take advantage of faster load times for content streaming.
Porters 5 Forces
Industry Competition: Strong
Competition within the hardware sector remains high as companies fight for market share, especially within the cellphone market. Computers are expected to decrease by as much as 5% in growth as consumers put off upgrading their desktops/laptops, thus it is best to capture as much revenue as quickly as possible.iv The mobile phone, specifically smartphones, industry has showed a decline in sales volumes as people view their current phone as in perfect working condition instead of upgrading to the newest version. US based companies are on constant alert as to what their rivals are able to bring to the US market and also deliver world-wide.
Supplier Power: Medium
Low cost labor has been taken advantage by companies by using developing countries to manufacture products which helps keep product cost down. Purchases of finished product components make up the largest cost of a product being around 63%.xi Rise in input prices would be pushed onto the consumer, but recent trends in higher-priced products has led consumers to purchase lower-priced products with perceived equal quality. The price of semiconductors and electronic inputs fell to an annualized rate of 1.1% to 2017.xi Bigger brands that make large orders of products are able to drive down cost through the supplier’s economies of scale.xi Technology advancements along with competition between companies keep circuit board, processors, and memory prices low, especially after some time has passed.
Buyer Power: Medium
With an increase in the saturation of the market, consumers have greater flexibility to pick and choose which product to buy based on the differentiations that appeal to them. Brand loyalty exists and can be perceived as to how much a consumer is intertwined with the OS ecosystem. An example of this would be how much someone has spent on app purchases, for iOS or Android or on Windows for the Mac OS. Consumers can be price sensitive but there are always the ones willing to spend top-dollar for the latest and greatest technology that comes out. Some products hold their value well over time and allow the consumer to

P a g e | 5
Important disclosures appear on the last page of this report.
sell their product and be able to afford the newest addition at that time.
Threat of Substitution: Low to Medium
For the most part, smartphones have become the standard consumer electronic of the world. Laptops have taken over the “home appliance” product as consumers move towards the laptop instead of purchasing a desktop computer. Tablet sales continue to fall with the continuation of larger smartphones.iv The emergence of wearable technology that support functions of a cell phone pose a threat, but most companies market this as an accessory to have with your phone as the cell technology may not be mature enough to support the watch as a standalone phone. However, with the popularity of Bluetooth headphones, this treat becomes more feasible in the future.
Barrier to Entry: Medium
The cost of startup in the Technology Hardware Industry still remains high as it requires significant capital for R&D and manufacturing. Threat of new entries will remain low as both the computer hardware and smartphone markets are in their maturity phase. Customers, for the most part, retain their brand loyalty. One point of consideration is that current makers are able to adapt and produce new products that go after consumer in different target markets, i.e. Huawei and premium phones
Company Analysis
Product lines
Apple is not only invested in their brand name but also recognized throughout the industry for their premium quality products. “The company believes ongoing investment in research and development ("R&D"), marketing and advertising are critical to the development and sale of innovative products, services and technologies."xiii Apple has five categories of products that make up their revenues. As depicted in the graphic, the iPhone is and has been the significant revenue driver.
i
iPhone
iPhones, Apples second oldest product line, has been a significant bread winner for the company. From the first iPhone release in 2007 to modern day, Apple has sold over 1 billion phones.vi The historic black touch screen design with minimal buttons captivated users and left them to believe this was the phone of the future.
Leading the smartphone space for many years, Apple has features built into their products to maintain their leading position. These features include: Siri, Touch ID, Face ID, Camera hardware, and iOS operating system. Apple relies heavily on the distinctiveness of their operating system and propriety accessories.
In the 2017 fiscal year, iPhone sales made up 62% of their overall revenue. As shown in the graphic below, Apple still dominates the smartphone industry with approximately 44% of users choosing their product. One thing that is interesting to note is that Hauwei, a competitor which previously manufactured cheap smartphones, has chosen recently to enter the premium smartphone space as a direct threat to Apple in foreign markets, specifically China.
xxiv

P a g e | 6
Important disclosures appear on the last page of this report.
Market wide there are a limited number of direct competitors to Apple on a grand scale. The three firms who compete with Apple for market share are Hauwei, Samsung, and minimally Google. The graphic below depicts Apple and Samsung leadership in the smartphone space and also signals Huawei entry into this competitive landscape.
xxiv
iPad
iPads are one area in the market where Apple has not put much focus in recent years. The iPad has seen significant decreases in sales over the past 3 years and this trend is expected to continue. As the data below depicts, iPads have been steadily decreasing since its release in 2013. In 2017 you will notice a slight increase which we believe is due to the release of the iPad Pro which is set to have closer resemblance to the Mac operating system.
xxiii
The direct competitors in this space include Microsoft with the Surface line, Amazon with the Fire, and Samsung with the Galaxy Tab. Historically, this space has been a hit or miss for all companies causing many companies to look at other ways they can grow in within the industry.
Mac
Apple’s original product line, The Macintosh computer, was the first product Apple brought to market. This was a tricky launch at the beginning but it brought the Apple name into the American household. As time progressed as depicted below, Apple products became recognized for their outstanding graphic design capability.
xvii
In the 2017 fiscal year, Mac sales made up 11% of Apple’s overall revenue, and as shown above their Mac sales have increased in the past few years due to increased product variety and price points. Apple computers have diversified their product to allow the consumer to create their own unique computer based on their preference, something competitors have yet to achieve.
Services
A new line of business for Apple, their service line which is comprised of Apple music, App store, AppleCare, iCloud, Genius bar and Apple Pay. With half of these services being subscription based, they have increased consumer dependence on “feel good” services. Specifically, Apple music has been one of the more successful subscription-based services that Apple has to offer. This service allows the listener to enjoy music commercial free by either streaming and/or by downloading music while in transit. Given Apples historic ties to the music industry, this was a significant step to gain back to gain back market share from its competitor, Spotify.
The historic service revenues driver was the App Store, where you can find any app that you could dream. With the first release of the App store in July 2008, there

P a g e | 7
Important disclosures appear on the last page of this report.
have been years of variation and improvements to this service. With all the services within Apple significantly improving, it seems only fitting that in 2017 service revenue made up 13% of their overall revenue.i
Other Products
As Apple continues to expand their product line we can only expect to see an increased in smart technology. Apple recently introduced three hit products; the Apple watch, the HomePod and Apple TV.
Apple Watch
This new wearable technology was introduced to compete with Fitbit and has made a statement that it is here to stay. The Apple watch has increased sales year over year as shown below, and includes the devices laundry list of features. The Apple watch is expected to continue to be at the forefront of wearable technology. Health data is available from using the watch which gives Apple an advantage to push more into the health area and tie three different products together. They will have to improve the hardware and software to get better measurements in order to utilize smart AI to analyze health data. From there the potential to push recommendations to its users so they can achieve their personal health and fitness goals. We think if Apple were to follow this approach, sales of the Apple Watch would rise, and customers would see Apple’s products giving them greater value.
xxi
HomePod
The Apple HomePod has had some issues getting off the ground, but we believe Apple will put significant development in the product as smart home appliances
become more common. As shown below, the Google Home is currently at the forefront of the AI technology based on accuracy. However, Apple’s recent release along with their loyal customer base, we believe that the HomePod will soon be able to meet the learning curve with AI.
xvi
Geographic Break Down of Sales
Apple has had a historic market presence in the US where it is still recognized as the top brand. While Apple was the top of the line in China, sales have decreased 7.69% due to increased presence of local brands.i The top two geographic areas for selling Apple products are the Americas at 42% followed by Europe at 24% and China third at 19%. Our overall prediction is Apple will maintain steady growth in the future in the Americas, Europe, and Japan and other areas of the world. For China, with new competitors introducing their products to a large population, we believe Apple to have some trouble growing in this area based on the premium price tag and also government interference. Depicted below are Apple’s sales based on region for 2017.
i

P a g e | 8
Important disclosures appear on the last page of this report.
Product Life Cycle
Apple’s core products experience short life cycles compared to other industries. The highly competitive market of smartphones, computers and accessories makes Apple spend high amounts on R&D in order to compete with its competitors. Apple’s flagship products, iPhones, iPads, and MacBooks, collectively share 81% of Apple’s profits. The iPhone’s average product life cycle is 2 years with a new release every year. The iPad life cycle ranged from half a year to 3 years with a new model released annually. Its MacBook line had an average life cycle of 3.5 years and new models came out on average every 1.5 years.xxviii Apple must maintain short product life cycles in order to take advantage of changing technologies that are discovered and demanded by the consumer.
SWOT
Strengths Apple has been at the forefront of product development in the smart phone industry for years and has a unique differentiation factor. Apple is never first to release a new technology. Apple always allows its competition to come out with a product first, they then analyze the flaws and resulting in a release of its own streamlined version with an overall better ‘mouse trap’ versus its competitors offerings. In addition, Apple is known for its sleek product design, modern image, and minimal excess hardware components if any. For example, the iPhone has minimal buttons on the phone, and the phone itself is very user friendly. With their modern take on the Technology Hardware space, Apple has chosen to market its products in a unique and cleaver manner. Apple typically utilizes third parties such at AT&T or Verizon to do its marketing for its products. The commonality of Apple’s brand name is what allows them to limit excess marketing costs and focus more of their efforts on research and development. Lastly, Apple has a high profit margin on all their products which significantly increased revenues for the company. Weaknesses Apple has a historic record of not being willing to work with other operating systems. While they have changed this recently with the new integration of Microsoft into the Mac’s and iPads, there are still countless programing software’s that are incompatible with the
Apple operating system. In addition, the Apple store Apps, a secondary platform that could be easily reformatted to interact with google play, has historically refused to do so making it nearly impossible to use Apple created apps on non-iPhones. Apple, while amazing in quality, has higher prices than its competitors, Huawei and Samsung. Recently, as depicted below, Samsung has been more competitive with their product pricing but are still $70 less than Apple’s top of the line product.
vii
Finally, Apple’s main source of revenue is iPhone sales. With an oversaturated phone industry already, Apple’s phone sales in the future will be dependent on the turn around of this industry and product innovation. Opportunities Apple has many opportunities to grow its products and tie them in with consumers’ lives. One way Apple can take advantage of this opportunity is to build its software, such as Siri, into home appliances, such as the A/C or entertainment system, to play when the person uses the phrase “Hey Siri”. By doing this, Apple entices consumers to purchase more of their products and keep them loyal. Another opportunity for growth would be to expand its iCloud services for enterprise use. By doing this, Apple would be able to capture the premium business pricing and boost its service revenue.xv One last opportunity for growth would be in the foreign markets, such as China or India. Both countries middle class populations are experiencing significant growth of wealth where Apple may want to consider conditioning these markets, given Apple has releases less expensive products later this year. As Apple releases a new, less expensive product this year, it has the potential to capture new consumers.

P a g e | 9
Important disclosures appear on the last page of this report.
Threats
Apple still faces threats from other smartphone producers, especially those who are in the market of selling premium Android phones that are direct competitors to the likes of the iPhone X. These other smartphone producers are developing their own new technologies, both hardware and software, which offer something different that a customer may be looking for.
Another threat Apple should realize from these phone producers is that if their iPhone prices rise, customers that are semi-loyal may become more price conscious. This will cause consumers to switch to another brand of phone because they perceive the value to price ratio to be better.
One last threat that Apple faces is that as new companies move into new technology products, i.e. AI stereos, Apple is at risk of being late and can be left out of the market while people become content with what they have. This will hurt Apple’s opportunity to cross-sell products in order to deliver that seamless experience they want with all their products.
Valuation Analysis
After completing extensive research on Apple, we are issuing a BUY recommendation based on Apple’s future steady growth within its hardware product lines and its double-digit growth in its services division. We expect Apple’s revenues to grow in all areas of the globe based on our 5-year forecast. We determined the intrinsic value of Apple’s share price using discounted cash flow (DCF) model, economic profit (EP) model, dividend discount (DDM) model, relative valuation P/E model, and the Enterprise Value to EBITDA (EV/EBITDA) model. Our model predicts the estimates of the intrinsic value as of April 16, 2018. Our DCF and EP models provide us with the same intrinsic value of $199.79 per share, signaling that Apple is currently underpriced. The DDM model gave us an intrinsic value of $132.86 per share, signaling that Apple is currently overpriced. Our relative valuations gave us an intrinsic value of $168.88 for the forward P/E which is in line with the current price. Our EV/EBITDA relative valuation gave us an intrinsic value of $156.99 per share, signaling slightly below the current price. We believe that our DCF/EP models
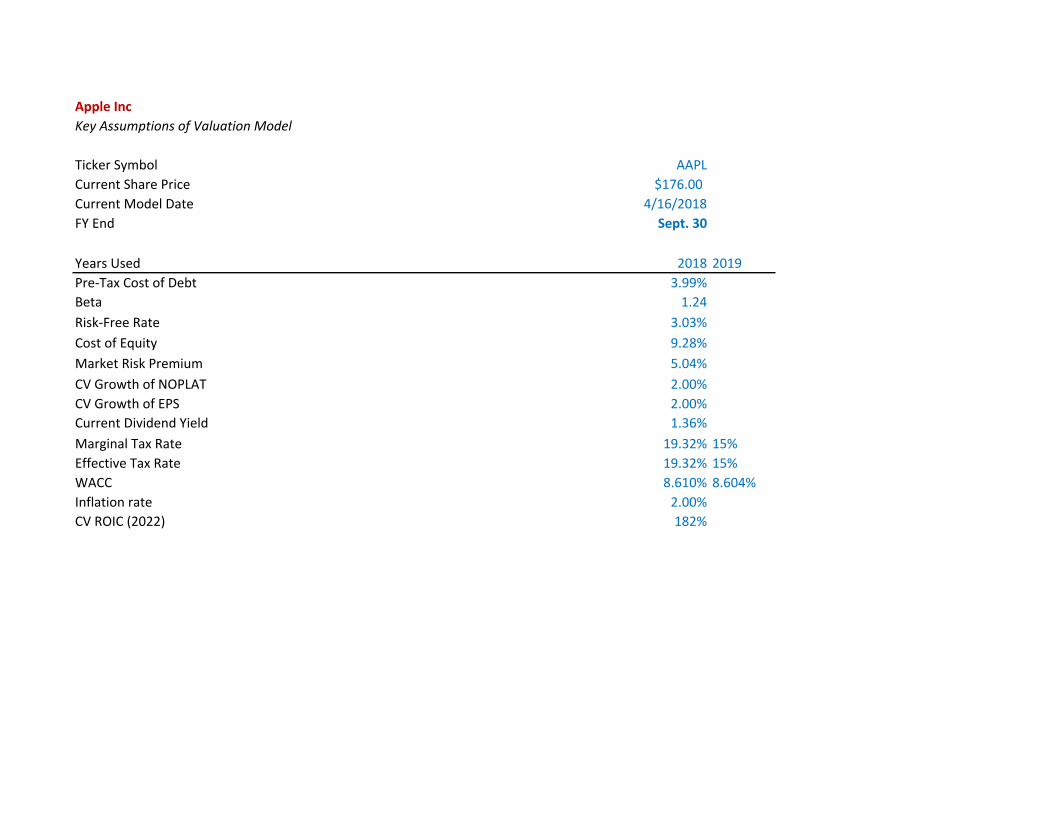
give the most accurate representation of Apple’s intrinsic value. Both of these methods take into consideration all operations of the company, include vital information not located in the main financial statements, and value the company based on the present value of the free cash flow. Key Assumptions Revenue Decomposition As the first step in building our model, we forecasted Apple’s revenue projections based on geographical segments. We chose geographic segments over product lines as we believed each segment represents a homogenous population that maintains a certain market-share for Apple. We only forecasted out 5 years to 2022 as we felt this allowed us to maintain appropriate predictions for the computer hardware industry as it can change significantly within this timeframe. To determine our forecast for revenues, we looked at historic growth for each segment along with implementing our analysis of how Apple will fair in each segment. For the first 2 years of forecast, we maintained one rate and then lowered the growth rate for the last 3 years as to be more conservative in the model. We calculated our Cost of Sales Margin using a historical 5-year average excluding an outlier in 2013. We excluded 2013 as we felt that year did not align with Apple’s historic Cost of Sales Margin. The rate calculated was 56.30%. We calculated depreciation expense using a 3-year historical average of the percent of Beginning Property, Plant and Equipment (PPE) to total assets. We chose a 3-year time horizon as it better represented recent purchases of PPE. The rate calculated was 41.57%. We calculated Research and Development (R&D) expense as the average margin of R&D to Revenue for each respective year in a 5-year historical average. Since looking at this historical margin, we noticed Apple’s R&D expense was growing by 1% per year for the past 3 years. With our historical average lower than the 2017 ratio, we decided to add 100 basis points to our forecast average to address Apple’s continue increase in their R&D development. We calculated the interest income forecast based on the assumption that Apple’s cash, short-term investments, and long-term investments would grow conservatively
P a g e | 10
Important disclosures appear on the last page of this report.
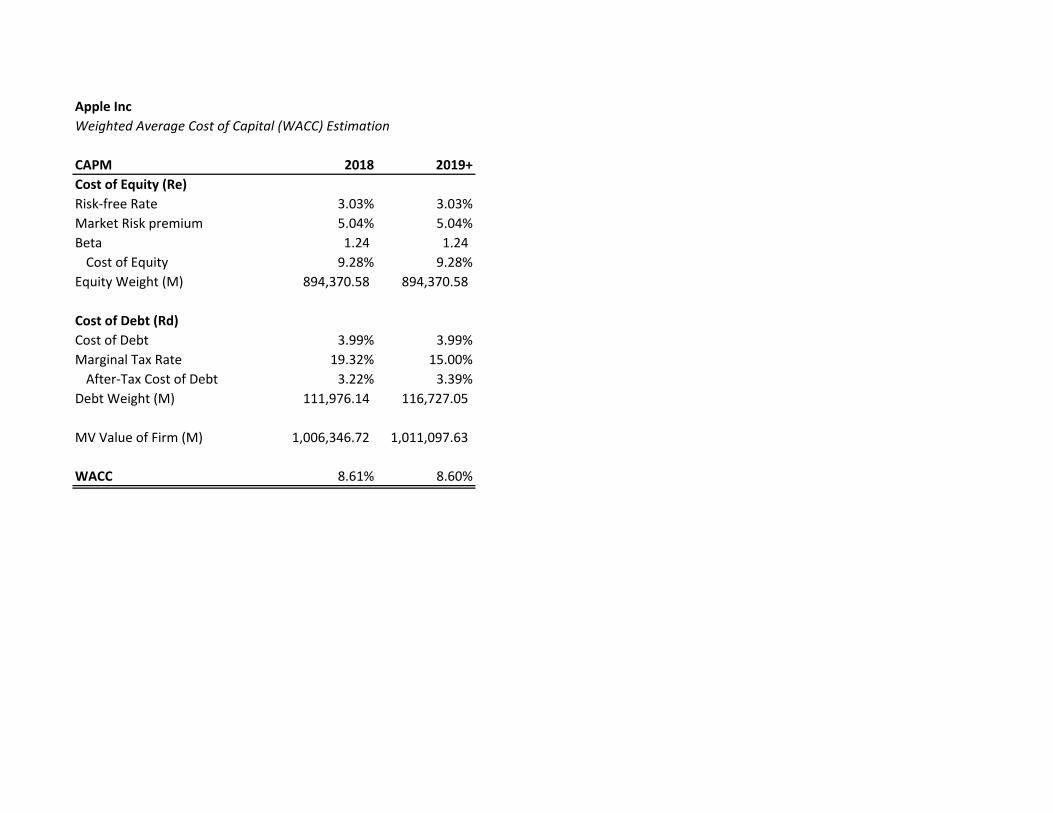
using the 10-year T-Bond rate of 2.87% pulled from Bloomberg. We calculated the forecasted Dividend Payout by taking the historical average of Apple’s dividend payout ratio. This historical average payout was 26.01% of EPS based on our calculations. For our Weighted Average Cost of Capital (WACC) assumption, we calculated two different WACCs. One was based on the 2018 fiscal year, and another based on 2019 and beyond. We did this because of the new tax law, Tax Cuts and Jobs Act, passed by the Trump Administration. This law lowered the corporate tax rate from 35% to 21%. Our 2018 marginal tax rate assumption is 19.32% and our 2019 and beyond marginal tax rate assumption is 15%— based on Apple’s guidance report for 2018 1st Quarter. Apple’s WACC is heavily weighted towards its equity, and has very minimal debt with an Equity/Debt ratio of 0.86. Our cost of debt assumption is based on a bond issued by Apple with a maturity date in 2047 and a current yield of 3.991%. Our Risk Free Rate is based on the current yield for the 30-year T-Bond with a yield of 3.03%. We used a Beta of 1.241 from Bloomberg’s Terminal using a monthly 5-year historical average. We projected our return on the market from Damodaran’s online resource with a yield of 8.07%, which was used to calculate our Market Risk Premium. For our Capital Expenditures forecast, we decided to forecast PPE growth based on 5-year historical average growth of the ratio of PPE to Sales. We decided on this format as we believe it is a good indicator of Apple’s involvement to increase their PPE to keep up with their product demands and technological changes that drive their revenues. The average growth rate from this ratio was 7.00%, in which we forecasted PPE. Within our value drivers, we have decided to decrease the Deferred Tax Liability (DTL) within our forecast. Apple’s 2018 1st Quarter analyst call reports, because of the newly passed tax law, Apple would be in position to pay off their liability. This is evident within the Quarter’s financial statement of a decrease of $11 billion on the DTL line and an increase in Accounts Payable of roughly $11 billion. Apple has said they plan to pay the DTL over a schedule, in which we accounted for to take place over the next 3 years. From 2020 onward, we increased DTL by $1.5 billion to forecast out perceived tax liabilities that would still exist because of the differences in timing.
Discounted Cash Flow (DCF) & Economic Profit (EP) Model We believe our DCF and EP models to be the most robust and accurate prediction based on our underlying assumptions for Apple’s future intrinsic value. Using these models, we are able to incorporate our predictions for an accurate measure of the values of NOPLAT, Invested Capital, ROIC, WACC, FCF and EP. These two techniques produced an intrinsic value of $191.70 per share, with a partial-year adjusted price of $199.79. This represents a 13.52% increase from its current price. We believe this increase in price is justifiable with Apple’s introduction of new iPhone’s that will increase its market share and their focus on its service revenue growth with product lines such as Apple Music. Dividend Discount Model (DDM) The dividend discount model provided us an intrinsic value of $127.48 per share, with a partial-year adjusted price of $132.86. We believe this to be an inaccurate measurement on Apple’s valuation. Historically over the past 5-years when Apple started to pay dividends, they maintained an average payout ratio of 26.01%. We believe that Apple still wants to reinvest most of its proceeds to be able to compete in the ever-changing Technology Industry. Thus, the low stock price indicated by the DDM is not a good indicator as of right now. Relative Valuation Using Bloomberg, we were able to identify what we believe were firms that were similar to Apple’s operations. These companies were Google Inc., Microsoft, HP, Samsung, and IBM. Our P/E model produced a price of $166.92 per share. Our forward P/E model produced a price of $168.88 per share. Our EV/EBITDA model produced a price of $156.99 per share. These low intrinsic values that we found are due to our conservative estimate for Apple’s Net Income and EPS. Sensitivity Analysis To ensure the accuracy in our model’s prediction, we have conducted a sensitivity analysis based on variables we deemed would have the most impact on price change. Using this analysis allowed us to find a target range for the stock price.

P a g e | 11
Important disclosures appear on the last page of this report.
Beta v. Risk Free Rate Beta versus the Risk Free rate was chosen as they both have a substantial influence in our WACC calculation, which in turn has a heavy influence on the final intrinsic price. With treasury rates on the rise and the stock market in-between fluctuations, this table gives us a good indicator of where their price may lie depending on the future.
2020CV ROIC v. CV NOPLAT Growth This analysis allows us to see how our carrying value (CV) assumptions for the DCF and EP models influence the intrinsic stock price when carried out into the future. The CV NOPLAT Growth is especially interesting considering the implications it has for Apple’s growth and if Apple is able to maintain a high ROIC CV. This inverse relationship would make Apple want to have a high NOPLAT growth in the future, while also lowering their ROIC which would increases its intrinsic value.
WACC v. CV NOPLAT Growth We conducted this analysis to see the effects of the changing numerator and denominator given these two variables and their influence on the carrying intrinsic value. Apple’s position within these variables would be to lower its WACC and maintain a steady growth rate that would be higher than our assumption of the real GDP growth.
Beta v. Equity Risk Premium A Beta versus Equity Risk Premium analysis allows us to see the impact of the Beta we chose for Apple
against the return on the market. Taking notes from what the Trump Administration wants for US business, growth in the market will put more pressure on higher equity returns that Apple’s investors will demand. Our valuation model puts a lot of significance on Beta, which has an influence on our WACC discount rate. Looking at the different Betas allows us to see how the market volatility will affect our discount rate and in turn, our intrinsic value.
CapEx v. Cost of Debt We decided to test these two variables because of recent events of rising interest rates in the economy caused by The Fed. We wanted to see how increases in the Pre-tax Cost of Debt would affect the intrinsic value of Apple based off their growth in PPE and how it affects the price if Apple were to maintain growth within the changing Technology Industry.
P a g e | 12
Important disclosures appear on the last page of this report.
Important Disclaimer
This report was created by students enrolled in the Security Analysis (6F:112) class at the University of Iowa. The report was originally created to offer an internal investment recommendation for the University of Iowa Krause Fund and its advisory board. The report also provides potential employers and other interested parties an example of the students’ skills, knowledge and abilities. Members of the Krause Fund are not registered investment advisors, brokers or officially licensed financial professionals. The investment advice contained in this report does not represent an offer or solicitation to buy or sell any of the securities mentioned. Unless otherwise noted, facts and figures included in this report are from publicly available sources. This report is not a complete compilation of data, and its accuracy is not guaranteed. From time to time, the University of Iowa, its faculty, staff, students, or the Krause Fund may hold a financial interest in the companies mentioned in this report.
P a g e | 13
Important disclosures appear on the last page of this report.
References i 2017, A. 1. (2017). Form 10-k. Cupertino: Apple. iiApple Inc. (2018, February 1). Apple Reports
First Quarter Results. Retrieved February 10, 2018, from Apple: https://www.apple.com/newsroom/2018/02/apple-reports-first-quarter-results/
iii Bhatia CPA, A. (2018, February 2). Apple Inc. It's All Abou the ASPs: Strong Quarter as iPhones Sales Top Estimates. William Blair. Retrieved from Thomson One: www.thomsonone.com
iv Euromonitor International Passport. (2017). Consumer Electronics in the US. Industry Report. v FRED. (2018, April 11). Consumer Price Index
for All Urban Consumers . Retrieved from https://fred.stlouisfed.org/series/CPIAUCSL
vi Gartner. (2018, February 22). Gartner Says Worldwide Sales of Smartphones Recorded First Ever Decline During the Fourth Quarter of 2017. Retrieved from https://www.gartner.com/newsroom/id/3859963
viiGershgorn, Dave (2017, September 12) How much do the new iPhones cost compared to the competition? Retrieved from https://qz.com/1075708/apple-event-how-much-do-the-new-iphones-cost-compared-samsung-htc-and-googles/
viii Google. (2018). Apple Inc. Retrieved from ix Helena Handschuh, E. T. (2006). Hardware
Security Features for Secure Embedded Devices. Retrieved from Springer Link: https://link.springer.com/chapter/10.1007/978-3-8348-9195-2_5
x Huberty CFA, K. L., Woodring, E. W., & Elizabeth, E. C. (2018, February 5). Applce, Inc. 10-Q Highlights Elevated Component Inventory. Morgan Stanley. Retrieved February 11, 2018, from ThomsonONE: www.thomsonone.com
xi IBISWorld. (2017). Global Computer Hardware Manufacturing. IBISWorld.
xii J.P. Morgan Asset Management. (2018). Long-Term Capital Market Assumptions.
xiii Leswing, Kif. “Apple Added a Revealing Word to Its Official Business Strategy.”Business Insider, Business Insider, 3 Aug. 2017, www.businessinsider.com/apple-services-business-strategy-2017-8.
xiv Milunovich CFA, S., & Wilson CPA, B. (2018, February 5). Apple Inc. The iPhone is Mature - What Now? UBS Global Research. Retrieved from Thomson One: www.thomsonone.com
xv Moskowitz, M. (2018, February 8). Apple, Inc. Thoughts on Services ARPU Growth. Barclays. Retrieved from www.thomsonone.com
xvi Statista. (2017). 2017, Apple's HomePod Is Not as Smart as Its Rivals. Statista
xvii Statista. (2017). 2017, Global Apple Mac unit sales from 1st quarter 2006 to 1st quarter 2018. Statista
xviii Statista. (2017). 2017, Global market share held by leading smartphone vendors from 4th quarter 2009 to 4th quarter. Statista.
xix Statista. (2017). Global market share held by leading smartphone vendors from 4th quarter 2009 to 4th quarter 2017. Statista. Retrieved from Statista: https://www.statista.com/statistics/271496/global-market-share-held-by-smartphone-vendors-since-4th-quarter-2009/
xx Statista. (2017). Global mobile OS market share in sales to end users from 1st quarter 2009 to 2nd quarter 2017. Satista.
xxi Statista. (2017). Market share of wearables unit shipments worldwide by vendor from 1Q'14 to 4Q'17. Satista.
xxii Statista. (2018). Share of Apple's revenue by product category from the first quarter of 2012 to the first quarter of 2018. Statista.
xxiiiStatista. (2018). Tablet operating systems' market share worldwide from 2013 to 2020. Statista.
xxivStatista. (2017). What brand is your (primarily used) smartphone? Statista.
xxv Triggs, R. (2017, October 6). MicroLED explained: The next-gen display technology. Retrieved from Android Authority: https://www.androidauthority.com/micro-led-display-explained-805148/

P a g e | 14
Important disclosures appear on the last page of this report.
xxvi US Department of Commerce. (2017). BEA Bureau of Economic Analysis. Bureau of Economic Analysis.
xxvii Watkins, D. (2017, December 14). Smart Speakers: Amazon and Google Share 92% of the Global Market in Q3 2017 says Strategy Analytics. Retrieved from Strategic Analytics: https://www.strategyanalytics.com/strategy-analytics/news/strategy-analytics-press-releases/strategy-analytics-press-release/2017/12/14/smart-speakers-amazon-and-google-share-92-of-the-global-market-in-q3-2017-says-strategy-analytics#.WtEcoIjwbic
xxviii Wiecek-Janla, E., Kornecka, M., Papierz, M., & Nitka, M. (2017). Apple Products: A Discussion of the Product Life Cycle. Advance in Economics, Business and Management Research, 31, 159-164.
xxix Yahoo Finance (2018, April 16) Apple Inc. Retreived from Yahoo: https://finance.yahoo.com/quote/AAPL?p=AAPL
xxx Yanofsky, D. (2018, March 22). Explore all $506 billion in goods that the US imported from China in 2017. Retrieved from Quartz: https://qz.com/1232833/explore-all-506-billion-in-goods-that-the-us-imported-from-china-in-2017/
xxxi Zino, A. (2017). Technology Hardware, Storage & Peripherals. S&P Global. CFRA.
xxxii Zino, A. (2018). CFRA Equity Research - Apple Inc. S&P Global. CFRA.
Apple IncKey Assumptions of Valuation Model
Ticker Symbol AAPLCurrent Share Price $176.00 13.52%Current Model Date 4/16/2018FY End Sept. 30
Years Used 2018 2019Pre‐Tax Cost of Debt 3.99% Apple LT bond (AAPLBeta 1.24 5‐year monthly averRisk‐Free Rate 3.03% 30‐year T‐BondCost of Equity 9.28% pulled from down beMarket Risk Premium 5.04% 8.07% from page 14CV Growth of NOPLAT 2.00% GDPCV Growth of EPS 2.00% GDPCurrent Dividend Yield 1.36% cash divideadd time Marginal Tax Rate 19.32% 15%Effective Tax Rate 19.32% 15% this will cWACC 8.610% 8.604%Inflation rate 2.00% CPI (average of 5‐yeCV ROIC (2022) 182% from value drivers

Apple IncRevenue Decomposition
Fiscal Years Ending Sept. 30 2015 2016 2017 2018E 2019E 2020E 2021E 2022ENet Sales by Geographic Segment:Americas 93,864 86,613 96,600 103,553 111,006 116,776 122,845 129,230 Europe 50,337 49,952 54,938 57,410 59,994 61,494 63,031 64,607 Japan 15,706 16,928 17,733 18,265 18,813 19,236 19,669 20,112 RetailChina 58,715 48,492 44,764 43,869 42,991 42,132 41,289 40,463 Other Countries/Segments 15,093 13,654 15,199 16,394 17,682 19,072 20,571 22,188 Total Net Sales 233,715 215,639 229,234 239,490 250,486 258,709 267,406 276,600
Geographic Segment Revenue % GrowthAmericas 43.89% ‐7.73% 11.53% 7.20% 7.20% 5.20% 5.20% 5.20%Europe 22.99% ‐0.76% 9.98% 4.50% 4.50% 2.50% 2.50% 2.50%Japan 4.83% 7.78% 4.76% 3.00% 3.00% 2.25% 2.25% 2.25%RetailChina 96.73% ‐17.41% ‐7.69% ‐2.00% ‐2.00% ‐2.00% ‐2.00% ‐2.00%Other Countries/Segments 45.91% ‐9.53% 11.32% 7.86% 7.86% 7.86% 7.86% 7.86%Total 27.86% ‐7.73% 6.30% 4.47% 4.59% 3.28% 3.36% 3.44%
Net Sales by Product:iPhone 155,041 136,700 141,319 148,137 155,285 159,671 164,181 168,819 iPad 23,227 20,628 19,222 17,174 15,345 13,403 11,707 10,226 Mac 25,471 22,831 25,850 26,802 27,788 28,255 28,730 29,213 iPodiTunes, Software and Services 19,909 24,348 29,980 35,090 41,072 48,894 58,206 69,292 Accessories Other Products 10,067 11,132 12,863 14,286 15,867 17,781 19,926 22,330 Total Net Sales 233,715 215,639 229,234 241,490 255,356 268,004 282,751 299,880
Net Sales % Growth by Product:iPhone 52.01% ‐11.83% 3.38% 4.82% 4.82% 2.82% 2.82% 2.82%iPad ‐23.30% ‐11.19% ‐6.82% ‐10.65% ‐10.65% ‐12.65% ‐12.65% ‐12.65%Mac 5.78% ‐10.36% 13.22% 3.68% 3.68% 1.68% 1.68% 1.68%iPodiTunes, Software and Services 10.22% 22.30% 23.13% 17.05% 17.05% 19.05% 19.05% 19.05%Accessories Other Products 10.58% 15.55% 11.06% 11.06% 12.06% 12.06% 12.06%Total Sales % Growth by Product: 44.71% ‐0.51% 48.47% 25.96% 25.96% 22.96% 22.96% 22.96%
Net Unit Sales by Product (in Millions):iPhone 231.22 211.88 216.76 221.50 226.34 229.02 231.74 234.49 iPad 54.85 45.59 43.75 40.69 37.84 35.19 32.73 30.44Mac 20.59 18.48 19.25 19.43 19.62 19.80 19.99 20.17iPod Total Net Sales 306.66 275.95 279.76 281.62 283.79 284.01 284.45 285.10
Net Unit Sales % Growth by ProductiPhone 36.64% ‐8.36% 2.30% 2.19% 2.19% 1.19% 1.19% 1.19%iPad ‐19.33% ‐16.88% ‐4.04% ‐7.00% ‐7.00% ‐7.00% ‐7.00% ‐7.00%Mac 8.89% ‐10.22% 4.15% 0.94% 0.94% 0.94% 0.94% 0.94%iPodTotal Unit Sales % Growth by Product 26.20% ‐35.46% 2.42% ‐3.87% ‐3.87% ‐4.87% ‐4.87% ‐4.87%

Apple IncIncome Statementin MillionsFiscal Years Ending Sept. 30 2015 2016 2017 2018E 2019E 2020E 2021E 2022ENet sales 233,715 215,639 229,234 239,490 250,486 258,709 267,406 276,600 Cost of sales 128,832 120,871 130,891 134,832 141,023 145,652 150,548 155,725 Depreciation & Amortization 11,257 10,505 10,157 14,044 15,027 16,079 17,204 18,408 Gross margin 93,626 84,263 88,186 90,615 94,437 96,979 99,653 102,467
Research & development expense 8,067 10,045 11,581 12,254 12,817 13,237 13,682 14,153 Selling, general & administrative expense 14,329 14,194 15,261 15,807 16,533 17,075 17,649 18,256 Total operating expenses 22,396 24,239 26,842 28,061 29,349 30,313 31,332 32,409
Operating income (loss) 71,230 60,024 61,344 62,554 65,088 66,666 68,322 70,058
Interest & dividend income 2,921 3,999 5,201 7,610 8,206 9,045 10,016 11,807 Interest expense (733) (1,456) (2,323) (4,617) (4,645) (4,849) (4,966) (5,256) Other income (expense), net (903) (1,195) (133) (682) (713) (737) (762) (788)Total Other income (expenses), net 1,285 1,348 2,745 2,311 2,847 3,460 4,288 5,763
Income (loss) before provision for Income Taxes 72,515 61,372 64,089 64,865 67,935 70,126 72,610 75,821
Provision for (benefit from) income taxes 19,121 15,685 15,738 12,532 10,190.24 10,518.83 10,891.55 11,373.22 Net Income (Loss) 53,394 45,687 48,351 52,333 57,745 59,607 61,719 64,448
Per share Basic 9.28 8.35 9.27 10.30 11.36 11.73 12.15 12.68 Cash dividends declared 1.98 2.18 2.40 2.68 2.96 3.05 3.16 3.30Weighted average shares Basic 5,753 5,471 5,217 5344 5281 5312 5296 5304
Total Shares outstanding (thousands) 5,579 5,336 5,126 5,082 5,082 5,082 5,082 5,082

Apple IncBalance Sheetin MillionsFiscal Years Ending Sept. 30 2015 2016 2017 2018E 2019E 2020E 2021E 2022EASSETSCash and cash equivalents 21,120 20,484 20,289 33,734 55,542 81,761 136,684 187,586 Short‐term marketable securities 20,481 46,671 53,892 55,417 56,985 58,598 60,256 61,962 Accounts receivable, less allowances 16,849 15,754 17,874 18,934 19,803 20,454 21,141 21,868 Inventories 2,349 2,132 4,855 3,018 3,156 3,260 3,369 3,485 Deferred Tax Asset 5,546 ‐ ‐ ‐ ‐ ‐ ‐ ‐ Vendor non‐trade receivables 13,494 13,545 17,799 16,812 17,584 18,161 18,772 19,417 Other current assets excluding vendor non‐trade receivable 9,539 8,283 13,936 11,205 11,719 12,104 12,511 12,941
Total current assets 89,378 106,869 128,645 139,120 164,790 194,338 252,734 307,259
Long‐term marketable securities 164,065 170,430 194,714 200,809 207,094 213,576 220,261 227,155 Property, plant and equipment, net 22,471 27,010 33,783 36,148 38,678 41,386 44,283 47,382 Goodwill 5,116 5,414 5,717 5,717 5,717 5,717 5,717 5,717 Acquired intangible assets, net 3,893 3,206 2,298 2,050 1,828 1,631 1,455 1,298 Other non‐current assets 5,422 8,757 10,162 10,365 10,573 10,784 11,000 11,220
Total Assets 290,345 321,686 375,319 394,209 428,680 467,432 535,449 600,031
LIABILITIESAccounts payable 35,490 37,294 49,049 61,293 63,602 54,329 56,155 58,086 Accrued expenses excluding deferred revenue 25,181 22,027 25,744 28,509 31,571 34,961 38,716 42,874 Deferred revenue 8,940 8,080 7,548 7,821 8,105 8,398 8,702 9,017 Commercial paper 8,499 8,105 11,977 12,316 12,664 13,023 13,391 13,770 Current portion of long‐term debt 2,500 3,500 6,496 8,863 9,220 7,750 10,297 5,517
Total current liabilities 80,610 79,006 100,814 118,802 125,162 118,461 127,262 129,265
Deferred revenue, non‐current 3,624 2,930 2,836 2,939 3,045 3,155 3,270 3,388 Long‐term debt 53,329 75,427 97,207 95,220 99,614 103,667 108,006 112,647 Deferred Tax Liabilities 24,062 26,019 31,504 20,504 9,504 4 1,504 3,004 Other non‐current liabilities 9,365 10,055 8,911 9,089 9,271 9,456 9,646 9,838
Total liabilities 170,990 193,437 241,272 246,554 246,596 234,744 249,687 258,143
STOCKHOLDER EQUITYCommon stock and additional paid‐in capital 27,416 31,251 35,867 40,873 46,577 53,078 60,485 68,927 Retained earnings 92,284 96,364 98,330 106,932 135,657 179,760 225,426 273,111 Accumulated other comprehensive income / loss (345) 634 (150) (150) (150) (150) (150) (150)
Total shareholders' equity 119,355 128,249 134,047 147,655 182,084 232,688 285,761 341,888
Total liabilities and shareholders' equity 290,345 321,686 375,319 394,209 428,680 467,432 535,449 600,031

Apple IncCash Flow Statementin MillionsFiscal Years Ending Sept. 30 2015 2016 2017Cash & cash equivalents, beginning of the year 13,844 21,120 20,484
Operating Activities:Net income (loss) 53,394 45,687 48,351 Adjustments to reconcile net income to cash generated by operating activities:
Depreciation & amortization 11,257 10,505 10,157 Share‐based compensation expense 3,586 4,210 4,840 Deferred income tax expense (benefit) 1,382 4,938 5,966 Other adjustments ‐ ‐ (166)
Changes in operating assets and liabilitiesAccounts receivable, net 611 1,095 (2,093) Inventories (238) 217 (2,723) Vendor non‐trade receivables (3,735) (51) (4,254) Other current & non‐current assets (179) 1,090 (5,318) Accounts payable 5,400 1,791 9,618 Deferred revenue 1,042 (1,554) (626) Other current & non‐current liabilities 8,746 (2,104) (154)
Cash Generated by operating Activities 81,266 65,824 63,598
Investing Activities:Purchases of marketable securities (166,402) (142,428) (159,486) Proceeds from maturities of marketable securities 14,538 21,258 31,775 Proceeds from sales of marketable securities 107,447 90,536 94,564 Purchases of other long‐term investments ‐ ‐ ‐ Payments made in connection with business acquisitions, net (343) (297) (329) Payment for acquisition of property, plant & equipment (11,247) (12,734) (12,451) Payment for acquisition of intangible assets (241) (814) (344) Payments for strategic investments ‐ (1,388) (395) Other cash flow from investing activities (26) (110) 220
Net cash flows from investing activities (56,274) (45,977) (46,446)
Financing Activities:Proceeds from issuance of common stock 543 495 555 Excess tax benefits from equity awards 749 407 627 Payments for taxes related to net share settlement of equity awards (1,499) (1,570) (1,874) Payments for dividends & dividend equivalent paid (11,561) (12,150) (12,769) Cash used to net share settle equity awards ‐ ‐ ‐ Repurchases of common stock (35,253) (29,722) (32,900) Proceeds from issuance of term debt, net 27,114 24,954 28,662 Repayments of term debt ‐ (2,500) (3,500) Change in commercial paper, net 2,191 (397) 3,852
Net cash flows from financing activities (17,716) (20,483) (17,347)
Increase (decrease) in cash & cash equivalents 7,276 (636) (195)
Cash & cash equivalents, end of the year 21,120 20,484 20,289

Apple IncCash Flow Statementin MillionsFiscal Years Ending Sept. 30 2018E 2019E 2020E 2021E 2022EOperating ActivitiesNet Income 52,333 57,745 59,607 61,719 64,448 Adjustments to reconcile net income to cashDepreciation and Amortization 14,044 15,027 16,079 17,204 18,408
Changes in Working Capital:Accounts Receivable, net (1,060) (869) (650) (688) (727) Inventories 1,837 (139) (104) (110) (116)Deferred Tax Asset ‐ ‐ ‐ ‐ ‐ Vendor non‐trade receivables 987 (772) (577) (610) (645)Other current assets 2,731 (514) (385) (407) (430)Other non‐current assets (203) (207) (211) (216) (220)Accounts Payable 12,244 2,309 (9,273) 1,826 1,931 Accrued expenses excluding deferred revenue 2,765 3,062 3,391 3,755 4,158 Deferred Revenue 273 283 294 304 315 Deferred Revenue, non‐current 103 106 110 114 118 Deferred Tax Liability (11,000) (11,000) (9,500) 1,500 1,500 Other non‐current liabilities 178 182 185 189 193 Total Change in Working Capital 8,855 (7,559) (16,720) 5,658 6,077
Net Cash Used by Operating Activities 75,232 65,212 58,965 84,581 88,934
Investing ActivitiesShort‐term Marketable Securities (1,525) (1,568) (1,613) (1,658) (1,705) Long‐term Marketable Securities (6,095) (6,285) (6,482) (6,685) (6,894) Change in Property, Plant, & Equipment, net (Capex) (16,408) (17,557) (18,786) (20,101) (21,508) Change in Acquired intangible assets, net 248 221 197 176 157 Change in Goodwill ‐ ‐ ‐ ‐ ‐
Net Cash Used by Investing Activities (23,780) (25,189) (26,683) (28,268) (29,950)
Financing ActivitiesIssuance (repayment) of commercial paper 339 349 358 369 379 Change in current‐portion of long‐term debt 2,367 357 (1,470) 2,547 (4,780) Issuance (repayment) of long‐term debt (1,987) 4,394 4,053 4,339 4,641 Change in common stock and APIC 5,006 5,704 6,500 7,408 8,442 Dividends Payed (13,731) (15,019) (15,504) (16,053) (16,763) Accumulated other comprehensive income / loss ‐ ‐ ‐ ‐ ‐ Issuance of SharesRepurchase of Shares (30,000) (14,000) ‐ ‐ ‐
Net Cash Used by Financing Activities (38,006) (18,216) (6,062) (1,390) (8,081)
Change in Cash 13,445 21,807 26,220 54,923 50,902 Beginning Cash 20,289 33,734 55,542 81,761 136,684 Ending Cash 33,734 55,542 81,761 136,684 187,586
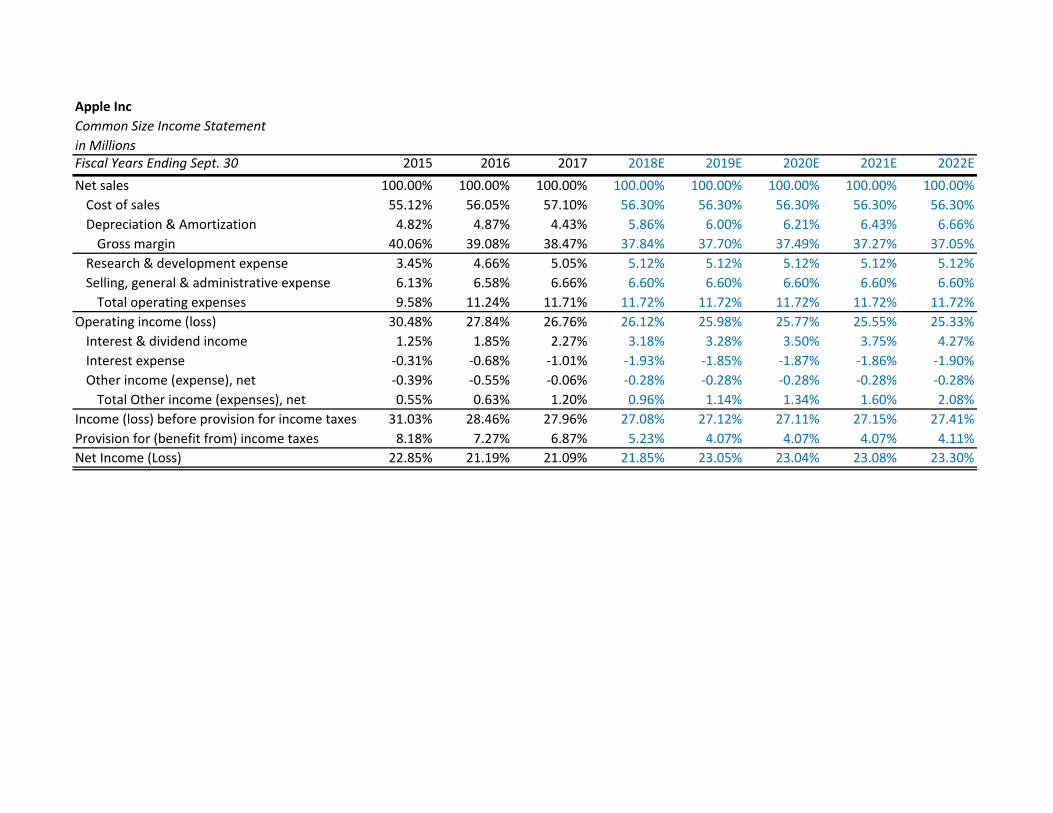
Apple IncCommon Size Income Statementin MillionsFiscal Years Ending Sept. 30 2015 2016 2017 2018E 2019E 2020E 2021E 2022ENet sales 100.00% 100.00% 100.00% 100.00% 100.00% 100.00% 100.00% 100.00%Cost of sales 55.12% 56.05% 57.10% 56.30% 56.30% 56.30% 56.30% 56.30%Depreciation & Amortization 4.82% 4.87% 4.43% 5.86% 6.00% 6.21% 6.43% 6.66%Gross margin 40.06% 39.08% 38.47% 37.84% 37.70% 37.49% 37.27% 37.05%
Research & development expense 3.45% 4.66% 5.05% 5.12% 5.12% 5.12% 5.12% 5.12%Selling, general & administrative expense 6.13% 6.58% 6.66% 6.60% 6.60% 6.60% 6.60% 6.60%Total operating expenses 9.58% 11.24% 11.71% 11.72% 11.72% 11.72% 11.72% 11.72%
Operating income (loss) 30.48% 27.84% 26.76% 26.12% 25.98% 25.77% 25.55% 25.33%Interest & dividend income 1.25% 1.85% 2.27% 3.18% 3.28% 3.50% 3.75% 4.27%Interest expense ‐0.31% ‐0.68% ‐1.01% ‐1.93% ‐1.85% ‐1.87% ‐1.86% ‐1.90%Other income (expense), net ‐0.39% ‐0.55% ‐0.06% ‐0.28% ‐0.28% ‐0.28% ‐0.28% ‐0.28%Total Other income (expenses), net 0.55% 0.63% 1.20% 0.96% 1.14% 1.34% 1.60% 2.08%
Income (loss) before provision for income taxes 31.03% 28.46% 27.96% 27.08% 27.12% 27.11% 27.15% 27.41%Provision for (benefit from) income taxes 8.18% 7.27% 6.87% 5.23% 4.07% 4.07% 4.07% 4.11%Net Income (Loss) 22.85% 21.19% 21.09% 21.85% 23.05% 23.04% 23.08% 23.30%

Apple IncCommon Size Balance SheetPercent of SalesFiscal Years Ending Sept. 30 2015 2016 2017 2018E 2019E 2020E 2021E 2022ENet Sales 233,715 215,639 229,234 239,490 250,486 258,709 267,406 276,600 ASSETSCash and cash equivalents 9.04% 9.50% 8.85% 14.09% 22.17% 31.60% 51.11% 67.82%Short‐term marketable securities 8.76% 21.64% 23.51% 23.14% 22.75% 22.65% 22.53% 22.40%Accounts receivable, less allowances 7.21% 7.31% 7.80% 7.91% 7.91% 7.91% 7.91% 7.91%Inventories 1.01% 0.99% 2.12% 1.26% 1.26% 1.26% 1.26% 1.26%Deferred Tax Asset 2.37% 0.00% 0.00% 0.00% 0.00% 0.00% 0.00% 0.00%Vendor non‐trade receivables 5.77% 6.28% 7.76% 7.02% 7.02% 7.02% 7.02% 7.02%Other current assets excluding vendor non‐trade receivables 4.08% 3.84% 6.08% 4.68% 4.68% 4.68% 4.68% 4.68%
Total current assets 38.24% 49.56% 56.12% 58.09% 65.79% 75.12% 94.51% 111.08%
Long‐term marketable securities 70.20% 79.03% 84.94% 83.85% 82.68% 82.55% 82.37% 82.12%Property, plant and equipment, net 9.61% 12.53% 14.74% 15.09% 15.44% 16.00% 16.56% 17.13%Goodwill 2.19% 2.51% 2.49% 2.39% 2.28% 2.21% 2.14% 2.07%Acquired intangible assets, net 1.67% 1.49% 1.00% 0.86% 0.73% 0.63% 0.54% 0.47%Other non‐current assets 2.32% 4.06% 4.43% 4.33% 4.22% 4.17% 4.11% 4.06%
Total Assets 124.23% 149.18% 163.73% 164.60% 171.14% 180.68% 200.24% 216.93%
LIABILITIESAccounts payable 15.19% 17.29% 21.40% 25.59% 25.39% 21.00% 21.00% 21.00%Accrued expenses excluding deferred revenue 10.77% 10.21% 11.23% 11.90% 12.60% 13.51% 14.48% 15.50%Deferred revenue 3.83% 3.75% 3.29% 3.27% 3.24% 3.25% 3.25% 3.26%Commercial paper 3.64% 3.76% 5.22% 5.14% 5.06% 5.03% 5.01% 4.98%Current portion of long‐term debt 1.07% 1.62% 2.83% 3.70% 3.68% 3.00% 3.85% 1.99%
Total current liabilities 34.49% 36.64% 43.98% 49.61% 49.97% 45.79% 47.59% 46.73%
Deferred revenue, non‐current 1.55% 1.36% 1.24% 1.23% 1.22% 1.22% 1.22% 1.22%Long‐term debt 22.82% 34.98% 42.41% 39.76% 39.77% 40.07% 40.39% 40.73%Deferred Tax Liabilities 10.30% 12.07% 13.74% 8.56% 3.79% 0.00% 0.56% 1.09%Other non‐current liabilities 4.01% 4.66% 3.89% 3.80% 3.70% 3.66% 3.61% 3.56%
Total liabilities 73.16% 89.70% 105.25% 102.95% 98.45% 90.74% 93.37% 93.33%
STOCKHOLDER EQUITYCommon stock and additional paid‐in capital 11.73% 14.49% 15.65% 17.07% 18.59% 20.52% 22.62% 24.92%Retained earnings 39.49% 44.69% 42.90% 44.65% 54.16% 69.48% 84.30% 98.74%Accumulated other comprehensive income / loss ‐0.15% 0.29% ‐0.07% ‐0.06% ‐0.06% ‐0.06% ‐0.06% ‐0.05%
Total shareholders' equity 51.07% 59.47% 58.48% 61.65% 72.69% 89.94% 106.86% 123.60%
Total liabilities and shareholders' equity 124.23% 149.18% 163.73% 164.60% 171.14% 180.68% 200.24% 216.93%
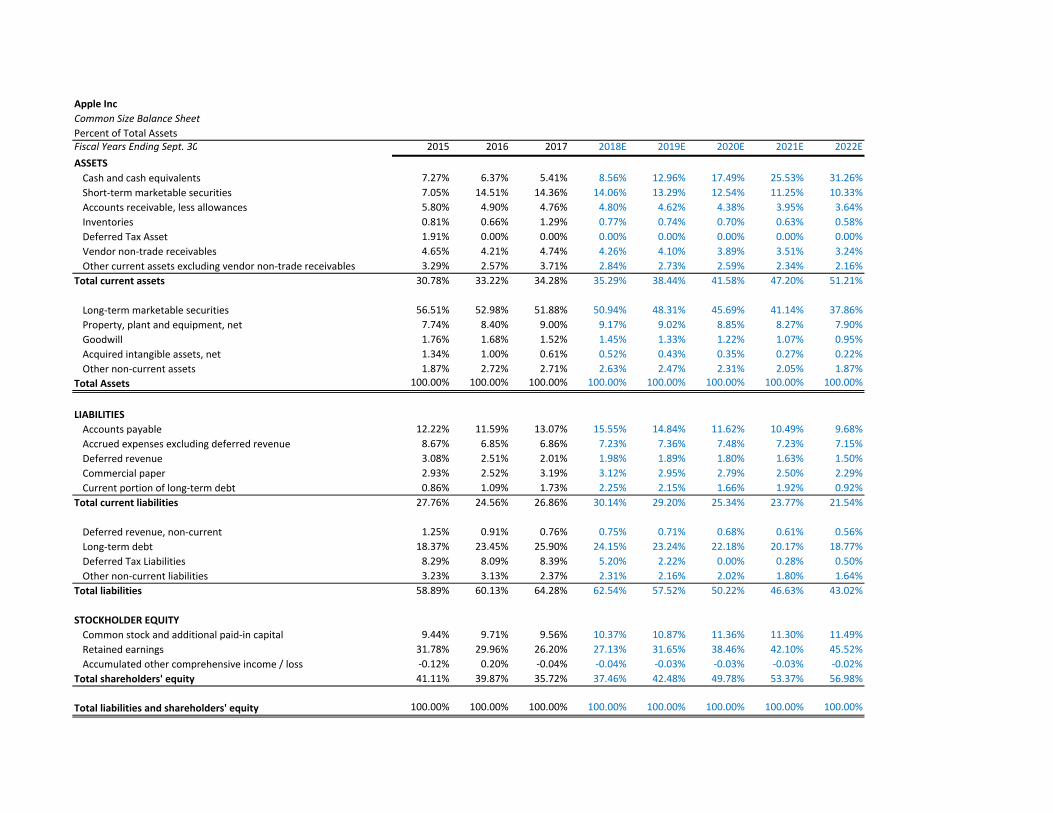
Apple IncCommon Size Balance SheetPercent of Total AssetsFiscal Years Ending Sept. 30 2015 2016 2017 2018E 2019E 2020E 2021E 2022EASSETSCash and cash equivalents 7.27% 6.37% 5.41% 8.56% 12.96% 17.49% 25.53% 31.26%Short‐term marketable securities 7.05% 14.51% 14.36% 14.06% 13.29% 12.54% 11.25% 10.33%Accounts receivable, less allowances 5.80% 4.90% 4.76% 4.80% 4.62% 4.38% 3.95% 3.64%Inventories 0.81% 0.66% 1.29% 0.77% 0.74% 0.70% 0.63% 0.58%Deferred Tax Asset 1.91% 0.00% 0.00% 0.00% 0.00% 0.00% 0.00% 0.00%Vendor non‐trade receivables 4.65% 4.21% 4.74% 4.26% 4.10% 3.89% 3.51% 3.24%Other current assets excluding vendor non‐trade receivables 3.29% 2.57% 3.71% 2.84% 2.73% 2.59% 2.34% 2.16%
Total current assets 30.78% 33.22% 34.28% 35.29% 38.44% 41.58% 47.20% 51.21%
Long‐term marketable securities 56.51% 52.98% 51.88% 50.94% 48.31% 45.69% 41.14% 37.86%Property, plant and equipment, net 7.74% 8.40% 9.00% 9.17% 9.02% 8.85% 8.27% 7.90%Goodwill 1.76% 1.68% 1.52% 1.45% 1.33% 1.22% 1.07% 0.95%Acquired intangible assets, net 1.34% 1.00% 0.61% 0.52% 0.43% 0.35% 0.27% 0.22%Other non‐current assets 1.87% 2.72% 2.71% 2.63% 2.47% 2.31% 2.05% 1.87%
Total Assets 100.00% 100.00% 100.00% 100.00% 100.00% 100.00% 100.00% 100.00%
LIABILITIESAccounts payable 12.22% 11.59% 13.07% 15.55% 14.84% 11.62% 10.49% 9.68%Accrued expenses excluding deferred revenue 8.67% 6.85% 6.86% 7.23% 7.36% 7.48% 7.23% 7.15%Deferred revenue 3.08% 2.51% 2.01% 1.98% 1.89% 1.80% 1.63% 1.50%Commercial paper 2.93% 2.52% 3.19% 3.12% 2.95% 2.79% 2.50% 2.29%Current portion of long‐term debt 0.86% 1.09% 1.73% 2.25% 2.15% 1.66% 1.92% 0.92%
Total current liabilities 27.76% 24.56% 26.86% 30.14% 29.20% 25.34% 23.77% 21.54%
Deferred revenue, non‐current 1.25% 0.91% 0.76% 0.75% 0.71% 0.68% 0.61% 0.56%Long‐term debt 18.37% 23.45% 25.90% 24.15% 23.24% 22.18% 20.17% 18.77%Deferred Tax Liabilities 8.29% 8.09% 8.39% 5.20% 2.22% 0.00% 0.28% 0.50%Other non‐current liabilities 3.23% 3.13% 2.37% 2.31% 2.16% 2.02% 1.80% 1.64%
Total liabilities 58.89% 60.13% 64.28% 62.54% 57.52% 50.22% 46.63% 43.02%
STOCKHOLDER EQUITYCommon stock and additional paid‐in capital 9.44% 9.71% 9.56% 10.37% 10.87% 11.36% 11.30% 11.49%Retained earnings 31.78% 29.96% 26.20% 27.13% 31.65% 38.46% 42.10% 45.52%Accumulated other comprehensive income / loss ‐0.12% 0.20% ‐0.04% ‐0.04% ‐0.03% ‐0.03% ‐0.03% ‐0.02%
Total shareholders' equity 41.11% 39.87% 35.72% 37.46% 42.48% 49.78% 53.37% 56.98%
Total liabilities and shareholders' equity 100.00% 100.00% 100.00% 100.00% 100.00% 100.00% 100.00% 100.00%

Apple IncValue Driver Estimation
Fiscal Years Ending Sept. 30 2015 2016 2017 2018E 2019E 2020E 2021E 2022CV
Net Operating Profit Less Adjusted Taxes (NOPLAT)Net Sales 233,715 215,639 229,234 239,490 250,486 258,709 267,406 276,600 Cost of Sales 128,832 120,871 130,891 134,832 141,023 145,652 150,548 155,725 Selling, General, Administrative Expense 14,329 14,194 15,261 15,807 16,533 17,075 17,649 18,256 Depreciation & Amortization 11,257 10,505 10,157 14,044 15,027 16,079 17,204 18,408 Research & Development Expense 8,067 10,045 11,581 12,254 12,817 13,237 13,682 14,153 Implied Interest on Operating Leases 167 209 254 315 315 315 315 315
EBITA 71,397 60,233 61,598 62,869 65,403 66,981 68,637 70,373
Less: Adjusted TaxesTotal Income Tax Provision 19,121 15,685 15,738 12,532 10,190 10,519 10,892 11,373 +Tax shield on Interest expense 193 372 571 892 697 727 745 788 +Tax shield on Other expense 238 305 33 132 107 111 114 118 ‐Tax on interest or Invetment income 770 1,022 1,277 1,470 1,231 1,357 1,502 1,771 +Tax Shield on Implied Lease Interest 44 53 62 61 47 47 47 47
Total adjusted taxes 18,826 15,394 15,126 12,146 9,810 10,047 10,296 10,556 Marginal Tax Rate 26.37% 25.56% 24.56% 19.32% 15.00% 15.00% 15.00% 15.00%
Plus: Change in Deferred TaxesDeferred Tax Liabilities 24,062 26,019 31,504 20,504 9,504 4 1,504 3,004 Deferred Tax Assets 5,546 ‐ ‐ ‐ ‐ ‐ ‐ ‐
Deferred Tax Liability (Asset) 18,516 26,019 31,504 20,504 9,504 4 1,504 3,004 Change in Deferred Taxes 2,575 7,503 5,485 (11,000) (11,000) (9,500) 1,500 1,500
NOPLAT: 55,146 52,342 51,957 39,723 44,592 47,434 59,841 61,317
Invested Capital (IC)Net Operating Working CapitalOperating Current Assets (CA)Normal Cash 16,056 14,814 15,748 16,453 17,208 17,773 18,371 19,002 Accounts Receivable, net 16,849 15,754 17,874 18,934 19,803 20,454 21,141 21,868 Inventory 2,349 2,132 4,855 3,018 3,156 3,260 3,369 3,485 Vendor non‐trade receivables 13,494 13,545 17,799 16,812 17,584 18,161 18,772 19,417 Other current operating assets 9,539 8,283 13,936 11,205 11,719 12,104 12,511 12,941
Total Operating CA 58,287 54,528 70,212 66,422 69,471 71,752 74,164 76,714
Non Interest‐Bearing Current Liabilities (CL)Accounts payable 35,490 37,294 49,049 61,293 63,602 54,329 56,155 58,086 Accrued expenses 25,181 22,027 25,744 28,509 31,571 34,961 38,716 42,874 Deferred revenue 8,940 8,080 7,548 7,821 8,105 8,398 8,702 9,017
Total Operating CL 69,611 67,401 82,341 97,623 103,277 97,688 103,574 109,978
Operating Working Capital (11,324) (12,873) (12,129) (31,201) (33,806) (25,936) (29,410) (33,264)
Plus: Net Property, Plant, & Equipment (PPE) 22,471 27,010 33,783 36,148 38,678 41,386 44,283 47,382
Plus: Net Other Operating Assets (net depreciation or amortization)Net Intangible Assets (non‐goodwill) 3,893 3,206 2,298 2,050 1,828 1,631 1,455 1,298 Other non‐current assets 5,422 8,757 10,162 10,365 10,573 10,784 11,000 11,220 Capitalized PV of Operating Leases 4,195 5,226 6,358 7,659 9,226 11,114 13,388 16,127
Total Net Other Operating Assets 13,510 17,189 18,818 20,074 21,627 23,529 25,842 28,644
Less: Other Operating LiabilitiesDeferred revenue (Long‐term) 3,624 2,930 2,836 2,939 3,045 3,155 3,270 3,388 Warranty liabilities (long‐term) 4,780 3,702 3,834 3,835 3,836 3,837 3,838 3,839
Total Other Operating Liabilities 8,404 6,632 6,670 6,774 6,881 6,992 7,108 7,227
Invested Capital 16,254 24,694 33,803 18,247 19,618 31,986 33,608 35,536
Core Value Drivers
ROIC CalculationNOPLAT 55,146 52,342 51,957 39,723 44,592 47,434 59,841 61,317 Beginning Invested Capital 19,849 16,254 24,694 33,803 18,247 19,618 31,986 33,608 ROIC 277.83% 322.03% 210.40% 117.51% 244.39% 241.79% 187.09% 182.45%
FCF CalculationNOPLAT 55,146 52,342 51,957 39,723 44,592 47,434 59,841 61,317 Change in Invested Capital (3,595) 8,440 9,109 (15,556) 1,371 12,367 1,622 1,928 FCF 58,742 43,901 42,848 55,279 43,221 35,066 58,219 59,389
Economic Profit (EP) CalculationBeginning Invested Capital 19,849 16,254 24,694 33,803 18,247 19,618 31,986 33,608 (ROIC ‐ WACC) 269.22% 313.42% 201.79% 108.90% 235.78% 233.18% 178.48% 173.85%EP 53,437 50,942 49,830 36,812 43,022 45,746 57,089 58,426
Apple IncWeighted Average Cost of Capital (WACC) Estimation
CAPM 2018 2019+Cost of Equity (Re)Risk‐free Rate 3.03% 3.03%Market Risk premium 5.04% 5.04%Beta 1.24 1.24 Cost of Equity 9.28% 9.28%
Equity Weight (M) 894,370.58 894,370.58
Cost of Debt (Rd)Cost of Debt 3.99% 3.99%Marginal Tax Rate 19.32% 15.00%After‐Tax Cost of Debt 3.22% 3.39%
Debt Weight (M) 111,976.14 116,727.05
MV Value of Firm (M) 1,006,346.72 1,011,097.63
WACC 8.61% 8.60%

Apple IncDiscounted Cash Flow (DCF) and Economic Profit (EP) Valuation Models
Key Inputs: 2018E 2019E+ CV Growth 2.00% CV ROIC 182.45% WACC 8.61% 8.60% Cost of Equity 9.28%
Fiscal Years Ending Sept. 30 2018E 2019E 2020E 2021E 2022CV
DCF ModelNOPLAT 39,723 44,592 47,434 59,841 61,317 Beginning Invested Capital 33,803 18,247 19,618 31,986 33,608 Ending Invested Capital 18,247 19,618 31,986 33,608 ‐ Capital Expenditures (15,556) 1,371 12,367 1,622 1,928 FCF 55,279 43,221 35,066 58,219 59,389 CV 918,254
FCF 55,279 43,221 35,066 58,219 918,254 PV 50,896 36,644 27,375 41,848 660,045
Value of Operating Assets 816,808 + Normal Cash 13,103 check this, maybe it should be cash ‐ normal cash in d+ Short‐term Marketable Securities 55,417 + Long‐term Marketable Securities 200,809 ‐ Current Portion Long‐term Debt 8,863 ‐ Long‐term Debt 95,220 ‐ PV of Operating Leases 7,893
Value of Equity 974,161 Shares Outstanding 5,082 Intrinsic Value of Apple 191.70$
EP ModelNOPLAT 39,723 44,592 47,434 59,841 61,317 Beginning IC 33,803 18,247 19,618 31,986 33,608 ROIC 118% 244% 242% 187% 182%WACC 8.61% 8.61% 8.61% 8.61% 8.61%EP 36,812 43,022 45,746 57,089 58,426 CV 884,647
EP 36,812 43,022 45,746 57,089 884,647 PV 33,894 36,475 35,712 41,036 635,887
Value of Operating Assets 816,807 + Normal Cash 13,103 + Short‐term Marketable Securities 55,417 + Long‐term Marketable Securities 200,809 ‐ Current Portion Long‐term Debt 8,863 ‐ Long‐term Debt 95,220 ‐ PV of Operating Leases 7,893
Value of Equity 974,160 Shares Outstanding 5,082 Intrinsic Value of Apple 191.70$
Partial‐Year Adjusted Price $199.79
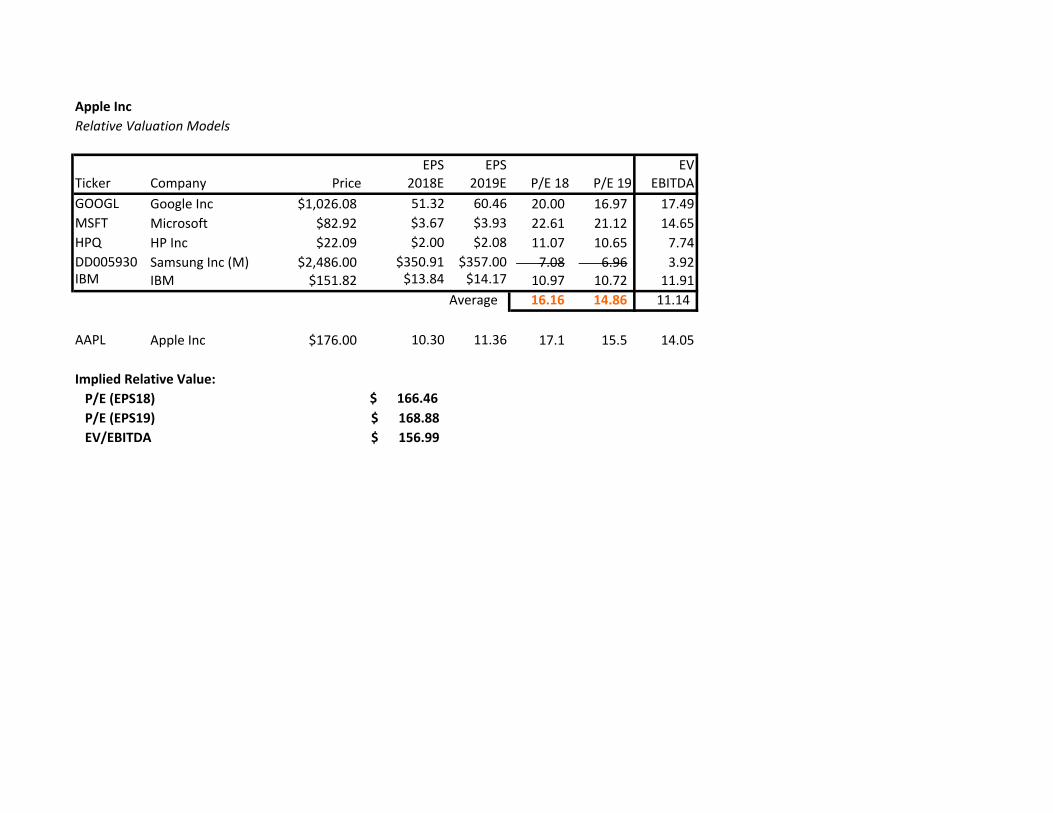
Apple IncRelative Valuation Models
EPS EPS EVTicker Company Price 2018E 2019E P/E 18 P/E 19 EBITDAGOOGL Google Inc $1,026.08 51.32 60.46 20.00 16.97 17.49MSFT Microsoft $82.92 $3.67 $3.93 22.61 21.12 14.65HPQ HP Inc $22.09 $2.00 $2.08 11.07 10.65 7.74DD005930 Samsung Inc (M) $2,486.00 $350.91 $357.00 7.08 6.96 3.92IBM IBM $151.82 $13.84 $14.17 10.97 10.72 11.91
Average 16.16 14.86 11.14
AAPL Apple Inc $176.00 10.30 11.36 17.1 15.5 14.05
Implied Relative Value: P/E (EPS18) $ 166.46 P/E (EPS19) 168.88$ EV/EBITDA 156.99$
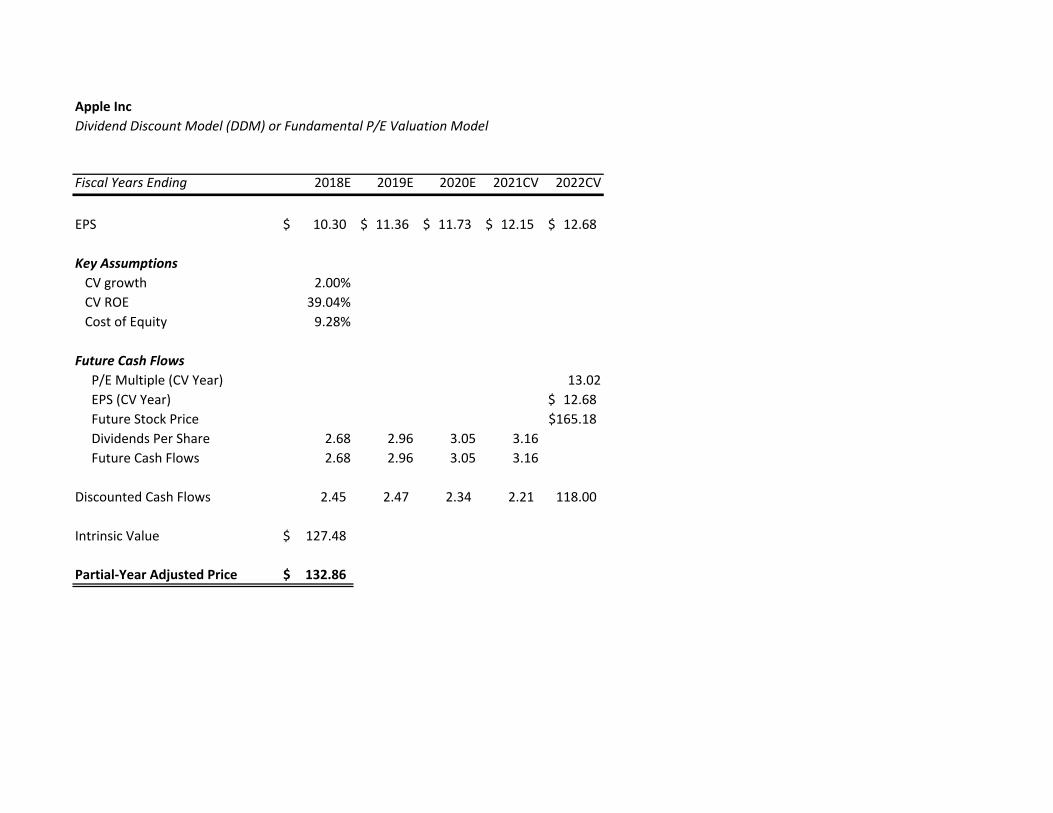
Apple IncDividend Discount Model (DDM) or Fundamental P/E Valuation Model
Fiscal Years Ending 2018E 2019E 2020E 2021CV 2022CV
EPS 10.30$ 11.36$ 11.73$ 12.15$ 12.68$
Key Assumptions CV growth 2.00% CV ROE 39.04% check this out Cost of Equity 9.28%
Future Cash Flows P/E Multiple (CV Year) 13.02 EPS (CV Year) 12.68$ Future Stock Price $165.18 Dividends Per Share 2.68 2.96 3.05 3.16 3.30 Future Cash Flows 2.68 2.96 3.05 3.16 3.13
Discounted Cash Flows 2.45 2.47 2.34 2.21 118.00
Intrinsic Value 127.48$ ask todd to make sure we are discounting back
Partial‐Year Adjusted Price 132.86$

Apple IncKey Management Ratios
Fiscal Years Ending 2018 Equations 2015 2016 2017 2018E 2019E 2020E 2021E 2022CV
Liquidity RatiosCurrent Ratio Current Assets/Current Liabilities 1.11 1.35 1.28 1.17 1.32 1.64 1.99 2.38 Quick Ratio (Cash + Other Liquid Assets)/Current Liab. 1.01 1.33 1.23 1.15 1.29 1.61 1.96 2.35 Operating Cash Flow Ratio Cash Flow from Operations/Current Liab. 1.01 0.83 0.63 0.63 0.52 0.50 0.66 0.69
Activity or Asset‐Management RatiosAsset Turnover Ratio Revenue/Total Assets 0.80 0.67 0.61 0.61 0.58 0.55 0.50 0.46 Receivables Turnover 365/(Revenues/Receivables) 47.39 49.59 56.80 54.48 54.48 54.48 54.48 54.48 Inventory Turnover COGS/Inventories 54.85 56.69 26.96 44.68 44.68 44.68 44.68 44.68
Financial Leverage RatiosDebt/Equity Total Debt/Total Equity 53.90% 67.86% 86.30% 78.83% 66.73% 53.48% 46.09% 38.59%Debt Ratio (Total Liab./Total Assets) 58.89% 60.13% 64.28% 62.54% 57.52% 50.22% 46.63% 43.02%Equity Ratio (Total Equity/Total Assets) 41.11% 39.87% 35.72% 37.46% 42.48% 49.78% 53.37% 56.98%
Profitability RatiosGross Margin (Gross Profit/Revenues) 40.06% 39.08% 38.47% 37.84% 37.70% 37.49% 37.27% 37.05%Profit Margin (EBITA/Revenues) 30.55% 27.93% 26.87% 26.25% 26.11% 25.89% 25.67% 25.44%ROA (Net Income/Avg Total Assets) 20.45% 14.93% 13.87% 13.60% 14.03% 13.30% 12.31% 11.35%ROE (Net Income/Beg Equity) 47.87% 38.28% 37.70% 39.04% 39.11% 32.74% 26.52% 22.55%
Payout Policy RatiosDividend Payout Ratio (Dividend per Share/ EPS) 21.34% 26.11% 25.89% 26.01% 26.01% 26.01% 26.01% 26.01%EPS Net Income/Shares Outstanding 9.57 8.56 9.43 10.30 11.36 11.73 12.15 12.68Total Payout Ratio (Dividends + Repurchases) / Net Income 86.71% 90.52% 93.49% 83.34% 50.25% 26.01% 26.01% 26.01%
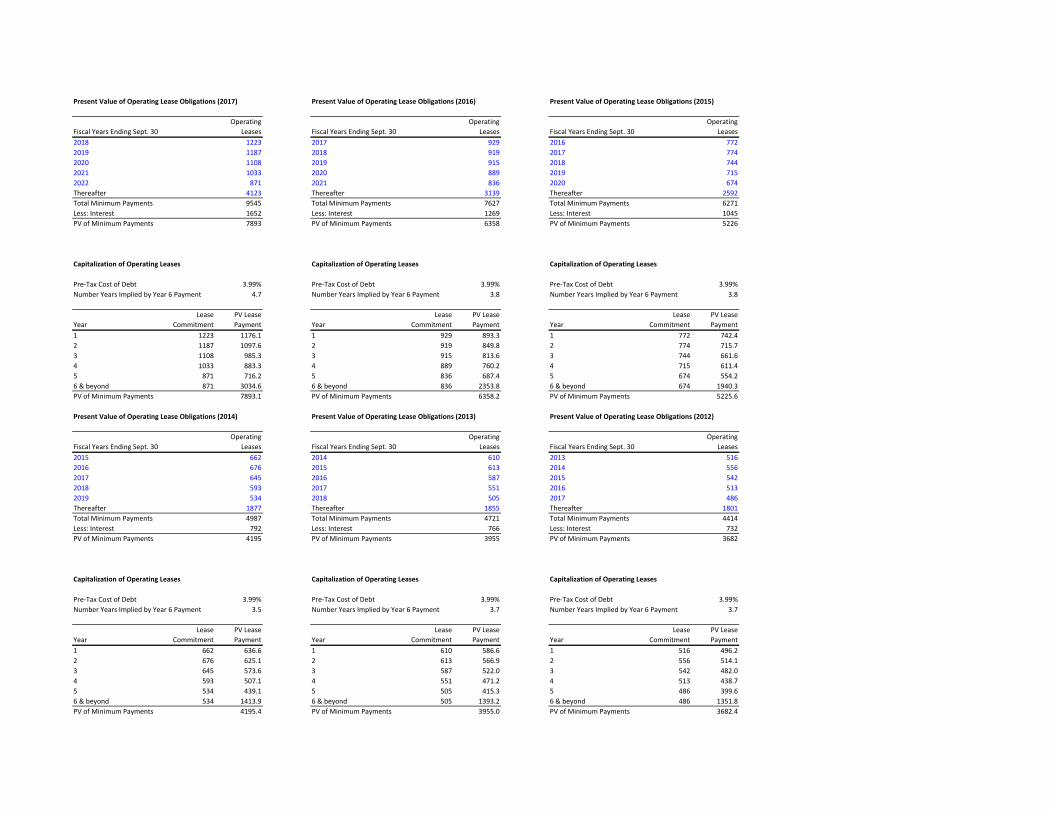
Present Value of Operating Lease Obligations (2017) Present Value of Operating Lease Obligations (2016) Present Value of Operating Lease Obligations (2015)
Operating Operating OperatingFiscal Years Ending Sept. 30 Leases Fiscal Years Ending Sept. 30 Leases Fiscal Years Ending Sept. 30 Leases2018 1223 2017 929 2016 7722019 1187 2018 919 2017 7742020 1108 2019 915 2018 7442021 1033 2020 889 2019 7152022 871 2021 836 2020 674Thereafter 4123 Thereafter 3139 Thereafter 2592Total Minimum Payments 9545 Total Minimum Payments 7627 Total Minimum Payments 6271Less: Interest 1652 Less: Interest 1269 Less: Interest 1045PV of Minimum Payments 7893 PV of Minimum Payments 6358 PV of Minimum Payments 5226
Capitalization of Operating Leases Capitalization of Operating Leases Capitalization of Operating Leases
Pre‐Tax Cost of Debt 3.99% Pre‐Tax Cost of Debt 3.99% Pre‐Tax Cost of Debt 3.99%Number Years Implied by Year 6 Payment 4.7 Number Years Implied by Year 6 Payment 3.8 Number Years Implied by Year 6 Payment 3.8
Lease PV Lease Lease PV Lease Lease PV LeaseYear Commitment Payment Year Commitment Payment Year Commitment Payment1 1223 1176.1 1 929 893.3 1 772 742.42 1187 1097.6 2 919 849.8 2 774 715.73 1108 985.3 3 915 813.6 3 744 661.64 1033 883.3 4 889 760.2 4 715 611.45 871 716.2 5 836 687.4 5 674 554.26 & beyond 871 3034.6 6 & beyond 836 2353.8 6 & beyond 674 1940.3PV of Minimum Payments 7893.1 PV of Minimum Payments 6358.2 PV of Minimum Payments 5225.6
Present Value of Operating Lease Obligations (2014) Present Value of Operating Lease Obligations (2013) Present Value of Operating Lease Obligations (2012)
Operating Operating OperatingFiscal Years Ending Sept. 30 Leases Fiscal Years Ending Sept. 30 Leases Fiscal Years Ending Sept. 30 Leases2015 662 2014 610 2013 5162016 676 2015 613 2014 5562017 645 2016 587 2015 5422018 593 2017 551 2016 5132019 534 2018 505 2017 486Thereafter 1877 Thereafter 1855 Thereafter 1801Total Minimum Payments 4987 Total Minimum Payments 4721 Total Minimum Payments 4414Less: Interest 792 Less: Interest 766 Less: Interest 732PV of Minimum Payments 4195 PV of Minimum Payments 3955 PV of Minimum Payments 3682
Capitalization of Operating Leases Capitalization of Operating Leases Capitalization of Operating Leases
Pre‐Tax Cost of Debt 3.99% Pre‐Tax Cost of Debt 3.99% Pre‐Tax Cost of Debt 3.99%Number Years Implied by Year 6 Payment 3.5 Number Years Implied by Year 6 Payment 3.7 Number Years Implied by Year 6 Payment 3.7
Lease PV Lease Lease PV Lease Lease PV LeaseYear Commitment Payment Year Commitment Payment Year Commitment Payment1 662 636.6 1 610 586.6 1 516 496.22 676 625.1 2 613 566.9 2 556 514.13 645 573.6 3 587 522.0 3 542 482.04 593 507.1 4 551 471.2 4 513 438.75 534 439.1 5 505 415.3 5 486 399.66 & beyond 534 1413.9 6 & beyond 505 1393.2 6 & beyond 486 1351.8PV of Minimum Payments 4195.4 PV of Minimum Payments 3955.0 PV of Minimum Payments 3682.4

VALUATION OF OPTIONS GRANTED IN ESOP
Ticker Symbol AAPLCurrent Stock Price $176.00Risk Free Rate 3.03%Current Dividend Yield 1.36%Annualized St. Dev. of Stock Returns 25.98%
in thousandsAverage Average B‐S Value
Range of Number Exercise Remaining Option of OptionsOutstanding Options of Shares Price Life (yrs) Price GrantedRange 1Range 2Range 3Total 0 ‐$ 0.00 ‐$ ‐$

Effects of ESOP Exercise and Share Repurchases on Common Stock Balance Sheet Account and Number of Shares Outstanding
Number of Options Outstanding (shares): 0Average Time to Maturity (years): 0.00Expected Annual Number of Options Exercised: 0
Current Average Strike Price: ‐$ Cost of Equity: 8.61%Current Stock Price: $176.00
2018E 2019E 2020E 2021E 2022EIncrease in Shares Outstanding: 0 0 0 0 0Average Strike Price: ‐$ ‐$ ‐$ ‐$ ‐$ Increase in Common Stock Account: ‐ ‐ ‐ ‐ ‐
Change in Treasury Stock (thousands) 8,800 8,800 8,800 8,800 8,800Expected Price of Repurchased Shares: 176.00$ 191.15$ 207.61$ 225.49$ 244.90$ Number of Shares Repurchased: 50 46 42 39 36
Shares Outstanding (beginning of the year) 5,126 5,082 5,082 5,082 5,082Plus: Shares Issued Through ESOP 0 0 0 0 0Less: Shares Repurchased in Treasury 45 ‐ ‐ ‐ ‐ Shares Outstanding (end of the year) 5,082 5,082 5,082 5,082 5,082
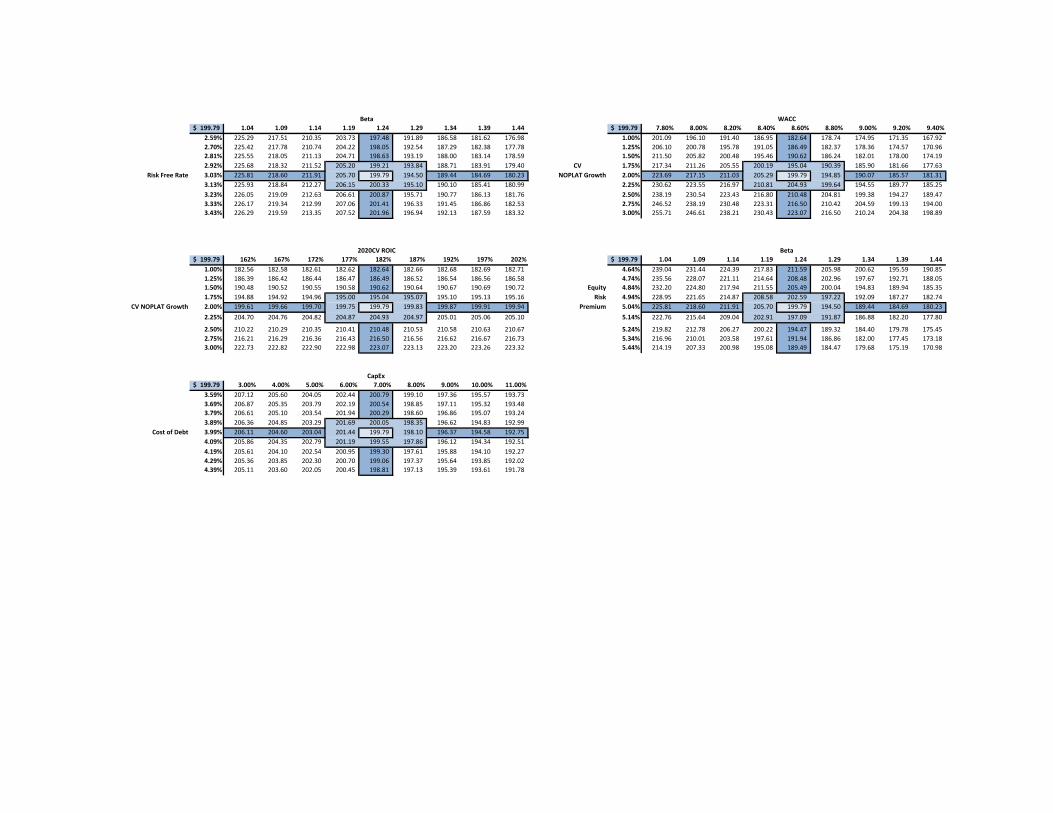
Beta WACC199.79$ 1.04 1.09 1.14 1.19 1.24 1.29 1.34 1.39 1.44 199.79$ 7.80% 8.00% 8.20% 8.40% 8.60% 8.80% 9.00% 9.20% 9.40%2.59% 225.29 217.51 210.35 203.73 197.48 191.89 186.58 181.62 176.98 1.00% 201.09 196.10 191.40 186.95 182.64 178.74 174.95 171.35 167.92 2.70% 225.42 217.78 210.74 204.22 198.05 192.54 187.29 182.38 177.78 1.25% 206.10 200.78 195.78 191.05 186.49 182.37 178.36 174.57 170.96 2.81% 225.55 218.05 211.13 204.71 198.63 193.19 188.00 183.14 178.59 1.50% 211.50 205.82 200.48 195.46 190.62 186.24 182.01 178.00 174.19 2.92% 225.68 218.32 211.52 205.20 199.21 193.84 188.71 183.91 179.40 CV 1.75% 217.34 211.26 205.55 200.19 195.04 190.39 185.90 181.66 177.63
Risk Free Rate 3.03% 225.81 218.60 211.91 205.70 199.79 194.50 189.44 184.69 180.23 NOPLAT Growth 2.00% 223.69 217.15 211.03 205.29 199.79 194.85 190.07 185.57 181.31 3.13% 225.93 218.84 212.27 206.15 200.33 195.10 190.10 185.41 180.99 2.25% 230.62 223.55 216.97 210.81 204.93 199.64 194.55 189.77 185.25 3.23% 226.05 219.09 212.63 206.61 200.87 195.71 190.77 186.13 181.76 2.50% 238.19 230.54 223.43 216.80 210.48 204.81 199.38 194.27 189.47 3.33% 226.17 219.34 212.99 207.06 201.41 196.33 191.45 186.86 182.53 2.75% 246.52 238.19 230.48 223.31 216.50 210.42 204.59 199.13 194.00 3.43% 226.29 219.59 213.35 207.52 201.96 196.94 192.13 187.59 183.32 3.00% 255.71 246.61 238.21 230.43 223.07 216.50 210.24 204.38 198.89
2020CV ROIC Beta 199.79$ 162% 167% 172% 177% 182% 187% 192% 197% 202% 199.79$ 1.04 1.09 1.14 1.19 1.24 1.29 1.34 1.39 1.44 1.00% 182.56 182.58 182.61 182.62 182.64 182.66 182.68 182.69 182.71 4.64% 239.04 231.44 224.39 217.83 211.59 205.98 200.62 195.59 190.85 1.25% 186.39 186.42 186.44 186.47 186.49 186.52 186.54 186.56 186.58 4.74% 235.56 228.07 221.11 214.64 208.48 202.96 197.67 192.71 188.05 1.50% 190.48 190.52 190.55 190.58 190.62 190.64 190.67 190.69 190.72 Equity 4.84% 232.20 224.80 217.94 211.55 205.49 200.04 194.83 189.94 185.35 1.75% 194.88 194.92 194.96 195.00 195.04 195.07 195.10 195.13 195.16 Risk 4.94% 228.95 221.65 214.87 208.58 202.59 197.22 192.09 187.27 182.74
CV NOPLAT Growth 2.00% 199.61 199.66 199.70 199.75 199.79 199.83 199.87 199.91 199.94 Premium 5.04% 225.81 218.60 211.91 205.70 199.79 194.50 189.44 184.69 180.23 2.25% 204.70 204.76 204.82 204.87 204.93 204.97 205.01 205.06 205.10 5.14% 222.76 215.64 209.04 202.91 197.09 191.87 186.88 182.20 177.80
2.50% 210.22 210.29 210.35 210.41 210.48 210.53 210.58 210.63 210.67 5.24% 219.82 212.78 206.27 200.22 194.47 189.32 184.40 179.78 175.45 2.75% 216.21 216.29 216.36 216.43 216.50 216.56 216.62 216.67 216.73 5.34% 216.96 210.01 203.58 197.61 191.94 186.86 182.00 177.45 173.18 3.00% 222.73 222.82 222.90 222.98 223.07 223.13 223.20 223.26 223.32 5.44% 214.19 207.33 200.98 195.08 189.49 184.47 179.68 175.19 170.98
CapEx199.79$ 3.00% 4.00% 5.00% 6.00% 7.00% 8.00% 9.00% 10.00% 11.00%3.59% 207.12 205.60 204.05 202.44 200.79 199.10 197.36 195.57 193.73 3.69% 206.87 205.35 203.79 202.19 200.54 198.85 197.11 195.32 193.48 3.79% 206.61 205.10 203.54 201.94 200.29 198.60 196.86 195.07 193.24 3.89% 206.36 204.85 203.29 201.69 200.05 198.35 196.62 194.83 192.99
Cost of Debt 3.99% 206.11 204.60 203.04 201.44 199.79 198.10 196.37 194.58 192.75 4.09% 205.86 204.35 202.79 201.19 199.55 197.86 196.12 194.34 192.51 4.19% 205.61 204.10 202.54 200.95 199.30 197.61 195.88 194.10 192.27 4.29% 205.36 203.85 202.30 200.70 199.06 197.37 195.64 193.85 192.02 4.39% 205.11 203.60 202.05 200.45 198.81 197.13 195.39 193.61 191.78