klamath-trinity jusd - sarconline.orgsarconline.org/sarcpdfs/7/12629016007991.pdf · disclosing...
TRANSCRIPT

our teachers
our school
our message
Klamath-Trinity JUSD
Trinity Valley Elementary
School2014-15
School Accountability Report Card
Published in 2015-16
Jon Ray, Superintendent • [email protected] • Phone: (530) 625-5600
Klamath-Trinity Joint Unified School District • 365 Loop Road Hoopa, CA 95546 • www.ktjusd.k12.ca.us
District Name • District Address City, CA Zip • [email protected] • Phone: (000) 000-0000
Sandra Moon Principal
730 North Highway 96 Willow Creek, CA 95573
Grades: TK-8 Phone: (530) 625-5600
http://tves.ktjusd.k12.ca.us
CDS Code: 12-62901-6007991
Jon Ray, Superintendent • [email protected] • Phone: (530) 625-5600
Klamath-Trinity Joint Unified • District Address City, CA Zip • www.ktjusd.k12.ca.us
2014-15 School Accountability Report Card • Published by School Innovations & Achievement • www.sia-us.com
3Trinity Valley Elementary SchoolSARC
Principal’s MessageTrinity Valley Elementary School is nestled in the mountains of Northern California, with the Trinity River flows just a quarter-of-a-mile away from campus. Trinity Valley students enjoy being part of the small rural community of Willow Creek. Here, all students succeed in learning, and all students, parents, teachers and staff members work diligently to achieve their goals. All members of the school community love learning and challenge themselves to reach their highest potential. As you walk around campus, students can be observed successfully using the skills, attitudes and behaviors they have learned to effectively deal with other students in social experiences. They value diversity and are major contributors to the school climate of responsibility, respectfulness and safety. The school is a safe, happy learning community for these young citizens. In all classrooms, students are strategic learners who think consciously about what they see, hear, read, write and create.
Students are actively engaged in their learning as it relates to their environment and personal experiences. Most of our students master basic skills and grade-level standards because teachers skillfully differentiate for all learning profiles and practice proven innovative approaches to learning. Trinity Valley is a comprehensive TK-8 elementary school providing a stimulating, quality educational program for 208 students. Staff members are committed to creating and maintaining an environment where students can grow physically, emotionally and intellectually into healthy, contributing citizens. This School Accountability Report Card (SARC) presents to the community an overview of Trinity Valley and programs it offers. State reporting requirements include disclosing information regarding subgroups such as English language learners, socioeconomically disad-vantaged students, students with disabilities, migrant students and students in significant ethnic subgroups. A profile of Trinity Valley’s enrollment, as defined by these subgroups, is provided to create an appropriate context for evaluating the overall success of the school’s educational program.
Board of TrusteesBetty Eichelberger, Board Chair
Kerry Watty, Clerk
Laura Lee George, Trustee
Annelia Hillman, Trustee
Darlene Magee, Trustee
Lois Risling, Trustee
Rob Wild, Trustee
School Accountability Report Card
In accordance with state and federal requirements, the School Accountability
Report Card (SARC) is put forth annually by all public schools as a tool
for parents and interested parties to stay informed of the school’s progress, test
scores and achievements.
District Mission StatementThe Klamath-Trinity Joint Unified
School District values quality education that nurtures student self-knowledge,
fosters intellectual and emotional growth, promotes physical well-being, and
cultivates lifelong learning.
Parental InvolvementParents and the community are very supportive of the educational programs at Trinity Valley Elementary School (TVES). They have made generous contributions of time and money to numerous programs and ac-tivities. In conjunction with the School Site Council (SSC) and Parent Teacher Organization (PTO), the school provides many opportunities for parents to be connected to their student’s daily educational life. SSC offers parents a chance to be part of an official decision-making group that oversees an annual budget of more than $100,000. PTO fundraisers enable the school to offer programs in art, music and literacy. Parents enrich classroom learning experiences through donations that support assemblies and field trips, and they also purchase instructional supplies. The parent groups promote and organize activities throughout the year. For more information on how to become involved, please contact PTO President Libby Pinto at (707) 601-6232.
School Mission StatementStaff members are committed to creating and maintaining an environment where students can grow physi-cally, emotionally and intellectually into healthy, contributing citizens.
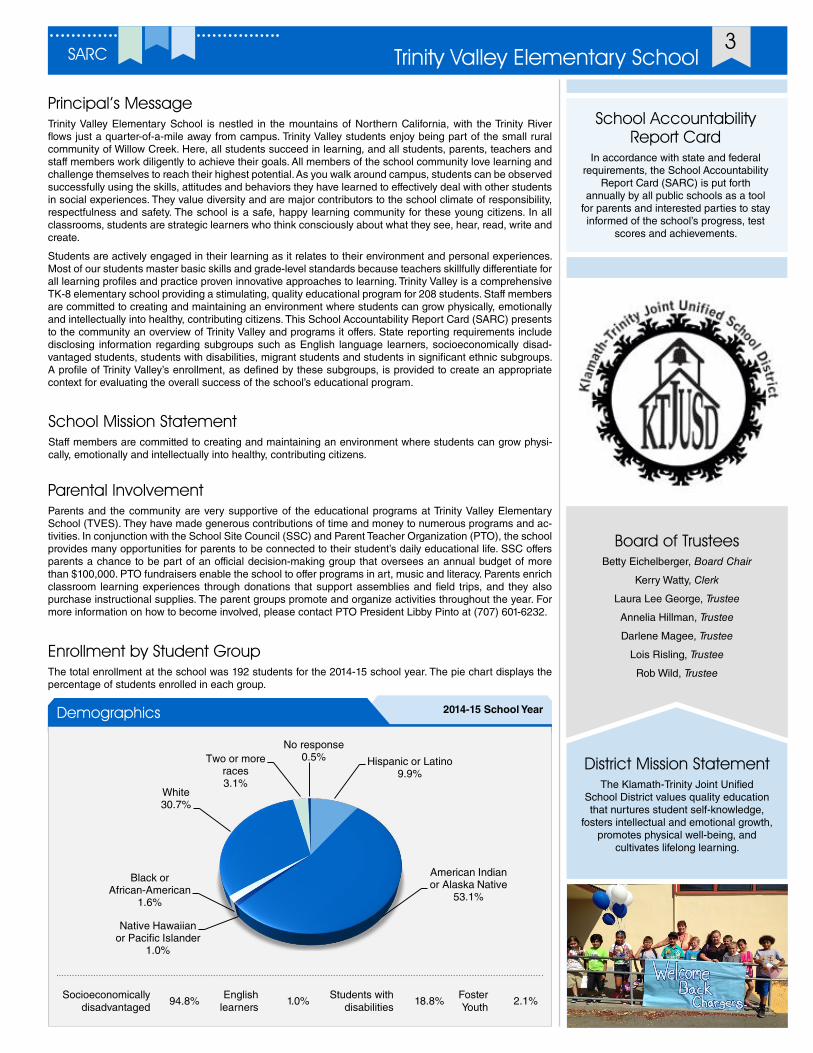
Enrollment by Student GroupThe total enrollment at the school was 192 students for the 2014-15 school year. The pie chart displays the percentage of students enrolled in each group.
2014-15 School YearDemographics
Socioeconomically disadvantaged
94.8%English
learners1.0%
Students with disabilities
18.8%Foster Youth
2.1%
Hispanic or Latino9.9%
American Indian or Alaska Native
53.1%
Native Hawaiian or Pacific Islander
1.0%
Black or African-American
1.6%
White30.7%
Two or more races3.1%
No response 0.5%

4
Suspensions and ExpulsionsThis table shows the school, district, and state suspension and expulsion rates for the most recent three-year period. Note: Students are only counted one time, regardless of the number of suspensions.
Suspension and Expulsion Rates
Trinity Valley ES
12-13 13-14 14-15
Suspension rates 0.0% 0.0% 0.0%
Expulsion rates 0.0% 0.0% 0.0%
KTJUSD
12-13 13-14 14-15
Suspension rates 7.1% 10.4% 3.1%
Expulsion rates 0.0% 0.0% 0.0%
California
12-13 13-14 14-15
Suspension rates 5.1% 4.4% 3.8%
Expulsion rates 0.1% 0.1% 0.1%
Three-Year DataNumber of Classrooms by Size
2012-13 2013-14 2014-15
GradeNumber of Students
1-20 21-32 33+ 1-20 21-32 33+ 1-20 21-32 33+
K 1 1 1
1 1 1 1 1
2 1 1 1 1 1
3 1 1 1 1
4 2 2 1
5 2 2 1
6 1 2 3 1
SubjectNumber of Students
1-22 23-32 33+ 1-22 23-32 33+ 1-22 23-32 33+
English language arts 1
Mathematics 1
Science 1
History/social science 1
Class Size DistributionThe bar graphs display the three-year data for average class size and the table displays the three-year data for the number of classrooms by size.
Three-Year DataAverage Class Size
13-1412-13 14-15
K 1 2 3 4 5 6
19
15
11 12 11 11
15
20
1613
18
10 10
6
2325
22
18
2224
18
English languagearts
Mathematics Science History/socialscience
18 18 18 18
Enrollment by GradeThe bar graph displays the total number of students enrolled in each grade for the 2014-15 school year.
2014-15 Enrollment by Grade
K
1
2
3
4
5
6
7
8
20
25
18
24
23
20
20
19
23

5Trinity Valley Elementary SchoolSARC
Federal Intervention ProgramSchools and districts receiving Title I funding that fail to meet AYP over two consecutive years in the same content area (English language arts or mathematics) or on the same indicator enter into Program Improve-ment (PI). Each additional year that the district or school(s) do not meet AYP results in advancement to the next level of intervention. The percentage of schools identified for Program Improvement is calculated by taking the number of schools currently in PI within the district and dividing it by the total number of Title I schools within the district.
This table displays the 2015-16 Program Improvement status for the school and district. For detailed informa-tion about PI identification, please visit www.cde.ca.gov/ta/ac/ay/tidetermine.asp.
2015-16 School YearFederal Intervention Program
Trinity Valley ES KTJUSD
Program Improvement status In PI In PI
First year of Program Improvement 2007-2008 2011-2012
Year in Program Improvement Year 5 Year 3
Number of Title I schools currently in Program Improvement 8
Percentage of Title I schools currently in Program Improvement 88.90%
California Physical Fitness TestEach spring, all students in grades 5, 7 and 9 are required to participate in the California Physical Fitness Test (PFT). The Fitnessgram® is the designated PFT for students in California public schools put forth by the State Board of Education. The PFT measures six key fitness areas:
1. Aerobic Capacity
2. Body Composition
3. Flexibility
4. Abdominal Strength and Endurance
5. Upper Body Strength and Endurance
6. Trunk Extensor Strength and Flexibility
Encouraging and assisting students in establishing lifelong habits of regular physical activity is the primary goal of the Fitnessgram. The table shows the percentage of students meeting the fitness standards of being in the “healthy fitness zone” for the most recent testing period. For more detailed information on the California PFT, please visit www.cde.ca.gov/ta/tg/pf.
Percentage of Students Meeting Fitness Standards
2014-15 School Year
Grade 5
Four of six standards 5.3%
Five of six standards ²
Six of six standards 10.5%
Grade 7
Four of six standards 16.7%
Five of six standards 11.1%
Six of six standards 11.1%
Adequate Yearly ProgressThe federal Elementary and Secondary Education Act (ESEA) requires all schools and districts meet Ad-equate Yearly Progress (AYP) requirements. California public schools and districts are required to meet or exceed criteria in the following four target areas:
• Participation rate on statewide assessments in English language arts and mathematics
• Percentage of students scoring proficient on statewide assessments in English language arts and mathematics
• Attendance rates for schools with enrollment in Transitional Kindergarten through grade eight (TK-8)
• Graduation rate for high schools
The table displays whether or not the school, district, and state met each of the AYP criteria and made overall AYP for 2014-15. For more information, visit www.cde.ca.gov/ta/ac/ay.
2014-15 School YearAdequate Yearly Progress Criteria
Trinity Valley ES KTJUSD California
Met overall AYP Yes No Yes
Met participation rate:
English language arts Yes No Yes
Mathematics Yes Yes Yes
Met percent proficient:
English language arts n n n
Mathematics n n n
Met attendance rates Yes Yes Yes
Met graduation rate � Yes Yes
² Not applicable.
� Not applicable. This AYP indicator is only applicable for high schools.
Not applicable. Due to the transition to the Smarter Balanced Summative Assessments, the U.S. Department of Education approved the California Department of Education’s waiver request to exclude the percent proficient results from AYP determinations. For more information on the AYP reports, please visit http://data1.cde.ca.gov/dataquest/.
n
6
California Assessment of Student Performance and Progress/Standardized Testing and Reporting Results Beginning in the 2013-14 school year, the Standardized Testing and Reporting (STAR) Program was eliminated and replaced by a new set of assessments called the California Assessment of Student Performance and Progress (CAASPP).
For the 2015 school year, the CAASSP included a mix of online and paper-pencil assessments. The online component contained the Smarter Balanced English language arts/literacy and mathematics tests. The paper-pencil science assessments of CAASPP included the California Standards Test (CST), California Modified Assessment (CMA) and California Alternate Performance Assessment (CAPA). There was also the optional Standards-based tests in Spanish for reading/language arts.
The CST is a multiple-choice test in science for varying grade levels. The CMA is a modified assessment for students with disabilities who have an Individualized Education Plan (IEP). The CAPA is an alternate assessment for students with significant cognitive disabilities who are unable to take the CST with accommodations or modifications or the CMA with accommodations.
For more information on the CAASPP assessments, please visit www.cde.ca.gov/ta/tg/ca.
CAASPP by Student Group: English Language Arts and MathematicsThe tables on the following pages display the information on student achievement at each performance level in English language arts and mathematics for the school by student groups for grades 3-8.
Levels of achievement include:
• Level 1 = Standard not met
• Level 2 = Standard nearly met
• Level 3 = Standard met
• Level 4 = Standard exceeded
Note: The number of students tested includes students who did not receive a score. However, the number of students tested is not the number that was used to calculate the performance level percentages. The performance level percentages are calculated using students with scores.
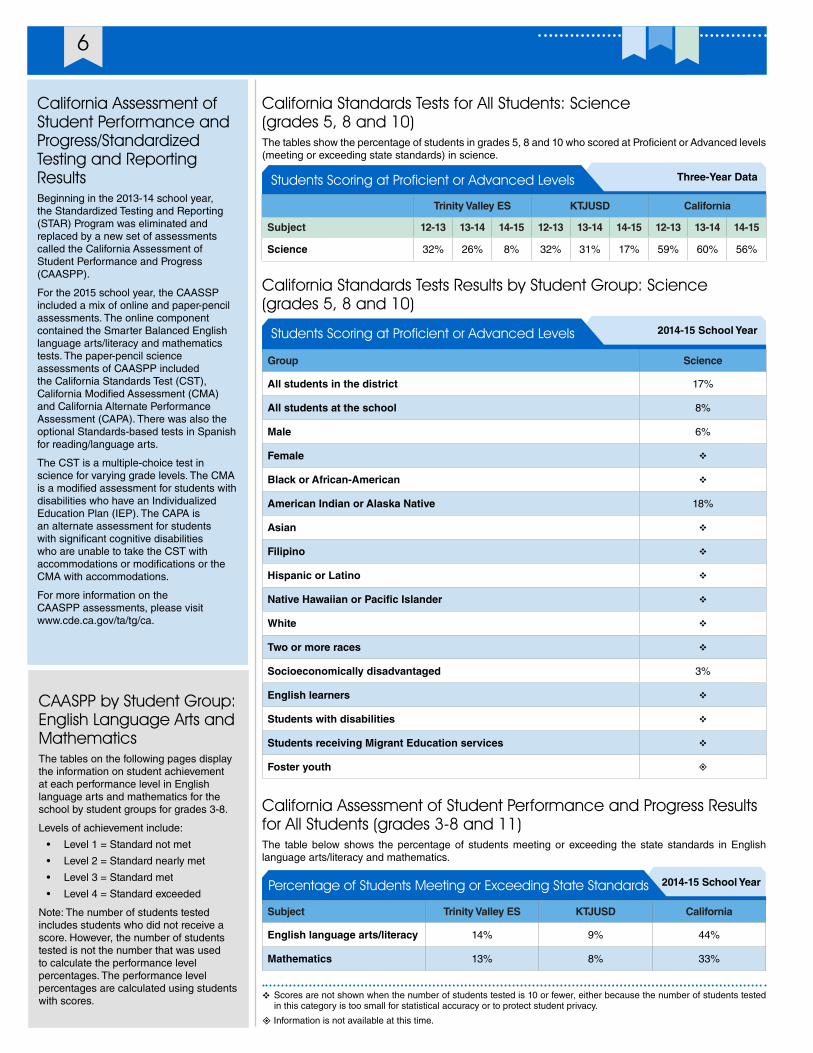
California Standards Tests for All Students: Science (grades 5, 8 and 10)The tables show the percentage of students in grades 5, 8 and 10 who scored at Proficient or Advanced levels (meeting or exceeding state standards) in science.
Three-Year DataStudents Scoring at Proficient or Advanced Levels
Trinity Valley ES KTJUSD California
Subject 12-13 13-14 14-15 12-13 13-14 14-15 12-13 13-14 14-15
Science 32% 26% 8% 32% 31% 17% 59% 60% 56%
California Standards Tests Results by Student Group: Science (grades 5, 8 and 10)
2014-15 School YearStudents Scoring at Proficient or Advanced Levels
Group Science
All students in the district 17%
All students at the school 8%
Male 6%
Female v
Black or African-American v
American Indian or Alaska Native 18%
Asian v
Filipino v
Hispanic or Latino v
Native Hawaiian or Pacific Islander v
White v
Two or more races v
Socioeconomically disadvantaged 3%
English learners v
Students with disabilities v
Students receiving Migrant Education services v
Foster youth ±
v Scores are not shown when the number of students tested is 10 or fewer, either because the number of students tested in this category is too small for statistical accuracy or to protect student privacy.
± Information is not available at this time.
California Assessment of Student Performance and Progress Results for All Students (grades 3-8 and 11)The table below shows the percentage of students meeting or exceeding the state standards in English language arts/literacy and mathematics.
2014-15 School YearPercentage of Students Meeting or Exceeding State Standards
Subject Trinity Valley ES KTJUSD California
English language arts/literacy 14% 9% 44%
Mathematics 13% 8% 33%

7Trinity Valley Elementary SchoolSARC
CAASPP Results by Student Group: English Language Arts and Mathematics - Grade 3
Level 1 = Standard not met Level 2 = Standard nearly met Level 3 = Standard met Level 4 = Standard exceeded
v Scores are not shown when the number of students tested is 10 or fewer, either because the number of students tested in this category is too small for statistical accuracy or to protect student privacy.
2014-15 School YearStudents Achieving at Each Performance LevelEnglish Language Arts: Grade 3 Total
EnrollmentNumber Tested
Percentage Tested of Total
Enrollment
Percent Achievement
Group Level 1 Level 2 Level 3 Level 4
All students 23 23 100.0% 43% 26% 17% 4%
Male 13 56.5% 46% 15% 23% 8%
Female 10 43.5% v v v v
Black or African-American 1 4.3% v v v v
American Indian or Alaska Native 11 47.8% 55% 18% 18% 0%
Asian 0 0.0% v v v v
Filipino 0 0.0% v v v v
Hispanic or Latino 3 13.0% v v v v
Native Hawaiian or Pacific Islander 0 0.0% v v v v
White 7 30.4% v v v v
Two or more races 0 0.0% v v v v
Socioeconomically disadvantaged 20 87.0% 50% 25% 15% 5%
English learners 0 0.0% v v v v
Students with disabilities 3 13.0% v v v v
Students receiving Migrant Education services 0 0.0% v v v v
Foster youth ± ± ± ± ± ±
Mathematics: Grade 3 Total Enrollment
Number Tested
Percentage Tested of Total
Enrollment
Percent Achievement
Group Level 1 Level 2 Level 3 Level 4
All students 23 23 100.0% 61% 22% 17% 0%
Male 13 56.5% 54% 15% 31% 0%
Female 10 43.5% v v v v
Black or African-American 1 4.3% v v v v
American Indian or Alaska Native 11 47.8% 64% 36% 0% 0%
Asian 0 0.0% v v v v
Filipino 0 0.0% v v v v
Hispanic or Latino 3 13.0% v v v v
Native Hawaiian or Pacific Islander 0 0.0% v v v v
White 7 30.4% v v v v
Two or more races 0 0.0% v v v v
Socioeconomically disadvantaged 20 87.0% 60% 20% 20% 0%
English learners 0 0.0% v v v v
Students with disabilities 3 13.0% v v v v
Students receiving Migrant Education services 0 0.0% v v v v
Foster youth ± ± ± ± ± ±
± Information is not available at this time.

8
CAASPP Results by Student Group: English Language Arts and Mathematics - Grade 4
Level 1 = Standard not met Level 2 = Standard nearly met Level 3 = Standard met Level 4 = Standard exceeded
v Scores are not shown when the number of students tested is 10 or fewer, either because the number of students tested in this category is too small for statistical accuracy or to protect student privacy.
2014-15 School YearStudents Achieving at Each Performance LevelEnglish Language Arts: Grade 4 Total
EnrollmentNumber Tested
Percentage Tested of Total
Enrollment
Percent Achievement
Group Level 1 Level 2 Level 3 Level 4
All students 23 23 100.0% 52% 35% 4% 9%
Male 9 39.1% v v v v
Female 14 60.9% 43% 43% 7% 7%
Black or African-American 1 4.3% v v v v
American Indian or Alaska Native 14 60.9% 71% 21% 7% 0%
Asian 0 0.0% v v v v
Filipino 0 0.0% v v v v
Hispanic or Latino 0 0.0% v v v v
Native Hawaiian or Pacific Islander 0 0.0% v v v v
White 6 26.1% v v v v
Two or more races 2 8.7% v v v v
Socioeconomically disadvantaged 22 95.7% 55% 36% 5% 5%
English learners 0 0.0% v v v v
Students with disabilities 7 30.4% v v v v
Students receiving Migrant Education services 0 0.0% v v v v
Foster youth ± ± ± ± ± ±
Mathematics: Grade 4 Total Enrollment
Number Tested
Percentage Tested of Total
Enrollment
Percent Achievement
Group Level 1 Level 2 Level 3 Level 4
All students 23 23 100.0% 39% 30% 22% 9%
Male 9 39.1% v v v v
Female 14 60.9% 29% 29% 36% 7%
Black or African-American 1 4.3% v v v v
American Indian or Alaska Native 14 60.9% 50% 29% 21% 0%
Asian 0 0.0% v v v v
Filipino 0 0.0% v v v v
Hispanic or Latino 0 0.0% v v v v
Native Hawaiian or Pacific Islander 0 0.0% v v v v
White 6 26.1% v v v v
Two or more races 2 8.7% v v v v
Socioeconomically disadvantaged 22 95.7% 41% 32% 23% 5%
English learners 0 0.0% v v v v
Students with disabilities 7 30.4% v v v v
Students receiving Migrant Education services 0 0.0% v v v v
Foster youth ± ± ± ± ± ±
± Information is not available at this time.

9Trinity Valley Elementary SchoolSARC
CAASPP Results by Student Group: English Language Arts and Mathematics - Grade 5
Level 1 = Standard not met Level 2 = Standard nearly met Level 3 = Standard met Level 4 = Standard exceeded
v Scores are not shown when the number of students tested is 10 or fewer, either because the number of students tested in this category is too small for statistical accuracy or to protect student privacy.
2014-15 School YearStudents Achieving at Each Performance LevelEnglish Language Arts: Grade 5 Total
EnrollmentNumber Tested
Percentage Tested of Total
Enrollment
Percent Achievement
Group Level 1 Level 2 Level 3 Level 4
All students 20 20 100.0% 80% 10% 0% 0%
Male 16 80.0% 75% 13% 0% 0%
Female 4 20.0% v v v v
Black or African-American 0 0.0% v v v v
American Indian or Alaska Native 11 55.0% 82% 9% 0% 0%
Asian 0 0.0% v v v v
Filipino 0 0.0% v v v v
Hispanic or Latino 6 30.0% v v v v
Native Hawaiian or Pacific Islander 1 5.0% v v v v
White 2 10.0% v v v v
Two or more races 0 0.0% v v v v
Socioeconomically disadvantaged 16 80.0% 81% 6% 0% 0%
English learners 1 5.0% v v v v
Students with disabilities 5 25.0% v v v v
Students receiving Migrant Education services 0 0.0% v v v v
Foster youth ± ± ± ± ± ±
Mathematics: Grade 5 Total Enrollment
Number Tested
Percentage Tested of Total
Enrollment
Percent Achievement
Group Level 1 Level 2 Level 3 Level 4
All students 20 20 100.0% 85% 10% 5% 0%
Male 16 80.0% 81% 13% 6% 0%
Female 4 20.0% v v v v
Black or African-American 0 0.0% v v v v
American Indian or Alaska Native 11 55.0% 91% 9% 0% 0%
Asian 0 0.0% v v v v
Filipino 0 0.0% v v v v
Hispanic or Latino 6 30.0% v v v v
Native Hawaiian or Pacific Islander 1 5.0% v v v v
White 2 10.0% v v v v
Two or more races 0 0.0% v v v v
Socioeconomically disadvantaged 16 80.0% 88% 6% 6% 0%
English learners 1 5.0% v v v v
Students with disabilities 5 25.0% v v v v
Students receiving Migrant Education services 0 0.0% v v v v
Foster youth ± ± ± ± ± ±
± Information is not available at this time.

10
CAASPP Results by Student Group: English Language Arts and Mathematics - Grade 6
Level 1 = Standard not met Level 2 = Standard nearly met Level 3 = Standard met Level 4 = Standard exceeded
v Scores are not shown when the number of students tested is 10 or fewer, either because the number of students tested in this category is too small for statistical accuracy or to protect student privacy.
2014-15 School YearStudents Achieving at Each Performance LevelEnglish Language Arts: Grade 6 Total
EnrollmentNumber Tested
Percentage Tested of Total
Enrollment
Percent Achievement
Group Level 1 Level 2 Level 3 Level 4
All students 18 17 94.4% 65% 29% 6% 0%
Male 6 33.3% v v v v
Female 11 61.1% 45% 45% 9% 0%
Black or African-American 0 0.0% v v v v
American Indian or Alaska Native 8 44.4% v v v v
Asian 0 0.0% v v v v
Filipino 0 0.0% v v v v
Hispanic or Latino 1 5.6% v v v v
Native Hawaiian or Pacific Islander 0 0.0% v v v v
White 8 44.4% v v v v
Two or more races 0 0.0% v v v v
Socioeconomically disadvantaged 16 88.9% 63% 31% 6% 0%
English learners 0 0.0% v v v v
Students with disabilities 3 16.7% v v v v
Students receiving Migrant Education services 0 0.0% v v v v
Foster youth ± ± ± ± ± ±
Mathematics: Grade 6 Total Enrollment
Number Tested
Percentage Tested of Total
Enrollment
Percent Achievement
Group Level 1 Level 2 Level 3 Level 4
All students 18 17 94.4% 59% 29% 12% 0%
Male 6 33.3% v v v v
Female 11 61.1% 45% 36% 18% 0%
Black or African-American 0 0.0% v v v v
American Indian or Alaska Native 8 44.4% v v v v
Asian 0 0.0% v v v v
Filipino 0 0.0% v v v v
Hispanic or Latino 1 5.6% v v v v
Native Hawaiian or Pacific Islander 0 0.0% v v v v
White 8 44.4% v v v v
Two or more races 0 0.0% v v v v
Socioeconomically disadvantaged 16 88.9% 56% 31% 13% 0%
English learners 0 0.0% v v v v
Students with disabilities 3 16.7% v v v v
Students receiving Migrant Education services 0 0.0% v v v v
Foster youth ± ± ± ± ± ±
± Information is not available at this time.

11Trinity Valley Elementary SchoolSARC
CAASPP Results by Student Group: English Language Arts and Mathematics - Grade 7
Level 1 = Standard not met Level 2 = Standard nearly met Level 3 = Standard met Level 4 = Standard exceeded
v Scores are not shown when the number of students tested is 10 or fewer, either because the number of students tested in this category is too small for statistical accuracy or to protect student privacy.
2014-15 School YearStudents Achieving at Each Performance LevelEnglish Language Arts: Grade 7 Total
EnrollmentNumber Tested
Percentage Tested of Total
Enrollment
Percent Achievement
Group Level 1 Level 2 Level 3 Level 4
All students 18 17 94.4% 18% 29% 47% 0%
Male 8 44.4% v v v v
Female 9 50.0% v v v v
Black or African-American 0 0.0% v v v v
American Indian or Alaska Native 11 61.1% 9% 45% 45% 0%
Asian 0 0.0% v v v v
Filipino 0 0.0% v v v v
Hispanic or Latino 1 5.6% v v v v
Native Hawaiian or Pacific Islander 0 0.0% v v v v
White 5 27.8% v v v v
Two or more races 0 0.0% v v v v
Socioeconomically disadvantaged 15 83.3% 20% 33% 40% 0%
English learners 0 0.0% v v v v
Students with disabilities 1 5.6% v v v v
Students receiving Migrant Education services 0 0.0% v v v v
Foster youth ± ± ± ± ± ±
Mathematics: Grade 7 Total Enrollment
Number Tested
Percentage Tested of Total
Enrollment
Percent Achievement
Group Level 1 Level 2 Level 3 Level 4
All students 18 16 88.9% 19% 69% 6% 0%
Male 8 44.4% v v v v
Female 8 44.4% v v v v
Black or African-American 0 0.0% v v v v
American Indian or Alaska Native 11 61.1% 9% 82% 9% 0%
Asian 0 0.0% v v v v
Filipino 0 0.0% v v v v
Hispanic or Latino 1 5.6% v v v v
Native Hawaiian or Pacific Islander 0 0.0% v v v v
White 4 22.2% v v v v
Two or more races 0 0.0% v v v v
Socioeconomically disadvantaged 14 77.8% 21% 64% 7% 0%
English learners 0 0.0% v v v v
Students with disabilities 0 0.0% v v v v
Students receiving Migrant Education services 0 0.0% v v v v
Foster youth ± ± ± ± ± ±
± Information is not available at this time.

12
CAASPP Results by Student Group: English Language Arts and Mathematics - Grade 8
Level 1 = Standard not met Level 2 = Standard nearly met Level 3 = Standard met Level 4 = Standard exceeded
v Scores are not shown when the number of students tested is 10 or fewer, either because the number of students tested in this category is too small for statistical accuracy or to protect student privacy.
2014-15 School YearStudents Achieving at Each Performance LevelEnglish Language Arts: Grade 8 Total
EnrollmentNumber Tested
Percentage Tested of Total
Enrollment
Percent Achievement
Group Level 1 Level 2 Level 3 Level 4
All students 20 19 95.0% 68% 26% 0% 0%
Male 12 60.0% 67% 25% 0% 0%
Female 7 35.0% v v v v
Black or African-American 0 0.0% v v v v
American Indian or Alaska Native 12 60.0% 67% 25% 0% 0%
Asian 0 0.0% v v v v
Filipino 0 0.0% v v v v
Hispanic or Latino 1 5.0% v v v v
Native Hawaiian or Pacific Islander 0 0.0% v v v v
White 6 30.0% v v v v
Two or more races 0 0.0% v v v v
Socioeconomically disadvantaged 12 60.0% 83% 17% 0% 0%
English learners 0 0.0% v v v v
Students with disabilities 3 15.0% v v v v
Students receiving Migrant Education services 0 0.0% v v v v
Foster youth ± ± ± ± ± ±
Mathematics: Grade 8 Total Enrollment
Number Tested
Percentage Tested of Total
Enrollment
Percent Achievement
Group Level 1 Level 2 Level 3 Level 4
All students 20 18 90.0% 78% 22% 0% 0%
Male 11 55.0% 91% 9% 0% 0%
Female 7 35.0% v v v v
Black or African-American 0 0.0% v v v v
American Indian or Alaska Native 11 55.0% 82% 18% 0% 0%
Asian 0 0.0% v v v v
Filipino 0 0.0% v v v v
Hispanic or Latino 1 5.0% v v v v
Native Hawaiian or Pacific Islander 0 0.0% v v v v
White 6 30.0% v v v v
Two or more races 0 0.0% v v v v
Socioeconomically disadvantaged 12 60.0% 75% 25% 0% 0%
English learners 0 0.0% v v v v
Students with disabilities 3 15.0% v v v v
Students receiving Migrant Education services 0 0.0% v v v v
Foster youth ± ± ± ± ± ±
± Information is not available at this time.
13Trinity Valley Elementary SchoolSARC
Public Internet AccessInternet access is available at public libraries and other locations that are publicly accessible (e.g., the Califor-nia State Library). Access to the Internet at libraries and public locations is generally provided on a first-come, first-serve basis. Other use restrictions include the hours of operation, the length of time that a workstation may be used (depending on availability), the types of software programs available at a workstation and the ability to print documents.
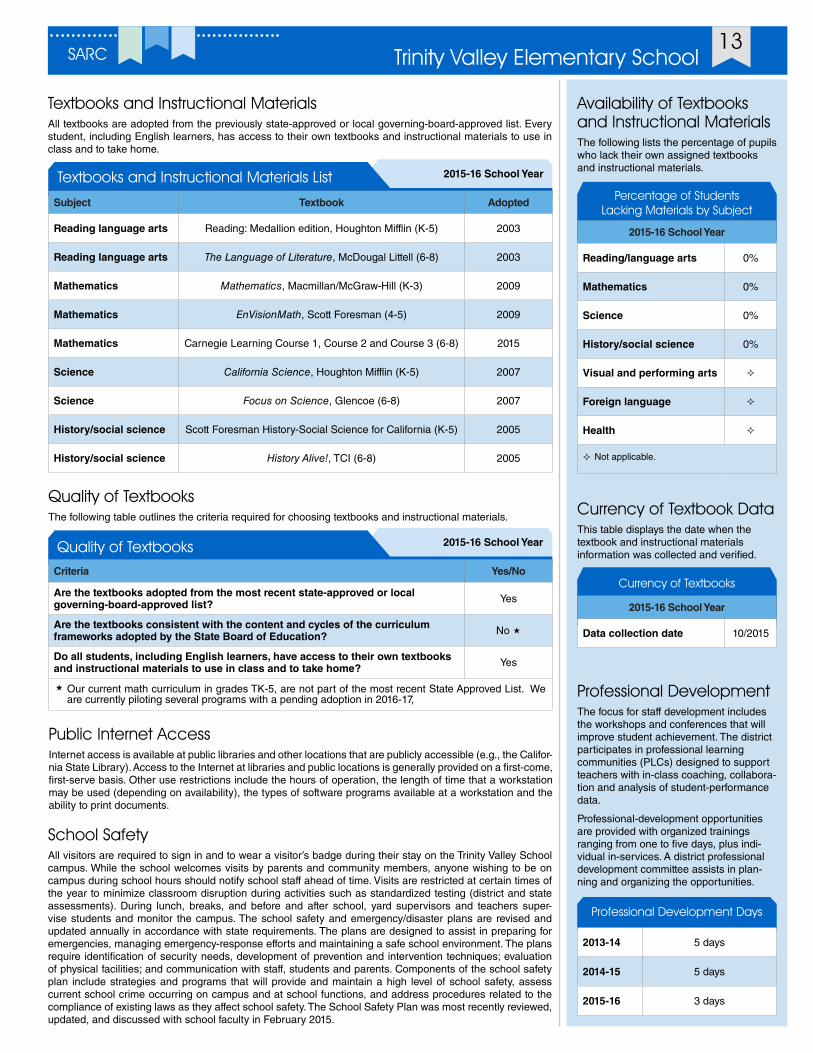
Textbooks and Instructional MaterialsAll textbooks are adopted from the previously state-approved or local governing-board-approved list. Every student, including English learners, has access to their own textbooks and instructional materials to use in class and to take home.
2015-16 School YearTextbooks and Instructional Materials List
Subject Textbook Adopted
Reading language arts Reading: Medallion edition, Houghton Mifflin (K-5) 2003
Reading language arts The Language of Literature, McDougal Littell (6-8) 2003
Mathematics Mathematics, Macmillan/McGraw-Hill (K-3) 2009
Mathematics EnVisionMath, Scott Foresman (4-5) 2009
Mathematics Carnegie Learning Course 1, Course 2 and Course 3 (6-8) 2015
Science California Science, Houghton Mifflin (K-5) 2007
Science Focus on Science, Glencoe (6-8) 2007
History/social science Scott Foresman History-Social Science for California (K-5) 2005
History/social science History Alive!, TCI (6-8) 2005
Currency of Textbook DataThis table displays the date when the textbook and instructional materials information was collected and verified.
Currency of Textbooks
2015-16 School Year
Data collection date 10/2015
Quality of TextbooksThe following table outlines the criteria required for choosing textbooks and instructional materials.
2015-16 School YearQuality of TextbooksCriteria Yes/No
Are the textbooks adopted from the most recent state-approved or local governing-board-approved list? Yes
Are the textbooks consistent with the content and cycles of the curriculum frameworks adopted by the State Board of Education? No «
Do all students, including English learners, have access to their own textbooks and instructional materials to use in class and to take home? Yes
« Our current math curriculum in grades TK-5, are not part of the most recent State Approved List. We are currently piloting several programs with a pending adoption in 2016-17,
Professional DevelopmentThe focus for staff development includes the workshops and conferences that will improve student achievement. The district participates in professional learning communities (PLCs) designed to support teachers with in-class coaching, collabora-tion and analysis of student-performance data.
Professional-development opportunities are provided with organized trainings ranging from one to five days, plus indi-vidual in-services. A district professional development committee assists in plan-ning and organizing the opportunities.
Professional Development Days
2013-14 5 days
2014-15 5 days
2015-16 3 days
Availability of Textbooks and Instructional MaterialsThe following lists the percentage of pupils who lack their own assigned textbooks and instructional materials.
Percentage of Students Lacking Materials by Subject
2015-16 School Year
Reading/language arts 0%
Mathematics 0%
Science 0%
History/social science 0%
Visual and performing arts ²
Foreign language ²
Health ²
² Not applicable.
School SafetyAll visitors are required to sign in and to wear a visitor’s badge during their stay on the Trinity Valley School campus. While the school welcomes visits by parents and community members, anyone wishing to be on campus during school hours should notify school staff ahead of time. Visits are restricted at certain times of the year to minimize classroom disruption during activities such as standardized testing (district and state assessments). During lunch, breaks, and before and after school, yard supervisors and teachers super-vise students and monitor the campus. The school safety and emergency/disaster plans are revised and updated annually in accordance with state requirements. The plans are designed to assist in preparing for emergencies, managing emergency-response efforts and maintaining a safe school environment. The plans require identification of security needs, development of prevention and intervention techniques; evaluation of physical facilities; and communication with staff, students and parents. Components of the school safety plan include strategies and programs that will provide and maintain a high level of school safety, assess current school crime occurring on campus and at school functions, and address procedures related to the compliance of existing laws as they affect school safety. The School Safety Plan was most recently reviewed, updated, and discussed with school faculty in February 2015.

14
School FacilitiesTrinity Valley Elementary was built in the 1950s, with additions and upgrades done in 1967 and 1988. There are 14 classrooms, a gymnasium, cafeteria and library. The school is in generally good condition with repairs, maintenance and cleaning done on a regular basis by a full-time on-site maintenance person, a full-time custodian and a part-time custodian. The full-time custodian is on-site daily from midday until the evening, and the part-time custodian is on-site beginning after school dismissal in the afternoon. TVES employs two grounds supervisors who monitor students before school starts and during recess and lunch breaks.
We completed the installation of a new playground area in November 2008. In October 2009, we completed the installation of a new swing set structure for our kindergarten through fifth-grade students to enjoy.
A new modular building was set up in September 2010. The new building is home to our after-school program After School Education and Safety (ASES). A second modular building was set up in 2013 to enlarge space for the ASES Program.
We have recently completed a modernization project that restructured the bathrooms on the upper-grade wing (Giddings Wing). The bathrooms are now Americans with Disabilities Act (ADA) compliant. In addition to the bathrooms, the campus has had various walkways and ramps installed to meet ADA compliancy. Water fountains have also been made to be ADA compliant. All classrooms have received new cabinetry for their sink areas with new sinks and faucets installed to meet ADA compliancy. All windows have been replaced to improve energy efficiency. We have had major construction during the 2014-15 and the beginning of the 2015-16 school years, which includes mold eradication, renovation of the gym and six classrooms.
Deficiencies and RepairsThe table lists the repairs required for all deficiencies found during the site inspection. Regardless of each item’s repair status, all deficiencies are listed.
2015-16 School YearDeficiencies and Repairs
Items Inspected Deficiencies, Action Taken or Planned, and Date of Action
Cleanliness A portable’s window was replaced due to buildup of moisture in November 2015.
Restrooms/fountains The girls’ restroom has ceiling damage from an old leak and was repaired in November 2015.
Safety
The carpet is a trip hazard in the old computer lab which is being used as a temporary classroom during construction. Clutter on heater in the kindergarten room. Slide to be replaced. Repairs were completed in November 2015.
ExternalDoors of cafeteria need replacement. Eves and gutters to be replaced. Repairs were completed in November 2015.
School Facility Items Inspected The tables show the results of the school’s most recent inspection using the Facility Inspection Tool (FIT) or equivalent school form. The following is a list of items inspected.
• Systems: Gas systems and pipes, sewer, mechanical systems (heating, ventilation and air-conditioning)
• Interior: Interior surfaces (floors, ceilings, walls and window casings)
• Cleanliness: Pest/vermin control, overall cleanliness (school grounds, buildings, rooms and common areas)
• Electrical: Electrical systems (interior and exterior)
• Restrooms/fountains: Restrooms, sinks and drinking fountains (interior and exterior)
• Safety: Fire-safety equipment, emergency systems, hazardous materials (interior and exterior)
• Structural: Structural condition, roofs
• External: Windows/doors/gates/fences, playgrounds/school grounds
School Facility Good Repair Status This inspection determines the school facility’s good repair status using ratings of good condition, fair condition or poor condition. The overall summary of facility conditions uses ratings of exemplary, good, fair or poor.
2015-16 School YearSchool Facility Good Repair Status
Items Inspected Repair Status Items Inspected Repair Status
Systems Good Restrooms/fountains Good
Interior Good Safety Good
Cleanliness Good Structural Good
Electrical Good External Good
Overall summary of facility conditions Good
Date of the most recent school site inspection 8/10/2015
Date of the most recent completion of the inspection form 8/10/2015
Types of Services FundedThese programs and services are provid-ed at the school either through categorical funds or other sources that support and assist students:
• Title I
• Special Education
• Improving Teacher Quality
• Rural and Low-Income School Program
• Indian Education/American Indian Early Childhood Education
• Enhancing Education Through Technology
• Lottery funds
• Art and Music Block Grant
• Economic Impact Aid (EIA)
• School and Libraries Improvement Block Grant
• Peer Assistance and Review (PAR)
• Professional Development Block Grant
• Pupil Retention Block Grant
• California High School Exit Examina-tion (CAHSEE) Intervention
• Youth Services (A-Step Program)

15Trinity Valley Elementary SchoolSARC
“We are safe. We are responsible. We are respectful.”
Academic Counselors and School Support StaffThis table displays information about aca-demic counselors and support staff at the school and their full-time equivalent (FTE).
Academic Counselors and School Support Staff Data
2014-15 School Year
Academic Counselors
FTE of academic counselors 0.00
Average number of students per academic counselor ²
Support Staff FTE
Social/behavioral or career development counselors 0.33
Library media teacher (librarian) 0.00
Library media services staff (paraprofessional) 1.00
Psychologist 0.10
Social worker 0.00
Nurse 0.10
Speech/language/hearing specialist 0.40
Resource specialist (nonteaching) 0.00
Teacher QualificationsThis table shows information about teacher credentials and teacher qualifications. Teachers without a full credential include teachers with district and university internships, pre-internships, emergency or other permits, and waivers. For more information on teacher credentials, visit www.ctc.ca.gov.
Three-Year DataTeacher Credential Information
KTJUSD Trinity Valley ES
Teachers 15-16 13-14 14-15 15-16
With full credential 68 10 12 13
Without full credential 1 0 0 0
Teaching outside subject area of competence (with full credential) 2 0 0 0
Teacher Misassignments and Vacant Teacher PositionsThis table displays the number of teacher misassignments (positions filled by teachers who lack legal authorization to teach that grade level, subject area, student group, etc.) and the number of vacant teacher positions (not filled by a single designated teacher assigned to teach the entire course at the beginning of the school year or semester). Please note total teacher misassignments includes the number of teacher misassignments of English learners.
Three-Year DataTeacher Misassignments and Vacant Teacher Positions
Trinity Valley ES
Teachers 13-14 14-15 15-16
Teacher misassignments of English learners 0 0 0
Total teacher misassignments 0 0 0
Vacant teacher positions 0 0 0
Core Academic Classes Taught by Highly Qualified TeachersThe No Child Left Behind Act (NCLB) extended the Elementary and Secondary Education Act (ESEA) to require that core academic subjects be taught by “highly qualified” teachers, defined as having at least a bachelor’s degree, an appropriate California teaching credential, and demonstrated competence for each core academic subject area he or she teaches. The table displays data regarding highly qualified teachers from the 2014-15 school year.
High-poverty schools are defined as those schools with student participation of approximately 40 percent or more in the free and reduced priced meals program. Low-poverty schools are those with student participation of approximately 39 percent or less in the free and reduced priced meals program. For more information on teacher qualifications related to NCLB, visit www.cde.ca.gov/nclb/sr/tq.
2014-15 School YearNo Child Left Behind Compliant Teachers
Percentage of Classes in Core Academic Subjects
Taught by Highly Qualified Teachers
Not Taught by Highly Qualified Teachers
Trinity Valley ES 81.82% 18.18%
All schools in district 97.96% 2.04%
High-poverty schools in district 97.96% 2.04%
Low-poverty schools in district 0.00% 0.00%
² Not applicable.

Data for this year’s SARC was provided by the California Department of Education (CDE), school and district offices. For additional information on California schools and districts and comparisons of the school to the district, the county and the state, please visit DataQuest at http://data1.cde.ca.gov/dataquest/. DataQuest is an online resource that provides reports for accountability, test data, enrollment, graduates, dropouts, course enrollments, staffing and data regarding English learners. Per Education Code 35256, each school district shall make hard copies of its annually updated report card available, upon request, on or before February 1 of each year.
All data accurate as of December 2015.
School Accountability Report Card
Published by:
www.sia-us.com | 800.487.9234
16
School Financial Data
2013-14 Fiscal Year
Total expenditures per pupil $9,934
Expenditures per pupil from restricted sources $3,819
Expenditures per pupil from unrestricted sources $6,115
Annual average teacher salary $59,512
School Financial DataThe following table displays the school’s average teacher salary and a breakdown of the school’s expenditures per pupil from unrestricted and restricted sources.
Expenditures Per PupilSupplemental/restricted expenditures come from money whose use is controlled by law or by a donor. Money that is designated for specific purposes by the district or governing board is not considered restricted. Basic/unrestricted expenditures are from money whose use, except for general guidelines, is not controlled by law or by a donor.
Financial Data The financial data displayed in this SARC is from the 2013-14 fiscal year. The most current fiscal information available provided by the state is always two years behind the current school year and one year behind most other data included in this report. For detailed information on school expenditures for all districts in California, see the California Department of Education (CDE) Current Expense of Education & Per-pupil Spending Web page at www.cde.ca.gov/ds/fd/ec. For information on teacher salaries for all districts in California, see the CDE Certificated Salaries & Benefits Web page at www.cde.ca.gov/ds/fd/cs. To look up expenditures and salaries for a specific school district, see the Ed-Data website at www.ed-data.org.
District Financial DataThis table displays district teacher and administrative salary information and compares the figures to the state averages for districts of the same type and size based on the salary schedule. Note: The district salary data does not include benefits.
2013-14 Fiscal YearDistrict Salary Data
KTJUSD Similar Sized District
Beginning teacher salary $39,332 $38,953
Midrange teacher salary $58,224 $57,103
Highest teacher salary $70,702 $74,127
Average elementary school principal salary $74,062 $90,225
Average high school principal salary $80,167 $97,758
Superintendent salary $120,000 $117,803
Teacher salaries: percentage of budget 30% 34%
Administrative salaries: percentage of budget 9% 7%
Financial Data ComparisonThis table displays the school’s per-pupil expenditures from unrestricted sources and the school’s average teacher salary and compares it to the district and state data.
2013-14 Fiscal YearFinancial Data ComparisonExpenditures
Per Pupil From Unrestricted Sources
Annual Average Teacher Salary
Trinity Valley ES $6,115 $59,512
KTJUSD $3,295 $56,662
California $5,348 $59,460
School and district: percentage difference +85.6% +5.0%
School and California: percentage difference +14.3% +0.1%

Local Control Accountability Plan (LCAP) Requirements Aligned in Your SARCThe tables below outline the state priority areas that are included in the School Accountability Report Card.
Note: State Priority 2 and 7 are not required in the SARC, as well as certain portions of Priority 4 and 5. For detailed information about LCAP and frequently asked questions, please visit www.cde.ca.gov/fg/aa/lc/lcfffaq.asp.
Conditions of LearningThe table below describes information in the SARC that is relevant to the Basic State Priority (Priority 1).
Alignment Between State Priority Areas and the SARCLocal Control Accountability Plan Requirements
Conditions of Learning
State Priority: Basic
Degree to which teachers are appropriately assigned and fully credentialed in the subject area and for the pupils they are teaching. Education Code (EC) § 52060 (d)(1)
Pupils have access to standards-aligned instructional materials. EC § 52060 (d)(1)
School facilities are maintained in good repair. EC § 52060 (d)(1)
Pupil OutcomesThe table below describes information in the SARC that is relevant to Pupil Achievement State Priority (Priority 4) and Other Pupil Outcomes State Priority (Priority 8).
Local Control Accountability Plan Requirements
Pupil Outcomes
State Priority: Pupil Achievements
Statewide assessments (e.g., California Assessment of Student Performance and Progress). EC § 52060 (d)(4)(A)
The Academic Performance Index. EC § 52060 (d)(4)(B)
The percentage of pupils who have successfully completed courses that satisfy the requirements for entrance to the University of California and California State University, or career technical education sequences or programs of study. EC § 52060 (d)(4)(C)
State Priority: Other Pupil Outcomes
Pupil outcomes in subject areas such as English, mathematics, social sciences, science, visual and performing arts, health, physical education, career technical education, and other studies prescribed by the governing board.1 EC § 52060 (d)(8)
English, mathematics and physical education are the only subject areas included in Other Pupil Outcomes (Priority 8) that are reflected in the SARC. 1
The school safety plan is the only other local measure of School Climate (Priority 6) that is reflected in the SARC.2
EngagementThe table below describes information in the SARC that is relevant to the Parental Involvement State Priority (Priority 3), Pupil Engagement State Priority (Priority 5) and School Climate State Priority (Priority 6).
Alignment Between State Priority Areas and the SARCLocal Control Accountability Plan Requirements
Engagement
State Priority: Parent Involvement
Efforts the school district makes to seek parent input in making decisions for the school district and each school site. EC § 52060 (d)(3)
State Priority: Pupil Engagement
High school dropout rates. EC § 52060 (d)(5)(D)
High school graduation rates. EC § 52060 (d)(5)(E)
State Priority: School Climate
Pupil suspension rates. EC § 52060 (d)(6)(A)
Pupil expulsion rates. EC § 52060 (d)(6)(B)
Other local measures including surveys of students, parents and teachers on the sense of safety and school connectedness.2 EC § 52060 (d)(6)(C)
Alignment Between State Priority Areas and the SARC