almond grove school - sarconline.orgsarconline.org/sarcpdfs/8/07617620129064.pdf · filipino 9.4%...
TRANSCRIPT

SARC2015-16
School Accountability Report Card
Published in 2016-17
Para español, visita: www.ouesd.k12.ca.us
Oakley Union ESDGreg Hetrick, Superintendent • [email protected] • Phone: (925) 625-0700
Oakley Union Elementary School District • 91 Mercedes Lane Oakley, CA 94561 • www.ouesd.k12.ca.us
Almond Grove
SchoolChristina Edwards
Principal [email protected]
5000 Amaryllis Street Oakley, CA 94561
Grades: TK-5 Phone: (925) 625-6720
www.ouesd.k12.ca.us/almondgrove
CDS Code: 07-61762-0129064

2015-16 School Accountability Report Card • Published by School Innovations & Achievement • www.sia-us.com

Almond Grove SchoolSARC 3
Principal’s MessageAlmond Grove Elementary School is a grade TK-5 elementary school that opened in the 2014-15 school year. We are nestled in a wonderful neighborhood community and have a beautiful, sparkling new campus. Our campus is home to two brand-new computer labs, library, stage with theatrical curtains and sound system, and sensory room. Our campus currently has 450 students, and we are growing every day. Almond Grove School is proud to be home of the Mustangs. Our school colors are black, white and red, and our Mustang mascot is Lightning! We promote a Caring School Community where we are all partners in learning and strive to promote the social, emotional and academic excellence of our students. Instruction in our classrooms is based on the implementation of the Common Core State Standards in order to support students in becoming college and career ready. These standards emphasize reading, writing and speaking, grounded in evidence from text, both literary and informational. Our math standards emphasize conceptual understanding, math fluency, math reasoning and application. Each week our staff has Collaborative Learning Time, which is dedi-cated to analyzing student data, developing student learning goals with our Response to Intervention (RTI) process and staff development in the areas of math, language arts, technology and special education. We work with site and district leads and coaches to promote ongoing staff development for our staff. Our class-rooms promote rigorous curriculum, high standards, and lots of collaboration and critical thinking. We are an inclusive campus that embraces the needs of each of our students and values one another’s diverse needs. Our campus houses the OARS (Oakley Additional Resources and Support) program in which we have three autism classes at our site ranging from kindergarten through fifth grade. Each class has additional staffing and embedded sensory, speech, behavioral, emotional and social skills built into the program. We also have an Extended Day Care Learning Center that offers before- and after-school day care. Almond Grove School also has a music program in place for our fourth- and fifth-grade students and a band program for our fifth graders. We offer before- and after-school intervention classes for our at-risk learners as well as an Early Literacy Program designed to promote early intervention for our younger students. We have a very active Parent Teacher Association (PTA) which assists with schoolwide events such as Family Day, Harvest Carni-val, Winter Wonderland, Literature Day, Father-Daughter Dance, Mother-Son Bowling Night, Field Day and special assemblies. Almond Grove School is a wonderful school community and always puts students first!
School Mission StatementAt Almond Grove Elementary School, learning is a process that extends to everyone in our community, including students, staff, parents and our local residents. We have a caring school community where all chil-dren and adults feel welcome, respected and are an important component of our school. We are an inclusive school, fostering the needs of each and every one of our students. As a professional learning community, we strive to meet the educational, social and emotional needs of all of our learners. We work hard to ensure that all students reach their potential by maintaining high expectations and setting high standards to promote academic excellence. We strive to have engaging classrooms that promote rigorous learning. Implementation of Common Core State Standards is focusing on preparing students for college and career readiness. Our school promotes fostering a positive school climate that is based on a caring school community that values diversity and nurtures self-esteem. We are active learners collaborating together!
School Accountability Report Card
In accordance with state and federal requirements, the School Accountability
Report Card (SARC) is put forth annually by all public schools as a tool for parents and interested parties to stay informed of
the school’s progress, test scores and achievements.
Parental InvolvementAlmond Grove parents and community members are valued members of our school. Parents volunteer in the classroom, help out with special events and help coordinate schoolwide activities. We encourage parents to participate in the classroom, in extracurricular programs, PTA activities, schoolwide events and our English Language Advisory Committee (ELAC). We have a fantastic group of involved parents and look forward to more parents joining us in our educational partnerships. Our PTA is very active and assists with all school-wide events. Last year, the PTA was able to help us purchase nonfiction materials for classrooms as well as two buddy benches to help promote the life skills of friendship and being caring citizens. If you are interested in becoming involved, please contact Christina Edwards at (925) 625-6720.
School SafetySafety is a high priority with our staff. We regularly review our procedures for emergency situations, including evacuation routes and procedures. We hold monthly drills including fire, earthquake, shelter-in-place and intruder-on-campus drills. Our school safety plan is reviewed throughout the school year and is updated with additional information as needed. Our safety plan was reviewed on July 26, 2016.
Almond Grove is a safe school campus. Every precaution is taken to ensure student safety. We have all of our outside gates locked after the school bell rings, and these remain locked throughout the school day. All visitors must check in the office and are required to wear a visitor badge. Teachers and yard duties patrol their duty stations before school, recess and after school. All staff members are trained yearly for emergency situations, blood-borne pathogens, child-abuse reporting and other health-related issues. Safety concerns are reported immediately to the office and taken very seriously and in a timely manner.
Governing BoardMark Jordan
President
Karen Bergenholtz Clerk
Kim Beede Member
Gloria Lott Member
Larry Polk Member

4
Three-Year DataNumber of Classrooms by Size
2013-14 2014-15 2015-16
GradeNumber of Students
1-20 21-32 33+ 1-20 21-32 33+ 1-20 21-32 33+
K ³ 1 3 4
1 ³ 2 2
1-2 ³ 1 1
2 ³ 2 2
3 ³ 2 2
4 ³ 2 2
5 ³ 1 1
Suspensions and ExpulsionsThis table shows the school, district, and state suspension and expulsion rates for the most recent three-year period. Note: Students are only counted one time, regardless of the number of suspensions.
Suspension and Expulsion Rates
Almond Grove ES
13-14 14-15 15-16
Suspension rates ³ 0.0% 0.2%
Expulsion rates ³ 0.0% 0.0%
Oakley Union ESD
13-14 14-15 15-16
Suspension rates 3.9% 2.1% 1.3%
Expulsion rates 0.0% 0.2% 0.1%
California
13-14 14-15 15-16
Suspension rates 4.4% 3.8% 3.7%
Expulsion rates 0.1% 0.1% 0.1%
³ The school first opened in the 2014-15 school year. Therefore, no data is available.
Enrollment by Student GroupThe total enrollment at the school was 381 students for the 2015-16 school year. The pie chart displays the percentage of students enrolled in each group.
2015-16 School YearDemographics
Socioeconomically disadvantaged
25.20%English
learners7.90%
Students with disabilities
13.90%Foster youth
0.50%
Hispanic or Latino31.5%
American Indian or Alaska Native
0.5%
Asian6.6%
Native Hawaiian or Pacific Islander
0.3%
Filipino9.4%
Black or African-American
9.7%
White40.4%
Two or More Races1.6%
Enrollment by GradeThe bar graph displays the total number of students enrolled in each grade for the 2015-16 school year.
2015-16 Enrollment by Grade
K
1
2
3
4
5
108
60
70
53
56
34
Class Size DistributionThe bar graph displays the three-year data for average class size, and the table displays the three-year data for the number of classrooms by size. The number of classes indicates how many classrooms fall into each size category (a range of total students per classroom). At the secondary school level, this information is reported by subject area rather than grade level.
14-1513-14 15-16
Three-Year DataAverage Class Size
K 1 1-2 2 3 4 5
21 2326 25 27
30
2124 24 25 25
2932

Almond Grove SchoolSARC 5
California Physical Fitness TestEach spring, all students in grades 5, 7 and 9 are required to participate in the California Physical Fitness Test (PFT). The Fitnessgram is the designated PFT for students in California public schools put forth by the State Board of Education. The PFT measures six key fitness areas:
1. Aerobic Capacity
2. Body Composition
3. Flexibility
4. Abdominal Strength and Endurance
5. Upper Body Strength and Endurance
6. Trunk Extensor Strength and Flexibility
Encouraging and assisting students in establishing lifelong habits of regular physical activity is the primary goal of the Fitnessgram. The table shows the percentage of students meeting the fitness standards of being in the “healthy fitness zone” for the most recent testing period. For more detailed information on the California PFT, please visit www.cde.ca.gov/ta/tg/pf.
²Not applicable. The school is not in Program Improvement.
Percentage of Students Meeting Fitness Standards
2015-16 School Year
Grade 5
Four of six standards 24.3%
Five of six standards 16.2%
Six of six standards 10.8%
Professional DevelopmentThe focus of the professional development days in 2016-17 was on the continued implementation of Common Core State Standards with the added concept of Universal Design for Learning, which incorporates access and equity for all. These address support and instruction in English language arts and math for all students, with additional support for our English learners and struggling students.
All teachers are given professional development opportunities through our scheduled staff development days, minimum days, and frequent on-site and off-site workshops and conferences. Furthermore, in 2010-11, the district began an early-out Wednesday at each of our elementary schools in order to provide additional col-laborative learning and planning time.
Based on teacher and administrative input and data from state and local assessments, the district focuses on the areas of early literacy, math strategies, writing across the curriculum, integrating technology into the curriculum, comprehension strategies and English learner strategies. Embedded within these topics was a focus on strategies across the curriculum to keep student engagement high and the concept of designing lessons that reach all students in the classroom.
Our district employs several teachers on special assignment to help support teachers in different content areas in their classrooms. Last year, a district early literacy teacher, technology teacher, English language learner teacher, and math coach supported new and experienced teachers in professional development through workshops and in-classroom demonstrations and coaching.
Three-Year DataProfessional Development Days
2014-15 2015-16 2016-17
Almond Grove ES 3 days 3 days 3 days
Almond Grove ES Oakley Union ESD
Program Improvement status Not Title I In PI
First year of Program Improvement ² 2008-2009
Year in Program Improvement ² Year 3
Number of schools currently in Program Improvement 3
Percentage of schools currently in Program Improvement 100.00%
2016-17 School YearFederal Intervention Program
Federal Intervention ProgramSchools and districts will not be newly identified for Program Improvement (PI) in the 2016-17 school year under the Every Student Succeeds Act (ESSA) that became law in December 2015, which reauthorized the Elementary and Secondary Education Act (ESEA). Schools and districts receiving Title I, Part A funding for the 2015-16 school year and were “In PI” in 2015-16 will retain their same PI status and placement year for 2016-17. Schools and districts receiving Title I, Part A funding for the 2015-16 school year and either had a status of “Not in PI” for the 2015-16 school year or did not receive Title I, Part A funding in the 2014-15 school year will have a status of “Not in PI” for the 2016-17 school year. The percentage of schools identified for Program Improvement is calculated by taking the number of schools currently in PI within the district and dividing it by the total number of Title I schools within the district.
This table displays the 2016-17 Program Improvement status for the school and district. For detailed information about PI identification, please visit www.cde.ca.gov/ta/ac/ay/tidetermine.asp.

6
California Assessment of Student Performance and Progress (CAASPP)For the 2015-16 school year, the CAASSP consists of several key components, including:
California Alternate Assessment (CAA) test includes both ELA/literacy and mathematics in grades 3-8 and 11. The CAA is given to those students with significant cognitive disabilities which prevent them from taking the Smarter Balanced Assessments with universal tools, designated supports or accommodations.
Smarter Balanced Assessments include ELA/literacy in grades 3-8 and 11. Smarter Balanced Assessments are designed to measure student progress toward college and career readiness.
The assessments under CAASPP show how well students are doing in relation to the state-adopted content standards. On each of these assessments, student aggregate scores are reported as achievement standards. For more information on the CAASPP assessments, please visit www.cde.ca.gov/ta/tg/ca.
v Scores are not shown when the number of students tested is 10 or fewer, either because the number of students tested in this category is too small for statistical accuracy or to protect student privacy.
CAASPP Test Results for All Students: English Language Arts/Literacy and Mathematics (grades 3-8 and 11)The table below shows the percentage of students meeting or exceeding the state standards in English language arts (ELA) and literacy and mathematics.
Two-Year DataPercentage of Students Meeting or Exceeding State Standards
Almond Grove ES Oakley Union ESD California
Subject 14-15 15-16 14-15 15-16 14-15 15-16
English language arts/literacy 57% 58% 36% 39% 44% 48%
Mathematics 48% 46% 24% 27% 33% 36%
CAASPP Test Results by Student Group: Science (grades 5, 8 and 10)Science test results include CSTs, CMA, and CAPA in grades 5, 8, and 10. The “Proficient or Advanced” is calculated by taking the total number of students who scored proficient or Advanced on the science assess-ment divided by the total number of students with valid scores.
2015-16 School YearPercentage of Students Scoring at Proficient or Advanced
Group Total Enrollment
Number of Students with Valid Scores
Percentage of Students with Valid Scores
Percentage Proficient or Advanced
All students 37 37 100.00% 72.97%
Male 19 19 100.00% 57.89%
Female 18 18 100.00% 88.89%
Black or African-American v v v v
American Indian or Alaska Native v v v v
Asian v v v v
Filipino v v v v
Hispanic or Latino 11 11 100.00% 81.82%
Native Hawaiian or Pacific Islander v v v v
White 12 12 100.00% 75.00%
Two or more races v v v v
Socioeconomically disadvantaged v v v v
English learners v v v v
Students with disabilities v v v v
Students receiving Migrant Education services v v v v
Foster youth v v v v
CAASPP Test Results for All Students: Science (grades 5, 8 and 10)Science test results include California Standards Tests (CSTs), California Modified Assessment (CMA) and California Alternate Performance Assessment (CAPA) in grades 5, 8 and 10. The tables show the percentage of students scoring at proficient or advanced.
Three-Year DataPercentage of Students Scoring at Proficient or Advanced
Almond Grove ES Oakley Union ESD California
Subject 13-14 14-15 15-16 13-14 14-15 15-16 13-14 14-15 15-16
Science ³ 55% 73% 61% 49% 45% 60% 56% 54%
CAASPP by Student Group: English Language Arts/Literacy and MathematicsThe tables on the following pages display the percentage of students that met or exceeded state standards in English language arts and mathematics for the school by student groups for grades 3-5.
The “percentage met or exceeded” is calculated by taking the total number of students who met or exceeded the standard on the Smarter Balanced Summative Assessment plus the total number of students who met the standard on the CAAs divided by the total number of students who participated in both assessments.
Note: The number of students tested includes all students who participated in the test whether they received a score or not. However, the number of students tested is not the number that was used to calculate the achievement level percentages. The achievement level percentages are calculated using only students who received scores.
³ The school first opened in the 2014-15 school year. Therefore, no data is available.

Almond Grove SchoolSARC 7
CAASPP Results by Student Group: English Language Arts and Mathematics - Grade 3
v Scores are not shown when the number of students tested is 10 or fewer, either because the number of students tested in this category is too small for statistical accuracy or to protect student privacy.
Percentage of Students Meeting or Exceeding State Standards 2015-16 School Year
English Language Arts: Grade 3
Group Total Enrollment Number Tested Percentage Tested Percentage Met or Exceeded
All students 54 52 96.30% 50.00%
Male 23 21 91.30% 52.40%
Female 31 31 100.00% 48.40%
Black or African-American v v v v
American Indian or Alaska Native v v v v
Asian v v v v
Filipino v v v v
Hispanic or Latino 14 13 92.90% 23.10%
Native Hawaiian or Pacific Islander v v v v
White 22 21 95.50% 52.40%
Two or more races v v v v
Socioeconomically disadvantaged 15 14 93.30% 14.30%
English learners v v v v
Students with disabilities v v v v
Students receiving Migrant Education services v v v v
Foster youth v v v v
Mathematics: Grade 3
Group Total Enrollment Number Tested Percentage Tested Percentage Met or Exceeded
All students 54 52 96.30% 51.90%
Male 23 21 91.30% 57.10%
Female 31 31 100.00% 48.40%
Black or African-American v v v v
American Indian or Alaska Native v v v v
Asian v v v v
Filipino v v v v
Hispanic or Latino 14 13 92.90% 38.50%
Native Hawaiian or Pacific Islander v v v v
White 22 21 95.50% 47.60%
Two or more races v v v v
Socioeconomically disadvantaged 15 14 93.30% 14.30%
English learners v v v v
Students with disabilities v v v v
Students receiving Migrant Education services v v v v
Foster youth v v v v

8
CAASPP Results by Student Group: English Language Arts and Mathematics - Grade 4
v Scores are not shown when the number of students tested is 10 or fewer, either because the number of students tested in this category is too small for statistical accuracy or to protect student privacy.
Percentage of Students Meeting or Exceeding State Standards 2015-16 School Year
English Language Arts: Grade 4
Group Total Enrollment Number Tested Percentage Tested Percentage Met or Exceeded
All students 59 57 96.60% 59.70%
Male 28 26 92.90% 38.50%
Female 31 31 100.00% 77.40%
Black or African-American v v v v
American Indian or Alaska Native v v v v
Asian v v v v
Filipino v v v v
Hispanic or Latino 17 16 94.10% 56.30%
Native Hawaiian or Pacific Islander v v v v
White 26 25 96.20% 48.00%
Two or more races v v v v
Socioeconomically disadvantaged 19 19 100.00% 47.40%
English learners v v v v
Students with disabilities v v v v
Students receiving Migrant Education services v v v v
Foster youth v v v v
Mathematics: Grade 4
Group Total Enrollment Number Tested Percentage Tested Percentage Met or Exceeded
All students 60 58 96.70% 44.80%
Male 28 26 92.90% 30.80%
Female 32 32 100.00% 56.30%
Black or African-American v v v v
American Indian or Alaska Native v v v v
Asian v v v v
Filipino v v v v
Hispanic or Latino 18 17 94.40% 23.50%
Native Hawaiian or Pacific Islander v v v v
White 26 25 96.20% 52.00%
Two or more races v v v v
Socioeconomically disadvantaged 20 20 100.00% 45.00%
English learners v v v v
Students with disabilities v v v v
Students receiving Migrant Education services v v v v
Foster youth v v v v
Almond Grove SchoolSARC 9
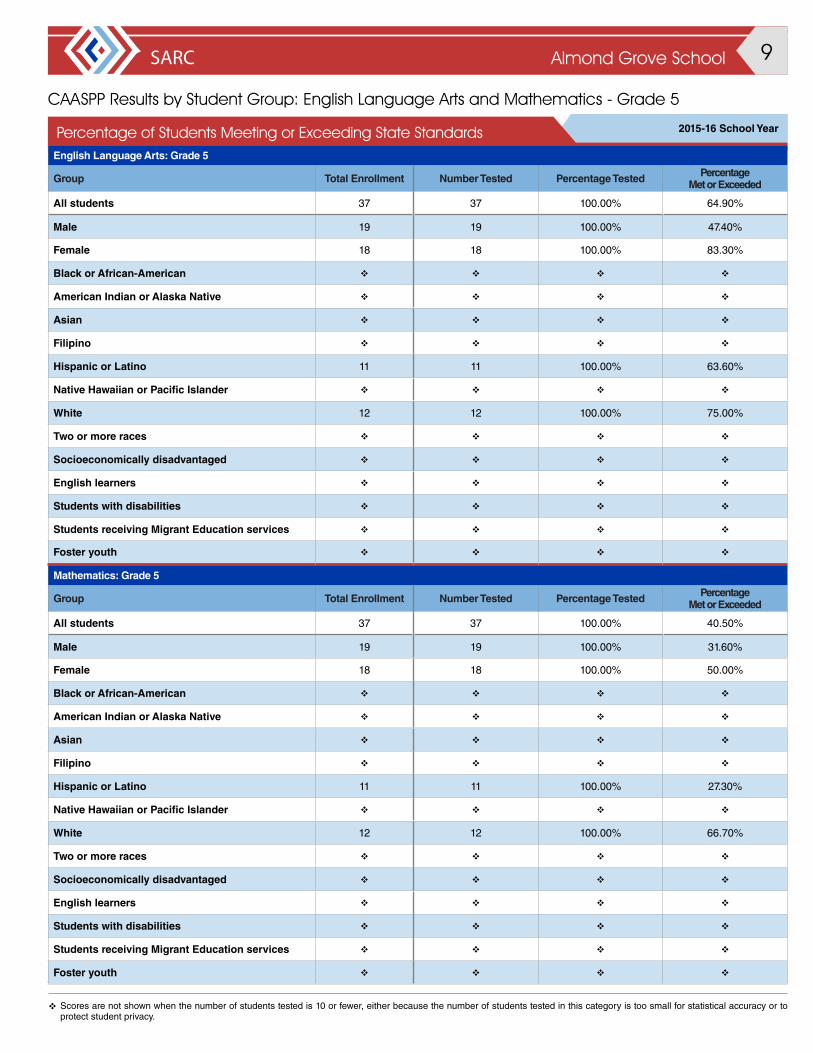
CAASPP Results by Student Group: English Language Arts and Mathematics - Grade 5
v Scores are not shown when the number of students tested is 10 or fewer, either because the number of students tested in this category is too small for statistical accuracy or to protect student privacy.
Percentage of Students Meeting or Exceeding State Standards 2015-16 School Year
English Language Arts: Grade 5
Group Total Enrollment Number Tested Percentage Tested Percentage Met or Exceeded
All students 37 37 100.00% 64.90%
Male 19 19 100.00% 47.40%
Female 18 18 100.00% 83.30%
Black or African-American v v v v
American Indian or Alaska Native v v v v
Asian v v v v
Filipino v v v v
Hispanic or Latino 11 11 100.00% 63.60%
Native Hawaiian or Pacific Islander v v v v
White 12 12 100.00% 75.00%
Two or more races v v v v
Socioeconomically disadvantaged v v v v
English learners v v v v
Students with disabilities v v v v
Students receiving Migrant Education services v v v v
Foster youth v v v v
Mathematics: Grade 5
Group Total Enrollment Number Tested Percentage Tested Percentage Met or Exceeded
All students 37 37 100.00% 40.50%
Male 19 19 100.00% 31.60%
Female 18 18 100.00% 50.00%
Black or African-American v v v v
American Indian or Alaska Native v v v v
Asian v v v v
Filipino v v v v
Hispanic or Latino 11 11 100.00% 27.30%
Native Hawaiian or Pacific Islander v v v v
White 12 12 100.00% 66.70%
Two or more races v v v v
Socioeconomically disadvantaged v v v v
English learners v v v v
Students with disabilities v v v v
Students receiving Migrant Education services v v v v
Foster youth v v v v

10
Textbooks and Instructional MaterialsThe district has a process for adopting curriculum from the most recent state-approved list consistent with the Curriculum Frameworks and Instructional Materials cycles. Site curriculum leaders develop criteria for the selection of published curriculum. They then review the published, standards-aligned materials which were adopted by the State Board of Education. From this field, several programs which meet the developed criteria are selected for the pilot. Teachers pilot the selected programs; after the piloting, teachers meet to identify the textbook series that will be adopted.
The district has adopted standards-based textbooks and instructional materials for all of core subjects for students in grades K-8. The district has affirmed that every student has access to their own textbooks and instructional materials to use in class and to take home. English learners receive English language develop-ment through the Hampton-Brown Avenues program in kindergarten through fifth grade; the sixth- through eighth-grade English learners use Inside curriculum published by National Geographic.
Each student in grades K-8 has access to current, state-adopted, standards-based textbooks and other instructional materials; the district purchases a textbook in each of the curriculum areas for every student.
All teachers receive training on the use of the textbooks and instructional materials and are expected to use the materials with their students. At the end of each year, schools inventory their textbooks and plan for ad-ditional textbooks for new students or replacement textbooks for those materials lost or damaged. Again, at the beginning of the year, schools indicate textbook need as additional new students enroll.
2016-17 School YearTextbooks and Instructional Materials List
Subject Textbook Adopted
English language arts Reach for Reading, National Geographic (K-5) 2016
English learners Avenues, Hampton-Brown (K-5) 2007
Mathematics Common Core Mathematics, EngageNY, Wiley (K-5) 2015
Science California Science, Macmillan/McGraw-Hill (K-5) 2008
History/social science History-Social Science for California, Scott Foresman (K-5) 2007
Currency of TextbooksThis table displays the date when the most recent hearing was held to adopt a resolution on the sufficiency of instructional materials.
Currency of Textbooks
2016-17 School Year
Data collection date 10/18/2016
Availability of Textbooks and Instructional MaterialsThe following lists the percentage of pupils who lack their own assigned textbooks and instructional materials.
2016-17 School YearPercentage of Students Lacking Materials by Subject
Almond Grove ES Percentage Lacking
Reading/language arts 0%
Mathematics 0%
Science 0%
History/social science 0%
Visual and performing arts ²
Foreign language ²
Health ²
Quality of TextbooksThe following table outlines the criteria required for choosing textbooks and instructional materials.
Quality of Textbooks
2016-17 School Year
Criteria Yes/No
Are the textbooks adopted from the most recent state-approved or local governing- board-approved list?
Yes
Are the textbooks consistent with the content and cycles of the curriculum frameworks adopted by the State Board of Education?
Yes
Do all students, including English learners, have access to their own textbooks and instructional materials to use in class and to take home?
Yes
² Not applicable.

Almond Grove SchoolSARC 11
• Systems: Gas systems and pipes, sewer, mechanical systems (heating, ventilation and air-conditioning)
• Interior: Interior surfaces (floors, ceilings, walls and window casings)
• Cleanliness: Pest/vermin control, overall cleanliness (school grounds, buildings, rooms and common areas)
• Electrical: Electrical systems (interior and exterior)
• Restrooms/fountains: Restrooms, sinks and drinking fountains (interior and exterior)
• Safety: Fire-safety equipment, emergency systems, hazardous materials (interior and exterior)
• Structural: Structural condition, roofs
• External: Windows/doors/gates/fences, playgrounds/school grounds
School Facility Items Inspected The table shows the results of the school’s most recent inspection using the Facility Inspection Tool (FIT) or equivalent school form. The following is a list of items inspected.
School FacilitiesAlmond Grove School was opened in the 2014-15 school year and consists of 23 classrooms, a gymnasium, library, two computer labs, a sensory room and student-support services center. The maintenance supervi-sor completed an analysis of the condition of our school facility, and all areas were exemplary. The principal, custodian, teachers and students are all responsible for maintaining an orderly and clean campus. Almond Grove has a full-time day custodian and an evening custodian. In addition, we have security cameras on campus to ensure a safe campus.
The physical quality of our school buildings influence learning and teaching. All students and faculty need a reasonable amount of open classroom space. We strive to maintain and improve the facilities and land we have been given by the public. We welcome your suggestions for improvement.
Our classrooms all have brand-new technology with document cameras and projectors, and our classrooms are in exemplary condition. Facilities are monitored on a regular basis to ensure they provide a safe and clean learning environment. You will find our campus to be very clean and safe.
School Facility Good Repair Status This inspection determines the school facility’s good repair status using ratings of good condition, fair condition or poor condition. The overall summary of facility conditions uses ratings of exemplary, good, fair or poor. At the time of this school facility inspection, no deficiencies were found.
School Facility Good Repair Status 2016-17 School Year
Items Inspected Repair Status Items Inspected Repair Status
Systems Good Restrooms/fountains Good
Interior Good Safety Good
Cleanliness Good Structural Good
Electrical Good External Good
Overall summary of facility conditions Exemplary
Date of the most recent school site inspection 10/4/2016
Date of the most recent completion of the inspection form 10/4/2016
“We are a caring school community at Almond Grove and proud to be home of the Mustangs.”
Types of Services FundedThe following is a list of federal- and state-funded programs provided to students:
• No Child Left Behind Act, Title I
• Title II (Teacher and Principal Training and Recruiting)
• Title III (for Limited English Proficient Students)
• Grade span average (GSA)
• Special education
• National School Lunch Program
• State categorical flexibility (which includes arts and music, Community-Based English Tutoring [CBET], counseling, Gifted and Talented Edu-cation [GATE], IMF, California Peer Assistance & Review Program for Teachers [PAR], Beginning Teacher Support and Assessment [BTSA], Targeted Instructional Improvement Block Grant [TIIBG], School and Library Improvement Block Grant, supplemental hourly programs)
• Child Development
• California State Lottery
• State Fiscal Stabilization Fund (SFSF)
• Education Jobs Fund
Public Internet AccessInternet access is available at public libraries and other locations that are pub-licly accessible (e.g., the California State Library). Access to the internet at libraries and public locations is generally provided on a first-come, first-served basis. Other use restrictions include the hours of oper-ation, the length of time that a workstation may be used (depending on availability), the types of software programs available at a workstation, and the ability to print documents.

12
Teacher Misassignments and Vacant Teacher PositionsThis table displays the number of teacher misassignments (positions filled by teachers who lack legal authorization to teach that grade level, subject area, student group, etc.) and the number of vacant teacher positions (not filled by a single designated teacher assigned to teach the entire course at the beginning of the school year or semester). Please note that total teacher misassignments includes the number of teacher misassignments of English learners.
Three-Year DataTeacher Misassignments and Vacant Teacher Positions
Almond Grove ES
Teachers 14-15 15-16 16-17
Teacher misassignments of English learners 0 0 0
Total teacher misassignments 0 0 0
Vacant teacher positions 0 0 0
Core Academic Classes Taught by Highly Qualified TeachersHigh-poverty schools are defined as those schools with student eligibility of approximately 40 percent or more in the free and reduced-priced meals program. Low-poverty schools are those with student eligibility of approximately 39 percent or less in the free and reduced-priced meals program. For more information about ESEA teacher requirements, visit www.cde.ca.gov/nclb/sr/tq.
2015-16 School YearHighly Qualified Teachers
Percentage of Classes in Core Academic Subjects
Taught by Highly Qualified Teachers
Not Taught by Highly Qualified Teachers
Almond Grove ES 94.74% 5.26%
All schools in district 95.53% 4.47%
High-poverty schools in district 95.36% 4.64%
Low-poverty schools in district 97.62% 2.38%
² Not applicable.
Teacher QualificationsThis table shows information about teacher credentials and teacher qualifications. Teachers without a full credential include teachers with district and university internships, pre-internships, emergency or other permits, and waivers. For more information on teacher credentials, visit www.ctc.ca.gov.
Three-Year Data
Oakley Union ESD Almond Grove ES
Teachers 16-17 14-15 15-16 16-17
With a full credential 210 14 19 21
Without a full credential 18 0 0 1
Teaching outside subject area of competence (with full credential) 9 0 0 0
Teacher Credential Information
Academic Counselors and School Support StaffThis table displays information about aca-demic counselors and support staff at the school and their full-time equivalent (FTE).
Academic Counselors and School Support Staff Data
2015-16 School Year
Academic Counselors
FTE of academic counselors 0.00
Average number of students per academic counselor ²
Support Staff FTE
Social/behavioral counselor 0.00
Career development counselor 0.00
Library media teacher (librarian) 1.00
Library media services staff (paraprofessional) 0.00
Psychologist 0.80
Social worker 0.00
Nurse 0.21
Speech/language/hearing specialist 1.00
Resource specialist (nonteaching) 0.50
Other FTE
Behaviorist 0.25

Almond Grove SchoolSARC 13
Financial Data The financial data displayed in this SARC is from the 2014-15 fiscal year. The most current fiscal information available provided by the state is always two years behind the current school year and one year behind most other data included in this report. For detailed information on school expenditures for all districts in California, see the California Department of Education (CDE) Current Expense of Education & Per-pupil Spending web page at www.cde.ca.gov/ds/fd/ec. For information on teacher salaries for all districts in California, see the CDE Certificated Salaries & Benefits web page at www.cde.ca.gov/ds/fd/cs. To look up expenditures and salaries for a specific school district, see the Ed-Data website at www.ed-data.org.
District Financial DataThis table displays district teacher and administrative salary information and compares the figures to the state averages for districts of the same type and size based on the salary schedule. Note: The district salary data does not include benefits.
2014-15 Fiscal YearDistrict Salary Data
Oakley Union ESD Similar Sized District
Beginning teacher salary $43,156 $44,507
Midrange teacher salary $69,153 $68,910
Highest teacher salary $87,930 $88,330
Average elementary school principal salary $117,205 $111,481
Average middle school principal salary $120,714 $115,435
Superintendent salary $236,273 $169,821
Teacher salaries: percentage of budget 44% 39%
Administrative salaries: percentage of budget 6% 6%
Financial Data ComparisonThis table displays the school’s per-pupil expenditures from unrestricted sources and the school’s average teacher salary and compares it to the district and state data.
2014-15 Fiscal YearFinancial Data ComparisonExpenditures
Per Pupil From Unrestricted Sources
Annual Average Teacher Salary
Almond Grove ES $5,112 $56,517
Oakley Union ESD $6,367 $55,209
California $5,677 $71,610
School and district: percentage difference -19.7% +2.4%
School and California: percentage difference -10.0% -21.1%
School Financial DataThe following table displays the school’s average teacher salary and a breakdown of the school’s expenditures per pupil from unrestricted and restricted sources.
School Financial Data
2014-15 Fiscal Year
Total expenditures per pupil $6,574
Expenditures per pupil from restricted sources $1,462
Expenditures per pupil from unrestricted sources $5,112
Annual average teacher salary $56,517
Expenditures Per PupilSupplemental/restricted expenditures come from money whose use is controlled by law or by a donor. Money that is designated for specific purposes by the district or governing board is not considered restricted. Basic/unrestricted expenditures are from money whose use, except for general guidelines, is not controlled by law or by a donor.

SARC
Data for this year’s SARC was provided by the California Department of Education and school and district offices. For additional information on California schools and districts and comparisons of the school to the district, the county and the state, please visit DataQuest at http://data1.cde.ca.gov/dataquest. DataQuest is an online resource that provides reports for accountability, test data, enrollment, graduates, dropouts, course enrollments, staffing and data regarding English learners. Per Education Code Section 35256, each school district shall make hard copies of its annually updated report card available, upon request, on or before February 1.
All data accurate as of January 2017.
School Accountability Report Card
PUBLISHED BY:
www.sia-us.com | 800.487.9234
Almond Grove School