kitcasp key indicators for territorial cohesion and ... · kitcasp | part d | appendix d | ......
TRANSCRIPT

KITCASP | Part D | Appendix D | (Draft) Final Report | 31.07.13
ESPON 2013 Page AD0
KITCASP Key Indicators for Territorial
Cohesion and Spatial Planning
Targeted Analysis 2013/2/20
(Draft) Final Report | Version 31 July 2013
Part D | Appendix D

KITCASP | Part D | Appendix D | (Draft) Final Report | 31.07.13
ESPON 2013 Page AD1
This report presents the draft
final results a Targeted Analysis conducted within the framework
of the ESPON 2013 Programme, partly financed by the European Regional Development Fund.
The partnership behind the
ESPON Programme consists of the EU Commission and the Member States of the EU28, plus
Iceland, Liechtenstein, Norway and Switzerland. Each partner is
represented in the ESPON Monitoring Committee.
This report does not necessarily reflect the opinion of the
members of the Monitoring Committee.
Information on the ESPON Programme and projects can be
found on www.espon.eu
The web site provides the possibility to download and examine the most recent
documents produced by finalised and ongoing ESPON projects.
This basic report exists only in an electronic version.
© ESPON & National University
of Ireland, Maynooth, 2013.
Printing, reproduction or
quotation is authorised provided the source is acknowledged and
a copy is forwarded to the ESPON Coordination Unit in Luxembourg.
KITCASP | Part D | Appendix D | (Draft) Final Report | 31.07.13
ESPON 2013 Page AD2
List of Authors:
National University of Ireland, Maynooth (Lead Partner)
- Gavin Daly - Ainhoa Gonzalez - Justin Gleeson
- Eoghan McCarthy
London South Bank University (Partner)
- Neil Adams
- Phil Pinch
Universitat Politècnica de Catalunya (Partner)
- Malcolm C. Burns
University of Akureyri Research Centre (Partner)
- Hjalti Johannesson
- Valtýr Sigurbjarnarson Vidzeme University of Applied Sciences (Partner)
- Visvaldis Valtenbergs
- Agita Līviņa

KITCASP | Part D | Appendix D | (Draft) Final Report | 31.07.13
ESPON 2013 Page AD3
Appendix D:
Cross Check with ESPON Indicators

KITCASP | Part D | Appendix D | (Draft) Final Report | 31.07.13
ESPON 2013 Page AD4
Theme Keywords Table AD1: Ireland
Economic Competitiveness and Resilience
Adaptability, diversification, enabling economic activity, employment, economic cooperation/collaboration, innovation
Key Indicators (up to 5)
Indicator SIESTA PURR TANGO TPM INTERCO EU-LUPA ReRiSK DEMIFER
Gross value added (GVA) per capita GDP GDP -- -- GDP X
Wealth Creation in Industries with
High Energy Purchases
GDP
Employment rate X X -- Unemployme
nt X
Unemployment
Unemployment Unemployment
Population with accessibility to broadband
X X -- X -- -- -- --
Foreign Direct Investment
No. transnational
firms -- --
No. Branches of
Multinationals Active
-- -- -- --
Total R&D expenditure as % of GDP
X X -- X Intramural
Expenditures in R&D
-- -- --
Other relevant indicators (up to 3)
Small and Medium Enterprises (SMEs)
-- -- -- -- -- -- -- --
Managed Spatial Development
Balanced regional development, settlement-infrastructure alignment, well-managed, effective, coherent to local needs, compact cities, polycentricity, territorial capacities and
Key Indicators (up to 5) Population change -- X --
Population Growth
-- -- -- X
Population density -- X -- -- -- X -- --
Housing vacancy -- -- -- -- -- -- -- --
Population within 500 metres of public transport
--
Population Potential
50km; Potential
Accessibility
-- -- Accessibility Potential by
Road/Rail/Air
Multimodal Potential
Accesibility -- --
Number of houses connected to waste water treatment
Wastewater treatment capacity
-- -- -- -- -- -- --
Other relevant indicators (up to 3) Modal split of X Potential -- -- -- Multimodal Regional spending --
KITCASP | Part D | Appendix D | (Draft) Final Report | 31.07.13
ESPON 2013 Page AD5
assets passenger transport Accessiblity
Potential Accesibility
on transport fuel
Energy consumption per capita Energy
intensity of economy
Share of Industrial
Consumption of
Electricity; Energy Poverty
--
Potential Energy
Consumption for Heating
-- -- -- --
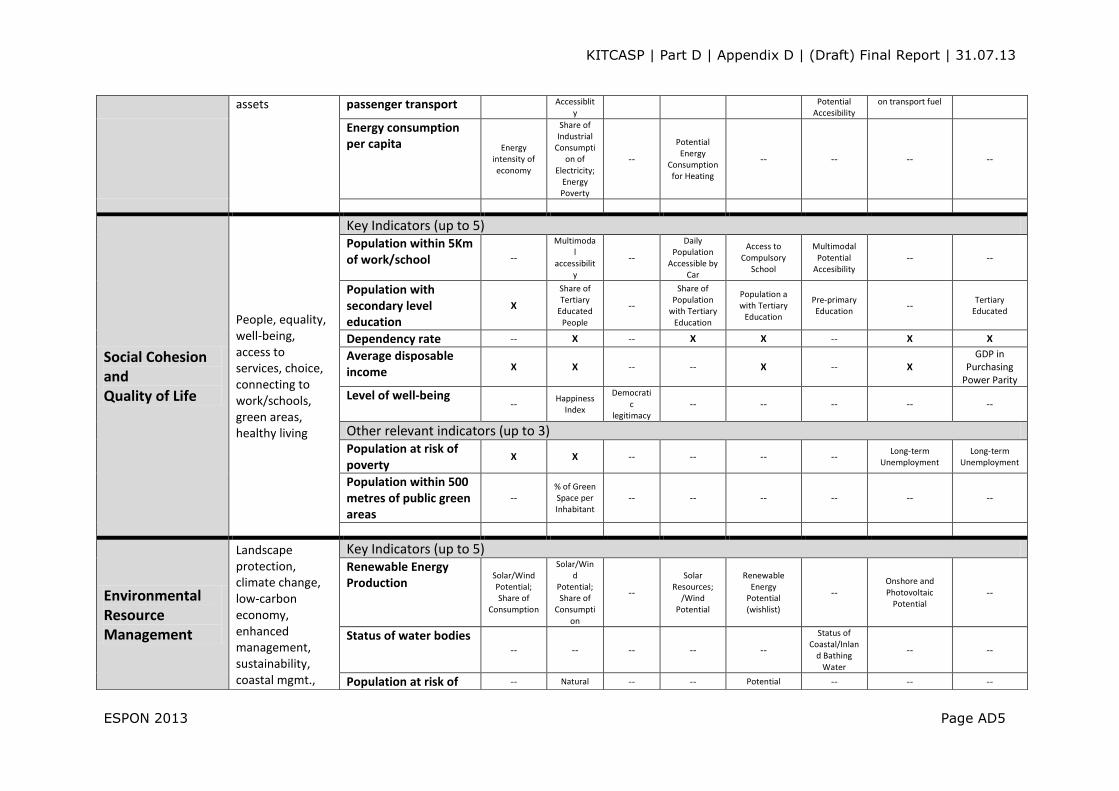
Social Cohesion and Quality of Life
People, equality, well-being, access to services, choice, connecting to work/schools, green areas, healthy living
Key Indicators (up to 5) Population within 5Km of work/school --
Multimodal
accessibility
--
Daily Population
Accessible by Car
Access to Compulsory
School
Multimodal Potential
Accesibility -- --
Population with secondary level education
X
Share of Tertiary
Educated People
--
Share of Population
with Tertiary Education
Population a with Tertiary
Education
Pre-primary Education
-- Tertiary
Educated
Dependency rate -- X -- X X -- X X
Average disposable income X X -- -- X -- X
GDP in Purchasing
Power Parity
Level of well-being --
Happiness Index
Democratic
legitimacy -- -- -- -- --
Other relevant indicators (up to 3) Population at risk of poverty
X X -- -- -- -- Long-term
Unemployment Long-term
Unemployment
Population within 500 metres of public green areas
-- % of Green Space per Inhabitant
-- -- -- -- -- --
Environmental Resource Management
Landscape protection, climate change, low-carbon economy, enhanced management, sustainability, coastal mgmt.,
Key Indicators (up to 5) Renewable Energy Production
Solar/Wind Potential; Share of
Consumption
Solar/Wind
Potential; Share of
Consumption
--
Solar Resources;
/Wind Potential
Renewable Energy
Potential (wishlist)
-- Onshore and Photovoltaic
Potential --
Status of water bodies -- -- -- -- --
Status of Coastal/Inlan
d Bathing Water
-- --
Population at risk of -- Natural -- -- Potential -- -- --
KITCASP | Part D | Appendix D | (Draft) Final Report | 31.07.13
ESPON 2013 Page AD6
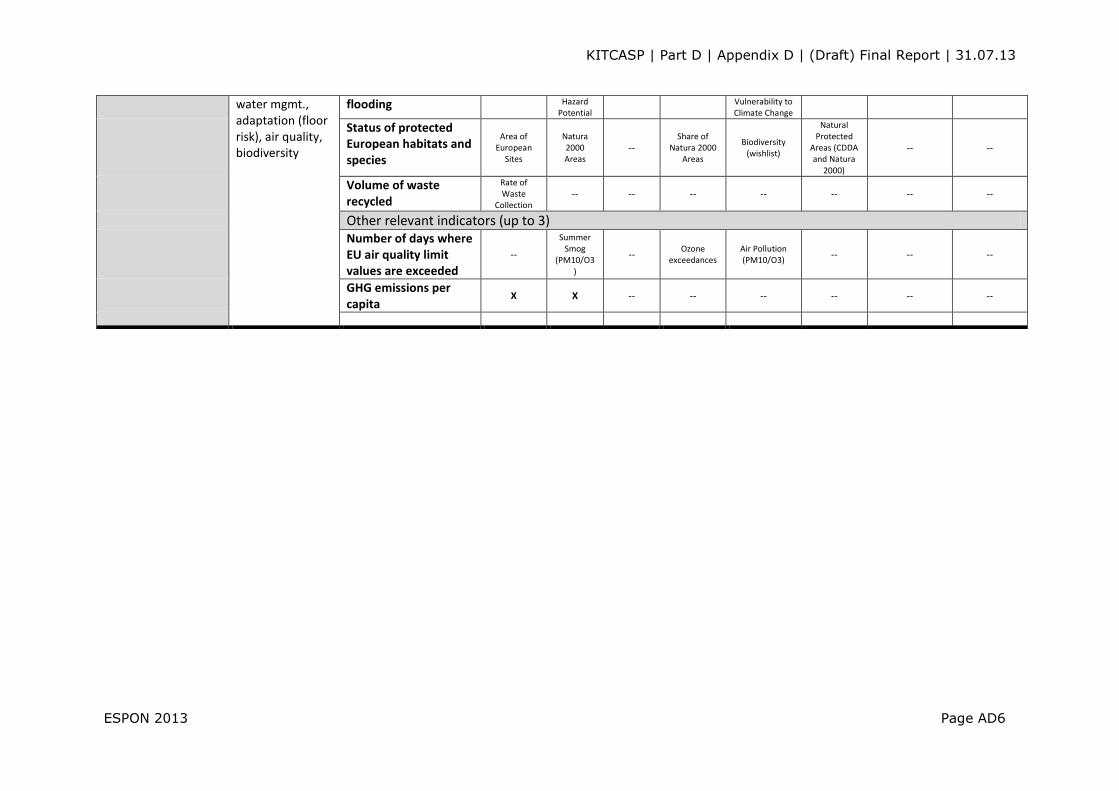
water mgmt., adaptation (floor risk), air quality, biodiversity
flooding Hazard Potential
Vulnerability to Climate Change
Status of protected European habitats and species
Area of European
Sites
Natura 2000 Areas
-- Share of
Natura 2000 Areas
Biodiversity (wishlist)
Natural Protected
Areas (CDDA and Natura
2000)
-- --
Volume of waste recycled
Rate of Waste
Collection -- -- -- -- -- -- --
Other relevant indicators (up to 3) Number of days where EU air quality limit values are exceeded
--
Summer Smog
(PM10/O3)
-- Ozone
exceedances Air Pollution (PM10/O3)
-- -- --
GHG emissions per capita
X X -- -- -- -- -- --
KITCASP | Part D | Appendix D | (Draft) Final Report | 31.07.13
ESPON 2013 Page AD7
KITCASP | Part D | Appendix D | (Draft) Final Report | 31.07.13
ESPON 2013 Page AD8
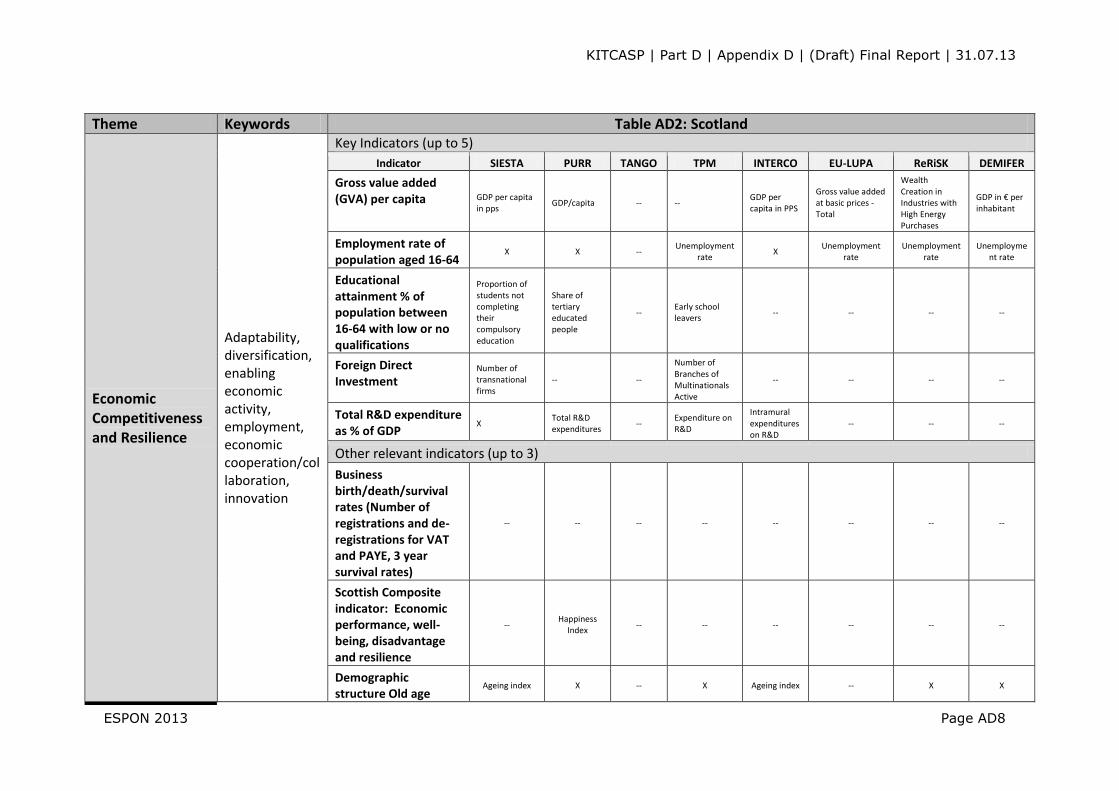
Theme Keywords Table AD2: Scotland
Economic Competitiveness and Resilience
Adaptability, diversification, enabling economic activity, employment, economic cooperation/collaboration, innovation
Key Indicators (up to 5)
Indicator SIESTA PURR TANGO TPM INTERCO EU-LUPA ReRiSK DEMIFER
Gross value added (GVA) per capita GDP per capita
in pps GDP/capita -- --
GDP per capita in PPS
Gross value added at basic prices ‐ Total
Wealth Creation in Industries with High Energy Purchases
GDP in € per inhabitant
Employment rate of population aged 16-64
X X -- Unemployment
rate X
Unemployment rate
Unemployment rate
Unemployment rate
Educational attainment % of population between 16-64 with low or no qualifications
Proportion of students not completing their compulsory education
Share of tertiary educated people
-- Early school leavers
-- -- -- --
Foreign Direct Investment
Number of transnational firms
-- --
Number of Branches of Multinationals Active
-- -- -- --
Total R&D expenditure as % of GDP
X Total R&D expenditures
-- Expenditure on R&D
Intramural expenditures on R&D
-- -- --
Other relevant indicators (up to 3)
Business birth/death/survival rates (Number of registrations and de-registrations for VAT and PAYE, 3 year survival rates)
-- -- -- -- -- -- -- --
Scottish Composite indicator: Economic performance, well-being, disadvantage and resilience
-- Happiness
Index -- -- -- -- -- --
Demographic structure Old age
Ageing index X -- X Ageing index -- X X

KITCASP | Part D | Appendix D | (Draft) Final Report | 31.07.13
ESPON 2013 Page AD9
dependency ratio
Total number of Business visitors
-- -- -- Share of non-
resident tourists
-- -- -- --
Managed Spatial Development
Balanced regional development, settlement-infrastructure alignment, well-managed, effective, coherent to local needs, compact cities, polycentricity, territorial capacities and assets
Key Indicators (up to 5) Population change -- X --
Population Growth
-- -- -- X
Access to services
---
Areas in 45 minutes
reach from an urban
center
-- --
Access to compulsory
school, hospital, grocery services,
universities
-- -- --
Housebuilding: Number of housing completions per 1000 households
-- -- -- -- -- -- -- --
Modal split Share of journeys to work by car
Multimodal accessibility
-- Accessibility to
passenger flights
-- Multimodal
Potential Accesibility
-- --
Number of tourists on holiday
-- -- -- Share of non-
resident tourists
-- Nights spent in
tourist accommodation
-- --
Other relevant indicators (up to 3) Designated areas: Area by national / European designation
Area of European Sites
Natura 2000 Areas
-- Share of Natura
2000 Areas Biodiversity
(wishlist)
Monuments and other tourist sights (index)
-- --
Population density
-- X -- -- -- X -- --
Type of land-use
-- Land cover -- -- --
Landcover ‐ Artifical
non‐agricultural vegetated areas / Landcover ‐ Urban
fabric area
-- --
Social Cohesion and Quality of Life
People, equality, well-being, access to
Key Indicators (up to 5) Income differentials Share of
households with less than
60% of the
Median disposable
annual household
Disposable household
income -- -- -- -- --
KITCASP | Part D | Appendix D | (Draft) Final Report | 31.07.13
ESPON 2013 Page AD10
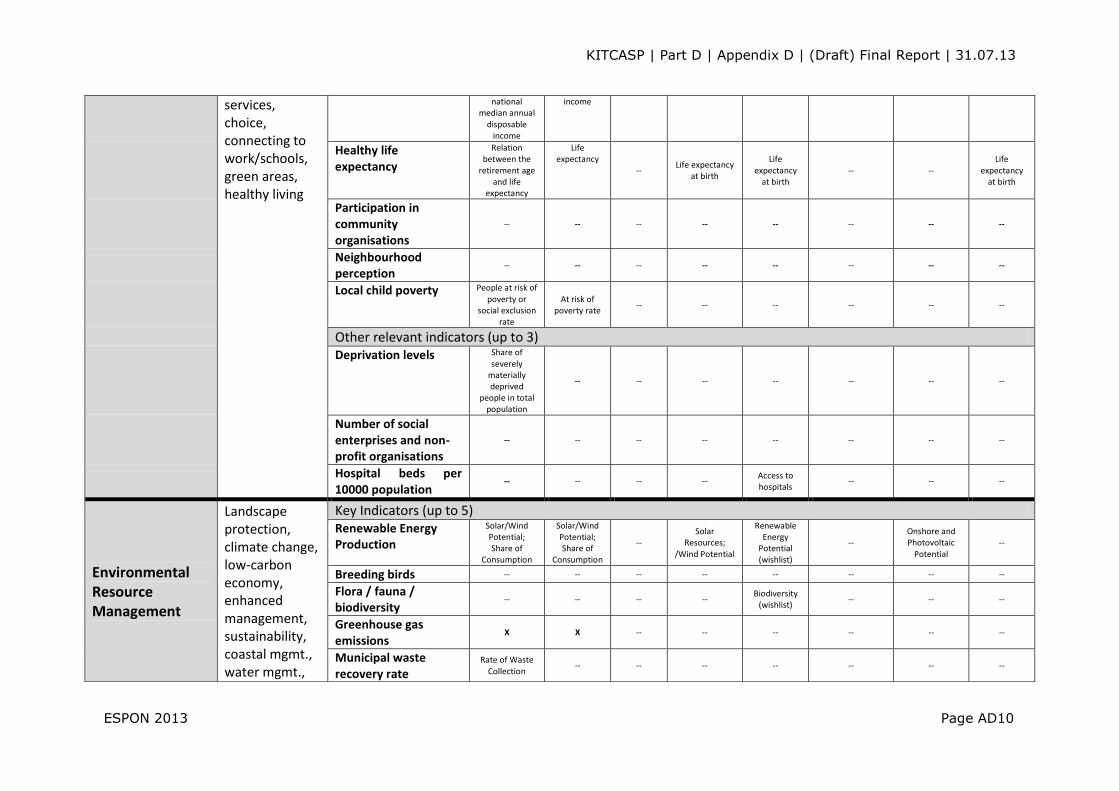
services, choice, connecting to work/schools, green areas, healthy living
national median annual
disposable income
income
Healthy life expectancy
Relation between the
retirement age and life
expectancy
Life expectancy
-- Life expectancy
at birth
Life expectancy
at birth -- --
Life expectancy
at birth
Participation in community organisations
-- -- -- -- -- -- -- --
Neighbourhood perception
-- -- -- -- -- -- -- --
Local child poverty People at risk of poverty or
social exclusion rate
At risk of poverty rate
-- -- -- -- -- --
Other relevant indicators (up to 3) Deprivation levels Share of
severely materially deprived
people in total population
-- -- -- -- -- -- --
Number of social enterprises and non-profit organisations
-- -- -- -- -- -- -- --
Hospital beds per 10000 population
-- -- -- -- Access to hospitals
-- -- --
Environmental Resource Management
Landscape protection, climate change, low-carbon economy, enhanced management, sustainability, coastal mgmt., water mgmt.,
Key Indicators (up to 5) Renewable Energy Production
Solar/Wind Potential; Share of
Consumption
Solar/Wind Potential; Share of
Consumption
-- Solar
Resources; /Wind Potential
Renewable Energy
Potential (wishlist)
-- Onshore and Photovoltaic
Potential --
Breeding birds -- -- -- -- -- -- -- --
Flora / fauna / biodiversity
-- -- -- -- Biodiversity
(wishlist) -- -- --
Greenhouse gas emissions
X X -- -- -- -- -- --
Municipal waste recovery rate
Rate of Waste Collection
-- -- -- -- -- -- --

KITCASP | Part D | Appendix D | (Draft) Final Report | 31.07.13
ESPON 2013 Page AD11
adaptation (floor risk), air quality, biodiversity
Other relevant indicators (up to 3) Designated areas 1991-2011 Area of
European Sites
Natura 2000 Areas
-- Share of Natura
2000 Areas Biodiversity
(wishlist)
Natural Protected Areas
(CDDA and Natura 2000)
-- --
Landscape -- -- -- -- -- -- -- --
River Water quality 1992-2010
-- -- -- -- -- Status of inland bathing water
-- --

KITCASP | Part D | Appendix D | (Draft) Final Report | 31.07.13
ESPON 2013 Page AD12
Theme Keywords Table AD3: The Basque Country
Economic Competitiveness and Resilience
Adaptability, diversification, enabling economic activity, employment, economic cooperation/collaboration, innovation
Key Indicators (up to 5)
Indicator SIESTA PURR TANGO TPM INTERCO EU-LUPA ReRiSK DEMIFER
Breakdown of economic activity in traditional sectors (agriculture, construction, industry and services)
Employ. in knowledge-
intensive activities as % of total employ.
- - - - - - -
Unemployment rate
Unemploy-ment rate
Unemploy-ment
- Unemployme
nt rate
Overall unemployment
rate; and employment
rate 20-64
Unemploy-ment rate
(age >=15); and Long-
term unemployme
nt
Long term Unemploy-ment
Unemploy-ment rate; and
Long term unemploy.
GDP per capita
Growth measured as
GDP per capita en PPS
GDP/capita
- - GDP per capita
in PPS
Gross Domestic Product
(Purchasing Power
Standard)
Wealth creation in industries with
high energy purchases
GDP in € per inhabitant
Balance of external trade
- - - - - - - -
Self sufficiency of energy production
Share of renewable energy in gross final
energy consumption
Energy self-
sufficiency and price sensibility
- - - - - -
Other relevant indicators (up to 3)
Youth employment rate
Youth unemploy-ment rate;
and Share of young people
NEET
- - - - - - -

KITCASP | Part D | Appendix D | (Draft) Final Report | 31.07.13
ESPON 2013 Page AD13
Population > 10 years of age with tertiary education
Share of population
having completed
tertiary education (age group
25-64)
Share of tertiary
educated people
-
Share of population
with tertiary education-
Population aged 25-64
with tertiary education
- - Tertiary
educated
Rate of new firm creation
- - - - - - - -
Managed Spatial Development
Balanced regional development, settlement-infrastructure alignment, well-managed, effective, coherent to local needs, compact cities, polycentricity, territorial capacities and assets
Key Indicators (up to 5)
Index of artificialisation (of all land uses)
-
Urban influence
and human
intervention
- - - Landcover – urban fabric
- -
Urban density
-
Residence density,
settlement density
- - - Population
density - -
Housing density
-
Residence density,
settlement density
- - - - - -
Housing units
- - - - - - - -
Modal split of transport (public, foot and bicycle; and automobile)
-
Multimodal
accessibility
(?)
- - -
Multimodal potential
accessibility (?)
- -
Other relevant indicators (up to 3) Housing density forecasted in new residential development
- - - - - - -
Forecast of land consumption
- - - - - - - -
KITCASP | Part D | Appendix D | (Draft) Final Report | 31.07.13
ESPON 2013 Page AD14
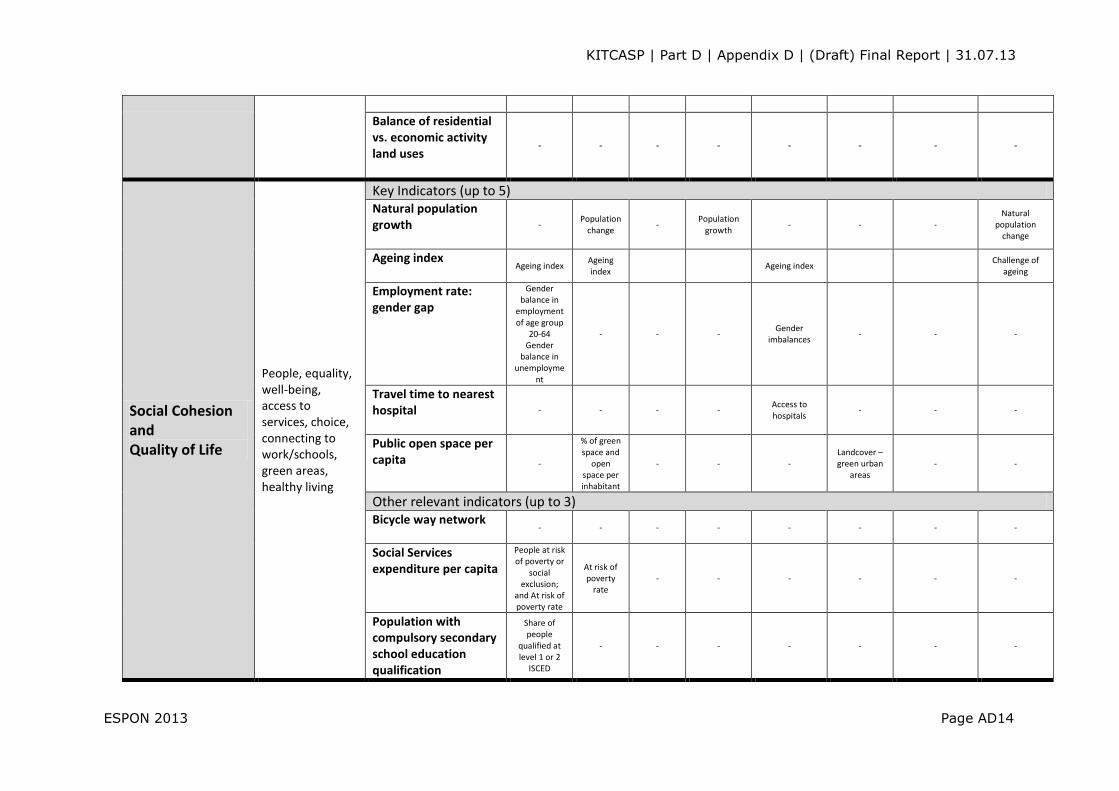
Balance of residential vs. economic activity land uses
- - - - - - - -
Social Cohesion and Quality of Life
People, equality, well-being, access to services, choice, connecting to work/schools, green areas, healthy living
Key Indicators (up to 5) Natural population growth
- Population
change -
Population growth
- - - Natural
population change
Ageing index
Ageing index Ageing index
Ageing index Challenge of
ageing
Employment rate: gender gap
Gender balance in
employment of age group
20-64 Gender
balance in unemployme
nt
- - - Gender
imbalances - - -
Travel time to nearest hospital
- - - - Access to hospitals
- - -
Public open space per capita
-
% of green space and
open space per inhabitant
- - - Landcover – green urban
areas - -
Other relevant indicators (up to 3) Bicycle way network
- - - - - - - -
Social Services expenditure per capita
People at risk of poverty or
social exclusion;
and At risk of poverty rate
At risk of poverty
rate - - - - - -
Population with compulsory secondary school education qualification
Share of people
qualified at level 1 or 2
ISCED
- - - - - - -
KITCASP | Part D | Appendix D | (Draft) Final Report | 31.07.13
ESPON 2013 Page AD15
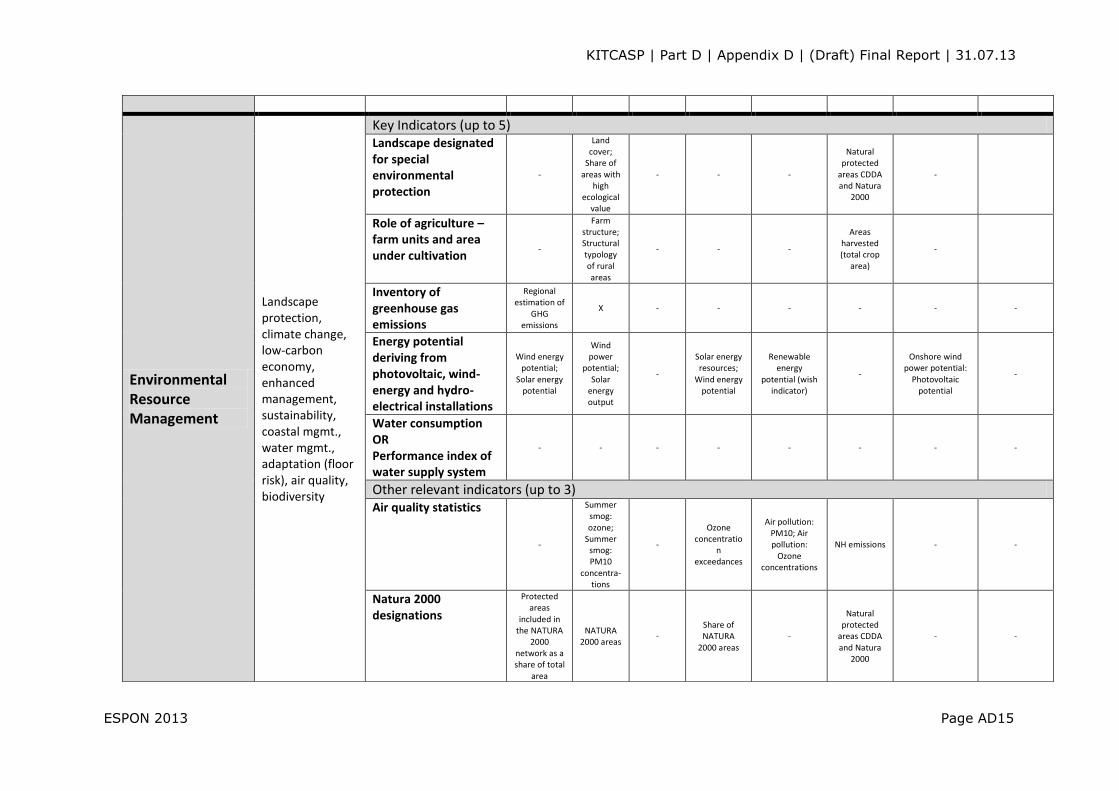
Environmental Resource Management
Landscape protection, climate change, low-carbon economy, enhanced management, sustainability, coastal mgmt., water mgmt., adaptation (floor risk), air quality, biodiversity
Key Indicators (up to 5) Landscape designated for special environmental protection
-
Land cover;
Share of areas with
high ecological
value
- - -
Natural protected
areas CDDA and Natura
2000
-
Role of agriculture – farm units and area under cultivation
-
Farm structure; Structural typology of rural areas
- - -
Areas harvested (total crop
area)
-
Inventory of greenhouse gas emissions
Regional estimation of
GHG emissions
X - - - - - -
Energy potential deriving from photovoltaic, wind-energy and hydro-electrical installations
Wind energy potential;
Solar energy potential
Wind power
potential; Solar
energy output
-
Solar energy resources;
Wind energy potential
Renewable energy
potential (wish indicator)
-
Onshore wind power potential:
Photovoltaic potential
-
Water consumption OR Performance index of water supply system
- - - - - - - -
Other relevant indicators (up to 3) Air quality statistics
-
Summer smog: ozone;
Summer smog: PM10
concentra-tions
-
Ozone concentratio
n exceedances
Air pollution: PM10; Air pollution:
Ozone concentrations
NH emissions - -
Natura 2000 designations
Protected areas
included in the NATURA
2000 network as a share of total
area
NATURA 2000 areas
- Share of NATURA
2000 areas -
Natural protected
areas CDDA and Natura
2000
- -

KITCASP | Part D | Appendix D | (Draft) Final Report | 31.07.13
ESPON 2013 Page AD16
* The Latvian case study also cross-checked the proposed indicators against the ESPON BSR-TeMo project “Territorial Monitoring for the Baltic Sea Region”. The BSR-TeMo project is developing specific indicator-based monitoring systems for the Baltic Sea Region (BSR).
Bio fuel consumption
- Renewable energy
consumption
- - - - - -
WISH LIST Mobility and Infrastructure
Connectivity, modal split, modes of travel, motorisation
Key Indicators (up to 5) Index of artificialisation for infrastructure
- - - - - - - -
Modal split of transport (public, foot and bicycle, and automobile)
-
Multimodal
accessibility (?)
- - -
Multimodal potential
accessibility (?)
- -
Modal split of freight transport (road, rail)
- - - - - - - -
Bicycle way network - - - - - - - -
Mobility of population by foot and bicycle
- - - - - - - -
Index of motorisation - - - - - - - -
Mode of travel to capital city of the region
- - - - - - - -
Air /Maritime transport
Potential accessibility
by air- - - -
Accessibility potential by air-
- - -

KITCASP | Part D | Appendix D | (Draft) Final Report | 31.07.13
ESPON 2013 Page AD17
KITCASP | Part D | Appendix D | (Draft) Final Report | 31.07.13
ESPON 2013 Page AD18
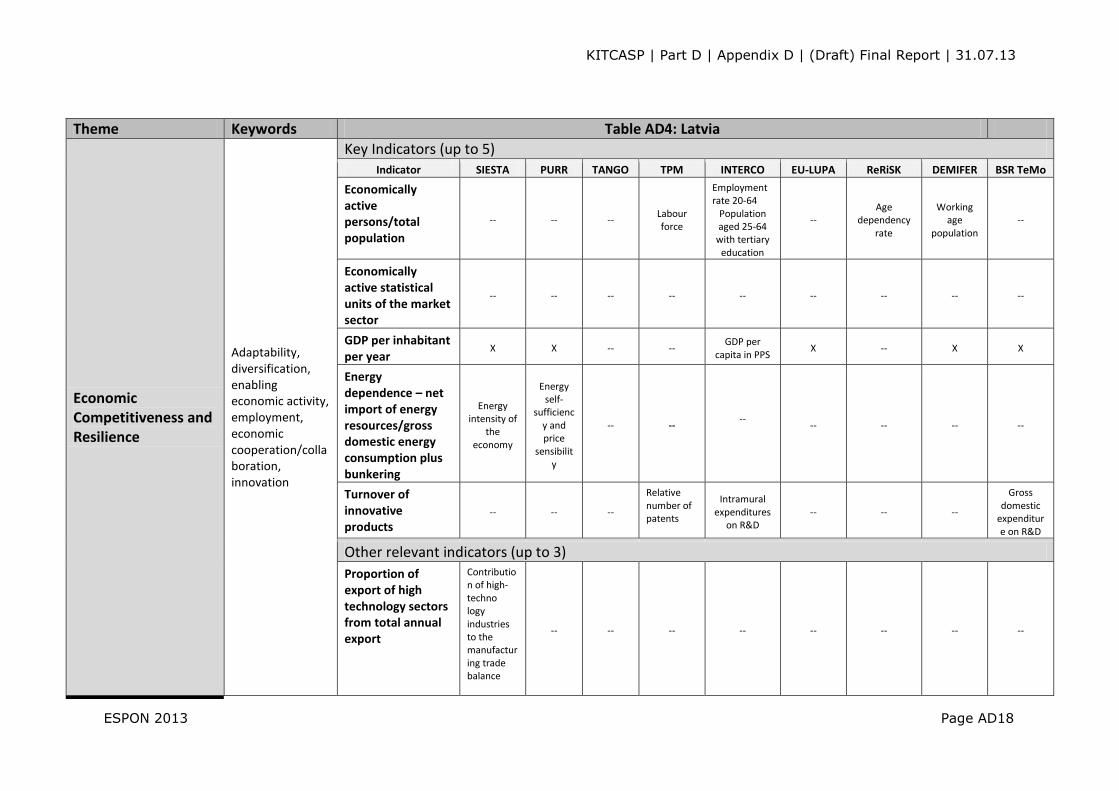
Theme Keywords Table AD4: Latvia
Economic Competitiveness and Resilience
Adaptability, diversification, enabling economic activity, employment, economic cooperation/collaboration, innovation
Key Indicators (up to 5) Indicator SIESTA PURR TANGO TPM INTERCO EU-LUPA ReRiSK DEMIFER BSR TeMo
Economically active persons/total population
-- -- -- Labour force
Employment rate 20-64
Population aged 25-64
with tertiary education
-- Age
dependency rate
Working age
population --
Economically active statistical units of the market sector
-- -- -- -- -- -- -- -- --
GDP per inhabitant per year
X X -- -- GDP per
capita in PPS X -- X X
Energy dependence – net import of energy resources/gross domestic energy consumption plus bunkering
Energy intensity of
the economy
Energy self-
sufficiency and price
sensibility
-- -- --
-- -- -- --
Turnover of innovative products
-- -- --
Relative number of patents
Intramural expenditures
on R&D -- -- --
Gross domestic
expenditure on R&D
Other relevant indicators (up to 3)
Proportion of export of high technology sectors from total annual export
Contribution of high-techno logy industries to the manufacturing trade balance
-- -- -- -- -- -- -- --

KITCASP | Part D | Appendix D | (Draft) Final Report | 31.07.13
ESPON 2013 Page AD19
Labor productivity
X -- -- --
Labour productivity per person employed
-- -- -- --
Total amount of foreign direct investment contributions per 1000 inhabitants of the municipality
- -- -- -- -- -- -- -- --
Managed Spatial Development
Balanced regional development, settlement-infrastructure alignment, well-managed, effective, coherent to local needs, compact cities, polycentricity, territorial capacities and assets
Key Indicators (up to 5) Proportion of urban/rural inhabitants
-- X -- -- -- -- -- -- --
Population density -- X -- -- -- X -- X --
Total number of jobs in municipality versus number of persons in working ages (15-61 y.o.) in the municipality
- -- -- -- -- -- -- -- Employment rate (20-
64y)
Dispersion of regional GDP per capita
-- -- -- -- -- X -- -- --
Number of the serviced air traffic passengers in the largest airports (over 1 Mill. Passengers per year)
-- Potential accessibility by air
--
Accessibility to
passenger flights
Accessibility potential by
air
-- Intensity of air-travel
-- Access by
air
Other relevant indicators (up to 3) Access to public transport
--
Multimodal
accessibility
-- --
Accessibility potential by road
-- Commuting
between regions
-- --

KITCASP | Part D | Appendix D | (Draft) Final Report | 31.07.13
ESPON 2013 Page AD20
Access to nearest railway station
& potential by road
Accessibility potential by road
Number of pupils in schooling age versus number of places in -schools within municipality (national, local municipality level)
-- -- -- Young age dependenc
y ratio -- -- -- -- --
Social Cohesion and Quality of Life
People, equality, well-being, access to services, choice, connecting to work/schools, green areas, healthy living
Key Indicators (up to 5) Broadband internet Connection Broadband Internet Connection in enterprises with the number of 10 or more employees
Broadband penetration
Households with
broadband access
--
Share of households
with broadband
internet connection
-- X -- -- Households with Access to internet
Pre- retirement age unemployment -- -- -- --
Overall unemployme
nt rate
Unemployment rate
Employment in transport
sector Long-term
unemployment
-- --
Poverty risk index (after social transfers)
X At risk of poverty
rate -- -- -- --
Economic activity rate
-- X
Number of registered criminal offences per 1000 inhabitants
-- -- -- -- -- -- -- -- --
Participation of voters in the elections of local
-- Electoral participat
ion -- -- -- -- -- -- --

KITCASP | Part D | Appendix D | (Draft) Final Report | 31.07.13
ESPON 2013 Page AD21
governments-
Other relevant indicators (up to 3) Youth unemployment
Youth unemployment rate
-- -- Unemployment rate
--
Unemployment rate
Long-term unemployme
nt -- X
GINI coefficient - -- -- -- -- -- -- -- --
Satisfaction with Life
- Happines
s Index -- -- -- -- -- -- --
Environmental Resource Management
Landscape protection, climate change, low-carbon economy, enhanced management, sustainability, coastal mgmt., water mgmt., adaptation (floor risk), air quality, biodiversity
Key Indicators (up to 5) Share of unused agricultural land as % of total agricultural land
-- -- -- -- -- Agricultural
accounts -- -- --
Forest cover -- -- -- -- -- -- -- -- --
Land area occupied by public open space --
% of green space
and open space per inhabitan
t
-- -- -- Green areas
-- -- --
Share of population living in flood-prone territories
- -- -- -- -- -- -- Climate change
--
Proportion of recycled waste, %
Coverage rate of
municipal waste
collection
-- -- -- -- -- -- -- --
Other relevant indicators (up to 3) Number of Eco schools, %
-- -- -- -- -- -- -- -- --
Number of biological farms
-- -- -- -- -- -- -- -- --
Rural Bird index -- -- -- -- -- -- -- -- --

KITCASP | Part D | Appendix D | (Draft) Final Report | 31.07.13
ESPON 2013 Page AD22

KITCASP | Part D | Appendix D | (Draft) Final Report | 31.07.13
ESPON 2013 Page AD23

KITCASP | Part D | Appendix D | (Draft) Final Report | 31.07.13
ESPON 2013 Page AD24
Theme Keywords Table AD5: Iceland
Economic Competitiveness and Resilience
Adaptability, diversification, enabling economic activity, employment, economic cooperation/collaboration, innovation
Key Indicators (up to 5) Indicator SIESTA PURR TANGO TPM INTERCO EU-LUPA ReRiSK DEMIFER
GDP per capita x x - - GDP per
capita in PPS x x x
Unemployment rate Unemploy
ment rate, age group
15 and over
x -
Unemployed
persons /
active population
Overall unemployme
nt rate
Unmploy-ment rate
Longterm unemploy-
ment x
Participation higher education
Share of population
having completed
tertiary education
aged group 25-64
Share of tertiary
educated people
-
Share of population
with tertiary
education
- - -
Share of tertiary
education, 15+
Demographic structure
Ageing index
Population
Population change
-
Young age dependenc
y ratio
Old age dependenc
y ratio
Median age
Old age dependency
ratio
Ageing index
- Age
dependency ratio
Share of people 65+
And there are more indicators
referring to demographic structure
Share of GDP in R&D
R&D expendi-
ture in % of GDP
Total R&D
expendi-tures
- Expenditure on R&D
R&D expenditure in % of GDP
- - -
Other relevant indicators (up to 3)
E-governance ranking
Broadband penetration
Households with
broadband access
-
Share of households
with broadband
internet connection
- Household
with broadband
- -
Activity rate Employment rate of
Employ-ment
- Labour Force
Employment rate 20-64
- Economic
activity rate Labour
participatio

KITCASP | Part D | Appendix D | (Draft) Final Report | 31.07.13
ESPON 2013 Page AD25
the age group 20-
64
population aged 25-64
with tertiary education
n rate in %
Persons 20-39 years as a share of total population
Ageing index
Population Aged 30-34
with a Tertiary
education
Depend-ency ratio
-
Young age dependenc
y ratio
Old age dependenc
y ratio
- - - x
Integrated Spatial Development
Balanced regional development, settlement-infrastructure alignment, well-managed, effective, coherent to local needs, compact cities, polycentricity, territorial capacities and assets
Key Indicators (up to 5) Apartments within agricultural areas without relation with agricultural activites
- - - - - - - -
Population density - x - - - x - x
Households - - - - - - - -
Apartments - - - - - - - -
Transport mode
-
Multimodal
accessibility
And
more similar
indicators
- - - - - -
Other relevant indicators (up to 3) Apartments, number of rooms
- - - - - - - -
Agricultural land use
- - - - - Area
harvested - -
Travel distances in commuting
Share of people
commuting
Areas in 45
minutes reach
-
Daily population accessible
by car
Population potential
within 50 km -
Population commuting to other regions
/
-
KITCASP | Part D | Appendix D | (Draft) Final Report | 31.07.13
ESPON 2013 Page AD26
from an urban
population working in the same
region
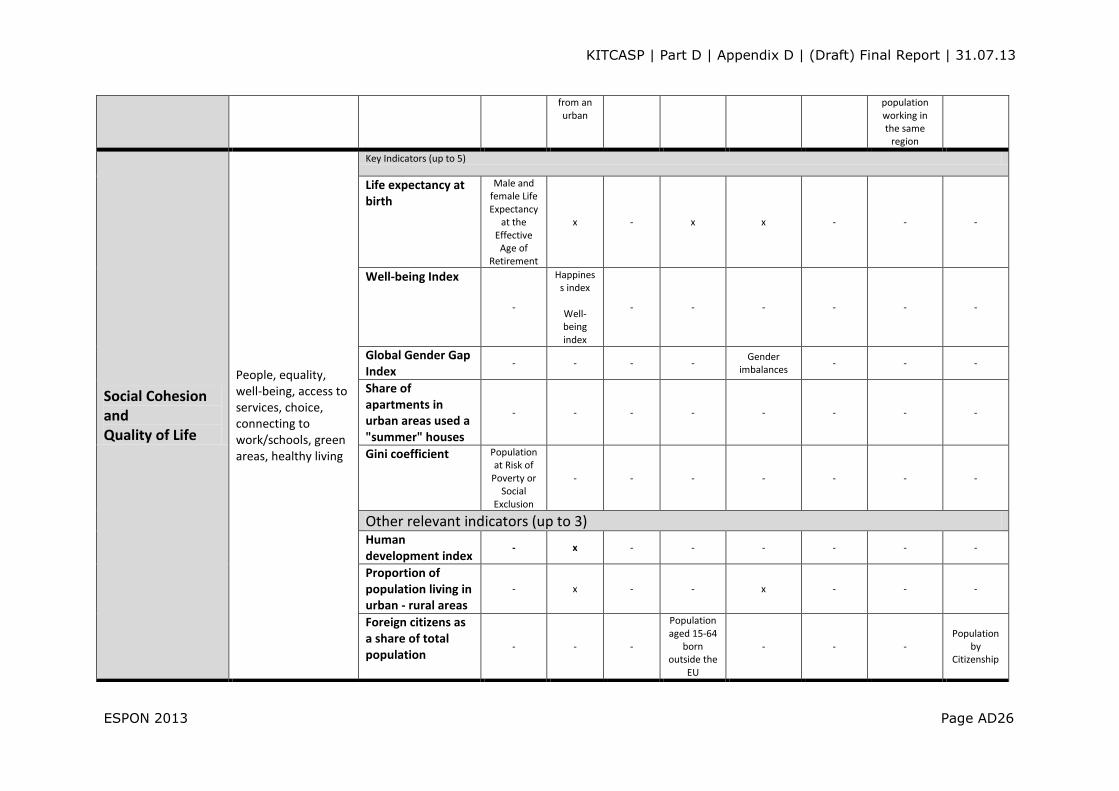
Social Cohesion and Quality of Life
People, equality, well-being, access to services, choice, connecting to work/schools, green areas, healthy living
Key Indicators (up to 5)
Life expectancy at birth
Male and female Life Expectancy
at the Effective
Age of Retirement
x - x x - - -
Well-being Index
-
Happiness index
Well-being index
- - - - - -
Global Gender Gap Index
- - - - Gender
imbalances - - -
Share of apartments in urban areas used a "summer" houses
- - - - - - - -
Gini coefficient Population at Risk of
Poverty or Social
Exclusion
- - - - - - -
Other relevant indicators (up to 3) Human development index
- x - - - - - -
Proportion of population living in urban - rural areas
- x - - x - - -
Foreign citizens as a share of total population
- - -
Population aged 15-64
born outside the
EU
- - - Population
by Citizenship

KITCASP | Part D | Appendix D | (Draft) Final Report | 31.07.13
ESPON 2013 Page AD27
Environmental Resource Management
Landscape protection, climate change, low-carbon economy, enhanced management, sustainability, coastal mgmt., water mgmt., adaptation (floor risk), air quality, biodiversity
Key Indicators (up to 5) Renewable energy production
Share of renewable energy in gross final
energy consumptio
n
Energy self
suffiency and price senibility
- - - - - -
Release of greenhouse gases from transportation
- - - - - -
Spending on transport fuel for freight as
% of GDP
-
Wilderness areas not disturbed by human activity
- - -
Share of NATURA
2000 areas
(Are those areas
undisturbed?)
- - - -
Size of defined protection areas
Protected areas
included in Natura2000
network
- - Share of NATURA
2000 areas -
Agricultural area in
protected area
Green areas
Green
areas close to
residential areas
(Based on percentage of artificial
area)
- -
% of waste recycled
- - - - - - - -
Other relevant indicators (up to 3) Share of food produced
- - - - - - - -

KITCASP | Part D | Appendix D | (Draft) Final Report | 31.07.13
ESPON 2013 Page AD28
domestically in Iceland
Net greenhouse gas emissions
Green Gas Emission - - - - - - -
Share of renewable energy in land transportation and fisheries
- - - Fuel costs of freight
traffic as % of GDP
- - Spending on transport fuel for freight as
% of GDP
-

KITCASP | Part D | Appendix D | (Draft) Final Report | 31.07.13
ESPON 2013 Page AD29
KITCASP | Part D | Appendix D | (Draft) Final Report | 31.07.13
ESPON 2013 Page AD30

KITCASP | Part D | Appendix D | (Draft) Final Report | 31.07.13
ESPON 2013 Page AD31
The ESPON 2013 Programme is part-financed by the European Regional Development Fund, the EU Member States and the Partner States Iceland, Liechtenstein, Norway and Switzerland. It shall support policy development in relation to the aim of territorial cohesion and a harmonious development of the European territory.
ISBN