kişladağ milling project turkey hydroxide ... polyvinyl chloride ..... ... drilling campaigns...
TRANSCRIPT

Technical Report Kişladağ Milling Project
Turkey
Centered on Latitude 38° 28' 56" N and Longitude 29° 08' 58" E
Effective Date: March 16, 2018
Prepared by: Eldorado Gold Corporation
1188 Bentall 5 - 550 Burrard Street Vancouver, BC V6C 2B5
Qualified Person Company Mr. David Sutherland, P.Eng. Eldorado Gold Corporation Dr. Stephen Juras, P.Geo. Eldorado Gold Corporation Mr. Paul Skayman, FAusIMM Eldorado Gold Corporation Mr. John Nilsson, P.Eng. Nilsson Mine Services Ltd.
K I Ş L A D A Ğ M I L L I N G P R O J E C T , T U R K E Y
T E C H N I C A L R E P O R T
2018 Final Report i
TABLE OF CONTENTS
SECTION • 1 SUMMARY ................................................................................................................ 1-1 1.1 Introduction ................................................................................................... 1-1 1.2 Property Description ..................................................................................... 1-2 1.3 History........................................................................................................... 1-4 1.4 Geology and Mineralization .......................................................................... 1-5 1.5 Drilling, Sampling and Analyses ................................................................... 1-5 1.6 Mineral Processing ....................................................................................... 1-6 1.7 Mineral Resources Estimates ....................................................................... 1-6 1.8 Mineral Reserves .......................................................................................... 1-8 1.9 Mining Methods ............................................................................................ 1-9 1.10 Previous Recovery Methods ........................................................................ 1-9 1.11 Project Infrastructure .................................................................................. 1-11 1.12 Market Studies and Contracts .................................................................... 1-12 1.13 Environmental ............................................................................................. 1-12 1.14 Capital and Operating Costs ...................................................................... 1-13 1.15 Economic Analysis ..................................................................................... 1-15 1.16 Other Relevant Data and Information ......................................................... 1-16 1.17 Interpretations and Conclusions ................................................................. 1-17 1.18 Recommendations ...................................................................................... 1-17
SECTION • 2 INTRODUCTION ....................................................................................................... 2-1 SECTION • 3 RELIANCE ON OTHER EXPERTS .......................................................................... 3-1 SECTION • 4 PROPERTY DESCRIPTION AND LOCATION ........................................................ 4-1
4.1 Introduction ................................................................................................... 4-1 4.2 Property Location ......................................................................................... 4-1 4.3 Land Tenure ................................................................................................. 4-2 4.4 Royalties ....................................................................................................... 4-2 4.5 Environmental Liabilities ............................................................................... 4-2 4.6 Permits and Agreements .............................................................................. 4-4
SECTION • 5 ACCESSIBILITY, CLIMATE, LOCAL RESOURCES, INFRASTRUCTURE AND PHYSIOGRAPHY ...................................................................................................... 5-1 5.1 Site Topography ........................................................................................... 5-1 5.2 Accessibility .................................................................................................. 5-1 5.3 Physiography and Climate ........................................................................... 5-1 5.4 Local Resources ........................................................................................... 5-1
SECTION • 6 HISTORY ................................................................................................................... 6-1
K I Ş L A D A Ğ M I L L I N G P R O J E C T , T U R K E Y
T E C H N I C A L R E P O R T
2018 Final Report ii
SECTION • 7 GEOLOGICAL SETTING AND MINERALIZATION ................................................. 7-1 7.1 Regional Geology ......................................................................................... 7-1 7.2 Local Geology ............................................................................................... 7-1
SECTION • 8 DEPOSIT TYPES ...................................................................................................... 8-1 8.1 Deposit Geology ........................................................................................... 8-1 8.2 Deposit Model ............................................................................................... 8-3
SECTION • 9 EXPLORATION ......................................................................................................... 9-1 SECTION • 10 DRILLING ................................................................................................................ 10-1 SECTION • 11 SAMPLE PREPARATION, ANALYSES AND SECURITY .................................... 11-1
11.1 Sample Preparation and Assaying ............................................................. 11-1 11.2 Quality Assurance/Quality Control (QA/QC) .............................................. 11-2 11.3 Sample Counts for QA/QC ......................................................................... 11-2 11.4 Blank Sample Performance ........................................................................ 11-3 11.5 Standards Performance.............................................................................. 11-4 11.6 Duplicate Performance ............................................................................... 11-6 11.7 Specific Gravity Program ............................................................................ 11-9 11.8 Concluding Statement ................................................................................ 11-9
SECTION • 12 DATA VERIFICATION ............................................................................................ 12-1 SECTION • 13 MINERAL PROCESSING AND METALLURGICAL TESTWORK ........................ 13-1
13.1 Introduction ................................................................................................. 13-1 13.2 Ore Characterization .................................................................................. 13-1 13.3 Comminution Testwork ............................................................................... 13-1 13.4 Flotation Testwork ...................................................................................... 13-3 13.5 Cyanidation Testwork ................................................................................. 13-4 13.6 Gold/Silver Adsorption on Activated Carbon .............................................. 13-5 13.7 Preliminary Cyanide Detoxification ............................................................. 13-6 13.8 Thickening Testwork ................................................................................... 13-7 13.9 Detoxed CIP Tailing Filtration ..................................................................... 13-7 13.10 Geotechnical Testwork – Material Characterization ................................... 13-8 13.11 Future Testwork .......................................................................................... 13-9
SECTION • 14 MINERAL RESOURCE ESTIMATES ..................................................................... 14-1 14.1 Geologic Models ......................................................................................... 14-1 14.2 Data Analysis .............................................................................................. 14-1 14.3 Evaluation of Extreme Grades ................................................................... 14-3 14.4 Variography ................................................................................................ 14-3 14.5 Model Setup ............................................................................................... 14-3 14.6 Estimation ................................................................................................... 14-4 14.7 Modelling of Gold Recovery from Bottle Roll Data ..................................... 14-6
K I Ş L A D A Ğ M I L L I N G P R O J E C T , T U R K E Y
T E C H N I C A L R E P O R T
2018 Final Report iii
14.8 Validation .................................................................................................... 14-7 14.9 Mineral Resource Summary ..................................................................... 14-11
SECTION • 15 MINERAL RESERVE ESTIMATES ........................................................................ 15-1 15.1 Mineral Reserve Classification and Summary ........................................... 15-1 15.2 Open Pit Optimization................................................................................. 15-2 15.3 Pit Design ................................................................................................. 15-12 15.4 Mineral Reserves ...................................................................................... 15-14 15.5 Risk Factors .............................................................................................. 15-14
SECTION • 16 MINING METHODS ................................................................................................. 16-1 16.1 Introduction ................................................................................................. 16-1 16.2 Mine Design ................................................................................................ 16-3 16.3 Mine Production Schedule ......................................................................... 16-5
SECTION • 17 RECOVERY METHODS ......................................................................................... 17-1 17.1 General Description .................................................................................... 17-1 17.2 Previous Recovery Methods ...................................................................... 17-1 17.3 Process Selection ....................................................................................... 17-2 17.4 Plant Design Basis ..................................................................................... 17-3 17.5 Process Description .................................................................................... 17-3 17.6 Plant Services ........................................................................................... 17-11 17.7 Process Consumables, Reagents and Chemicals ................................... 17-13 17.8 Process Control Philosophy ..................................................................... 17-15
SECTION • 18 PROJECT INFRASTRUCTURE ............................................................................. 18-1 18.1 Site Location ............................................................................................... 18-1 18.2 Site Infrastructure ....................................................................................... 18-1 18.3 Water Management .................................................................................... 18-6
SECTION • 19 MARKET STUDIES AND CONTRACTS ................................................................ 19-1 19.1 Markets ....................................................................................................... 19-1 19.2 Contracts .................................................................................................... 19-1 19.3 Taxes .......................................................................................................... 19-1
SECTION • 20 ENVIRONMENTAL STUDIES, PERMITTING AND SOCIAL OR COMMUNITY IMPACT ................................................................................................................... 20-1 20.1 Baseline Conditions .................................................................................... 20-1 20.2 Environmental Considerations ................................................................... 20-1 20.3 Social Impact .............................................................................................. 20-2
SECTION • 21 CAPITAL AND OPERATING COSTS .................................................................... 21-1 21.1 Capital Costs .............................................................................................. 21-1 21.2 Operating Costs .......................................................................................... 21-6
SECTION • 22 ECONOMIC ANALYSIS .......................................................................................... 22-1

K I Ş L A D A Ğ M I L L I N G P R O J E C T , T U R K E Y
T E C H N I C A L R E P O R T
2018 Final Report iv
22.1 Summary .................................................................................................... 22-1 22.2 Methods, Assumptions and Basis .............................................................. 22-1 22.3 Production Schedule .................................................................................. 22-2 22.4 Cash Flows ................................................................................................. 22-2 22.5 Royalties and Other Fees ........................................................................... 22-7 22.6 Closure and Salvage Value ........................................................................ 22-7 22.7 Taxation ...................................................................................................... 22-7 22.8 Financing Costs .......................................................................................... 22-8 22.9 Third Party Interests ................................................................................... 22-8 22.10 Sensitivity Analysis ..................................................................................... 22-8
SECTION • 23 ADJACENT PROPERTIES ..................................................................................... 23-1 SECTION • 24 OTHER RELEVANT DATA AND INFORMATION ................................................. 24-1
24.1 Kişladağ Phase IV Infrastructure and Equipment ...................................... 24-1 24.2 Schedule ..................................................................................................... 24-1 24.3 Manpower Estimate .................................................................................... 24-2 24.4 Heap Leach/Milling ..................................................................................... 24-3 24.5 Reconciliation ............................................................................................. 24-4 24.6 Risks and Opportunities ............................................................................. 24-5
SECTION • 25 INTERPRETATION AND CONCLUSIONS ............................................................ 25-1 25.1 Mineral Resources and Mineral Reserves ................................................. 25-1 25.2 Mining Methods .......................................................................................... 25-1 25.3 Metallurgical Testwork ................................................................................ 25-2 25.4 Process Design .......................................................................................... 25-2 25.5 Project Infrastructure .................................................................................. 25-3 25.6 Waste Rock Dump ...................................................................................... 25-3 25.7 Tailings Management Facility ..................................................................... 25-4 25.8 Capital and Operating Costs ...................................................................... 25-4 25.9 Economic Analysis ..................................................................................... 25-4 25.10 Permitting ................................................................................................... 25-5
SECTION • 26 RECOMMENDATIONS ........................................................................................... 26-1 26.1 Mining ......................................................................................................... 26-1 26.2 Processing .................................................................................................. 26-1 26.3 Infrastructure .............................................................................................. 26-2 26.4 Operations .................................................................................................. 26-2 26.5 Permitting ................................................................................................... 26-2
SECTION • 27 REFERENCES ........................................................................................................ 27-1 SECTION • 28 CERTIFICATES OF AUTHORS AND DATE AND SIGNATURE PAGE ............... 28-1
K I Ş L A D A Ğ M I L L I N G P R O J E C T , T U R K E Y
T E C H N I C A L R E P O R T
2018 Final Report v
LIST OF FIGURES
Figure 1-1: Location Map showing Western Turkey ............................................................................... 1-2 Figure 1-2: Kişladağ Land Position......................................................................................................... 1-3 Figure 1-3: Simplified Flowsheet of Kişladağ Milling ............................................................................ 1-11 Figure 1-4: Sensitivity Analysis – IRR after Tax ................................................................................... 1-16 Figure 4-1: Location Map showing Project Location in Western Turkey ................................................ 4-1 Figure 5-1: Project Road Map ................................................................................................................ 5-2 Figure 7-1: Geological Map of Uşak-Güre Basin showing the Location of the major Volcanic centers and Kışladağ Mine (modified after Karaoğlu et al., 2010). ............................................................................ 7-3 Figure 7-2: Geological Map of the Kışladağ Deposit and surrounding Area (modified from Baker et al., 2016). ............................................................................................................................................ 7-4 Figure 8-1: Geological Cross Section of the Kışladağ Deposit (modified from Baker et al., 2016) ....... 8-1 Figure 8-2: Scanning Electron Microscope Images of Au located within Pyrite in Argillic Altered Sample and K-feldspar in Potassic altered Sample ............................................................................................ 8-4 Figure 10-1: Kışladağ Mine Drillhole Location Map.............................................................................. 10-2 Figure 11-1: Kışladağ Blank Data – 2010 to 2011 Standard Blank COB05 ......................................... 11-3 Figure 11-2: Kışladağ Blank Data – 2015 to 2016 Standard Blank COB07 ......................................... 11-4 Figure 11-3: Standard Reference Material Chart, 2010 to 2011, Standard COS053 (KIS-14) ............ 11-5 Figure 11-4: Standard Reference Material Chart, 2010 to 2011, Standard COS055 (KIS-16) ............ 11-5 Figure 11-5: Standard Reference Material Chart, 2015 to 2016, Standard COS058 (KIS-19) ............ 11-6 Figure 11-6: Standard Reference Material Chart, 2015 to 2016, Standard COS081 (SLGR05) ......... 11-6 Figure 11-7: Relative Difference Plot of Kışladağ Coarse Reject Duplicate Data, 2010 to 2011 ........ 11-7 Figure 11-8: Percentile Rank Plot, Kışladağ Coarse Reject Duplicate Data, 2010 to 2011................. 11-7 Figure 11-9: Relative Difference Plot of Kışladağ Pulp Duplicate Data, 2015 to 2016 ........................ 11-8 Figure 11-10: Percentile Rank Plot, Kışladağ Pulp Duplicate Data, 2015 to 2016 .............................. 11-8 Figure 13-1: Gold Recovery by Flotation of Various Ore Samples ...................................................... 13-3 Figure 13-2: Gold/Silver Carbon Loading Isotherms ............................................................................ 13-5 Figure 13-3: Gold Extraction of Various Ore Types ............................................................................. 13-6 Figure 14-1: Relationship between the PACK or Mineralized Shell and Lithology Units ..................... 14-2 Figure 14-2: West – East Cross Section 4261400 N of Kişladağ modeled Gold Grades (g/t). Measured+Indicated Blocks are Full Size; Inferred Cells are the smaller Set ..................................... 14-7 Figure 14-3: Plan view of Kişladağ modeled gold grades (g/t), 750 m Plan. Measured+Indicated Blocks are Full Size; Inferred Cells are the smaller Set ................................................................................... 14-8 Figure 14-4: West – East Cross Section 4261400 N of Kişladağ Modeled Mill Recovery Values (%). Measured+Indicated Blocks are Full Size; Inferred Cells are the smaller Set ..................................... 14-8 Figure 14-5: Herco Plots for Mineralization Shell ............................................................................... 14-10

K I Ş L A D A Ğ M I L L I N G P R O J E C T , T U R K E Y
T E C H N I C A L R E P O R T
2018 Final Report vi
Figure 15-1: Primary Slope Sector Locations ....................................................................................... 15-5 Figure 15-2: Bench Plan NSR & Lerchs-Grossmann Pit Limits ........................................................... 15-7 Figure 15-3: Cross Section Looking North ........................................................................................... 15-7 Figure 15-4: Cross Section Looking West ............................................................................................ 15-8 Figure 15-5: Pit Optimization Shells ................................................................................................... 15-10 Figure 15-6 Pit Optimization Shells .................................................................................................... 15-11 Figure 15-7: Topography Surface Year End 2017 ............................................................................. 15-12 Figure 15-8: Final Pit Limits ................................................................................................................ 15-13 Figure 15-9: Cross Section Looking Southwest ................................................................................. 15-13 Figure 16-1: General Arrangement....................................................................................................... 16-2 Figure 16-2: Design Elements .............................................................................................................. 16-3 Figure 16-3: Pit Phase Solids ............................................................................................................... 16-4 Figure 16-4: Pit Phase Section ............................................................................................................. 16-5 Figure 16-5: Mine Material Movement Schedule .................................................................................. 16-6 Figure 16-6: Mine Development 2018 .................................................................................................. 16-8 Figure 16-7: Mine Development 2020 .................................................................................................. 16-9 Figure 16-8: Mine Development 2022 .................................................................................................. 16-9 Figure 16-9: Mine Development 2025 ................................................................................................ 16-10 Figure 16-10: Mine Development 2029 .............................................................................................. 16-10 Figure 16-11: Current Waste Dump Configuration ............................................................................. 16-11 Figure 16-12: SRD Current Design .................................................................................................... 16-12 Figure 16-13: SRD Expansion ............................................................................................................ 16-12 Figure 17-1: Simplified Flowsheet of Kişladağ Milling .......................................................................... 17-4 Figure 18-1: Project Area ..................................................................................................................... 18-2 Figure 21-1: Organizational Chart - Additional Mill Labour ................................................................ 21-10 Figure 22-1: Kişladağ Production Schedule and Grade ....................................................................... 22-2 Figure 22-2: Sensitivity Analysis – NPV 5% after Tax.......................................................................... 22-9 Figure 22-3: Sensitivity Analysis – IRR after Tax ............................................................................... 22-10 Figure 24-1: Kişladağ Milling Project, Implementation Schedule ......................................................... 24-2 Figure 24-2: Kişladağ Milling Project, Manpower Curve ...................................................................... 24-3

K I Ş L A D A Ğ M I L L I N G P R O J E C T , T U R K E Y
T E C H N I C A L R E P O R T
2018 Final Report vii
LIST OF TABLES
Table 1-1: Kişladağ Mineral Resources, as of December 31, 2017 ....................................................... 1-7 Table 1-2: Kişladağ, Mineral Reserves Effective December 31, 2017 ................................................... 1-8 Table 1-3: Capital Cost Summary ........................................................................................................ 1-13 Table 1-4: Operating Costs Summary .................................................................................................. 1-14 Table 1-5: Economic Analysis Summary .............................................................................................. 1-15 Table 1-6: Sensitivity Analysis – Internal Rate of Return, after Tax ..................................................... 1-16 Table 2-1: Cross-reference List .............................................................................................................. 2-2 Table 4-1: Royalties Calculation ............................................................................................................. 4-3 Table 4-2: Permitting Process Milestones .............................................................................................. 4-4 Table 4-3: Key Project Permits ............................................................................................................... 4-5 Table 8-1: Summary of Au Deportment at Kışladağ and associated Minerals in terms of % Au Grain Boundary in contact with specified Mineral Type ................................................................................... 8-4 Table 10-1: Summary of Kışladağ Mine Drilling ................................................................................... 10-1 Table 11-1: Number of Samples used for 2010-2011 and 2015-2016 Drill Campaigns ...................... 11-3 Table 13-1: Summary of Grinding Testwork for Kişladağ Ores ............................................................ 13-2 Table 13-2: Batch Cyanide Detoxification Testwork of Various Ore Samples ..................................... 13-7 Table 13-3: Thickening Testwork Data and Thickener Sizing .............................................................. 13-7 Table 13-4: Detoxed CIP Tailings Filtration of Various Ore Samples .................................................. 13-8 Table 13-5: Flow Properties of Various Ore Types .............................................................................. 13-9 Table 14-1: Kişladağ Deposit Statistics for 5 m Composites – Au g/t Data ......................................... 14-3 Table 14-2: Au Correlogram Parameters for Kişladağ Deposit ............................................................ 14-5 Table 14-3: Azimuth and Dip Angles of Rotated Correlogram Axes, Kişladağ Deposit ....................... 14-5 Table 14-4: Global Model Mean Gold Values by Mineralized Shell Domain ..................................... 14-10 Table 14-5: Kişladağ Mineral Resources, as of December 31, 2017 ................................................. 14-11 Table 15-1: Kişladağ, Mineral Reserve Estimates Effective December 31, 2017 ................................ 15-1 Table 15-2: Recovery Summary ........................................................................................................... 15-4 Table 15-3: Block Model Limits 2018 ................................................................................................... 15-4 Table 15-4: Slope Sector Parameters .................................................................................................. 15-6 Table 15-5: Lerchs-Grossmann in-Pit Resources ................................................................................ 15-8 Table 15-6: Kişladağ, Mineral Reserves Effective December 31, 2017 ............................................. 15-14 Table 16-1: Major Mining Equipment ................................................................................................... 16-1 Table 16-2: Final Pit Dimensions.......................................................................................................... 16-4 Table 16-3: Mine Material Movement Schedule ................................................................................... 16-7 Table 21-1: Exchange Rates ................................................................................................................ 21-1

K I Ş L A D A Ğ M I L L I N G P R O J E C T , T U R K E Y
T E C H N I C A L R E P O R T
2018 Final Report viii
Table 21-2: Capital Cost Summary ...................................................................................................... 21-2 Table 21-3: Initial Capital Cost Estimate Accuracy Analysis ................................................................ 21-2 Table 21-4: Primary Source for Unit Costs ........................................................................................... 21-3 Table 21-5: Primary Source of Quantities ............................................................................................ 21-3 Table 21-6: Basis of Indirect Costs ....................................................................................................... 21-4 Table 21-7: Basis of Owner’s Costs ..................................................................................................... 21-4 Table 21-8: Basis of Sustaining Capital ............................................................................................... 21-5 Table 21-9: Operating Costs ................................................................................................................ 21-7 Table 21-10: Existing Operations Cost Summary ................................................................................ 21-8 Table 22-1: Kişladağ Production Schedule .......................................................................................... 22-3 Table 22-2: Kişladağ Operating Cost Schedule ................................................................................... 22-4 Table 22-3: Kişladağ Capital Cost Schedule ........................................................................................ 22-5 Table 22-4: Kişladağ Income Statement .............................................................................................. 22-6 Table 22-5: Kişladağ Cashflows ........................................................................................................... 22-6 Table 22-6: Kişladağ Economics .......................................................................................................... 22-6 Table 22-7: Gold Royalty ...................................................................................................................... 22-7 Table 22-8: Depreciation Rates for Corporate Income Tax ................................................................. 22-8 Table 22-9: Sensitivity Analysis – Net Present Value at 5% Discount, after Tax ................................. 22-9 Table 22-10: Sensitivity Analysis – Internal Rate of Return, after Tax ............................................... 22-10 Table 24-1: Historical Ore Reconciliation ............................................................................................. 24-4
K I Ş L A D A Ğ M I L L I N G P R O J E C T , T U R K E Y
T E C H N I C A L R E P O R T
2018 Final Report ix
GLOSSARY
Units of Measure Annum (year) ............................................................................................................................ a Billion ........................................................................................................................................ B Centimeter................................................................................................................................. cm Cubic centimeter ....................................................................................................................... cm3 Cubic meter ............................................................................................................................... m3
Day ............................................................................................................................................ d Days per year (annum) ............................................................................................................. d/a Degree ...................................................................................................................................... ° Degrees Celsius ........................................................................................................................ °C Dollar (American) ...................................................................................................................... US$ Dollar (Canadian) ...................................................................................................................... CAN$ Euro .......................................................................................................................................... € Gallon ........................................................................................................................................ gal Gram ......................................................................................................................................... g Grams per litre .......................................................................................................................... g/L Grams per tonne ....................................................................................................................... g/t Greater than .............................................................................................................................. > Hectare (10,000 m2) .................................................................................................................. ha Horse Power ............................................................................................................................. hp Hour .......................................................................................................................................... h Hour per Year ............................................................................................................................ h/y Kilo (thousand) .......................................................................................................................... k Kilogram .................................................................................................................................... kg Kilograms per cubic meter......................................................................................................... kg/m3 Kilograms per hour .................................................................................................................... kg/h Kilograms per square meter ...................................................................................................... kg/m2 Kilometer ................................................................................................................................... km Kilometers per hour ................................................................................................................... km/h Kilopascal .................................................................................................................................. kPa Kilotonne ................................................................................................................................... kt Kilovolt ...................................................................................................................................... kV Kilowatt hour ............................................................................................................................. kWh Kilowatt hours per tonne ........................................................................................................... kWh/t Kilowatt hours per year ............................................................................................................. kWh/a Kilowatt ..................................................................................................................................... kW Less than................................................................................................................................... < Litre ........................................................................................................................................... L

K I Ş L A D A Ğ M I L L I N G P R O J E C T , T U R K E Y
T E C H N I C A L R E P O R T
2018 Final Report x
Megavolt Ampere ...................................................................................................................... MVA Megawatt................................................................................................................................... MW Meter ......................................................................................................................................... m Meter above Sea Level ............................................................................................................. masl Metric ton (tonne) ...................................................................................................................... t Microns ..................................................................................................................................... µm Milligram .................................................................................................................................... mg Milligrams per litre ..................................................................................................................... mg/L Millilitre ...................................................................................................................................... mL Millimeter ................................................................................................................................... mm Million cubic meters ................................................................................................................... Mm3 Million ounces ........................................................................................................................... Moz Million tonnes per Annum .......................................................................................................... Mtpa Million tonnes ............................................................................................................................ Mt Million ........................................................................................................................................ M Million Years .............................................................................................................................. Ma Newton ...................................................................................................................................... N Ounce ....................................................................................................................................... oz Parts per billion ......................................................................................................................... ppb Parts per million ........................................................................................................................ ppm Percent ...................................................................................................................................... % Percent by Weight ..................................................................................................................... wt% Pound ........................................................................................................................................ lb Square centimeter ..................................................................................................................... cm2 Square kilometer ....................................................................................................................... km2 Square meter ............................................................................................................................ m2 Thousand tonnes ...................................................................................................................... kt Three Dimensional .................................................................................................................... 3D Tonnes per day ......................................................................................................................... t/d or tpd Tonnes per hour ........................................................................................................................ tph Tonnes per year ........................................................................................................................ tpa Turkish Lira ............................................................................................................................... ₺ Volt ............................................................................................................................................ V Watt ........................................................................................................................................... W Weight/volume .......................................................................................................................... w/v Weight/weight ............................................................................................................................ w/w
Abbreviations and Acronyms Acidity or Alkalinity ...................................................................................................................... pH Aluminum .................................................................................................................................... Al Analytical Detection Limit ............................................................................................................ ADL Adsorption, Desorption, Regenerating ........................................................................................ ADR

K I Ş L A D A Ğ M I L L I N G P R O J E C T , T U R K E Y
T E C H N I C A L R E P O R T
2018 Final Report xi
Antimony ..................................................................................................................................... Sb Argillic ......................................................................................................................................... ARG Argon .......................................................................................................................................... Ar Arsenic ........................................................................................................................................ As Association for the Advancement of Cost Engineering ............................................................... AACE Atomic Adsorption ....................................................................................................................... AA Ausenco Engineering Canada .................................................................................................... Ausenco Barium ........................................................................................................................................ Ba Bond Abrasion Index ................................................................................................................... Ai Bond Ball Mill Work Index ........................................................................................................... BWi Bond Rod Mill Work Index........................................................................................................... RWi Bottle Roll.................................................................................................................................... BR Bottle Roll Carbon in Pulp ........................................................................................................... BCIP Bed Volumes ............................................................................................................................... BV Business Opening and Operations Permit .................................................................................. GSM Cadmium..................................................................................................................................... Cd Calcium Hydroxide ...................................................................................................................... Ca(OH)2 Carbon-in-leach .......................................................................................................................... CIL Carbon-in-pulp ............................................................................................................................ CIP Canadian Institute of Mining, Metallurgy, and Petroleum ............................................................ CIM Cobalt ......................................................................................................................................... Co Coefficient of Variance ................................................................................................................ CV Construction Management .......................................................................................................... CM Copper ........................................................................................................................................ Cu Copper Sulphate ......................................................................................................................... CuSO4.5H2O Cyanide ...................................................................................................................................... CN Cyanide Weak Acid Dissociable ................................................................................................. CNWAD Cyanide Total .............................................................................................................................. CNT Diamond Drill Hole ...................................................................................................................... DDH Directorate of State Hydraulic Works .......................................................................................... DSI Semi pure gold alloy ................................................................................................................... Doré East ............................................................................................................................................. E Eldorado Gold Corporation ......................................................................................................... Eldorado Engineering, Procurement, Construction Management .............................................................. EPCM Environmental Impact Assessment ............................................................................................. EIA Environmental Management Plan ............................................................................................... EMP European Union .......................................................................................................................... EU Fast Radial Basis Function ......................................................................................................... FastRBF™ Feasibility Study .......................................................................................................................... FS Flocculant.................................................................................................................................... FLOC Flow Moisture Point .................................................................................................................... FMP Friable ......................................................................................................................................... FRB General and Administration......................................................................................................... G&A General Directorate of State Hydraulic Works ............................................................................ DSI

K I Ş L A D A Ğ M I L L I N G P R O J E C T , T U R K E Y
T E C H N I C A L R E P O R T
2018 Final Report xii
Geological Strength Index ........................................................................................................... GSI Ground-Engaging Tools .............................................................................................................. GET Gold ............................................................................................................................................ Au Gold Equivalent ........................................................................................................................... Au Equiv HERCO Discrete Gaussian Model aka HERCO (Hermite Coefficient) ........................................ Herco High Density Polyethylene .......................................................................................................... HDPE High Grade.................................................................................................................................. HG Hydrochloric Acid ........................................................................................................................ HCl Hydrogen Oxide .......................................................................................................................... H2O Induced Polarization ................................................................................................................... IP Inductively Coupled Plasma ........................................................................................................ ICP Inner Diameter ............................................................................................................................ ID Internal Rate of Return ................................................................................................................ IRR International Financial Reporting Standards ............................................................................... IFRS International Organization for Standardization ............................................................................ ISO Intrusion #3 ................................................................................................................................. INT3 Investment Tax Credit ................................................................................................................. ITC Iron .............................................................................................................................................. Fe Kilborn Engineering Pacific Limited ............................................................................................. Kilborn Kişladağ Concentrate Treatment Plant ....................................................................................... KCTP Lead ............................................................................................................................................ Pb Lerchs-Grossman ....................................................................................................................... L-G Life-of-mine ................................................................................................................................. LOM London Metal Exchange ............................................................................................................. LME Manganese ................................................................................................................................. Mn Mechanical, Piping, Electrical, Instrumentation ........................................................................... MPEI Measured & Indicated ................................................................................................................. M&I Mercury ....................................................................................................................................... Hg Micon International ...................................................................................................................... Micon Ministry of Environment and Urban Planning .............................................................................. MEUP Motor Control Center .................................................................................................................. MCC National Instrument 43-101 ......................................................................................................... NI 43-101 Nearest Neighbour ...................................................................................................................... NN Nearest Neighbour Kriging .......................................................................................................... NNK Net Present Value ....................................................................................................................... NPV Net Smelter Return ..................................................................................................................... NSR Nickel .......................................................................................................................................... Ni Nilsson Mine Services Ltd. .......................................................................................................... NMS North ........................................................................................................................................... N North East ................................................................................................................................... NE North West .................................................................................................................................. NW Operator Control Station ............................................................................................................. OCS Ordinary Kriging .......................................................................................................................... OK Outer Diameter ........................................................................................................................... OD
K I Ş L A D A Ğ M I L L I N G P R O J E C T , T U R K E Y
T E C H N I C A L R E P O R T
2018 Final Report xiii
Polyvinyl Chloride ....................................................................................................................... PVC Potassic ...................................................................................................................................... POT Potassium ................................................................................................................................... K Potential of Hydrogen ................................................................................................................. pH Prefeasibility Study ..................................................................................................................... PFS Probability Assisted Constrained Kriging .................................................................................... PACK Process Control Systems ............................................................................................................ PCS Programmable Logic Controllers ................................................................................................. PLCs Quarter ........................................................................................................................................ Q Qualified Person(s) ..................................................................................................................... QP(s) Quality assurance ....................................................................................................................... QA Quality control ............................................................................................................................. QC Quartz ......................................................................................................................................... Qz Request for Quotations ............................................................................................................... RFQ Reverse Circulation ..................................................................................................................... RC Rock Quality Designation ............................................................................................................ RQD Run of Mine ................................................................................................................................. ROM Selective Mining Unit .................................................................................................................. SMU Selenium ..................................................................................................................................... Se Silicon ......................................................................................................................................... Si Silver ........................................................................................................................................... Ag Sodium Cyanide .......................................................................................................................... NaCN Sodium Hydroxide ....................................................................................................................... NaOH Sodium Metabisulphite ................................................................................................................ Na2S2O5 Sodium Metabisulphite ................................................................................................................ SMBS South .......................................................................................................................................... S South East .................................................................................................................................. SE South Rock Dump ....................................................................................................................... SRD South West ................................................................................................................................. SW Specific Gravity ........................................................................................................................... SG Spherical ..................................................................................................................................... SPH SRK Consulting ........................................................................................................................... SRK Standard Reference Material ...................................................................................................... SRM Strontium..................................................................................................................................... Sn Sulfur .......................................................................................................................................... S Sulfur Dioxide .............................................................................................................................. SO2 Sulphide ...................................................................................................................................... S2-
Sulphuric Acid ............................................................................................................................. H2SO4
Tailings Management Facility ...................................................................................................... TMF Technical Study .......................................................................................................................... TS Tourmaline .................................................................................................................................. WMT Transportable Moisture Limit ....................................................................................................... TML Tuprag Metal Madencilik Sanayi Ve Ticaret Limited Sirketi ....................................................... Tuprag Turkish Electricity Distribution Corporation ................................................................................. TEDAS

K I Ş L A D A Ğ M I L L I N G P R O J E C T , T U R K E Y
T E C H N I C A L R E P O R T
2018 Final Report xiv
Turkish Electricity Transmission Corporation .............................................................................. TEIAS Uninterrupted Power Supply ....................................................................................................... UPS Universal Transverse Mercador .................................................................................................. UTM Uranium ...................................................................................................................................... U Value Added Tax ........................................................................................................................ VAT West ............................................................................................................................................ W Work Breakdown Structure ......................................................................................................... WBS Zinc ............................................................................................................................................. Zn

K I Ş L A D A Ğ M I L L I N G P R O J E C T , T U R K E Y
T E C H N I C A L R E P O R T
2018 Final Report Page 1-1
SECTION • 1 SUM M ARY
1 .1 I N T R O D U C T I O N Eldorado Gold Corporation (Eldorado), an international gold mining company based in Vancouver, British Columbia, owns and operates the Kişladağ gold mine in Turkey through its wholly owned Turkish subsidiary, Tüprag Metal Madencilik Sanayi Ve Ticaret Limited Sirketi (Tüprag). Eldorado has prepared this technical report on the Kişladağ gold mine to support a material change in mineral reserves and mineral resources relative to those quoted in previous technical reports (Technical Report Kişladağ Project Feasibility Study, March 2003 for the mineral reserves; 2003 Update of Resources, Kişladağ Project, Uşak, Turkey, September 2003 for the mineral resources; and Technical Report for the Kişladağ Gold Mine, Turkey, January 2010).
Geological and mining information and data for this report were obtained from the Kişladağ gold mine. Metallurgical tests were completed by the Kişladağ mine laboratory and third party laboratories, processing data was obtained from Kişladağ for the crushing circuit and third party calculations for the proposed milling circuit supported by the testwork.
The qualified persons responsible for preparing this technical report as defined in National Instrument 43-101 (NI 43-101), Standards of Disclosure for Mineral Projects and in compliance with 43-101F1 (the “Technical Report”) are David Sutherland, P.Eng., Stephen Juras, Ph.D., P.Geo., and Paul Skayman, FAusIMM whom are all are employees of Eldorado as well as John Nilsson, P.Eng of Nilsson Mine Services Ltd.
When preparing reserves for any of its projects, Eldorado uses a consistent prevailing gold price methodology that is in line with the 2015 CIM Guidance on Commodity Pricing used in Resource and Reserve Estimation and Reporting. These are the lesser of the three-year moving average and the current spot price. These were set as of September 2017 for Eldorado’s current mineral reserve work, for gold US$1,200/oz Au. All cut-off grade determinations, mine designs and economic tests of economic extraction used this price for the Kişladağ milling project and the mineral reserves work discussed in this technical report. To demonstrate the potential economics of a project, Eldorado may elect to use metal pricing closer to the current prevailing spot price and then provide some sensitivity around this price (for the Kişladağ milling project, metal prices used for this evaluation were US$1,300/oz Au). This analysis provides a better ‘snapshot’ of the project value at prevailing prices rather than limiting it to reserve prices that might vary somewhat from prevailing spot prices. Eldorado stresses that only material that satisfies the mineral reserve criteria is subjected to further economic assessments at varied metal pricing.
Third party experts have supplied some information that was used for the development of the study. The qualified persons have reasonable confidence on the information provided by the following third party consultants, including process design by Ausenco Engineering Canada and rock dump and tailings disposal by Norwest Corporation both located in Vancouver BC. Information and data for this report were obtained from Kişladağ gold mine, third party metallurgical test labs. The work entailed review of pertinent geological, mining, process and metallurgical data in sufficient detail to support the preparation of this technical report.

K I Ş L A D A Ğ M I L L I N G P R O J E C T , T U R K E Y
T E C H N I C A L R E P O R T
2018 Final Report Page 1-2
1 .2 P R O P E R T Y D E S C R I P T I O N
1.2.1 Property Location The Kişladağ gold mine has been an operating open pit mine in commercial production since 2006 with surface facilities consisting of a crushing plant, heap leach pads and an adsorption, desorption, regeneration (ADR) plant, along with ancillary buildings.
Kişladağ is located in west-central Turkey lying 180 km to the west of the Aegean coast between Izmir and Ankara. The Project site lies 35 km southwest of the city of Uşak which has a population of approximately 250,000 inhabitants and near the village of Gümüşkol as shown on Figure 1-1.
The current project Environmental Impact Assessment (EIA) area covers 2,509 ha. The land is classified as forestry (54%), treasury (11%), with the remaining area belonging to private land holders. As of December 31, 2017, Tüprag is the owner of 85% of the private land.
There are no permanent water bodies in the area and water supply is limited to ephemeral streams and shallow seasonal stock ponds. Volcanic rocks with generally poor aquifer characteristics dominate the geology of the area. The villages in the area are supplied with potable water piped from a source located approximately 5 km to the west of Kişlaköy village.
Figure 1-1: Location Map showing Western Turkey

K I Ş L A D A Ğ M I L L I N G P R O J E C T , T U R K E Y
T E C H N I C A L R E P O R T
2018 Final Report Page 1-3
1.2.2 Land Tenure The Kişladağ Project land position shown on Figure 1-2 consists of a single operating licence, number 85995, with a total area of 17,192 ha as of February 2018. According to Turkish mining law, Tüprag retains the right to explore and develop any mineral resources contained within the licence area provided fees and taxes are maintained. The licence was issued on April 9, 2003 and renewed on May 10, 2012 and is currently set to expire on May 10, 2032. Duration of mining licence can be extended if the mine production is still going on at the end of licence period.
No environmental liabilities have been assumed with the Project.
Figure 1-2: Kişladağ Land Position
1.2.3 Royalties Mining licences in Turkey are divided into 5 groups. The Kişladağ licence belongs to Group 4 which includes gold, silver, and platinum mines. Royalty rates for Group 4 licences are calculated on a sliding scale, implemented in 2015. Royalty rates are based on the run of mine (ROM) sales price. The ROM sales price is calculated by subtracting processing, transport, and depreciation costs from the gold and silver revenues. This amount is then multiplied by the appropriate royalty rate. The royalty rate is determined once a year by the General Directorate of Mines based on the average sales price of gold and silver quoted on the London Metal Exchange (LME).

K I Ş L A D A Ğ M I L L I N G P R O J E C T , T U R K E Y
T E C H N I C A L R E P O R T
2018 Final Report Page 1-4
1.2.4 Permits The Project will require a new EIA to include the addition of the milling circuit and addition of the dry stacked tailings facility at the Kişladağ site.
1.2.5 Climate, Accessibility, Infrastructure The mine site sits on the western edge of the Anatolian Plateau at an elevation of approximately 1,000 m, in gentle rolling topography. Local elevations range from a peak of 1,300 masl (Kişladağ) to the adjacent valley of 700 masl.
The climate in this region is arid with warm dry summers and mild wet winters. The Project site is located in a transition zone between Continental and Mediterranean weather regimes. Temperature ranges from -5 to 35 °C with extremes to -15 and 40 °C.
The Kişladağ mine is situated 180 km west of the port city of Izmir. It is accessed from Izmir by traveling east approximately 220 kilometers east from Izmir to the province capital of Uşak along the main E-W highway toward Ankara and then taking a secondary highway 35 kilometers SW to Eşme. A 5.3 kilometer private mine access road near the village of Gümüşkol, connects the mine to the public highway.
The major cities of Izmir and Ankara are serviced by international airlines and the city of Uşak has commercial flights from Istanbul.
The Turkish Electricity Distribution Corporation provides power to the site via two transmission lines from the Uşak industrial zone, 154kV (27.7km) and 34.5kV (25km).
Water is supplied from various well fields with a capacity of approximately 280 m3 per hour. A dam was constructed in partnership with the water authority in 2016 and is connected to the site to serve as an additional reservoir to support operations.
1 .3 H I S T O R Y Eldorado acquired the Kişladağ property from Gencor Limited of South Africa in July 1996. The original prospect was identified by Tüprag geologists in 1989 from satellite image interpretations and confirmed through ground reconnaissance and geochemical sampling programs.
Drilling campaigns primarily explored the Gökgöz Tepe from 1996 through to 2004. Metallurgical testing began in 1999 and in the same year an operating permit was obtained from the Turkish authorities for a gold mining operation.
A prefeasibility report was completed for a 3.4 Mtpa heap leach operation in 2001 and a bankable feasibility study and NI 43-101 report was completed in 2003 for 5 Mtpa production. Construction began in 2005 and commercial production was obtained in 2006.
Kişladağ operations were further expanded in 2007 to 10 Mtpa, then in 2011 to 12.5 Mtpa. With further optimizations a rate of 13.1 Mtpa was achieved in 2016. Plans were made to increase the plant to 20 Mtpa in 2015 (Phase IV Expansion) and related infrastructure upgrades to the substation,
K I Ş L A D A Ğ M I L L I N G P R O J E C T , T U R K E Y
T E C H N I C A L R E P O R T
2018 Final Report Page 1-5
various earthworks, and purchase of mining equipment were done to support the expansion. However, due to market conditions, the expansion was cancelled. In 2017, a scoping study was done to add a milling circuit and the prefeasibility study process design was completed in 2018.
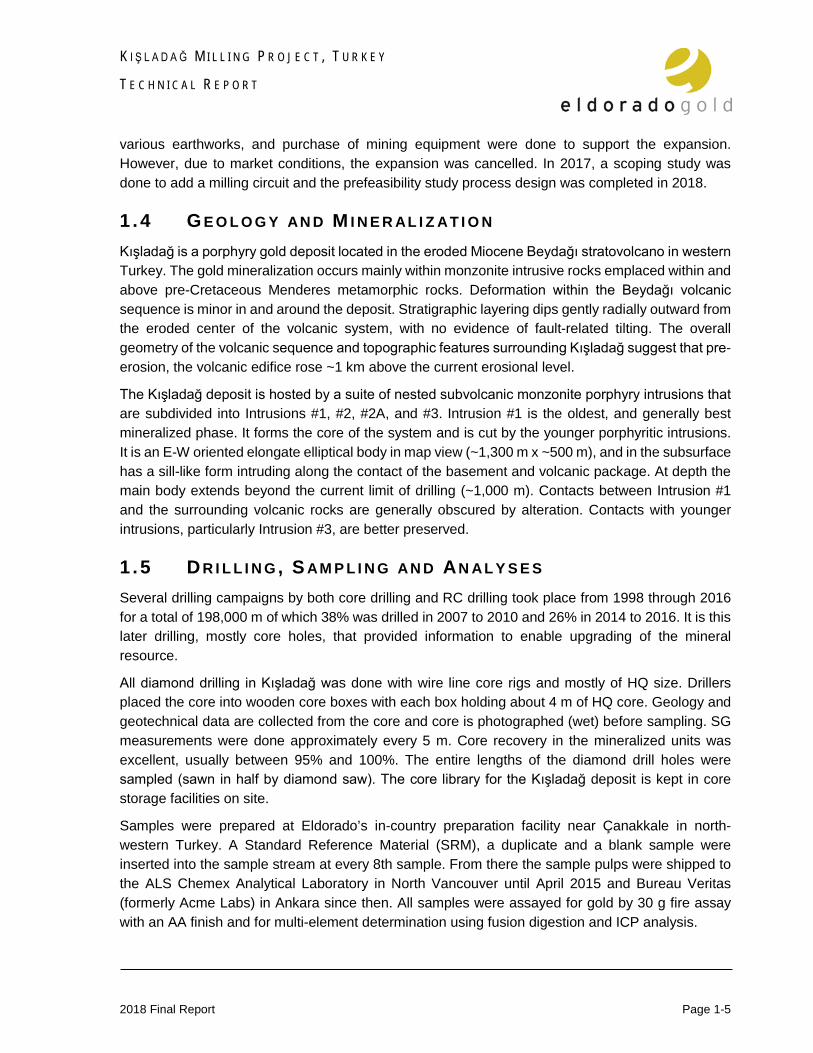
1 .4 G E O L O G Y AN D M I N E R AL I Z AT I O N Kışladağ is a porphyry gold deposit located in the eroded Miocene Beydağı stratovolcano in western Turkey. The gold mineralization occurs mainly within monzonite intrusive rocks emplaced within and above pre-Cretaceous Menderes metamorphic rocks. Deformation within the Beydağı volcanic sequence is minor in and around the deposit. Stratigraphic layering dips gently radially outward from the eroded center of the volcanic system, with no evidence of fault-related tilting. The overall geometry of the volcanic sequence and topographic features surrounding Kışladağ suggest that pre-erosion, the volcanic edifice rose ~1 km above the current erosional level.
The Kışladağ deposit is hosted by a suite of nested subvolcanic monzonite porphyry intrusions that are subdivided into Intrusions #1, #2, #2A, and #3. Intrusion #1 is the oldest, and generally best mineralized phase. It forms the core of the system and is cut by the younger porphyritic intrusions. It is an E-W oriented elongate elliptical body in map view (~1,300 m x ~500 m), and in the subsurface has a sill-like form intruding along the contact of the basement and volcanic package. At depth the main body extends beyond the current limit of drilling (~1,000 m). Contacts between Intrusion #1 and the surrounding volcanic rocks are generally obscured by alteration. Contacts with younger intrusions, particularly Intrusion #3, are better preserved.
1 .5 DR I L L I N G , S AM P L I N G AN D AN AL Y S E S Several drilling campaigns by both core drilling and RC drilling took place from 1998 through 2016 for a total of 198,000 m of which 38% was drilled in 2007 to 2010 and 26% in 2014 to 2016. It is this later drilling, mostly core holes, that provided information to enable upgrading of the mineral resource.
All diamond drilling in Kışladağ was done with wire line core rigs and mostly of HQ size. Drillers placed the core into wooden core boxes with each box holding about 4 m of HQ core. Geology and geotechnical data are collected from the core and core is photographed (wet) before sampling. SG measurements were done approximately every 5 m. Core recovery in the mineralized units was excellent, usually between 95% and 100%. The entire lengths of the diamond drill holes were sampled (sawn in half by diamond saw). The core library for the Kışladağ deposit is kept in core storage facilities on site.
Samples were prepared at Eldorado’s in-country preparation facility near Çanakkale in north-western Turkey. A Standard Reference Material (SRM), a duplicate and a blank sample were inserted into the sample stream at every 8th sample. From there the sample pulps were shipped to the ALS Chemex Analytical Laboratory in North Vancouver until April 2015 and Bureau Veritas (formerly Acme Labs) in Ankara since then. All samples were assayed for gold by 30 g fire assay with an AA finish and for multi-element determination using fusion digestion and ICP analysis.

K I Ş L A D A Ğ M I L L I N G P R O J E C T , T U R K E Y
T E C H N I C A L R E P O R T
2018 Final Report Page 1-6
Monitoring of the quality control samples showed that all data were in control throughout the preparation and analytical processes. In Eldorado’s opinion, the QA/QC results demonstrate that the Kışladağ deposit assay database is sufficiently accurate and precise for resource estimation.
Since the start of production in 2006, the entire drillhole database was reviewed in detail. Checks were made to the original assay certificates and survey data. Any discrepancies found were corrected and incorporated into the current resource database. Eldorado therefore concludes that the data supporting the Kışladağ resource work are sufficiently free of error to be adequate for estimation.
1 .6 M I N E R AL P R O C E S S I N G The Kişladağ Project is an open pit mine and heap leach operation with a three-stage crushing plant. A new process plant will be constructed which consists of single-stage grinding, cyanide leach, CIP, cyanide detox, tailing filtration, and dry stack of filtered tailing, and associated infrastructure. The mill will process 13 Mt of ore per year resulting in approximately 241,000 to 306,000 ounces of gold produced annually.
1 .7 M I N E R AL R E S O U R C E S E S T I M AT E S The mineral resource estimates for the Kışladağ mine were calculated under the direction of Dr. Stephen Juras, P.Geo. The estimates were made from a 3D block model utilizing commercial mine planning software. Projects limits, in UTM coordinates, are 686295 to 688655 East, 4260615 to 4262955 North, and 0 to +1110 m elevation. Block model cell size was 20 m east x 20 m north x 10 m high.
Eldorado used significant new data from the mining and the 2014-16 drilling campaign to update the geologic model described in the previous technical report (Eldorado Gold, 2010). The resource and reserve work incorporated new lithology and alteration models, all constructed in 3D in Leapfrog Geo software. Generally, there were no significant changes to the principal gold-hosting unit, Intrusion #1. The basement Schist unit was slightly enlarged to the West, South and South East directions. Intrusion #2 was modeled as a single entity while the contact between Intrusion #3 and Intrusion #1 became more irregular.
To constrain gold grade interpolation for the Kışladağ deposit, Eldorado created 3D mineralized envelopes or shells. These were based on initial outlines derived by a method of probability assisted constrained kriging (PACK). The threshold value of 0.20 g/t Au was determined by inspection of histograms and probability curves as well as by indicator variography. Shell outline selection was done by inspecting contoured probability values. These shapes were then edited on plan and section views to be consistent with the lithology model and the drill assay data so that the boundaries did not violate data and current geologic understanding of mineralization controls.
All generated 3D shapes were checked for spatial and geological consistency on cross-section and plan views and were found to have been properly constructed. The shapes honoured the drill data and appear well constructed.

K I Ş L A D A Ğ M I L L I N G P R O J E C T , T U R K E Y
T E C H N I C A L R E P O R T
2018 Final Report Page 1-7
1.7.1 Mineral Resource Classification The mineral resources of the Kişladağ deposit were classified using logic consistent with the CIM Definition Standards for Mineral Resources and Mineral Reserves referred to in National Instrument 43-101. The mineralization of the project satisfies sufficient criteria to be classified into measured, indicated, and inferred mineral resource categories.
Inspection of the Kişladağ model and drillhole data on plans and cross-sections, combined with spatial statistical work and investigation of confidence limits in predicting planned annual and quarterly production, contributed to the setup of various distance to nearest composite protocols to help guide the assignment of blocks into measured or indicated mineral resource categories. Reasonable grade and geologic continuity is demonstrated over most of the Kişladağ deposit, which is drilled generally on 40 m to 80 m spaced sections. Blocks were classified as indicated mineral resources using a two-hole rule where blocks containing an estimate that resulted from two or more samples that were within 80 m and from different drillholes. Where the sample spacing was about 50 m or less, the confidence in the grade estimates and lithology contacts were the highest and were thus permissive to be classified as measured mineral resources. This was facilitated by a three-hole rule where blocks contained an estimate that resulted from three or more samples that were all within 50 m and were from different holes.
All remaining model blocks containing a gold grade estimate were assigned as inferred mineral resources.
A test of reasonableness for the expectation of economic extraction was made on the Kişladağ mineral resources by developing a series of open pit designs based on optimal operational parameters and gold price assumptions. Those pit designs enveloped most of the measured and indicated mineral resources thus demonstrating the economic reasonableness test for the new estimate and reporting cutoff grade of the Kişladağ mineral resources.
1.7.2 Mineral Resource Summary The Kişladağ mineral resources as of December 31, 2017 are shown in Table 1-1. The Kişladağ mineral resource is reported at a 0.3 g/t Au cutoff grade for measured and indicated resources and 0.35 g/t Au for the inferred resources and calculated to end of 2017 mining limits.
Table 1-1: Kişladağ Mineral Resources, as of December 31, 2017
Mineral Resource Category Resource (t x 1,000)
Grade Au
(g/t)
Contained Au
(oz x 1,000)
Measured 367,425 0.64 7,596
Indicated 92,954 0.47 1,411
Measured & Indicated 460,379 0.61 9,006
Inferred 290,466 0.45 4,165

K I Ş L A D A Ğ M I L L I N G P R O J E C T , T U R K E Y
T E C H N I C A L R E P O R T
2018 Final Report Page 1-8
1 .8 M I N E R AL R E S E R V E S The Kişladağ gold mine historically used crushing and heap leaching to process the ore. The mineral reserves reported in this section are based upon a change in processing methods to milling and leaching after crushing, and dry stacked tailings disposition. Mining ore for processing on the heap leach pad will continue until April 2018.
The open pit optimization and pit design was completed using MineSight® software.
The mineral reserves for the deposit were estimated using a gold price of US$1200/oz. The mineral reserves are reported using a US$12.25/t NSR cutoff for mill ore and US$6.86/t NSR recoverable for crush leach ore to be processed in 2018. The reference point at which Kişladağ’s mineral reserves are defined is the point where the ore is delivered to the processing facility. The proven and probable mineral reserves are 118.6 Mt with an average grade of 0.82 g/t Au. Mineral reserves are summarized in Table 1-2.
Table 1-2: Kişladağ, Mineral Reserves Effective December 31, 2017
Crush Heap Leach Reserve Classification
Ore
(t x 1,000)
Grade Au
(g/t)
Contained Au
(oz x 1,000)
Proven 2,999 1.18 114
Probable 50 0.63 1
Proven & Probable 3,049 1.17 115
Milling Reserve Classification
Ore
(t x 1,000)
Grade Au
(g/t)
Contained Au
(oz x 1,000)
Proven 110,254 0.82 2,918
Probable 5,256 0.60 101
Proven & Probable 115,511 0.81 3,019
Combined Reserve Classification
Ore
(t x 1,000)
Grade Au
(g/t)
Contained Au
(oz x 1,000)
Proven 113,253 0.83 3,032
Probable 5,306 0.60 102
Proven & Probable 118,560 0.82 3,134
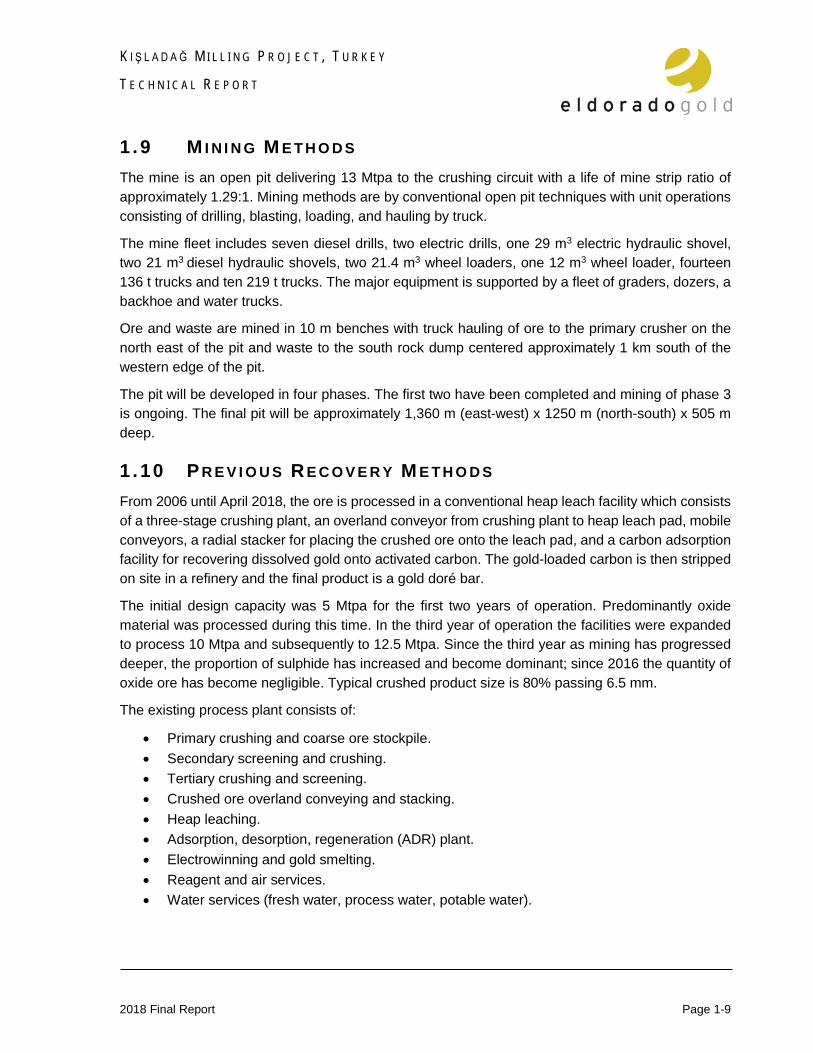
K I Ş L A D A Ğ M I L L I N G P R O J E C T , T U R K E Y
T E C H N I C A L R E P O R T
2018 Final Report Page 1-9
1 .9 M I N I N G M E T H O D S The mine is an open pit delivering 13 Mtpa to the crushing circuit with a life of mine strip ratio of approximately 1.29:1. Mining methods are by conventional open pit techniques with unit operations consisting of drilling, blasting, loading, and hauling by truck.
The mine fleet includes seven diesel drills, two electric drills, one 29 m3 electric hydraulic shovel, two 21 m3 diesel hydraulic shovels, two 21.4 m3 wheel loaders, one 12 m3 wheel loader, fourteen 136 t trucks and ten 219 t trucks. The major equipment is supported by a fleet of graders, dozers, a backhoe and water trucks.
Ore and waste are mined in 10 m benches with truck hauling of ore to the primary crusher on the north east of the pit and waste to the south rock dump centered approximately 1 km south of the western edge of the pit.
The pit will be developed in four phases. The first two have been completed and mining of phase 3 is ongoing. The final pit will be approximately 1,360 m (east-west) x 1250 m (north-south) x 505 m deep.
1 .10 P R E V I O U S R E C O V E R Y M E T H O D S From 2006 until April 2018, the ore is processed in a conventional heap leach facility which consists of a three-stage crushing plant, an overland conveyor from crushing plant to heap leach pad, mobile conveyors, a radial stacker for placing the crushed ore onto the leach pad, and a carbon adsorption facility for recovering dissolved gold onto activated carbon. The gold-loaded carbon is then stripped on site in a refinery and the final product is a gold doré bar.
The initial design capacity was 5 Mtpa for the first two years of operation. Predominantly oxide material was processed during this time. In the third year of operation the facilities were expanded to process 10 Mtpa and subsequently to 12.5 Mtpa. Since the third year as mining has progressed deeper, the proportion of sulphide has increased and become dominant; since 2016 the quantity of oxide ore has become negligible. Typical crushed product size is 80% passing 6.5 mm.
The existing process plant consists of:
• Primary crushing and coarse ore stockpile. • Secondary screening and crushing. • Tertiary crushing and screening. • Crushed ore overland conveying and stacking. • Heap leaching. • Adsorption, desorption, regeneration (ADR) plant. • Electrowinning and gold smelting. • Reagent and air services. • Water services (fresh water, process water, potable water).

K I Ş L A D A Ğ M I L L I N G P R O J E C T , T U R K E Y
T E C H N I C A L R E P O R T
2018 Final Report Page 1-10
Subsequent evaluation of the treatment of sulphide ore through heap leach processing concluded that a change in the processing methods would be necessary to achieve consistently higher gold recovery over the entire Kişladağ ore body. As such, a conventional whole ore cyanide leach-CIP based process, which was developed in 2017, and serves as the basis for the current evaluation.
1.10.1 Process Selection The subsequent changes in leaching characteristics of the sulphide ore at depth necessitated a change in the process to achieve higher gold recovery for the remaining mineralization in the deposit.
Cyanide leach testwork using pulverized materials did not indicate problems with heap leach recovery. Separate testwork using coarser crushed materials indicated lower recoveries when using heap leach processing on deeper sections of the orebody and hence, milling and CIP were considered as an alternate process. An internal concept study was started in October 2017 to evaluate viability of various process options for treatment of sulphide gold ore and then further metallurgical testwork was followed to support further studies.
Many batch whole ore cyanide leach tests followed by carbon adsorption tests were completed in 2017 and 2018. The results demonstrated that the whole ore cyanide leach-CIP based process is robust for treatment of Kişladağ sulphide ore. Satisfactory gold recovery was achieved from various ore types under a wide range of operating conditions, particularly for the most important potassic ore type which accounts for about 60% of total reserves. The Kişladağ ore showed some preg-robbing or preg-borrowing properties. This means that a portion of the dissolved gold is adsorbed by some materials in the ore, causing temporary or permanent loss of gold recovery. Fortunately, the affect of preg-robbing is relatively weak and can be effectively overcome by applying CIP or CIL.
To integrate the new process option into the existing Kişladağ processing plant, it is planned to locate the new process plant adjacent to the existing crushing plant. Fine ore from the tertiary crushing circuit will be stockpiled on a new fine ore stockpile. This will be reclaimed by new reclamation equipment and then fed to the single-stage ball mill grinding circuit.
The flowsheet as selected for processing of Kişladağ sulphide ore includes single-stage ball mill grinding, pre-leach thickening, pre-aeration, and cyanide leaching followed by CIP adsorption. The CIP tail is then processed through cyanide recovery (thickening) followed by cyanide detoxification and pre-filtration thickening.
To minimize consumption of fresh water required for the whole ore cyanide leach-CIP process and also to improve the stability of stored tailings, thickening and filtration of detoxified tailings are planned. The filtered tailings material will be discharged onto a conveying system which will feed the existing overland conveyor. A new conveyor will transfer the filtered tail beyond the overland conveyor to a new dry stacked tailings pad. Existing portable stacking equipment will be relocated and used for stacking the filtered tail.
Pregnant solution produced during carbon elution will circulate between the re-commissioned electrowinning circuit and the new carbon elution columns to recover the eluted gold. Gold cathode

K I Ş L A D A Ğ M I L L I N G P R O J E C T , T U R K E Y
T E C H N I C A L R E P O R T
2018 Final Report Page 1-11
sludge from electrowinning cells will be dried and then smelted into gold doré in the re-commissioned goldroom.
A simplified flowsheet of the milling flowsheet is depicted in Figure 1-3.
Figure 1-3: Simplified Flowsheet of Kişladağ Milling
1.10.1.1 Plant Design Basis
The new process plant was designed on the basis of overall plant operating time of 93% and 365 days per year for a total operating time of 8,147 h/y. The process plant has been designed to produce up to approximately 306,000 oz per annum gold as doré bar.
Key criteria selected for the new process plant design are:
• Annual ore throughput of 13 Mtpa. • Plant operating time of 93% (milling / leaching / filtration). • Typical ore head grade of 0.81 g/t for gold and approximately 1 g/t for silver. • LOM average gold recovery of 80%.
1 .11 P R O J E C T I N F R A S T R U C T U R E The project does not have to upgrade the existing access road, power or water supplies.

K I Ş L A D A Ğ M I L L I N G P R O J E C T , T U R K E Y
T E C H N I C A L R E P O R T
2018 Final Report Page 1-12
Management of the site water will use the existing ponds and additional ponds at the tailings management facility (TMF). The water treatment plant is appropriately sized to include the new facilities. The constructed areas will be sloped and ditched appropriately to tie into the existing systems.
Existing ancillary buildings will continue to be utilized such as the warehouse and administration buildings. A new change room facility will be installed for the personnel that will be working in the mill.
1 .12 M AR K E T S T U D I E S AN D C O N T R AC T S Eldorado has not performed any formalized marketing studies in respect to Kişladağ gold production. Gold is currently sold on spot market via Turkish refiners by Tüprag’s internal sales department.
During 2017 Kişladağ sold gold at an average realized selling price of US$1,258 per troy ounce. The Turkish Central Bank has the right to purchase all gold produced at the site at LME spot prices.
Contracts and purchase agreements are currently in place for cyanide supply, diesel fuel and lube, explosives, leases of state lands, security and meal catering.
1.12.1 Taxes Corporate taxation for Turkish businesses is currently 22% through tax year 2020. In year 2021, the rate will be reduced to 20%. Depreciation is based mostly on a unit-of-production calculation under international financial reporting standards (IFRS). Turkish lira depreciation is based on the government’s depreciation list and this is mainly 10% for mine assets. An investment tax incentive available in Turkey has been applied to the economic analysis. The incentive allows for 40% of applicable capital costs spent on new production facilities to be applied as an incentive value where the taxable income is taxable at a reduced rate of 4.0% until the total value of tax savings equals the incentive value. The incentive value can be carried forward; after the incentive value is utilized, the 20% corporate taxation rate is applied.
1 .13 E N V I R O N M E N T AL Tüprag conducted baseline studies in 2000, 2001 and 2002 prior to development. An EIA was submitted January 2003 which was approved with Environmental Positive Certificate being granted in June 2003. Since mining began in 2005, Kışladağ mine operations have routinely collected environmental data outlined in the Environmental Management Plan (EMP) and submitted data to the relevant government agencies.
Tüprag plans to submit a new EIA application in 2018 incorporating the revised process and tailings management plans into the current EIA and updating the EMP.

K I Ş L A D A Ğ M I L L I N G P R O J E C T , T U R K E Y
T E C H N I C A L R E P O R T
2018 Final Report Page 1-13
1 .14 C AP I T AL AN D O P E R AT I N G C O S T S
1.14.1 Capital Costs All costs are presented in US Dollars (US$) as per Q1 2018 market conditions. The accuracies of the cost estimates are consistent with the standards outlined by the Association for the Advancement of Cost Engineering (AACE). The cost estimate is a prefeasibility-level estimate categorized as AACE Class 4.
The total project capital cost includes the initial investment cost to obtain commercial production of the mill. Sustaining capital costs are distributed from commercial production across the life of mine. Capital costs are summarized in Table 1-3.
Direct costs were developed from a combination of budget quotations, recent contract rates, relevant in-house data, historical benchmarks, and material take-offs. Indirect costs and owner’s costs were estimated in accordance with the project execution strategy, relying on historical benchmarks, first principles calculations, and allowances. Contingency was calculated based on the level of project definition by discipline.
Table 1-3: Capital Cost Summary
Area Initial (US$ x 1,000)
Sustaining (US$ x 1,000)
A - Overall Site 643 7,800 D - Grinding and Leaching 184,376 26,645 E - Crushing - Train A 3,000 0 F - Tailings Management Facility 17,388 27,529 G - ADR 0 0 H - Infrastructure 16,649 0 J - Ancillary Facilities 4,200 0 K - Off Site Infrastructure 0 0 M - Off Site Facilities 0 0 N - Geology 0 0 P - Mill Circuit ADR/Gold Room 7,844 0
Direct 234,101 61,974 Indirects 84,452 Included
Owners Cost 4,105 8,450 Contingency 55,313 N/A
Total Installed Cost 377,971 70,424 B – Mine (Capitalized Mining and Equipment Rebuild)1 111,796 142,952
Total Capital Expenditure 489,766 213,376 Note: 1 Mine cost incurred during heap leaching in 2018 Q1 of approximately 4.3 Mt is considered a sunk cost and is not
included in the estimate.

K I Ş L A D A Ğ M I L L I N G P R O J E C T , T U R K E Y
T E C H N I C A L R E P O R T
2018 Final Report Page 1-14
1.14.2 Operating Costs The operating cost estimate was developed based on a combination of actual annual costs for the crushing circuit and existing infrastructure as well as from first principles for the new milling-leach plant.
Operating costs include allocations for:
• Mining. • Processing.
o Crushing (existing circuit) o Processing o Tailings filtration and management o Infrastructure (existing water, power, road, and other site maintenance)
• General & administration. • Transport and refining.
Operating costs were calculated for each year of operation. The average is US$181.4 M per annum for an average cost of US$14.13/t ore per tonne of ore processed. These are summarized in Table 1-4. No contingency was included for the operating cost estimate.
Table 1-4: Operating Costs Summary
Category LOM Average (US$/t)
LOM Expenditure (US$ x 1,000)
Mining 2.87 331,334 Crushing 1.16 133,654
Labour 0.37 42,866 Power 0.20 23,616 Consumables and Other Maintenance 0.58 67,171
Processing 6.67 770,727 Labour 0.27 31,109 Power 1.61 186,382 Reagents 3.18 367,586 Consumables and Other Maintenance 1.61 185,650
Tailings Filtration & Management 1.15 132,300 Labour 0.22 25,680 Power 0.32 36,661 Consumables and Other Maintenance 0.61 69,960
Infrastructure 0.36 41,075 Labour 0.24 27,694 Power 0.05 5,654 Consumables and Other Maintenance 0.07 7,727
General and Administration 1.85 213,664 Labour 0.42 48,328 Expenses 1.43 165,336
Transport and Refining 0.08 9,676 Operating Cost 14.13 1,632,430
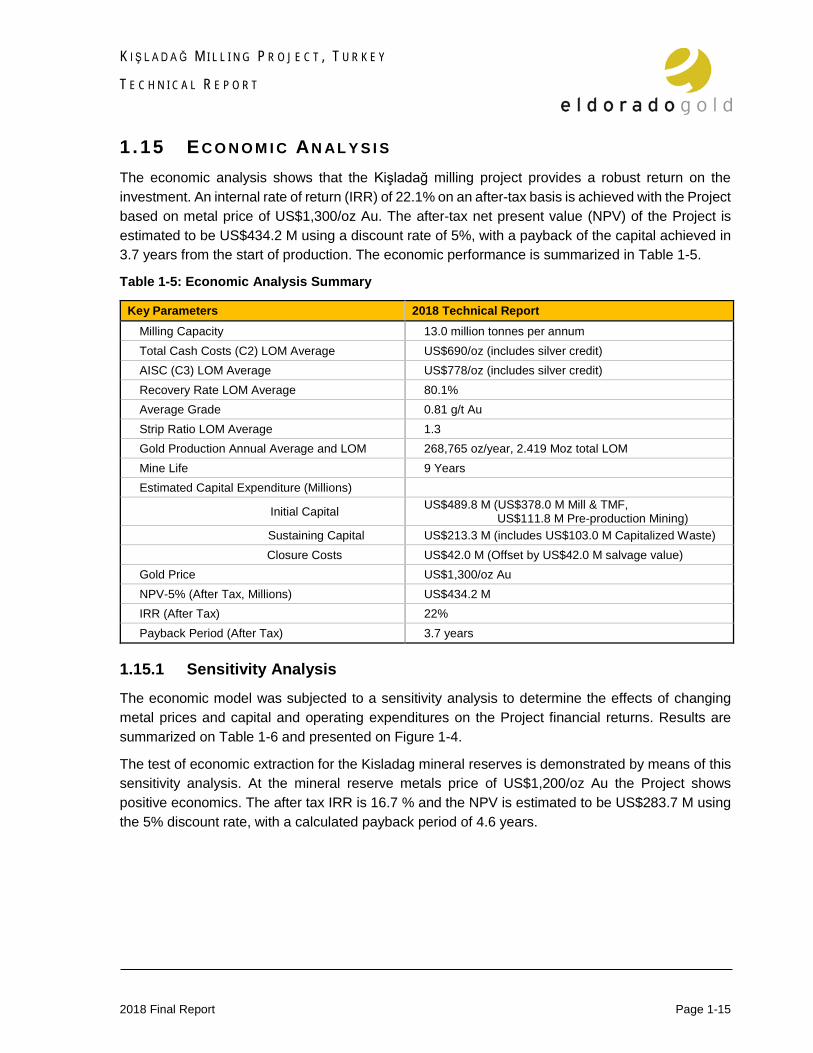
K I Ş L A D A Ğ M I L L I N G P R O J E C T , T U R K E Y
T E C H N I C A L R E P O R T
2018 Final Report Page 1-15
1 .15 E C O N O M I C AN AL Y S I S The economic analysis shows that the Kişladağ milling project provides a robust return on the investment. An internal rate of return (IRR) of 22.1% on an after-tax basis is achieved with the Project based on metal price of US$1,300/oz Au. The after-tax net present value (NPV) of the Project is estimated to be US$434.2 M using a discount rate of 5%, with a payback of the capital achieved in 3.7 years from the start of production. The economic performance is summarized in Table 1-5.
Table 1-5: Economic Analysis Summary
Key Parameters 2018 Technical Report Milling Capacity 13.0 million tonnes per annum Total Cash Costs (C2) LOM Average US$690/oz (includes silver credit) AISC (C3) LOM Average US$778/oz (includes silver credit) Recovery Rate LOM Average 80.1% Average Grade 0.81 g/t Au Strip Ratio LOM Average 1.3 Gold Production Annual Average and LOM 268,765 oz/year, 2.419 Moz total LOM Mine Life 9 Years Estimated Capital Expenditure (Millions)
Initial Capital US$489.8 M (US$378.0 M Mill & TMF, US$111.8 M Pre-production Mining)
Sustaining Capital US$213.3 M (includes US$103.0 M Capitalized Waste) Closure Costs US$42.0 M (Offset by US$42.0 M salvage value)
Gold Price US$1,300/oz Au NPV-5% (After Tax, Millions) US$434.2 M IRR (After Tax) 22% Payback Period (After Tax) 3.7 years
1.15.1 Sensitivity Analysis The economic model was subjected to a sensitivity analysis to determine the effects of changing metal prices and capital and operating expenditures on the Project financial returns. Results are summarized on Table 1-6 and presented on Figure 1-4.
The test of economic extraction for the Kisladag mineral reserves is demonstrated by means of this sensitivity analysis. At the mineral reserve metals price of US$1,200/oz Au the Project shows positive economics. The after tax IRR is 16.7 % and the NPV is estimated to be US$283.7 M using the 5% discount rate, with a calculated payback period of 4.6 years.
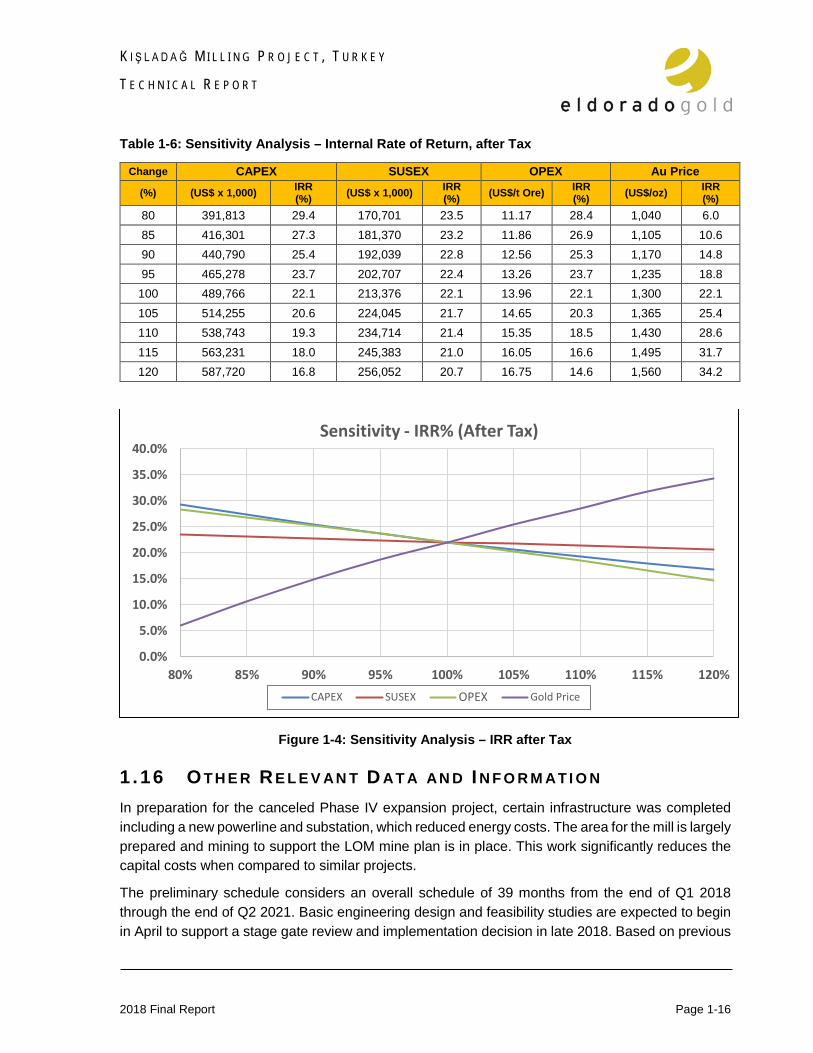
K I Ş L A D A Ğ M I L L I N G P R O J E C T , T U R K E Y
T E C H N I C A L R E P O R T
2018 Final Report Page 1-16
Table 1-6: Sensitivity Analysis – Internal Rate of Return, after Tax
Change CAPEX SUSEX OPEX Au Price (%) (US$ x 1,000) IRR
(%) (US$ x 1,000) IRR (%) (US$/t Ore) IRR
(%) (US$/oz) IRR (%)
80 391,813 29.4 170,701 23.5 11.17 28.4 1,040 6.0 85 416,301 27.3 181,370 23.2 11.86 26.9 1,105 10.6 90 440,790 25.4 192,039 22.8 12.56 25.3 1,170 14.8 95 465,278 23.7 202,707 22.4 13.26 23.7 1,235 18.8
100 489,766 22.1 213,376 22.1 13.96 22.1 1,300 22.1 105 514,255 20.6 224,045 21.7 14.65 20.3 1,365 25.4 110 538,743 19.3 234,714 21.4 15.35 18.5 1,430 28.6 115 563,231 18.0 245,383 21.0 16.05 16.6 1,495 31.7 120 587,720 16.8 256,052 20.7 16.75 14.6 1,560 34.2
Figure 1-4: Sensitivity Analysis – IRR after Tax
1 .16 O T H E R R E L E V AN T D AT A AN D I N F O R M AT I O N In preparation for the canceled Phase IV expansion project, certain infrastructure was completed including a new powerline and substation, which reduced energy costs. The area for the mill is largely prepared and mining to support the LOM mine plan is in place. This work significantly reduces the capital costs when compared to similar projects.
The preliminary schedule considers an overall schedule of 39 months from the end of Q1 2018 through the end of Q2 2021. Basic engineering design and feasibility studies are expected to begin in April to support a stage gate review and implementation decision in late 2018. Based on previous
0.0%
5.0%
10.0%
15.0%
20.0%
25.0%
30.0%
35.0%
40.0%
80% 85% 90% 95% 100% 105% 110% 115% 120%
Sensitivity - IRR% (After Tax)
CAPEX SUSEX OPEX Gold Price

K I Ş L A D A Ğ M I L L I N G P R O J E C T , T U R K E Y
T E C H N I C A L R E P O R T
2018 Final Report Page 1-17
experience, a 12 month allowance for permitting preparation and government project approval is scheduled and coincides with basic engineering which will support the process. Detailed engineering will largely be completed in 2019, with construction activities starting in the spring of 2019 and continuing through 2020. Starting in 2021 commissioning and ramp-up has been set for 6 months.
Risk and opportunities were evaluated at a high level and will be detailed in the next phase. The largest risks typical to a project of this size are permitting delays, overall scheduling delays, project cost over runs, and metallurgical recoveries. Kişladağ is a well-established site that has completed three major projects, numerous upgrades, and ongoing sustaining projects, consequently past experience and construction knowledge will help mitigate the risks. Opportunities may be realized once further testwork and process optimizations are completed. There is an opportunity to utilize existing operational staff in construction activities and management that will be further reviewed.
1 .17 I N T E R P R E T A T I O N S AN D C O N C L U S I O N S It is concluded that the work completed in the prefeasibility study indicate that the mineral resource and mineral reserve estimates and Project economics are sufficiently defined to indicate that the Project is technically and economically viable and should advance to the basic engineering phase.
The qualified persons have a high degree of confidence in the contents of this technical report.
1 .18 RE C O M M E N D AT I O N S The prefeasibility study outlined provides a solid technical and economical solution for improving the Kişladağ mining operation. It is recommended to proceed with early works and advance to feasibility studies to optimize and achieve a higher level of design and costing accuracy. After completion of the next study it is recommended to complete a stage-gate review with the executive committees.
1.18.1 Mining Mining studies will be implemented to further optimize the mine plan including a more detailed assessment of fleet utilization, opportunities to delay stripping to improve cashflow, and economics of alternative energy including areas to fully utilize the electrified mining equipment and conversion of haulage trucks to natural gas.
1.18.2 Processing The process circuit selected considers standard equipment configurations with a conservative design to maximize recovery. A variety of potential process options were identified and will be followed up prior to the next design phase. Ongoing testwork not available during the study will be implemented into the next phase of study.

K I Ş L A D A Ğ M I L L I N G P R O J E C T , T U R K E Y
T E C H N I C A L R E P O R T
2018 Final Report Page 1-18
1.18.3 Infrastructure Tailings management and rock dump designs were developed to a preliminary level to support the throughput of the plant and mine plan. There are further optimizations and studies to be completed during the next phase.
1.18.4 Operations The assessment of milling unit operation was completed and combined with the actual operating costs from the crushing circuit. A further evaluation to assess the combined resource requirements will be completed.
1.18.5 Permitting To ensure the advancement of the schedule permitting activities have been initialized and a formal program should commence immediately.
K I Ş L A D A Ğ M I L L I N G P R O J E C T , T U R K E Y
T E C H N I C A L R E P O R T
2018 Final Report Page 2-1
SECTION • 2 INT RODU CTION Eldorado Gold Corporation (Eldorado), an international gold mining company based in Vancouver, British Columbia, owns and operates the Kişladağ gold mine in Turkey through its wholly owned Turkish subsidiary, Tüprag Metal Madencilik Sanayi Ve Ticaret Limited Sirketi (Tüprag). Eldorado has prepared this technical report of the Kişladağ gold mine to support a material change in mineral reserves and mineral resources relative to those quoted in previous technical reports (Technical Report, Micon, 2003 and Technical Report, Eldorado, 2010). The economics outlined in the report are based on construction of a milling and whole ore leaching circuit with gold recovery through carbon-in-pulp (CIP) and adsorption-desorption-recovery (ADR) circuits supported by recent testwork. The study does not include any recoveries of gold or operating costs associated with operation of the existing heap leach pad.
When preparing reserves for any of its projects, Eldorado uses a consistent prevailing gold price methodology that is in line with the 2015 CIM Guidance on Commodity Pricing used in Resource and Reserve Estimation and Reporting. These are the lesser of the three-year moving average and the current spot price. These were set as of September 2017 for Eldorado’s current mineral reserve work, for gold US$ 1,200/oz Au. All cut-off grade determinations, mine designs and economic tests of extraction used this price in the Kişladağ milling project and the mineral reserves work discussed in this technical report. To demonstrate the potential economics of a project, Eldorado may elect to use metal pricing closer to the current prevailing spot price and then provide some sensitivity around this price (for the Kişladağ milling project, metal prices used for this evaluation were US$1,300/oz Au). This analysis (in Section 22 of this report) generally provides a better ‘snapshot’ of the project value at prevailing prices rather than limiting it to reserve prices, that might vary somewhat from prevailing spot prices. Eldorado stresses that only material that satisfies the mineral reserve criteria is subjected to further economic assessments at varied metal pricing.
The qualified persons responsible for preparing this technical report as defined in National Instrument 43-101 (NI 43-101), Standards of Disclosure for Mineral Projects and in compliance with 43-101F1 (the “Technical Report”) are David Sutherland, P.Eng., Stephen Juras, Ph.D., P.Geo., and Paul Skayman, FAusIMM, whom are all employees of Eldorado, and John Nilsson, P.Eng., an independent consultant of Nilsson Mine Services Ltd.
Mr. Sutherland, Project Manager for the Company, was the Project Manager responsible for overall preparation of the technical study and related costs. He most recently visited the Kişladağ gold mine on February 14-16, 2018.
Dr. Juras, Director, Technical Services for the Company, was responsible for the preparation of the sections in this report that concerned geological information, sample preparation and analyses and mineral resource estimation. He most recently visited the Kişladağ gold mine on February 14-15, 2018.
Mr. Skayman, Chief Operating Officer for the Company, was responsible for the preparation of the sections in this report that dealt with metallurgy and process operations and related costs. He most recently visited the Kişladağ gold mine on January 23-25, 2018.

K I Ş L A D A Ğ M I L L I N G P R O J E C T , T U R K E Y
T E C H N I C A L R E P O R T
2018 Final Report Page 2-2
Mr. Nilsson, President of Nilsson Mine Services Ltd. (Nilsson), was responsible for the preparation of the sections in this report that dealt with the open pit mineral reserves estimation and mining methods. He most recently visited the Kişladağ gold mine on September 22 - 27, 2017.
Third party experts have supplied some information that was used for the development of the study. The qualified persons have reasonable confidence in the information provided by the following third party consultants, including process design by Ausenco Engineering Canada and rock dump and tailings disposition by Norwest Corporation both located in Vancouver BC. Information and data for this report were obtained from Kişladağ gold mine and third party metallurgical test labs. The work entailed review of pertinent geological, mining, process and metallurgical data in sufficient detail to support the preparation of this technical report.
This document presents a summary of the current and forecast operation at the mine.
Turkish names frequently include Turkish characters. In some cases, the names may have been written using a standard US keyboard. The following table Table 2-1 is provided as a cross reference list.
Table 2-1: Cross-reference List
Standard US Keyboard Name Turkish Name Kisladag Kışladağ
Kisla Kışla Usak Uşak
Tuprag Tüprag Gokgoz Tepe Gökgöz Tepe
Canakkale Çanakkale Gumuskol Gümüşkol
Sogutlu Söğütlü Katrancilar Katrancılar Karapinar Karapınar
Esme Eşme Sayacik Sayacık
Dag Dağ TEDAS Tedaş
Efemcukuru Efemçukuru

K I Ş L A D A Ğ M I L L I N G P R O J E C T , T U R K E Y
T E C H N I C A L R E P O R T
2018 Final Report Page 3-1
SECTION • 3 REL I AN CE ON OTHE R EXPE R TS Eldorado prepared this document with input from the Kişladağ mine staff, Efemcukuru mine staff, other well qualified individuals and third party experts. The qualified persons did not rely on a report, opinion or statement of another expert who is not a qualified person, concerning legal, political, environmental, or tax matters relevant to the technical report.

K I Ş L A D A Ğ M I L L I N G P R O J E C T , T U R K E Y
T E C H N I C A L R E P O R T
2018 Final Report Page 4-1
SECTION • 4 PROPERT Y DE SCRIPT I ON AN D LOC ATI ON
4 .1 I N T R O D U C T I O N The Kişladağ gold mine is an operating open pit mine in commercial production since 2005 with surface facilities consisting of a crushing plant, heap leach pads and an adsorption, desorption, regeneration (ADR) plant, along with ancillary buildings.
4 .2 P R O P E R T Y LO C A T I O N Kişladağ is located in west-central Turkey lying 180 km to the west of the Aegean coast between Izmir and Ankara. The Project site lies 35 km southwest of the city of Uşak, which has a population of approximately 250,000 inhabitants and near the village of Gümüşkol as shown on Figure 4-1.
Approximate Project co-ordinates are:
• UTM 06 87500E and 42 61600N • UTM Zone 35S • Map Sheet Uşak-L22 (1:100,000 scale) • Longitude 29° 08' 58" E • Latitude 38° 28' 56" N
Figure 4-1: Location Map showing Project Location in Western Turkey

K I Ş L A D A Ğ M I L L I N G P R O J E C T , T U R K E Y
T E C H N I C A L R E P O R T
2018 Final Report Page 4-2
Land use within the concession area falls into three categories: inhabited (villages and dwellings) agricultural land (cropping and grazing) and barren lands (not suitable for agriculture). Forestry land makes up about 54% of the Project area (2,509 ha) and treasury land makes approximately 11%. The remaining area belongs to private land. As of December 31, 2017, Tüprag is the owner of 85% of the private land within the concession.
There are no permanent water bodies in the area and water supply is limited to ephemeral streams and shallow seasonal stock ponds. Volcanic rocks with generally poor aquifer characteristics dominate the geology of the area. The villages in the area are supplied with potable water piped from a source located approximately 5 km to the west of Kişlaköy village.
The soil depth in the process plant area is less than two meters deep and subsurface conditions are characterized by weathered bedrock suitable for economical construction of equipment foundations.
The Kişladağ site is located approximately 250 km south of the major North Anatolian Fault zone and is located between the first and second-degree seismic zones as defined in the Turkish code. This is equivalent to an earthquake Zone 4 in the American Uniform Building Code. The effective ground acceleration coefficient is 0.4 g.
4 .3 L AN D TE N U R E The Kişladağ Project land position shown on Figure 4-2 consists of a single operating licence, number 85995, with a total area of 17,192 ha as of February 2018. According to Turkish mining law, Tüprag retains the right to explore and develop any mineral resources contained within the licence area provided fees and taxes are maintained. The licence was issued on April 9, 2003 and renewed on May 10, 2012 and is currently set to expire on May 10, 2032. Duration of mining licence can be extended if the mine production is still going on at the end of licence period.
4 .4 RO Y AL T I E S Mining licences in Turkey are divided into 5 groups. The Kişladag licence is in group 4 which includes gold, silver, and platinum mines. Royalty rates for group 4 licences are calculated on a sliding scale implemented in 2015. Royalty rates (Table 4-1) are based on the run of mine (ROM) sales price. The ROM sales price is calculated by subtracting processing, transport, and depreciation costs from the gold and silver revenues. This amount is then multiplied by the appropriate royalty rate. The royalty rates are determined once a year by the General Directorate of Mines based on the average sales price of gold and silver quoted on the London Metal Exchange (LME).
Doré produced at the Kişladağ mine is considered to be the product of ore processing and is eligible for the 50% reduction in the royalty rate.
4 .5 E N V I R O N M E N T AL L I AB I L I T I E S No environmental liabilities have been assumed with the Project.

K I Ş L A D A Ğ M I L L I N G P R O J E C T , T U R K E Y
T E C H N I C A L R E P O R T
2018 Final Report Page 4-3
Figure 4-2: Kişladağ Land Position
Table 4-1: Royalties Calculation
Royalty (%)
Gold (Annual average price) (US$/oz)
Silver (Annual average price) (US$/oz)
2 <800 <10 4 801-1,250 11-20 6 1,251-1,500 21-25 8 1,501-1,750 25-30 10 1,751-2,000 31-35 14 2,001-2,250 36-40 16 >2,251 >41
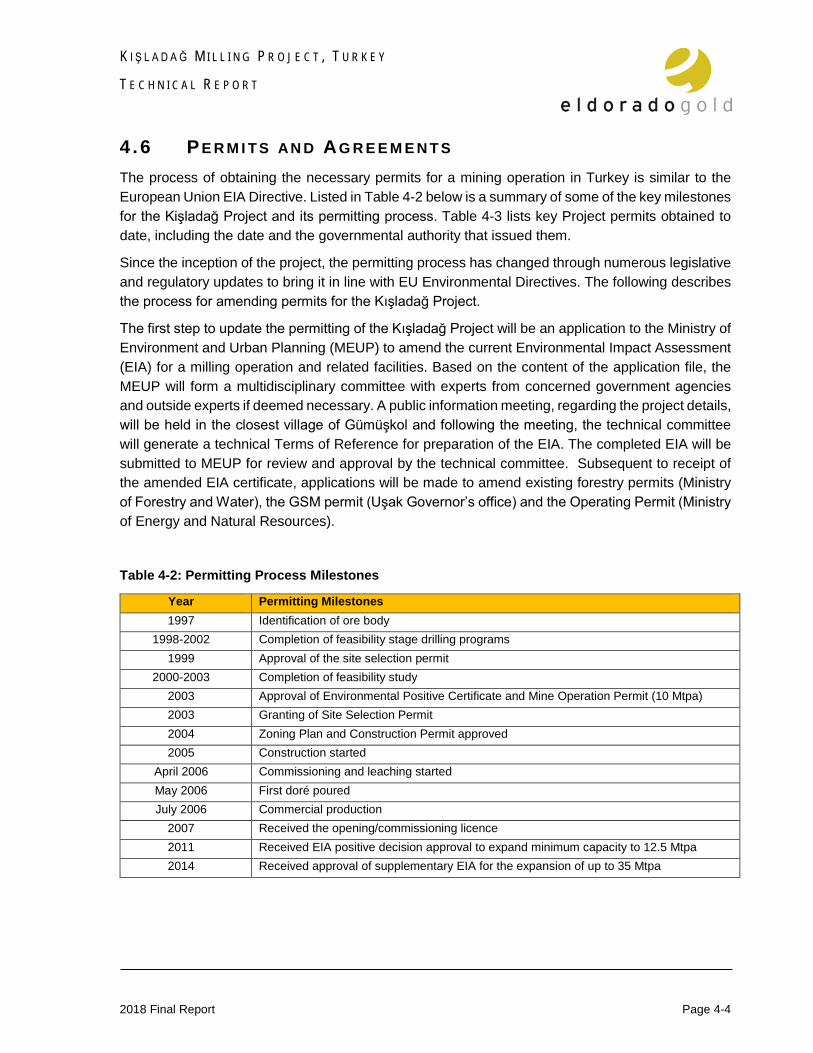
K I Ş L A D A Ğ M I L L I N G P R O J E C T , T U R K E Y
T E C H N I C A L R E P O R T
2018 Final Report Page 4-4
4 .6 P E R M I T S AN D AG R E E M E N T S The process of obtaining the necessary permits for a mining operation in Turkey is similar to the European Union EIA Directive. Listed in Table 4-2 below is a summary of some of the key milestones for the Kişladağ Project and its permitting process. Table 4-3 lists key Project permits obtained to date, including the date and the governmental authority that issued them.
Since the inception of the project, the permitting process has changed through numerous legislative and regulatory updates to bring it in line with EU Environmental Directives. The following describes the process for amending permits for the Kışladağ Project.
The first step to update the permitting of the Kışladağ Project will be an application to the Ministry of Environment and Urban Planning (MEUP) to amend the current Environmental Impact Assessment (EIA) for a milling operation and related facilities. Based on the content of the application file, the MEUP will form a multidisciplinary committee with experts from concerned government agencies and outside experts if deemed necessary. A public information meeting, regarding the project details, will be held in the closest village of Gümüşkol and following the meeting, the technical committee will generate a technical Terms of Reference for preparation of the EIA. The completed EIA will be submitted to MEUP for review and approval by the technical committee. Subsequent to receipt of the amended EIA certificate, applications will be made to amend existing forestry permits (Ministry of Forestry and Water), the GSM permit (Uşak Governor’s office) and the Operating Permit (Ministry of Energy and Natural Resources).
Table 4-2: Permitting Process Milestones
Year Permitting Milestones 1997 Identification of ore body
1998-2002 Completion of feasibility stage drilling programs 1999 Approval of the site selection permit
2000-2003 Completion of feasibility study 2003 Approval of Environmental Positive Certificate and Mine Operation Permit (10 Mtpa) 2003 Granting of Site Selection Permit 2004 Zoning Plan and Construction Permit approved 2005 Construction started
April 2006 Commissioning and leaching started May 2006 First doré poured July 2006 Commercial production
2007 Received the opening/commissioning licence 2011 Received EIA positive decision approval to expand minimum capacity to 12.5 Mtpa 2014 Received approval of supplementary EIA for the expansion of up to 35 Mtpa

K I Ş L A D A Ğ M I L L I N G P R O J E C T , T U R K E Y
T E C H N I C A L R E P O R T
2018 Final Report Page 4-5
Table 4-3: Key Project Permits
Name of Permit Issue Date Issuer
Site Selection Permit 1999 Governorship of Uşak Mining Licence 2003-04-09 Ministry of Energy and Natural Resources EIA Permit 2003-06-27 Ministry of Environment Site Selection Permit 2003-12-12 Ministry of Health Pre-Emission Permit 2004-03-03 Directorship of Environment of Uşak Forestry Permit 2004-06-30 Directorship of Forestry Zoning Plan and Construction Permit 2004-08-03 Governorship of Uşak Establishment Permit 2005-12-19 Ministry of Labour Operation Permit 2006-04-04 Ministry of Labour Trial Permit 2006-04-06 Provincial Administration of Uşak Discharge Permit (original)1 2007-03-28 Directorship of Environment of Uşak Emission Permit (original)2 2007-03-28 Directorship of Environment of Uşak Opening Permit 2007-04-06 Provincial Administration of Uşak Opening Permit 3 2008-03-06 Provincial Administration of Uşak EIA Capacity Expansion Permit 2011-06-06 Ministry of Environment EIA Capacity Expansion Permit 2013-10-03 Ministry of Environment Environmental Licence 2013-04-24 Ministry of Environment Workplace Opening Permit 2014-08-13 Provincial Administration of Uşak Environmental Licence 2015-07-03 Ministry of Environment Environmental Licence 2016-12-05 Ministry of Environment
Notes: 1The Discharge Permit is renewed every five years from the date of issue. 2The Emission Permit is renewed every two years. 3 The second opening permit, 6 March 2008, was granted after the 2007 injunction against the project was lifted.
K I Ş L A D A Ğ M I L L I N G P R O J E C T , T U R K E Y
T E C H N I C A L R E P O R T
2018 Final Report Page 5-1
SECTION • 5 AC C ES SIB IL IT Y, CL IM AT E, LOC AL RESOU RCES, INFR AST RUCT U RE AN D PHY SIOG R AP HY
5 .1 S I T E TO P O G R AP H Y The mine site sits on the western edge of the Anatolian Plateau at an elevation of approximately 1,000 m, in gentle rolling topography. Local elevations range from a peak of 1,300 masl (Kişladağ) to the adjacent valley of 700 masl.
5 .2 AC C E S S I B I L I T Y The Kişladağ mine is situated 180 km west of the port city of Izmir. It is accessed from Izmir by traveling eastward approximately 220 km east from Izmir to the province capital of Uşak along the main E-W highway to Ankara and then taking a secondary highway 35 km SW towards Eşme. A 5.3 km private mine access road near the village of Gümüşkol, connects the mine to the public highway (Figure 5-1).
The major cities of Izmir and Ankara are serviced by international airlines and there are regular internal flights by Turkish airlines to most major centers in the country. There is also an airport at Uşak for internal commercial flights servicing Istanbul.
5 .3 P H Y S I O G R AP H Y AN D C L I M AT E The site surface consists of a thin soil on weathered bedrock. The area is dominated by a volcanic sequence with stony outcrops and rocky fields. There are areas forested by low pines but the region is predominantly grasslands and shrubs.
The climate in this region is arid with warm dry summers and mild wet winters. The Project site is located in a transition zone between the Continental and Mediterranean weather regimes. Temperature ranges from -5 to 35 °C with extremes to -15 and 40 °C.
5 .4 LO C AL R E S O U R C E S There is a direct route to Uşak which accommodates a majority of the work force along a paved road 35 km north east of the site.
A 138 kV high voltage power line was commissioned in 2017 from Uşak to site and has a capacity of 100 MVA. The original 38 kV line from Uşak with 10 MVA capacity is still in use servicing a portion of the overland conveying system.
Water is pumped from various well fields local to the site. The annual allotment from the wells is 2,481,000 m3/year (78.7 L/s), the pumping and pipeline system has a capacity of 324 m3 per hour.
A dam near Gedikler village was constructed in partnership with the water authority in 2016. A pumping and pipeline system connecting the dam to a site non-contact water pond was
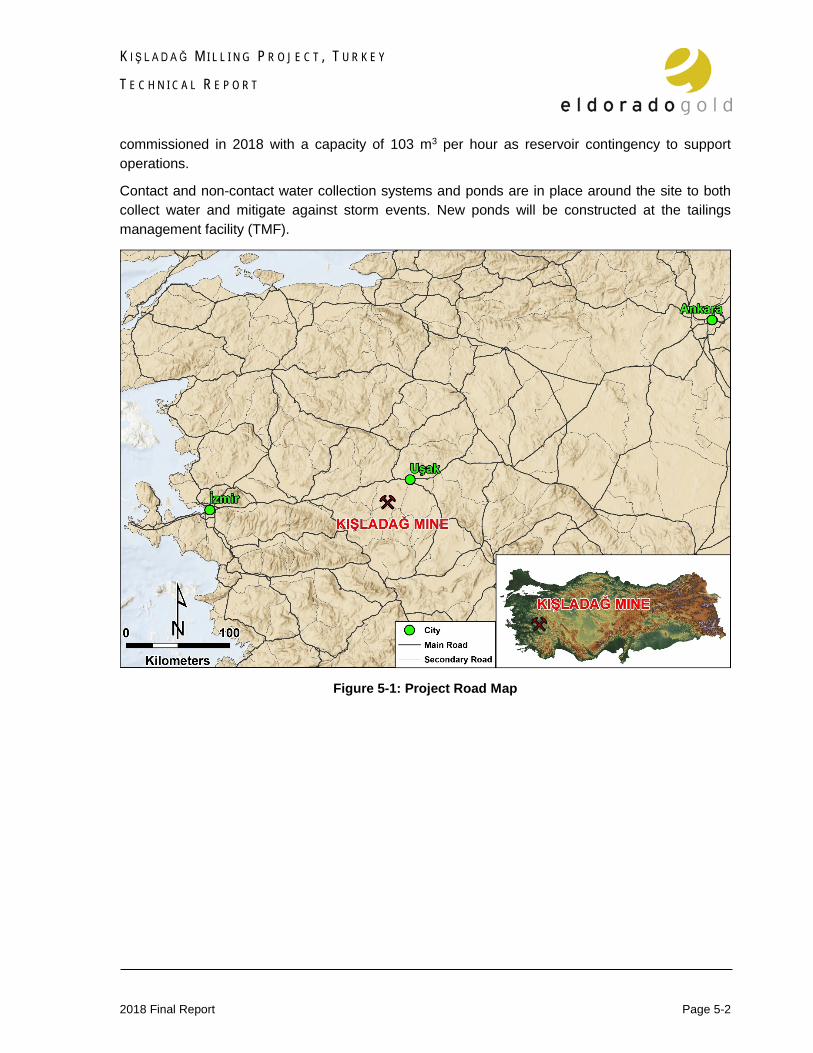
K I Ş L A D A Ğ M I L L I N G P R O J E C T , T U R K E Y
T E C H N I C A L R E P O R T
2018 Final Report Page 5-2
commissioned in 2018 with a capacity of 103 m3 per hour as reservoir contingency to support operations.
Contact and non-contact water collection systems and ponds are in place around the site to both collect water and mitigate against storm events. New ponds will be constructed at the tailings management facility (TMF).
Figure 5-1: Project Road Map

K I Ş L A D A Ğ M I L L I N G P R O J E C T , T U R K E Y
T E C H N I C A L R E P O R T
2018 Final Report Page 6-1
SECTION • 6 H I STOR Y Eldorado acquired the Kişladağ property from Gencor Limited of South Africa in July 1996, as part of their portfolio of assets in Brazil and Turkey. The original prospect was identified by Tüprag geologists in 1989 from satellite image interpretations, and confirmed through ground reconnaissance and geochemical sampling programs.
Since 1996, Eldorado’s exploration activities at Kişladağ have focused primarily on the zone known locally as Gökgöz Tepe, using principally geochemical soil and rockchip sampling, coupled with geological mapping. On the basis of this work, a gold anomaly was identified along the north slope of Gökgöz Tepe extending approximately 1,200 m on strike by 600 m wide. This work was followed in 1997 by 2,745 m of trench sampling, and 1,638 m of percussion drilling, which confirmed the mineralization in the shallow subsurface down to approximately 50 m over the footprint of the soil anomaly.
In 1998, a six hole HQ (96 mm outer diameter (OD) and 63.5 mm inner diameter (ID)) diamond drilling program (1,059 m) probing the main anomaly target intersected gold mineralization to depths of greater than 250 m and effectively confirmed the potential for large low grade bulk tonnage gold deposit. In 1999 an additional 5,000 m of HQ core drilling and 1,600 m of trenching extended the strike length and depth of the deposit. Based on the trenching, percussion drilling and core drilling data available to that date, Micon International (Micon) and Eldorado identified a measured and indicated resource of 42.8 Mt of 1.49 g/t, plus an inferred resource of 31.1 Mt at 1.35 g/t (all based on a 0.8 g/t cutoff grade).
In 2000, a reverse circulation (RC) drill program totaling 7,580 m (and 577 m of diamond drill hole (DDH)) led to a revised resource estimate and a significant increase in the deposit’s contained metal content. That year, Micon reported a measured and indicated resource of 125.97 Mt for the deposit at an average grade of 1.20 g/t Au. This is equivalent to 4.85 Moz of contained gold (using a cutoff grade of 0.4 g/t Au).
In 2002, a combined total of 10,582 m (RC, DDH and Percussion) was completed.
In 2003 to 2004, the drilling campaigns continued and a total of 8,499 m (RC and DDH) were drilled including 1,384 m for open pit geotechnical purposes. These geotechnical holes were also assayed and results were used for resource-reserve calculations later on.
Metallurgical test work initiated during 1999 and 2000 by Eldorado indicated that the ore would be amenable to heap leaching, and in 1999 Eldorado was granted a Site Selection Permit by the Turkish authorities for a gold mining operation at the Kişladağ Project site. Early receipt of this permit was made possible by the high level of support the Project has received from within the Uşak province as well as at the central government level.
In 2001 Eldorado commissioned a prefeasibility study with Kilborn Engineering Pacific Limited (Kilborn), based on the concept of recovering gold by heap leaching. This study considered an operation to treat 3.4 Mtpa of material based on an owner operated mining fleet and a three stage crushing circuit generating a final crush size of 100% minus 8 mm. The objective of this approach
K I Ş L A D A Ğ M I L L I N G P R O J E C T , T U R K E Y
T E C H N I C A L R E P O R T
2018 Final Report Page 6-2
was to minimize capital expenditure in the early years and allow for expansion to develop the total resource at a later date. Initial capital cost was estimated to be US$47.4 M with a cash operating cost estimated at US$154/oz and an average annual gold production of 103,600 troy ounces.
Subsequent to issuing the prefeasibility study, Kilborn was asked to review the Project conditions in light of devaluation of the Turkish currency and to incorporate contract mining and utilizing used crushing equipment. An Addendum to the prefeasibility study was issued in December 2001, presenting a revised initial capital cost estimate of US$29.6 M and a cash operating cost estimate of US$149/oz.
In April 2003, a bankable feasibility study was completed by Hatch. The study envisaged a staged increase in production over a five year period from an initial production target of 5 Mtpa increasing to 10 Mtpa in Year 5. An optimization study was subsequently completed in July 2003, which generated a total life of mine capital cost estimate for the project of approximately US$138.5 million.
A technical report with a proven and probable mineral reserves equal to 115 Mt at a grade of 1.23 g/t Au (oxide cut-off 0.35 g/t Au; sulphide cut-off 0.50 g/t Au; gold price – US$325/oz) was declared and supported by Hatch (Technical Report, Hatch, 2003). Subsequent to the Hatch report additional drilling information was received and a new resource report was completed with a measured and indicated mineral resources of 215 Mt grading 1.04 g/t Au (0.40 g/t Au cut-off) was declared and supported by Micon (Technical Report, Micon, 2003).
Construction work started with access road construction in 2004. Work continued into 2006 with leach pad area preparation, construction of crushing, screening and ADR plants and ancillary buildings. Open pit production started in 2005. All construction work for the first phase was completed in early 2006 and commercial production was declared in July 2006.
Expansion of the crushing-screening plant to 10 Mtpa followed commercial production, with completion of the additional capacity in April 2007.
The operation was shut down in August 2007 after the Environmental Positive Certificate for Kişladağ had been challenged by a third party. The injunction was lifted in February 2008 and operation resumed in March 2008.
Owner operation in the pit replaced the mine contractor in September 2008.
Kişladağ operations further expanded during 2010 and in February 2011 the plant throughput increased to a rate of 12.5 Mtpa, with further optimizations to a rate of 13.1 Mtpa achieved in 2015 and 2016.
In 2015, detailed engineering was largely completed to expand the Kişladağ operations to process 20 Mtpa. The proposed design was to add a new 7.5 Mt/a, three-stage crushing circuit and a new primary crushing system to feed the new and existing plants. As a result of falling gold prices and other corporate capital projects the project was indefinitely cancelled.
In anticipation of the expansion, several infrastructure improvement projects were completed, notably, a new 154 kV substation with the capacity of 100 MVA and additional mining equipment.

K I Ş L A D A Ğ M I L L I N G P R O J E C T , T U R K E Y
T E C H N I C A L R E P O R T
2018 Final Report Page 6-3
In 2017 Eldorado completed an internal concept study followed by an internal scoping study to assess options for a milling circuit. These studies were supported by a large metallurgical testwork program. Ausenco completed a prefeasibility level design of the milling circuit in February 2018 to support this study.
K I Ş L A D A Ğ M I L L I N G P R O J E C T , T U R K E Y
T E C H N I C A L R E P O R T
2018 Final Report Page 7-1
SECTION • 7 GEO LOGIC AL SETT ING AN D MINER ALI Z AT I ON
7 .1 RE G I O N AL G E O L O G Y Western Turkey, is host to several major porphyry and epithermal gold deposits including the Kişladağ porphyry gold mine (17 Moz), Efemçukuru intermediate sulfidation gold mine (2.5 Moz) and Ovaçik (3.9 Moz) low sulfidation gold mine. The gold-rich region is part of the Western Tethyan orogeny defined by a series of magmatic belts that have a strike length of over 3,600 km extending from Romania through Turkey, Iran, and continuing to the east through Pakistan into Central and Eastern Asia. The magmatic belts in Turkey broadly young in age from north to south. In the north, Cretaceous to Paleogene subduction-related arc magmatism along the Pontide range transitions to post-collision, extension related Neogene magmatism in central and western Anatolia (Agostini et al., 2010; Jolivet et al., 2013). Deposits associated with the magmatism include a wide variety of porphyry, epithermal and sediment-hosted base and precious metal deposits (Richards, 2015).
The Kışladağ porphyry gold deposit occurs within the extension-related Neogene Uşak-Güre basin (Figure 7-1). The NE–SW-trending basin formed upon the Menderes metamorphic basement, which was exhumed during extension (Karaoğlu et al., 2010). Basement units of the massif include augen gneisses, schist and marble, and the structurally overlying Upper Cretaceous ophiolitic mélange rocks of the İzmir–Ankara zone (Ercan et al., 1978; Şengör et al., 1981). Basin fill units of the Uşak–Güre basin comprise the fluvio-lacustrine sedimentary packages of the Lower Miocene Hacıbekir Group, the Lower–Middle Miocene İnay Group and the Upper Miocene Asartepe Formation.
Within the basin there are three volcanic centers, Elmadağ, İtecektepe and Beydağı, with the latter hosting the Kışladağ deposit (Karaoğlu et al., 2010; Karaoğlu and Helvacı, 2012). The volcanic centers are stratovolcanoes, and the Beydağı stratovolcano in the southwest is the largest at ~16×9 km in diameter. Within the stratovolcanoes three distinct volcanic successions have been identified (Karaoğlu et al., 2010): (1) the Beydağı volcanic unit, composed of shoshonite, latites and rhyolitic lavas followed by dacitic and andesitic pyroclastic deposits; (2) the Payamtepe volcanic unit composed of potassic-intermediate lavas (latites and trachytes); and (3) the Karaağaç dikes composed of andesite and latite. 40Ar/39Ar dating by Karaoğlu et al. (2010) on biotite indicates that volcanic activity occurred between 17.3 Ma and 12.2 Ma, with the older ages from the northern Elmadağ volcanic center (17.3 to 16.3 Ma) and two younger ages of 15.0 Ma and 12.2 Ma from İtecektepe and Beydağı volcanoes respectively.
7 .2 LO C AL G E O L O G Y The Kışladağ deposit occurs mainly within intrusive rocks of the eroded Miocene Beydağı stratovolcano, which was emplaced within and overlies regional pre-Cretaceous Menderes metamorphic rocks. A minor amount of mineralization occurs within the volcaniclastic rocks of the Beydağı volcanic sequence and metamorphic basement rocks near the contacts with the mineralized intrusions. Menderes metamorphic rocks comprise schist and gneiss, and are exposed in erosional windows to the north and northwest of the deposit (pCM; Figure 7-2). The contact between the

K I Ş L A D A Ğ M I L L I N G P R O J E C T , T U R K E Y
T E C H N I C A L R E P O R T
2018 Final Report Page 7-2
metamorphic basement and the volcanic sequence is a gently dipping unconformity, but within the deposit it is an irregular contact where deeper level, intrusive portions of the volcanic sequence cut the metamorphic rocks. Foliation and compositional layering in the metamorphic sequence is subhorizontal to gently dipping, with local variations related to small-scale folds.
The Beydağı volcanic sequence contains a variety of rock types within and surrounding the deposit that display rapid lateral and vertical facies changes. Six primary map units are defined (Figure 7-2): (1) volcanic conglomerate with monolithic porphyritic latite clasts (PBcg); (2) porphyritic quartz latite flows (PBq); (3) porphyritic latite flows commonly with flow-banded texture (PBf); (4) volcaniclastic rocks including lithic tuffs, volcaniclastic breccia, sandstone, siltstone, and mudstone or ash-fall tuff (PBvc); (5) monolithic porphyritic latite clast-supported breccia and minor mud-silt breccia to conglomerate (PBb); and (6) porphyritic hypabyssal monzonite intrusions, which in the mine are further divided into four subunits.
Deformation within the Beydağı volcanic sequence is minor in and around the Kışladağ deposit. Stratigraphic layering dips gently radially outward from the eroded center of the volcanic system, with no evidence of fault-related tilting; however, anomalously steep bedding (up to 45˚) occurs locally adjacent to intrusions. The overall geometry of the volcanic sequence and topographic features surrounding Kışladağ suggest that pre-erosion, the volcanic edifice rose ~1 km above the current erosional level.
There are no mappable fault offsets of stratigraphic or intrusive contacts, although mesoscopic structures consisting of low-offset fractures, joint sets, and veins are common. Fracturing is most intense in rocks adjacent to intrusive contacts and is also well developed in a NE-NNE striking corridor that occurs just east of the deposit characterized by joints, silicified outcrops, and silicified sheeted fractures and breccia zones. This fracture zone has not experienced significant offset since emplacement of the volcanic rocks because in several locations lithologic contacts can be mapped across it without displacement.
The Kışladağ deposit is centered on a set of nested subvolcanic porphyritic intrusions that were emplaced through the underlying Menderes metamorphic rocks into the Beydağı volcanic sequence. The intrusions are all monzonites based on their mineralogy and chemistry (Baker et al., 2016) and have been subdivided into Intrusions #1, #2, #2A, and #3, based on cross cutting relationships. Their ages range from 14.76 ± 0.01 to 14.36 ± 0.02 Ma (U-Pb zircon) that brackets the age of mineralization and is consistent with a Re-Os age of 14.49 ± 0.06 Ma on Au-associated molybdenite (Baker et al. 2016). The highest gold grades in the Kışladağ deposit occur within the potassic core of the deposit centered on Intrusion #1. Surrounding and partly overlapping the potassic zone is a distinct white mica-tourmaline-(pyrite-albite-quartz) alteration. A poorly mineralized advanced argillic alteration (quartz-alunite-dickite-pyrophyllite-pyrite) post-dates the tourmaline-white mica assemblage and the most widespread alteration is argillic comprising kaolinite-smectite-pyrite-quartz.

K I Ş L A D A Ğ M I L L I N G P R O J E C T , T U R K E Y
T E C H N I C A L R E P O R T
2018 Final Report Page 7-3
Figure 7-1: Geological Map of Uşak-Güre Basin showing the Location of the major Volcanic
centers and Kışladağ Mine (modified after Karaoğlu et al., 2010).

K I Ş L A D A Ğ M I L L I N G P R O J E C T , T U R K E Y
T E C H N I C A L R E P O R T
2018 Final Report Page 7-4
Figure 7-2: Geological Map of the Kışladağ Deposit and surrounding Area (modified from Baker et al., 2016).

K I Ş L A D A Ğ M I L L I N G P R O J E C T , T U R K E Y
T E C H N I C A L R E P O R T
2018 Final Report Page 8-1
SECTION • 8 DE POSI T TYPE S
8 .1 DE P O S I T G E O L O G Y The Kışladağ deposit is hosted by a suite of subvolcanic monzonite porphyry intrusions that are subdivided into Intrusions #1, #2, #2A, and #3. Intrusion #1 is the oldest, and generally best mineralized phase. It forms the core of the system, and is cut by the younger porphyritic intrusions. It is an E-W oriented elongate elliptical body in map view (~1,300 m x ~500 m), and in the subsurface has a sill-like form intruding along the contact of the basement and volcanic package (Figure 8-1). At depth the main body extends beyond the current limit of drilling (~1,000 m). Contacts between Intrusion #1 and the surrounding volcanic rocks are generally obscured by alteration. Contacts with younger intrusions, particularly Intrusion #3, are better preserved. Intrusion #1 has a K-feldspar-dominant groundmass with plagioclase phenocrysts (up to 30% of the rock by volume), occurring as tabular crystals ranging in size from 0.1 – 5 mm. Biotite is the second most abundant phenocryst phase (up to 10% of the rock) whereas blocky megacrystic K-feldspar phenocrysts, up to 1 cm, are a characteristic of this unit, but are low in abundance compared to plagioclase and biotite phenocrysts (< 2%). Quartz phenocrysts are rare, and are generally rounded or embayed where present. Intrusion #1 lacks amphibole or pyroxene phenocrysts and primary magnetite.
Figure 8-1: Geological Cross Section of the Kışladağ Deposit (modified from Baker et al., 2016)
Intrusion #2 occurs as a WNW-oriented elongate body at depth that splits into two apophyses that form semi-circular stocks (both approximately 150-200 m in diameter) at shallower levels where they cut Intrusion #1. Both apophyses are in contact with and cut by Intrusion #3. The rock is a fine- to

K I Ş L A D A Ğ M I L L I N G P R O J E C T , T U R K E Y
T E C H N I C A L R E P O R T
2018 Final Report Page 8-2
medium-grained porphyry with abundant (20-30%) plagioclase phenocrysts up to 2 mm in length in a dominantly K-feldspar groundmass. Rare primary biotite and amphibole phenocrysts occur but the unit lacks quartz phenocrysts. Very fine-grained (< 0.2 mm) primary magnetite in the groundmass may be primary.
Intrusion #2A occurs in the southeast corner of the pit and is characterized by a very intense clay (kaolinite-smectite-pyrite) alteration throughout that forms a distinct textural and rheological argillic altered sub-domain termed the friable domain. Intrusion #2A forms a circular stock (250-300 m across) that tapers at depth. It intrudes the margin of Intrusion #1, but contact relationships with Intrusion #3 are not observed. It is a fine- to medium-grained porphyritic rock, but the intense pervasive clay alteration obscures the primary mineral assemblage.
Intrusion #3 is the youngest large intrusive body. It forms a semi-circular stock near the center of Intrusion #1, west of the central Intrusion #2 stock and at depth to the west extends into a WNW-elongated, subvertical dike-like body. Intrusion #3 is a fine-grained porphyritic unit with 20-30% plagioclase phenocrysts up to 4 mm in length, and lesser quartz and biotite phenocrysts (both < 5%). Amphibole phenocrysts (5-10%) are more abundant than in the other intrusions but are commonly altered to chlorite. This intrusion is magnetic due to the presence of very fine-grained disseminated primary magnetite in the groundmass.
The oldest stage of alteration is a potassic assemblage characterized by the presence of secondary red-brown biotite and abundant pale pink-buff to nearly white K-feldspar. The biotite alteration is most intense in Intrusion #1 where it is associated with the highest gold grades. There are restricted occurrences of secondary magnetite associated with the potassic alteration, occurring as veinlets and as extremely fine-grained crystals intergrown with secondary biotite. A sodic-calcic sub-domain comprising actinolite-albite-magnetite alteration occurs locally within but overprints the potassic alteration, and may form a deeper mineralized sodic-calcic core.
The tourmaline alteration is most intense immediately surrounding the potassic zone, however, the associated white mica alteration is more widespread and is particularly abundant on the west side of the deposit and spatially overlaps advanced argillic alteration. Within the intrusions tourmaline commonly occurs as envelopes around quartz ± pyrite veinlets, grading into black quartz-tourmaline matrix-supported hydrothermal breccias containing angular wallrock fragments. Tourmaline alteration of the volcanic rocks is more pervasive, though cross cutting breccia bodies are also present.
Quartz-alunite ± dickite ± pyrophyllite alteration is most abundant as a lithocap and as an alteration halo on the eastern side of the deposit. The advanced argillic alteration generally occurs in thick tabular zones that are localized along either stratigraphic contacts, within favorable volcaniclastic host rocks, or along fracture systems both within intrusions and volcanic rocks. Stratigraphically-controlled zones tend to form subhorizontal to gently-dipping lithocaps peripheral to the deposit whereas structurally-controlled zones are steep-sided and form linear outcropping ridges. The advanced argillic alteration is typically poorly mineralized, and commonly oxidized with jarosite replacing pyrite.

K I Ş L A D A Ğ M I L L I N G P R O J E C T , T U R K E Y
T E C H N I C A L R E P O R T
2018 Final Report Page 8-3
Argillic alteration is pervasively developed throughout the deposit, but is particularly dominant in the western upper levels and throughout much of the surrounding volcanic sequence. Within the deposit the largest zone of intense kaolinite alteration is focused in Intrusion #2A and a second smaller zone is focused in the southwest corner of the pit within Intrusion #1. Smectite, mainly montmorillonite and locally nontronite, commonly overprints biotite in the potassic alteration zone.
Porphyry-style sheeted to stockwork quartz veins occur with the potassic and white mica-tourmaline alteration zones. Veinlets range in width from 0.1 mm to 1 cm, with most being 1-3 mm. Gold occurs as non-refractory, very fine free gold grains (typically less than 10 microns in diameter) that are associated with pyrite, and less commonly other sulfide phases (chalcopyrite, and sphalerite), as well as free grains attached to quartz, K-feldspar and albite. Both native gold and electrum (with up to 18 % Ag) have been identified. Other opaque minerals include pyrite, molybdenite, and sphalerite, with minor occurrences of tennantite, tetrahedrite, bournonite, chalcopyrite and gold- and bismuth-telluride. The average copper grade of the deposit is low (~ 200 ppm) but increases to typically between 300 and 500 ppm within potassic alteration (Baker et al., 2016).
Metallurgical testwork was carried out within the remaining mined mineral reserves on five alteration domains, namely argillic (ARG), potassic (POT), white mica tourmaline (WMT), friable (FRB) and Intrusion #3 (INT3; see Section 13). In addition, detailed ongoing studies by Dr J. Hunt (Mineral Deposit Research Unit, University of British Columbia) have evaluated gold deportment in some of these alteration domains including argillic, white mica-tourmaline (WMT), and potassic, as well as transitional WMT-potassic and sodic-calcic alteration (Table 8-1). Thirty-one gold grains have been identified using scanning electron microscope based techniques (Figure 8-2). The gold grains have an average diameter of 3.8 microns with a range in size from 1.1 to 9.6 microns. Four gold grains have been identified in the WMT (2) and argillic (2) alteration, and twenty-seven grains have been identified in the transitional WMT-potassic (7), potassic alteration (16), and sodic-calcic alteration (4). The average grain size in the latter samples is smaller (Table 8-1).
Gold in the argillic alteration occurs primarily with pyrite whereas in the WMT alteration the gold grains occur with pyrite and muscovite. In the potassic and sodic-calcic samples, the majority of gold is hosted in K-feldspar. The transitional WMT-potassic sample contains gold grains associated with a mixture of pyrite, muscovite, K-feldspar and albite.
8 .2 DE P O S I T M O D E L The Kışladağ deposit is classified as a gold-only porphyry deposit due to its exceptionally low Cu%/Au ppm ratio (≈ 0.03; Baker et al., 2016). Significant analogues include the Maricunga porphyry deposits (9.8 Moz Au) in Chile and La Colosa (33.2 Moz Au) in Columbia. The low Cu/Au ratio may in part be related to the shallow level of emplacement (< 1 km) and volcanic setting, but also reflects the post-collisional extensional setting of the Miocene in western Turkey (Baker et al., 2016). Nonetheless, the deposit shares many characteristics with typical porphyry systems including: (i) multi-stage porphyry intrusions; (ii) a zoned alteration system that contain a high temperature potassic core, an outer white mica-tourmaline zone (analogous to phyllic alteration in typical

K I Ş L A D A Ğ M I L L I N G P R O J E C T , T U R K E Y
T E C H N I C A L R E P O R T
2018 Final Report Page 8-4
porphyry deposits) and late, high level advanced argillic alteration; and (iii) porphyry style stockwork veins.
Table 8-1: Summary of Au Deportment at Kışladağ and associated Minerals in terms of % Au Grain Boundary in contact with specified Mineral Type
Alteration Zone
No. of Samples
No. of Au
Grains
Au Diameter
Mean (Microns)
Minerals around the Gold Grain: % of Gold Grain Boundary
Pyrite Clay Muscovite K-feldspar Albite Quartz Chalcopyrite Galena Unknown
Argillic 1 2 6.68 94 6
WMT 3 2 7.46 20 50 23 7
Transitional WMT-
Potassic 1 7 3.62 29 14 43 14
Potassic 3 16 3.12 12 3 56 16 6 4 3
Sodic-Calcic 2 4 3.15 21 68 11
Figure 8-2: Scanning Electron Microscope Images of Au located within Pyrite in Argillic Altered
Sample and K-feldspar in Potassic altered Sample

K I Ş L A D A Ğ M I L L I N G P R O J E C T , T U R K E Y
T E C H N I C A L R E P O R T
2018 Final Report Page 9-1
SECTION • 9 EXP LOR AT I ON Eldorado has not undertaken any recent exploration works at the Kışladağ Project.

K I Ş L A D A Ğ M I L L I N G P R O J E C T , T U R K E Y
T E C H N I C A L R E P O R T
2018 Final Report Page 10-1
SECTION • 10 DR ILL IN G Diamond-drill holes are the principal source of geologic, grade and metallurgical data for the Kışladağ mine since the start of mining in 2006. All diamond drilling in Kışladağ was done with wireline core rigs. Drillcores were mostly of HQ size (63.5 mm nominal core diameter). Drillers placed the core into wooden core boxes with each box holding about 4 m of HQ core. Geology and geotechnical data were collected from the core and core was photographed (wet) before sampling. Specific gravity (SG) measurements were done approximately every 5 m. Core recovery in the mineralized units was usually between 95% and 100%. The entire lengths of the diamond-drill holes were sampled (sawn in half by diamond saw). The core library for the Kışladağ deposit is kept in core storage facilities on site and used for subsequent technical investigations. Some intervals have been completely sampled during technical studies and physical core no longer exists.
Drilling totals are shown in Table 10-1. The pre-2004 campaigns were covered in an earlier Technical Report, Micon, 2003, and the 2004 to 2009 programs are described in the pre-existing Technical Report, Eldorado, 2010. Campaigns from 2010 to the present are the focus of this section and report.
Table 10-1: Summary of Kışladağ Mine Drilling
Period Diamond Drilling Reverse Circulation Drilling Rotary Drilling
# of holes (m) # of holes (m) # of holes (m)
Pre-2004 53 12,269 145 21,298 44 2,264
2004-2006 9 862 8 1,329 - -
2007-2009 81 34,603 14 3,558 - -
2010 73 40,705 - - - -
2011-2012 32 18,169 - - - -
2014-2016 154 51,198 121 11,591 - -
Total 402 157,807 288 37,775 44 2,264
The 2010 campaign comprised solely of diamond-drill holes which ranged in length from 305 to 902 m averaging 558 m. The 2011 to 2012 program consisted of diamond-drill holes ranging in length from 25 to 930 m and averaging 568 m. The 2014 to 2016 campaign comprised both reverse circulation (RC) and diamond drill programs. The 2014-16 diamond-drill holes ranged in length from 130 to 568 m and averaged 332.5 m. RC holes ranged from 23 to 145 m and averaged 96 m. The location of the drillholes are shown on a collar plan map in Figure 10-1.
Drilling was done by wireline method. Drillcores were most commonly HQ size and, less commonly, NQ size (47.6 mm nominal core diameter). Up to four drill rigs were used. Upon completion, the collar and anchor rods were removed and a polyvinyl chloride (PVC) pipe was inserted into the hole. Drillhole collars were located respective to a property grid. Proposed hole collars and completed collars were surveyed by the mine survey group.

K I Ş L A D A Ğ M I L L I N G P R O J E C T , T U R K E Y
T E C H N I C A L R E P O R T
2018 Final Report Page 10-2
The drillholes were drilled at an inclination of between 45° and 90°, with the majority between 60° and 70°. Holes were drilled mostly along 0°, 90°, 135°, 180°, and 310° azimuths. Down-hole surveys were taken approximately every 50 m by the drilling contractor mostly using a Reflex single-shot survey instrument.
Standard logging and sampling conventions were used to capture information from the drill core. The core was logged in detail onto paper logging sheets, and the data was then entered into the project database. The core was photographed before being sampled.
Eldorado reviewed the core logging procedures at site, and the drillcore was found to be well handled and maintained. Material was stored as stacked pallets in an organized “core farm”. Data collection was competently done. Core recovery in the mineralized units was excellent, averaging 95%. Overall the Kışladağ drill program and data capture were performed in a competent manner.
Figure 10-1: Kışladağ Mine Drillhole Location Map

K I Ş L A D A Ğ M I L L I N G P R O J E C T , T U R K E Y
T E C H N I C A L R E P O R T
2018 Final Report Page 11-1
SECTION • 11 SAM PLE PR EP AR AT IO N, AN ALYSES AN D SEC URITY
Sample numbers were written on wooden core boxes allowing gaps in numbering sequence for control sample insertion. The entire lengths of the diamond-drill holes were sampled. Specific gravity measurements were done approximately every 5 meters. From 2007 to 2016 all core cutting and sampling was done on site at Kışladağ. The cut samples were sent to Eldorado’s sample preparation facility near Çanakkale in northwest Turkey.
Sampling on RC holes was done on 2.5 m intervals along the entire length of the drillholes. A cloth or perforated sample bag was used for RC samples. When drilling dry, drill cuttings were collected from the cyclone directly and split using a Jones splitter. After each sample was taken, the cyclone and drill string were blown clean. A small (~1 kg) sample of RC cuttings from each interval was collected for logging, spectral analysis and chipboard preparation. Wet RC sampling was done using a rotating wet splitter mounted on the rig. If the ground water flow was insufficient, extra water was injected through the rods to maintain the necessary flow rate for the rotating wet splitter. Wet samples were left to drain in a safe place and were then shipped to the company’s prep lab facility near Çanakkale. After samples were oven-dried, the same sample preparation protocol was applied to the RC samples as the diamond-drill samples.
The entire core library for the Kışladağ deposit is kept in core storage facilities on site. The coarse reject samples were stored off-site at the Çanakkale sample preparation lab. Samples from the core library and rejects were used over time to prepare single and composite metallurgical samples. From some intervals material is no longer available.
11 .1 S AM P L E P R E P AR A T I O N AN D AS S A Y I N G Split drillcore and RC samples were prepared at Eldorado’s in-country preparation facility near Çanakkale in northwestern Turkey according to the following protocol:
• The entire sample was crushed to 90% minus 3 mm (or 75% minus 2 mm). • A 1 kg subsample was split from the crushed, minus 3 mm sample and pulverized to 90%
minus 75 µm (200 mesh). Prior to 2014, splitting was done by a riffle unit. After 2014 a Boyd rotary splitter was utilized.
• A 110 g subsample was split off by taking multiple scoops from the pulverized 75 µm sample.
The 110 g subsample was placed in a kraft paper envelope, sealed with a folded wire or glued top, and prepared for shipping. The rest of the pulverized sample was stored in plastic bags for later use.
All equipment was flushed with barren material and blasted with compressed air between each sample preparation procedure. Regular screen tests were done on the crushed and pulverized material to ensure that sample preparation specifications were being met.

K I Ş L A D A Ğ M I L L I N G P R O J E C T , T U R K E Y
T E C H N I C A L R E P O R T
2018 Final Report Page 11-2
A standard reference material (SRM), a duplicate and a blank sample were inserted into the sample stream at every 8th sample in order to monitor precision, possible contamination and accuracy respectively.
The sample pulps were sent from Çanakkale to ALS Chemex Laboratories’ sample preparation facility in Izmir and were then shipped under the supervision of ALS Chemex to their Analytical Laboratory in North Vancouver, BC. After April 2015, Bureau Veritas (formerly Acme Labs) in Ankara was used to analyze Kışladağ drill samples. All samples were assayed for gold by 30-g fire assay with an atomic absorption (AA) finish and for multi-element geochemistry using fusion digestion and inductively coupled plasma (ICP) analysis.
11 .2 Q U AL I T Y AS S U R AN C E /Q U AL I T Y C O N T R O L (QA/ QC) Assay results are provided to Eldorado in electronic format and as paper certificates. Upon receipt of assay results, values for SRMs and field blanks are tabulated and compared to the established pass-fail criteria as follows:
• Automatic batch failure if the SRM result is greater than the round-robin limit of three standard deviations.
• Automatic batch failure if two consecutive SRM results are greater than two standard deviations on the same side of the mean.
• Automatic batch failure if the field blank result is over 0.03 g/t Au.
If a batch fails, it is re-assayed until it passes. Override allowances are made for barren batches. Batch pass/failure data are tabulated on an ongoing basis, and charts of individual reference material values with respect to round-robin tolerance limits are maintained.
Assay performance of data collected prior to 2010 has been described in detail in the previous technical reports (Technical Report, Micon, 2003 and Technical Report, Eldorado, 2010).
The following sections will focus on the two drilling campaigns that contributed to major updates to the resource model: the 2010-2011 and 2015-2016 drilling campaigns.
11 .3 S AM P L E C O U N T S F O R QA/QC Table 11-1 shows the number of diamond drill core assay samples, blanks, duplicates and SRMs used in 2010-2011 and 2015-2016 drill campaigns.

K I Ş L A D A Ğ M I L L I N G P R O J E C T , T U R K E Y
T E C H N I C A L R E P O R T
2018 Final Report Page 11-3
Table 11-1: Number of Samples used for 2010-2011 and 2015-2016 Drill Campaigns
Type of Sample 2010-2011 2015-2016
Sample Count (%) Sample Count (%) Core 20,241 87.15 19,676 86.94
Duplicate 987 4.25 971 4.29 Blank 999 4.3 979 4.33 SRM 998 4.3 1,005 4.44
Total Assayed 23,225 100 22,631 100
11 .4 BL AN K S AM P L E P E R F O R M AN C E Assay performance of field blanks for gold is presented on Figure 11-1 for the 2010-2011 period and Figure 11-2 for the 2015-2016 drill campaign. The analytical detection limit (ADL) for gold is 0.005 g/t. The rejection threshold was chosen to equal 0.03 g/t. The results show no evidence of contamination. Rare higher values were investigated and found to be caused by sample mix-ups.
Figure 11-1: Kışladağ Blank Data – 2010 to 2011 Standard Blank COB05

K I Ş L A D A Ğ M I L L I N G P R O J E C T , T U R K E Y
T E C H N I C A L R E P O R T
2018 Final Report Page 11-4
Figure 11-2: Kışladağ Blank Data – 2015 to 2016 Standard Blank COB07
11 .5 S T AN D AR D S P E R F O R M AN C E Eldorado continuously monitors the performance of the SRM samples as the assay results arrive on site. Assaying during 2010-2015 used five different SRMs whereas 10 different SRMs were used during 2015-2016. The SRMs covered a grade range from 0.13 g/t Au to 3.20 g/t Au. Charts of the individual SRMs are shown on Figure 11-3 and Figure 11-4 for 2010-2011 period and on Figure 11-5 and Figure 11-6 for 2015-2016 period. All samples are given a “fail” flag as a default entry in the project database. Each sample is re-assigned a date-based “pass” flag when assays have passed acceptance criteria. At the data cutoff date of December 31, 2016, all samples had passed acceptance criteria. Some failures, marked with yellow boxes in the charts below, represent SRMs that upon investigation were found to have been inserted amongst unmineralized samples. These were deemed ignored and not used in any trend analysis of that SRM sample.

K I Ş L A D A Ğ M I L L I N G P R O J E C T , T U R K E Y
T E C H N I C A L R E P O R T
2018 Final Report Page 11-5
Figure 11-3: Standard Reference Material Chart, 2010 to 2011, Standard COS053 (KIS-14)
Figure 11-4: Standard Reference Material Chart, 2010 to 2011, Standard COS055 (KIS-16)
K I Ş L A D A Ğ M I L L I N G P R O J E C T , T U R K E Y
T E C H N I C A L R E P O R T
2018 Final Report Page 11-6
Figure 11-5: Standard Reference Material Chart, 2015 to 2016, Standard COS058 (KIS-19)
Figure 11-6: Standard Reference Material Chart, 2015 to 2016, Standard COS081 (SLGR05)
11 .6 DU P L I C AT E P E R F O R M AN C E Eldorado implemented a program which monitored data from regularly submitted coarse reject duplicates and pulp duplicates. These data showed good results. The duplicate data are shown in a relative difference chart in Figure 11-7 and percentile rank chart in Figure 11-8 for the 2010- 2011 period, and in Figure 11-9 and Figure 11-10 for the 2015-2016 period. Patterns observed in the relative difference plot are symmetric about zero suggesting no bias in the assay process. For the 90th percentile of the population, as shown on the percentile rank plot, a maximum difference of 20%
K I Ş L A D A Ğ M I L L I N G P R O J E C T , T U R K E Y
T E C H N I C A L R E P O R T
2018 Final Report Page 11-7
is recommended for the coarse reject duplicates, whereas a maximum difference of 10% is recommended for the pulp duplicate data. The Kışladağ data shows 14% difference in the coarse reject data for 2010-2011 period and 8% difference in the pulp duplicate data for 2015-2016 period.
Figure 11-7: Relative Difference Plot of Kışladağ Coarse Reject Duplicate Data, 2010 to 2011
Figure 11-8: Percentile Rank Plot, Kışladağ Coarse Reject Duplicate Data, 2010 to 2011

K I Ş L A D A Ğ M I L L I N G P R O J E C T , T U R K E Y
T E C H N I C A L R E P O R T
2018 Final Report Page 11-8
Figure 11-9: Relative Difference Plot of Kışladağ Pulp Duplicate Data, 2015 to 2016
Figure 11-10: Percentile Rank Plot, Kışladağ Pulp Duplicate Data, 2015 to 2016

K I Ş L A D A Ğ M I L L I N G P R O J E C T , T U R K E Y
T E C H N I C A L R E P O R T
2018 Final Report Page 11-9
11 .7 S P E C I F I C G R AV I T Y P R O G R AM Samples taken for assay from drillcores were also measured for specific gravity and used to create a specific gravity 3-D model. The specific gravity for non-porous samples (the most common type) is calculated using the weights of representative samples in water (W2) and in air (W1). The bulk density is calculated by W1 / (W1-W2).
11 .8 CO N C L U D I N G S T A T E M E N T Since the start of production in 2006, the entire drillhole database was reviewed in detail. Checks were made to the original assay certificates and survey data. Any discrepancies were corrected and incorporated into the current resource database. Eldorado therefore concludes that the data supporting the Kışladağ resource work are sufficiently free of error to be adequate for estimation. In Eldorado’s opinion, the QA/QC results demonstrate that the Kışladağ assay database is sufficiently accurate and precise for resource estimation.
K I Ş L A D A Ğ M I L L I N G P R O J E C T , T U R K E Y
T E C H N I C A L R E P O R T
2018 Final Report Page 12-1
SECTION • 12 D AT A VE RIF IC AT I ON The drillhole database created from drill campaigns from 2010 to 2016 was reviewed in detail. Cross-checks were made between the original assay certificates and downhole survey data and the digital database. Also, the descriptive information (lithology and alteration) was reviewed through relogging and pit mapping, and mineral identification by PIMA™ (a field portable, infrared spectrometer) analyses. Any discrepancies found were corrected and incorporated into the current resource database.
Another form of verification is the reconciliation to production of mined portions of the resource model. Results to date have shown excellent agreement between the actual mined production and the predicted production from the long term resource model. This is discussed in Section 24.
Eldorado therefore concludes that the data supporting the Kışladağ resource work are sufficiently free of error to be adequate for estimation.

K I Ş L A D A Ğ M I L L I N G P R O J E C T , T U R K E Y
T E C H N I C A L R E P O R T
2018 Final Report Page 13-1
SECTION • 13 MINER AL PRO CESSIN G AN D MET ALLU RGIC AL TE STWOR K
13 .1 I N T R O D U C T I O N The Kisladag deposit is a low grade gold bearing porphyry deposit that was amenable to heap leaching for gold recovery. Changes indicated by the performance of the leach pad and recent testwork have indicated lower recoveries using heap leaching.
Testwork focused on a milling and whole ore leaching circuit have displayed higher recoveries of approximately 80%. The testwork programs to support the process selection are discussed in the following sections.
13 .2 O R E C H AR AC T E R I Z AT I O N The mineralogy of Kişladağ remaining ore shows that gold occurs in fine grains (typically less than 10 microns in diameter) that are associated with pyrite, its oxidation products, and less commonly other sulfide phases (chalcopyrite, and sphalerite), as well as free grains attached to quartz, K-feldspar and albite. Both native gold and electrum (with up to 18 % Ag) have been identified.
The rock types are primarily andesite and dacite porphyry, and hydrothermal breccias, showing various types of alteration, including silicification and clay alteration.
For the metallurgical testwork required to support pre-feasibility, the Kişladağ ore body was divided into five different alterations (or ore types), namely argillic (ARG), potassic (POT), white mica tourmaline (WMT), friable (FRB), and Intrusion #3 (INT3).
The metallurgical testwork programs that were completed in support of the pre-feasibility study are as follows:
• Comminution testwork by SGS in Lakefield, Ontario. • Flotation testwork by Bureau Veritas in Richmond, British Columbia. • Cyanidation and carbon adsorption testwork by Bureau Veritas in Richmond, British
Columbia. • Cyanide detoxification testwork by Bureau Veritas in Richmond, British Columbia. • Geotechnical testwork by Golder Associates in Burnaby, British Columbia. • Measurements of flow moisture point and transportable moisture limit by SGS in Burnaby,
British Columbia. • Tailing filtration testwork by Aqseptence (former Bilfinger) in Lugo, Italy. • Thickening and filtration testwork by Pocock Industrial in Salt Lake City, USA.
13 .3 CO M M I N U T I O N TE S T W O R K To further characterize grindability of the Kişladağ deposit, comminution testwork was performed on fifteen samples by SGS in Lakefield, Ontario. Three core samples from each of the five alterations were tested in zones related to elevations within the remaining ore body. Comminution testwork

K I Ş L A D A Ğ M I L L I N G P R O J E C T , T U R K E Y
T E C H N I C A L R E P O R T
2018 Final Report Page 13-2
included bond rod mill work index (RWi), bond ball mill work index (BWi) and bond abrasion index (Ai). A summary of comminution testwork results are presented in Table 13-1. Overall, Kişladağ ore samples are characterized as medium to moderately hard based on values of RWi and BWi. In terms of abrasiveness, Kişladağ ore samples are classified as mild to moderately hard.
Table 13-1: Summary of Grinding Testwork for Kişladağ Ores
Alteration (ore type) Zone
Rod Mill Work Index Ball Mill Work Index Abrasion Index 80% Passing
RWi 80% Passing
BWi Ai Feed Product Feed Product
(µm) (kWh/t) (µm) (kWh/t) (g)
ARG
Upper 10,651 944 15.4 2,506 95 16.4 0.116
Middle 10,611 938 13.8 2,417 94 14.5 0.225
Lower 10,491 930 14.7 2,479 95 16.1 0.268
FRB
Upper 10,734 968 14.5 2,492 93 14.0 0.095
Middle 10,373 946 14.6 2,447 93 14.5 0.126
Lower 10,577 962 14.6 2,461 92 14.3 0.194
INT3
Upper 10,465 942 16.9 2,463 93 17.1 0.278
Middle 10,519 959 16.9 2,570 94 16.5 0.404
Lower 10,789 937 16.5 2,333 96 16.0 0.365
POT
Upper 11,094 936 16.4 2,607 97 16.2 0.413
Middle 10,441 948 16.5 2,495 93 15.6 0.336
Lower 10,388 934 15.6 2,523 93 15.0 0.465
WMT
Upper 10,633 949 16.1 2,419 95 16.2 0.409
Middle 10,632 929 14.7 2,405 96 15.2 0.53
Lower 10,640 947 15.6 2,440 95 17 0.557
There was some variability in various indices when examining each ore type separately. The ARG and FRB ore samples were somewhat softer with average RWi being 14.6 kWh/t for ARG and 14.6 kWh/t for FRB, and average BWi being 15.7 kWh/t for ARG and 14.3 kWh/t for FRB. INT3, POT, and WMT ore samples are generally classified as moderately hard with average RWi being 16.8 kWh/t for INT3, 16.2 kWh/t for POT and 15.5 kWh/t for WMT, and average BWi being 16.5 kWh/t for INT3, and 15.6 kWh/t for POT. Relatively speaking, the INT3 ore samples were hardest.
Based on Ai values, ARG and FRB ore samples exhibited moderately mild to medium abrasiveness; whereas INT3, POT and WMT ore samples were moderately abrasive.
Generally speaking, the upper zone samples within each ore type were slightly less abrasive than the lower zone. Such trends were not as distinctive in the case of RWi and BWi, although the majority of the slightly harder samples tend to be in the upper zone for each ore type.

K I Ş L A D A Ğ M I L L I N G P R O J E C T , T U R K E Y
T E C H N I C A L R E P O R T
2018 Final Report Page 13-3
13 .4 FL O T AT I O N TE S T W O R K Flotation testwork was completed by Bureau Veritas in Richmond, British Columbia on major ore types to determine if this would be a potentially viable alternative processing option. Bulk sulphide flotation conditions were used to maximize gold recovery. In terms of gold recovery, flotation results were obtained as shown in Figure 13-1, which presents the results of four rougher tests completed under identical conditions at a grind size 80% passing 75 µm.
Figure 13-1: Gold Recovery by Flotation of Various Ore Samples
The bulk sulphide flotations conditions were successful in producing a gold concentrate but only with significant mass pulls and high sulphur recoveries. This material is still relatively low grade and is not saleable as a concentrate at this time. When this material is leached, similar recoveries are expected to those achieved with whole ore leaching. Therefore, while the flotation option would reduce the amount of material that needs leaching, the overall recovery achieved would be significantly lower. Based on this, producing a flotation concentrate as a process option was discarded.
Typically gold-bearing pyrite concentrates would be reground ahead of cyanidation, or toll treated in a smelter if gold grade is attractive. Additionally, concentrate mass pull to achieve gold recoveries above 70% would likely be economically prohibitive to process for regrind milling equipment,

K I Ş L A D A Ğ M I L L I N G P R O J E C T , T U R K E Y
T E C H N I C A L R E P O R T
2018 Final Report Page 13-4
because the 30% mass pull for Kişladağ mill would require a very high throughput of 500 t/h. Further cleaner testwork would also need to be conducted to confirm the recovery losses expected in order to target a lower mass pull to leaching.
Based on these investigations and that gold recovery from cyanide leach of the concentrate is likely similar to those observed in the whole ore cyanide leach, it was concluded that there would be no advantage of including flotation in the process flowsheet.
13 .5 CY AN I D AT I O N TE S T W O R K To support the whole ore cyanide leach-carbon-in-pulp (CIP) process development, a large number of cyanidation tests were completed in three batches of ore samples from five major ore types, most commonly at grind size of 80% passing 75 µm and 100 µm and a retention time of 48 hours. The number of ores samples was 15 for the first batch, 104 for the second batch and 15 for the third batch. The focus was to investigate the amenability of various ore samples in response to conventional cyanide leach-CIP / carbon-in-leach (CIL) under a variety of operating conditions, such as cyanide concentration, grind size, and CIP versus CIL, totaling 195 cyanide leach tests. Each cyanide leach tests considered 32 hours of cyanide leach and 16 hours of carbon-in-pulp. Kinetic samples were taken after 2, 4, 8, 24 and 32 hours for gold assay.
In the first batch of testwork on cyanide concentration, most ore samples responded positively to an increase in cyanide concentration to leach, in a range of approximately 2.0% recovery improvement between 0.25 and 1.00 g/L NaCN. This suggests that relatively high cyanide concentration in conjunction with a cyanide recovery thickener after CIP may positively benefit the processing economics. Compared with CIL, CIP has the advantages of lower cyanide consumption, smaller carbon inventory, less carbon attrition loss and improved gold loading on carbon
With respect to grind size, most ore samples responded positively to finer grind sizes, in the range of approximately 5.0% recovery improvement between 80% passing 150 µm and 50 µm, however finer grind sizes often require a larger thickener, increased filtration area, as well as larger grinding mills, therefore 80% passing 75 µm grind size was taken as a design basis.
The second batch of testwork used 104 ore samples from the five major alterations (ore types) in deeper levels of the deposit. The focus was to investigate amenability of current and future ore in response to conventional cyanide leach and CIP at grind size of 80% passing 75 and 100 µm, cyanide concentration of 0.5 g/L NaCN, pulp density of 40% solid and 48 hours of retention time. A total of 156 cyanide leach tests were completed.
The third batch of testwork used 15 ore samples representing the five major ore types collected from material deeper in the deposit. The focus was also to investigate amenability in response to conventional cyanide leach and CIP at grind size of 80% passing 75 and 100 µm, cyanide concentration of 0.5 g/L NaCN, 48 hours of retention time and pulp density of 40% solid, totaling 31 cyanide leach tests.

K I Ş L A D A Ğ M I L L I N G P R O J E C T , T U R K E Y
T E C H N I C A L R E P O R T
2018 Final Report Page 13-5
13 .6 G O L D /S I L V E R AD S O R P T I O N O N AC T I V AT E D C AR B O N To determine gold and silver loadings required for downstream carbon processing design, gold/silver loading isotherm on activated carbon was completed using the pregnant solution from several large cyanide leach tests using Kişladağ materials were used. The pregnant solution contained 0.43 ppm of Au, 0.30 ppm of Ag, and 25 ppm of Cu.
The pregnant solution was split into nine portions and each portion was mixed for 72 hours with a known mass of carbon to a targeted gold loading capacity. The results for these nine adsorption tests are displayed in Figure 13-2, whereby the maximum carbon loadings observed were approximately 1,800 g/t of Au and 600 g/t of Ag.
Figure 13-2: Gold/Silver Carbon Loading Isotherms
Furthermore, eight bulk cyanide leach tests were completed at grind size of 80% passing 75 and 100 µm for four major ore types to provide materials for a variety of testwork, including cyanide detoxification, tailing geochemistry, tailing filtration and tailing geotechnical characteristics. During these bulk cyanide leach tests presented in Figure 13-3, activated carbon was added after 48 hours to observe whether gold recovery would be improved. The sharp rise in gold recovery after activated

K I Ş L A D A Ğ M I L L I N G P R O J E C T , T U R K E Y
T E C H N I C A L R E P O R T
2018 Final Report Page 13-6
carbon was added suggested that these ore samples were preg-borrowing, particularly for WMT ore type.
Note: activated carbon was added after 48 hours
Figure 13-3: Gold Extraction of Various Ore Types
13 .7 P R E L I M I N AR Y C Y AN I D E D E T O X I F I C AT I O N To determine correct reagent additions required for downstream cyanide detoxification circuit design, preliminary batch cyanide destruction tests were performed on four major ore types with two grind sizes, each using the standard SO2/Air method. The tailing slurries came from previous large batch cyanide leach tests. These preliminary batch cyanide destruction tests were carried out in a 23 L reactor for a duration of 3.0 hours.
The cyanide destruction results are summarized in Table 13-2, and demonstrate that for design purpose, the SO2 g/g CNWAD addition ratio of 4.0 - 6.0 works well for the Kişladağ ore and can result in final tail cyanide concentration of < 1.0 ppm CNWAD in 3.0 hours of retention time. The legal limit of cyanide for Kisladag is 10 ppm CNWAD.
K I Ş L A D A Ğ M I L L I N G P R O J E C T , T U R K E Y
T E C H N I C A L R E P O R T
2018 Final Report Page 13-7
Table 13-2: Batch Cyanide Detoxification Testwork of Various Ore Samples
Alteration Particle Size 80% Passing
Reagent Usage Cyanide
SO2 Na2S2O5 CuSO4. 5H2O Ca(OH)2 Feed Effluent (µm) (g/g CNT) (ppm CNWAD)
ARG 75 4.2 6.3 2.7 1.9 32.5 0.2
100 3.3 4.8 2.9 0.9 19.0 0.3
INT3 75 3.5 5.2 2.2 3.1 27.5 0.1
100 1.8 2.7 1.7 0.6 12.5 <0.1
POT 75 4.7 7.0 2.2 3.8 43.7 <0.1
100 4.6 6.8 2.2 3.6 57.5 <0.1
WMT 75 2.1 3.1 2.9 2.2 21.0 0.5
100 2.4 3.6 2.0 1.8 29.0 0.3
13 .8 TH I C K E N I N G TE S T W O R K Solids liquid separation tests were completed by Pocock Industrial for one composite material (consisting of 55% POT + 15% ARG + 15% WMT + 10% FRB + 5% INT3) at grind sizes of 80% passing 75 µm for leach feed slurry, CIP tailing and detoxified CIP tailing. In total, there were three sets of thickening tests along with rheology/viscosity measurements. For future plant operations, overflow from CIP tailing thickener will be used to dilute cyclone overflow after thickening, and thus a portion of cyanide is recovered and re-used. Thickener sizing was based on 2.47 t/m3 solid specific gravity and 1,596 tph mill throughput.
Table 13-3: Thickening Testwork Data and Thickener Sizing
Material Sizing Principle
Thickener Feed Pulp
Density Volumetric
Loading Solid
Loading Thickener Diameter
Thickener Underflow
(% Solid) ((m3/h)/m2) ((t/h)/m2) (m) (% Solid)
Cyanide Leach Feed
Conservative 19.3 2.34 0.51 63.1 45-58
Moderately Aggressive 19.3 3.17 0.69 54.2
CIP Tailing Conservative 18.1 2.32 0.47 65.8
53-60 Moderately Aggressive 18.1 3.27 0.66 55.4
Detoxed CIP Tailing
Conservative 18.2 2.31 0.47 65.6 53-59
Moderately Aggressive 18.2 3.24 0.66 55.4
13 .9 DE T O X E D CIP TAI L I N G F I L T R AT I O N Pressure filtration testwork was completed on four major ore types (POT, ARG, WMT and INT3) as well as one blended composite (50% POT + 25% ARG + 25% WMT) at grind sizes of 80% passing 75 and 100 µm. These tailing samples were sent to a major filtration equipment supplier (Aqseptence in Italy) with the intention to generate the required filtration requirement data including cycle time,
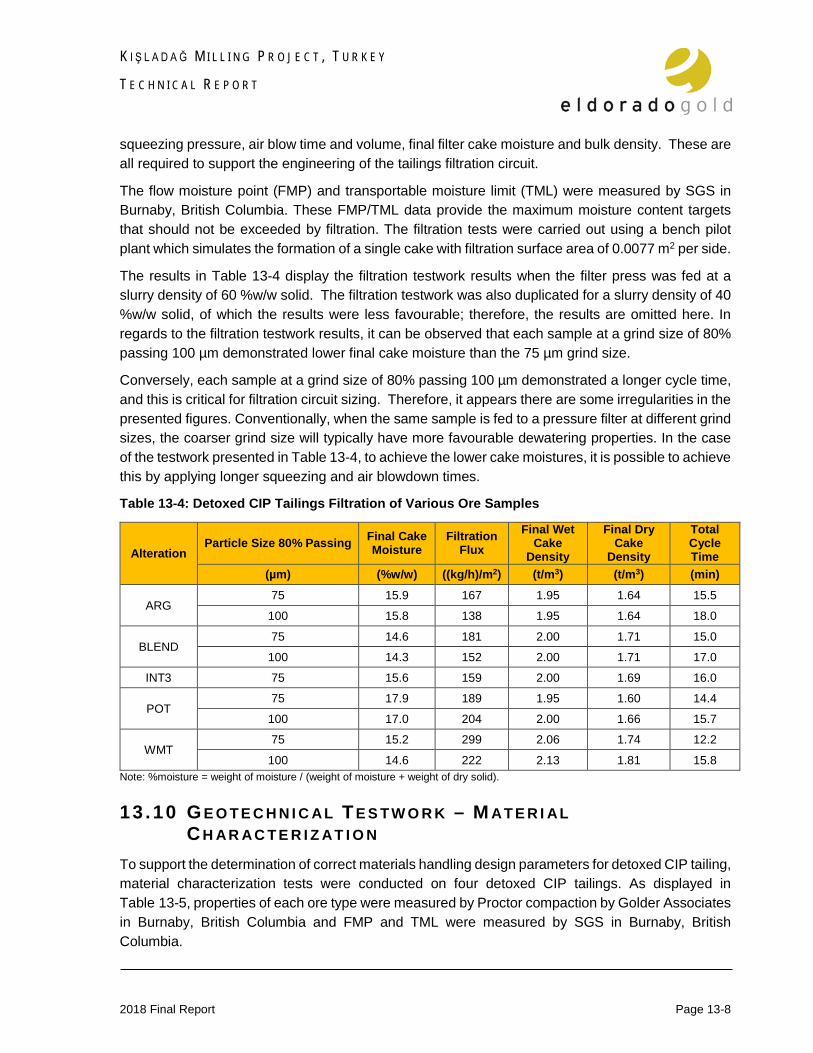
K I Ş L A D A Ğ M I L L I N G P R O J E C T , T U R K E Y
T E C H N I C A L R E P O R T
2018 Final Report Page 13-8
squeezing pressure, air blow time and volume, final filter cake moisture and bulk density. These are all required to support the engineering of the tailings filtration circuit.
The flow moisture point (FMP) and transportable moisture limit (TML) were measured by SGS in Burnaby, British Columbia. These FMP/TML data provide the maximum moisture content targets that should not be exceeded by filtration. The filtration tests were carried out using a bench pilot plant which simulates the formation of a single cake with filtration surface area of 0.0077 m2 per side.
The results in Table 13-4 display the filtration testwork results when the filter press was fed at a slurry density of 60 %w/w solid. The filtration testwork was also duplicated for a slurry density of 40 %w/w solid, of which the results were less favourable; therefore, the results are omitted here. In regards to the filtration testwork results, it can be observed that each sample at a grind size of 80% passing 100 µm demonstrated lower final cake moisture than the 75 µm grind size.
Conversely, each sample at a grind size of 80% passing 100 µm demonstrated a longer cycle time, and this is critical for filtration circuit sizing. Therefore, it appears there are some irregularities in the presented figures. Conventionally, when the same sample is fed to a pressure filter at different grind sizes, the coarser grind size will typically have more favourable dewatering properties. In the case of the testwork presented in Table 13-4, to achieve the lower cake moistures, it is possible to achieve this by applying longer squeezing and air blowdown times.
Table 13-4: Detoxed CIP Tailings Filtration of Various Ore Samples
Alteration Particle Size 80% Passing Final Cake
Moisture Filtration
Flux Final Wet
Cake Density
Final Dry Cake
Density
Total Cycle Time
(µm) (%w/w) ((kg/h)/m2) (t/m3) (t/m3) (min)
ARG 75 15.9 167 1.95 1.64 15.5
100 15.8 138 1.95 1.64 18.0
BLEND 75 14.6 181 2.00 1.71 15.0
100 14.3 152 2.00 1.71 17.0
INT3 75 15.6 159 2.00 1.69 16.0
POT 75 17.9 189 1.95 1.60 14.4
100 17.0 204 2.00 1.66 15.7
WMT 75 15.2 299 2.06 1.74 12.2
100 14.6 222 2.13 1.81 15.8 Note: %moisture = weight of moisture / (weight of moisture + weight of dry solid).
13 .10 G E O T E C H N I C AL TE S T W O R K – M AT E R I AL C H AR AC T E R I Z AT I O N
To support the determination of correct materials handling design parameters for detoxed CIP tailing, material characterization tests were conducted on four detoxed CIP tailings. As displayed in Table 13-5, properties of each ore type were measured by Proctor compaction by Golder Associates in Burnaby, British Columbia and FMP and TML were measured by SGS in Burnaby, British Columbia.

K I Ş L A D A Ğ M I L L I N G P R O J E C T , T U R K E Y
T E C H N I C A L R E P O R T
2018 Final Report Page 13-9
Material characteristics measurements showed solids specific gravity of 2.70 to 2.82 t/m³ and an estimated maximum bulk solid density between 1.76 and 1.92 t/m³. The flow moisture point was observed and calculated to be 13.8 to 17.1% w/w with the corresponding transportable moisture limit of 12.4 to 15.4% w/w, both of which are defined as the (weight of moisture)/(weight of moisture + weight of dry solid). As Proctor moisture contents are typical defined in the geotechnical relationship of weight of moisture/weight of dry solid (w/w), the converted metallurgical basis has also been displayed in Table 13-5.
Table 13-5: Flow Properties of Various Ore Types
Alteration
Particle Size 80% Passing
Flow Moisture
Point (FMP)
Transportable Moisture Limit
(TML)
Proctor Optimal Moisture Content
Proctor Optimal
Bulk Density
Solids Specific Gravity Metallurgical Geotechnical
(µm) (%w/w) (%w/w) (%w/w) (%w/w) (t/m³) (t/m³)
ARG 75 17.1 15.4 13.8 16.0 1.76 2.71
100 16.3 14.7 13.8 16.0 1.80 2.72
INT3 75 16.6 14.9 N/A N/A N/A N/A
100 15.7 14.1 N/A N/A N/A N/A
POT 100 15.5 13.9 12.1 13.7 1.79 2.70
WMT 75 14.4 13.0 13.0 15.0 1.84 2.82
100 13.8 12.4 12.2 13.9 1.92 2.78 Note: %moisture = (weight of moisture) / (weight of moisture + weight of dry solid) Proctor optimal moisture is defined as (weight of moisture) / (weight of dry solid)
13 .11 FU T U R E TE S T W O R K Based on the testwork completed to date and the work currently underway, further work is recommended to improve the understanding of the metallurgical response and performance of Kişladağ ore. The following items are recommended for further investigation:
13.11.1 Leaching Variability
• Two grind sizes (80% passing 75 and 100 µm) of each major ore type will be prepared feeding further large scale batch leaching tests.
• Further testwork will also be conducted on the typical mill feed blend to observe and leaching and gold adsorption recoveries on blended materials consisting of 55% POT + 15% ARG + 15% WMT + 10% FRB + 5% INT3 at grind sizes of 80% passing 75 and 100 µm.
13.11.2 Pressure Filtration
• The leach residue from the leaching variability tests will then be accumulated and used for downstream filtration work for the blended materials (55% POT + 15% ARG + 15% WMT/Tourmaline + 10% FRB + 5% INT3) at grind sizes of 80% passing 75 and 100 µm.

K I Ş L A D A Ğ M I L L I N G P R O J E C T , T U R K E Y
T E C H N I C A L R E P O R T
2018 Final Report Page 13-10
13.11.3 Tailings Handling
• Further materials handling testwork will be performed by an independent laboratory, to define flow properties such as cohesive strength, bulk density, incline testing, and compressibility tests to support the appropriate dry tailings materials handling design.
K I Ş L A D A Ğ M I L L I N G P R O J E C T , T U R K E Y
T E C H N I C A L R E P O R T
2018 Final Report Page 14-1
SECTION • 14 M IN ER AL RESO URCE EST IM ATE S The mineral resource estimates for the Kışladağ mine were calculated under the direction of Dr. Stephen Juras, P.Geo. The estimates were made from a 3D block model utilizing commercial mine planning software. Projects limits, in UTM coordinates, are 686295 to 688655 East, 4260615 to 4262955 North, and 0 to +1110 m elevation. Block model cell size was 20 m east x 20 m north x 10 m high.
14 .1 G E O L O G I C M O D E L S Eldorado used significant new data from the mining and the 2014-16 drilling campaign to update the geologic model described in the previous technical report (Technical Report, Eldorado, 2010). The resource and reserve work incorporated new lithology and alteration models, all constructed in 3D in Leapfrog Geo software. Generally, there were no significant changes to the principal gold-hosting unit, Intrusion #1. The basement Schist unit was slightly enlarged in the West, South and South East directions. Intrusion #2 was modeled as a single entity while the contact between Intrusion #3 and Intrusion #1 became more irregular.
To constrain gold grade interpolation for the Kışladağ deposit, 3D mineralized envelopes, or shells were created. These were based on initial outlines derived by a method of probability assisted constrained kriging (PACK). The threshold value of 0.20 g/t Au was determined by inspection of histograms and probability curves as well as by indicator variography. Shell outline selection was done by inspecting contoured probability values. These shapes were then edited on plan and section views to be consistent with the lithology model and drill assay data so that the boundaries did not violate data and current geologic understanding of mineralization controls. Figure 14-1 shows the relationship between the PACK or mineralized shell and the lithology units.
All generated 3D shapes were checked for spatial and geological consistency on cross-section and plan views and were found to have been properly constructed. The shapes honoured the drill data and appear well constructed.
14 .2 D AT A AN AL Y S I S The lithologic and mineralized domains were reviewed to determine appropriate estimation or grade interpolation parameters. Several different procedures were applied to the data to discover whether statistically distinct domains could be defined using the available geological objects. The lithology categories were investigated within and outside the mineralized shell.

K I Ş L A D A Ğ M I L L I N G P R O J E C T , T U R K E Y
T E C H N I C A L R E P O R T
2018 Final Report Page 14-2
Figure 14-1: Relationship between the PACK or Mineralized Shell and Lithology Units
Descriptive statistics, histograms and cumulative probability plots, box plots and contact plots have been completed for gold assay data. The results were used to guide the construction of the block model and the development of estimation plans. These analyses were conducted on 5 m downhole composites of the assay data. The statistical properties from this analysis are summarized in Table 14-1.
14.2.1 Estimation Domains Gold grades are highest and most prevalent in Intrusion #1. Younger units, Intrusions #2 and #2A, are also mineralized but at more uniform lower values with means of 0.58 and 0.50 respectively. Intrusion #3 and the pyroclastic rock unit generally contain weak to no gold mineralization. Gold mineralization above background levels within these two units occurs along the contact area with Intrusion #1. Generally, the coefficient of variance (CV) values of all units are relatively low reflecting the porphyry style mineralization of the deposit.
Z
Intrusion #1
#2A
#3

K I Ş L A D A Ğ M I L L I N G P R O J E C T , T U R K E Y
T E C H N I C A L R E P O R T
2018 Final Report Page 14-3
Table 14-1: Kişladağ Deposit Statistics for 5 m Composites – Au g/t Data
Lithology Mean CV Q25 Q50 Q75 Max No. of Comps
Within PACK Shell
Intrusion #1 0.90 0.88 0.43 0.66 1.08 20.30 14,080
Intrusion #2 0.58 0.67 0.33 0.50 0.72 4.91 1,983
Intrusion #2A 0.50 0.65 0.29 0.43 0.61 4.79 1,681
Intrusion #3 0.42 0.85 0.23 0.33 0.50 4.42 1,931
Pyroclastics 0.37 0.84 0.21 0.29 0.43 9.20 3,394
Schist 0.40 0.77 0.24 0.32 0.45 3.13 999
Outside PACK Shell
Intrusion #1 0.15 1.02 0.08 0.12 0.16 1.41 511
Intrusion #2 0.18 1.28 0.09 0.13 0.17 1.50 95
Intrusion #2A 0.13 0.64 0.07 0.12 0.16 0.48 109
Intrusion #3 0.11 0.75 0.06 0.09 0.14 1.08 1,654
Pyroclastics 0.07 1.24 0.01 0.04 0.11 1.56 926
Schist 0.05 1.53 0.01 0.01 0.07 2.27 12,825
14 .3 E V AL U A T I O N O F E X T R E M E G R AD E S Extreme grades were examined for gold, mainly by histograms and cumulative probability plots. Generally, the distributions do not indicate a problem with extreme grades for gold. Less densely drilled areas of the deposit required the use of outlier-restricted grades to prevent the possibility of grade smearing. This is described in the estimation section below.
14 .4 V AR I O G R AP H Y Variography, a continuation of data analysis, is the study of the spatial variability of an attribute. Eldorado prefers to use a correlogram, rather than the traditional variogram, because it is less sensitive to outliers and is normalized to the variance of data used for a given lag. Correlograms were calculated for gold in the mineralization shell. Variogram model parameters and orientation data of rotated variogram axes are shown in Table 14-2 and Table 14-3.
14 .5 M O D E L S E T U P The block size for the Kişladağ model was selected based on mining selectivity considerations (open pit mining). It was assumed the smallest block size that could be selectively mined as ore or waste, referred to the selective mining unit (SMU), was approximately 20 m x 20 m x 10 m. In this case, the SMU grade-tonnage curves predicted by the restricted estimation process adequately represented the likely actual grade-tonnage distribution.
The assays were composited into 5 m fixed-length down-hole composites. The composite data were back-tagged by the mineralized shell and lithology units (on a majority code basis). The compositing process and subsequent back-tagging was reviewed and found to have performed as expected.

K I Ş L A D A Ğ M I L L I N G P R O J E C T , T U R K E Y
T E C H N I C A L R E P O R T
2018 Final Report Page 14-4
Bulk density data were assigned to a unique assay database file. These data were composited into 10 m fixed-length down-hole values. This compositing honoured the lithology domains by breaking the composites on the domain code values.
Various coding was done on the block model in preparation for grade interpolation. The block model was coded according to lithologic domain and mineralized shell (on a majority code basis). Percent below topography was also calculated into the model blocks.
A near surface oxidation of sulphide minerals has occurred at Kişladağ. Since leaching recoveries differ between the oxidized and primary mineralized rock, the boundary needs to be known for reserve conversion work. This model used an interpreted oxide surface. Since the start of production, the oxide – primary boundary has been defined through modeled total sulfur (S) % and cobalt (Co) ppm. The abundance of the latter element was found to be sensitive to the destruction of pyrite thus correlative to identifying oxidized areas. Modeled Co values also helped to distinguish between S values due to sulphide (i.e., pyrite) and S concentrations due to sulphates (alunite and barite).
14 .6 E S T I M AT I O N Grade modelling consisted of interpolation by ordinary kriging (OK) for all domains inside the mineralized shell and inverse distance weighting to the second power (ID2) for background model blocks. Nearest-neighbor (NN) grades were also interpolated for validation purposes. Blocks and composites were matched on estimation domain.
The search ellipsoids were oriented preferentially to the orientation of the respective domain as defined by the attitude of the gold grade shell and structures defined in the spatial analysis. Searches had 95 to 500 m ranges for the estimation domains. Block discretization was 4 m x 4 m x 2 m.
A two-pass approach was instituted for interpolation. The first pass required a grade estimate to include composites from a minimum of two holes from the same estimation domain, whereas the second pass allowed a single hole to place a grade estimate in any uninterpolated block from the first pass. This approach was used to enable most blocks to receive a grade estimate within the domains, including the background domains. Blocks received a minimum of 2 to 3 and maximum of 3 to 4 composites from a single drill hole (for the two-hole minimum pass). Maximum composite limit ranged from 9 to 12.
These parameters were based on the geological interpretation, data analyses, and correlogram analyses. The number of composites used in estimating grade into a model block followed a strategy that matched composite values and model blocks sharing the same ore code or domain. The minimum and maximum number of composites were adjusted to incorporate an appropriate amount of grade smoothing. This was done by change-of-support analysis (Discrete Gaussian or Hermitian polynomial change-of-support method), as described in the validation section below.

K I Ş L A D A Ğ M I L L I N G P R O J E C T , T U R K E Y
T E C H N I C A L R E P O R T
2018 Final Report Page 14-5
Table 14-2: Au Correlogram Parameters for Kişladağ Deposit
Model Nugget Sills Rotation Angles Ranges Co C1 C2 Z1 X1' Y1'' Z2 X2' Y2” Z1 X1' Y1'' Z2 X2' Y2''
Inside the PACK Shell SPH 0.25 0.377 0.373 -59 5 46 38 19 -11 39 73 37 713 187 248 Models are spherical (SPH). The first rotation is about Z, left hand rule is positive; the second rotation is about X', right hand rule is positive; the third rotation is about Y", left hand rule is positive.
Table 14-3: Azimuth and Dip Angles of Rotated Correlogram Axes, Kişladağ Deposit
Axis Azimuth Axis Dip Z1 X1 Y1 Z2 X2 Y2 Z1 X1 Y1 Z2 X2 Y2
Inside the PACK Shell 206 301 36 187 124 38 44 46 5 68 -10 19
Azimuths are in degrees. Dips are positive up and negative down.
K I Ş L A D A Ğ M I L L I N G P R O J E C T , T U R K E Y
T E C H N I C A L R E P O R T
2018 Final Report Page 14-6
In all domains, an outlier restriction was used to control the effects of high-grade composites in local areas of less dense drilling, particularly in background domains and poorly mineralized units (e.g., Intrusion #3). The restricted distance was 50 m meaning that beyond this distance from a model block center, composites exceeding the outlier values are not used in estimation. The threshold grades were generally set close to the threshold grade of the PACK shell in the case of the background domains or through inspection of the cumulative probability plots for the mineralized units. Mineralized domains in Intrusion #1, #2 and #2A and Pyroclastics used an outlier restricted grade limit of 7.0 g/t Au, whereas mineralized Intrusion #3 unit used an outlier limit equal to 1 g/t Au. All background domains used a 0.5 g/t Au outlier restricted grade except for Intrusion #3 and Schist, where the outlier grade equaled 0.3 g/t Au and 1 g/t Au respectively.
Bulk density values were estimated into the resource model by an averaging of 10 m composites of individual density measurements that were carried out on each assay interval. A maximum of six and minimum of two 10 m composites were used for the averaging. A rectangular search was used, measuring 200 m north x 125 m east x 50 m elevation. In the event a block was not estimated, default density values were assigned based on lithology and oxidation code.
14 .7 M O D E L L I N G O F G O L D R E C O V E R Y F R O M B O T T L E R O L L D AT A
Values for bottle roll (BR) recovery of gold were interpolated in a three-step process using Leapfrog Geo software as follows:
• BR gold recovery data were used to create a 3-D interpolation in Leapfrog; all blocks in the block model were ‘evaluated’, or assigned an estimated gold recovery, using the interpolated values from this Leapfrog model.
• A subset of these samples was also analyzed using the CIP bottle roll recovery technique; the differences between the original BR recoveries and the CIP recoveries were interpolated in 3-D using Leapfrog and this model was again used to assign a ‘difference factor’ to each block in the resource model (the difference factor can be positive or negative).
• Outside of Leapfrog, the difference factor value was simply added to the original bottle roll recovery value for the same block, yielding an ‘adjusted bottle roll recovery’ value for each block in the model. These adjusted recovery values are assumed to better reflect the expected recoveries in a tank leach process.
Data from 519 BR analyses were used in the modelling. Of these, 419 were composite samples taken from multiple drillhole intercepts, often from multiple drillholes. The remaining 100 BR analyses were from single, 2.5 meter-long drillcore samples. As such, a total of 5458 individual drillcore intercepts were included in all the BR analyses.
3-D modelling of the bottle roll data used Seequent’s (formerly Aranz Geo’s) Leapfrog Geo (version 4.2) software. Leapfrog Geo is an implicit modelling package that utilizes their Fast Radial Basis Function (FastRBF™) algorithms for rapid data interpolation. In this case, the bottle roll data was

K I Ş L A D A Ğ M I L L I N G P R O J E C T , T U R K E Y
T E C H N I C A L R E P O R T
2018 Final Report Page 14-7
modelled using a spheroidal interpolation model with a base range of 250 meters and an isotropic trend (i.e. no directional weighting).
14 .8 V AL I D AT I O N
14.8.1 Visual Inspection Eldorado completed a detailed visual validation of the Kişladağ resource model. The model was checked for proper coding of drillhole intervals and block model cells, in both cross-section and plan views. Coding was found to be accurate. Grade and gold recovery interpolation was examined relative to drill hole composite values by inspecting cross-sections and plans. The checks showed good agreement between drill hole composite values and model cell values. The hard boundaries appear to have constrained grades to their respective estimation domains. The addition of the outlier restriction values succeeded in minimizing grade smearing in regions of sparse data and, in general, all background domains. Examples of representative sections and plans containing block model grades, drill hole composite values, and domain outlines are shown in Figure 14-2 to Figure 14-4.
Figure 14-2: West – East Cross Section 4261400 N of Kişladağ modeled Gold Grades (g/t).
Measured+Indicated Blocks are Full Size; Inferred Cells are the smaller Set

K I Ş L A D A Ğ M I L L I N G P R O J E C T , T U R K E Y
T E C H N I C A L R E P O R T
2018 Final Report Page 14-8
Figure 14-3: Plan view of Kişladağ modeled gold grades (g/t), 750 m Plan. Measured+Indicated Blocks are Full Size; Inferred Cells are the smaller Set
Figure 14-4: West – East Cross Section 4261400 N of Kişladağ Modeled Mill Recovery Values (%). Measured+Indicated Blocks are Full Size; Inferred Cells are the smaller Set
K I Ş L A D A Ğ M I L L I N G P R O J E C T , T U R K E Y
T E C H N I C A L R E P O R T
2018 Final Report Page 14-9
14.8.2 Model Check for Change-of-Support An independent check on the smoothing in the grade estimates was made using the Discrete Gaussian or Hermitian polynomial change-of-support method. This method uses the “declustered” distribution of composite grades from a NN or polygonal model to predict the distribution of grades in blocks. The histogram for the blocks is derived from two calculations:
• The block-to-block or between-block variance • The frequency distribution for the composite grades transformed by means of Hermite
polynomials (Herco) into a less skewed distribution with the same mean as the declustered grade distribution and with the block-to-block variance of the grades.
The distribution of hypothetical block grades derived by the Herco method is then compared to the estimated grade distribution to be validated by means of grade-tonnage curves.
The distribution of calculated 20 m x 20 m x 10 m block grades for gold in the mineralized domain is shown with dashed lines on the grade-tonnage curves in Figure 14-5. This is the distribution of grades obtained from the change-of-support models. The continuous lines in the figures show the grade-tonnage distribution obtained from the block estimates. The grade-tonnage predictions produced for the model show that grade and tonnage estimates are validated by the change-of-support calculations over the range of mining grade cutoff values (0.3 g/t to 0.5 g/t Au).
14.8.3 Model Checks for Bias The block model estimates were checked for global bias by comparing the average metal grades (with no cutoff) from the model with means from NN estimates. The NN estimator declusters the data and produces a theoretically unbiased estimate of the average value when no cutoff grade is imposed and is a good basis for checking the performance of different estimation methods. Results, summarized in Table 14-4, show no global bias in the estimates.
The model was also checked for local trends in the grade estimates by grade slice or swath checks. This was done by plotting the mean values from the NN estimate versus the kriged results for benches (in 5 m swaths) and for northings and eastings (both in 20 m swaths). The kriged estimate should be smoother than the NN estimate, thus the NN estimate should fluctuate around the kriged estimate on the plots. The observed trends behave as predicted and show no significant trends of gold in the estimates in Kişladağ model.

K I Ş L A D A Ğ M I L L I N G P R O J E C T , T U R K E Y
T E C H N I C A L R E P O R T
2018 Final Report Page 14-10
Figure 14-5: Herco Plots for Mineralization Shell
Table 14-4: Global Model Mean Gold Values by Mineralized Shell Domain
Domain NN Estimate Kriged Estimate Difference (%)
Intrusion #1 0.69 0.69 0.0
Intrusion #2 0.55 0.56 -1.6
Intrusion #2A 0.52 0.50 3.3
Pyroclastics 0.16 0.15 10.5
Intrusion #3 0.33 0.34 -3.6
Schist 0.34 0.34 0.6
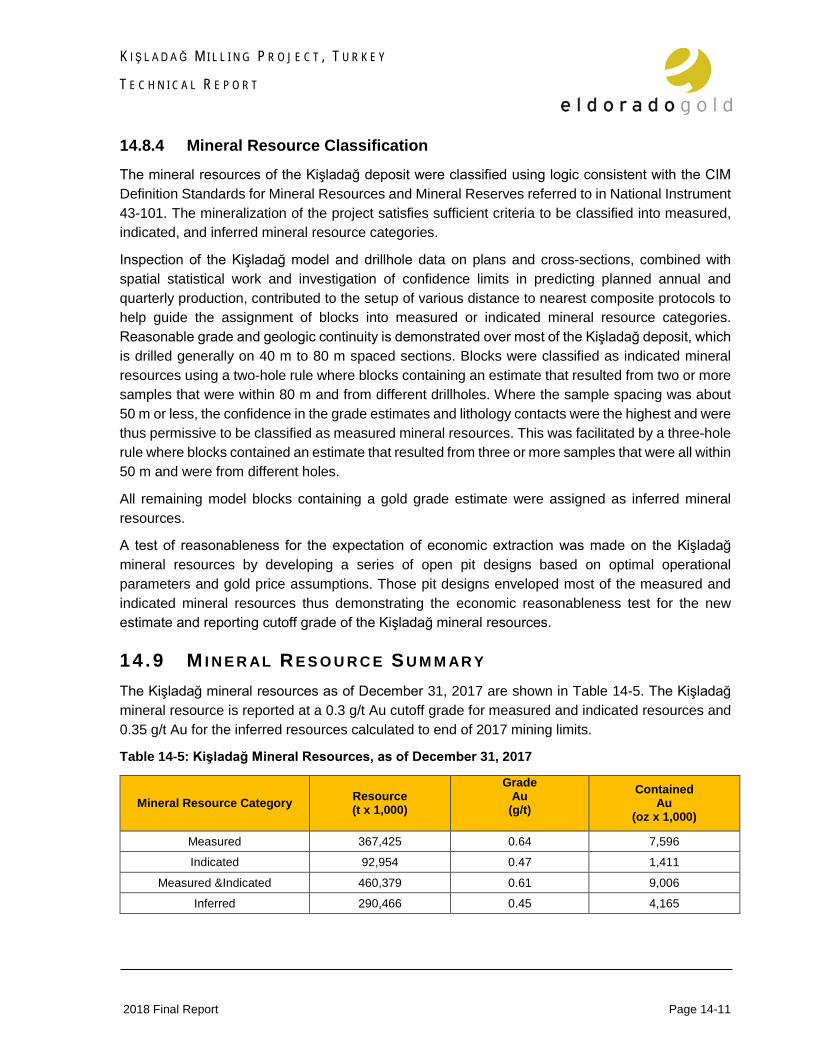
K I Ş L A D A Ğ M I L L I N G P R O J E C T , T U R K E Y
T E C H N I C A L R E P O R T
2018 Final Report Page 14-11
14.8.4 Mineral Resource Classification The mineral resources of the Kişladağ deposit were classified using logic consistent with the CIM Definition Standards for Mineral Resources and Mineral Reserves referred to in National Instrument 43-101. The mineralization of the project satisfies sufficient criteria to be classified into measured, indicated, and inferred mineral resource categories.
Inspection of the Kişladağ model and drillhole data on plans and cross-sections, combined with spatial statistical work and investigation of confidence limits in predicting planned annual and quarterly production, contributed to the setup of various distance to nearest composite protocols to help guide the assignment of blocks into measured or indicated mineral resource categories. Reasonable grade and geologic continuity is demonstrated over most of the Kişladağ deposit, which is drilled generally on 40 m to 80 m spaced sections. Blocks were classified as indicated mineral resources using a two-hole rule where blocks containing an estimate that resulted from two or more samples that were within 80 m and from different drillholes. Where the sample spacing was about 50 m or less, the confidence in the grade estimates and lithology contacts were the highest and were thus permissive to be classified as measured mineral resources. This was facilitated by a three-hole rule where blocks contained an estimate that resulted from three or more samples that were all within 50 m and were from different holes.
All remaining model blocks containing a gold grade estimate were assigned as inferred mineral resources.
A test of reasonableness for the expectation of economic extraction was made on the Kişladağ mineral resources by developing a series of open pit designs based on optimal operational parameters and gold price assumptions. Those pit designs enveloped most of the measured and indicated mineral resources thus demonstrating the economic reasonableness test for the new estimate and reporting cutoff grade of the Kişladağ mineral resources.
14 .9 M I N E R AL R E S O U R C E S U M M AR Y The Kişladağ mineral resources as of December 31, 2017 are shown in Table 14-5. The Kişladağ mineral resource is reported at a 0.3 g/t Au cutoff grade for measured and indicated resources and 0.35 g/t Au for the inferred resources calculated to end of 2017 mining limits.
Table 14-5: Kişladağ Mineral Resources, as of December 31, 2017
Mineral Resource Category Resource (t x 1,000)
Grade Au
(g/t)
Contained Au
(oz x 1,000)
Measured 367,425 0.64 7,596
Indicated 92,954 0.47 1,411
Measured &Indicated 460,379 0.61 9,006
Inferred 290,466 0.45 4,165
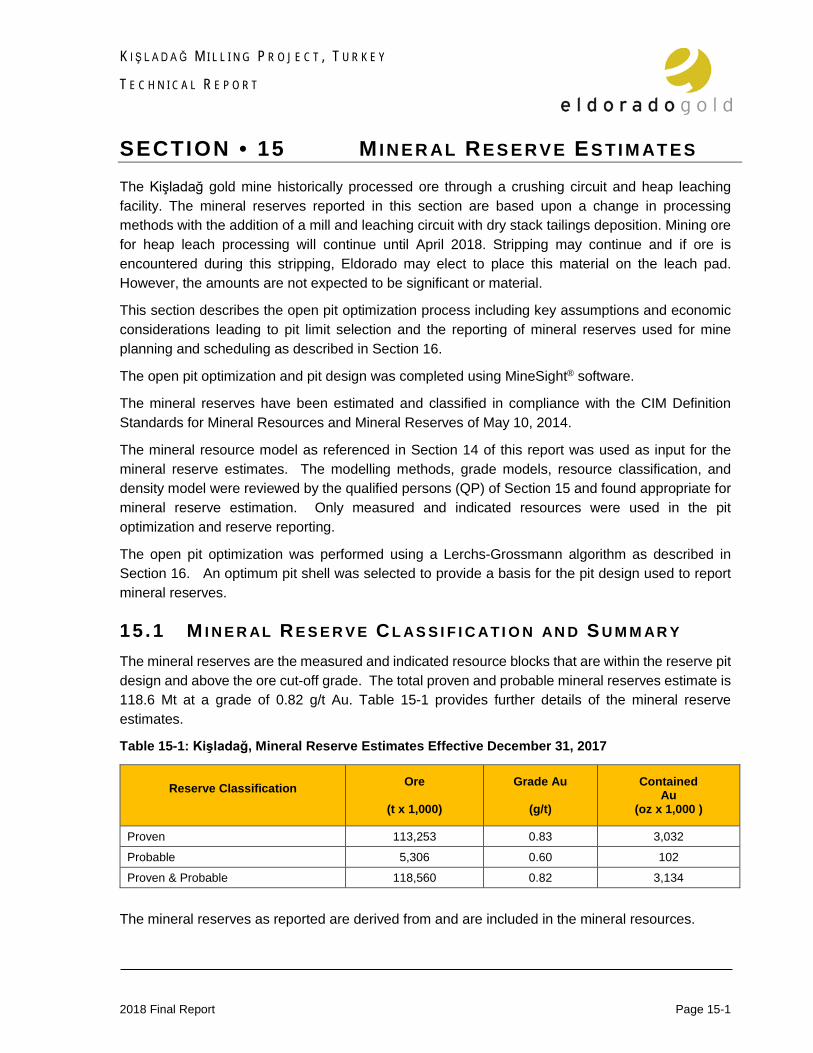
K I Ş L A D A Ğ M I L L I N G P R O J E C T , T U R K E Y
T E C H N I C A L R E P O R T
2018 Final Report Page 15-1
SECTION • 15 MINER AL RES ERVE ES T IM AT ES The Kişladağ gold mine historically processed ore through a crushing circuit and heap leaching facility. The mineral reserves reported in this section are based upon a change in processing methods with the addition of a mill and leaching circuit with dry stack tailings deposition. Mining ore for heap leach processing will continue until April 2018. Stripping may continue and if ore is encountered during this stripping, Eldorado may elect to place this material on the leach pad. However, the amounts are not expected to be significant or material.
This section describes the open pit optimization process including key assumptions and economic considerations leading to pit limit selection and the reporting of mineral reserves used for mine planning and scheduling as described in Section 16.
The open pit optimization and pit design was completed using MineSight® software.
The mineral reserves have been estimated and classified in compliance with the CIM Definition Standards for Mineral Resources and Mineral Reserves of May 10, 2014.
The mineral resource model as referenced in Section 14 of this report was used as input for the mineral reserve estimates. The modelling methods, grade models, resource classification, and density model were reviewed by the qualified persons (QP) of Section 15 and found appropriate for mineral reserve estimation. Only measured and indicated resources were used in the pit optimization and reserve reporting.
The open pit optimization was performed using a Lerchs-Grossmann algorithm as described in Section 16. An optimum pit shell was selected to provide a basis for the pit design used to report mineral reserves.
15 .1 M I N E R AL R E S E R V E C L AS S I F I C AT I O N AN D S U M M AR Y The mineral reserves are the measured and indicated resource blocks that are within the reserve pit design and above the ore cut-off grade. The total proven and probable mineral reserves estimate is 118.6 Mt at a grade of 0.82 g/t Au. Table 15-1 provides further details of the mineral reserve estimates.
Table 15-1: Kişladağ, Mineral Reserve Estimates Effective December 31, 2017
Reserve Classification
Ore
(t x 1,000)
Grade Au
(g/t)
Contained Au
(oz x 1,000 )
Proven 113,253 0.83 3,032
Probable 5,306 0.60 102
Proven & Probable 118,560 0.82 3,134
The mineral reserves as reported are derived from and are included in the mineral resources.
K I Ş L A D A Ğ M I L L I N G P R O J E C T , T U R K E Y
T E C H N I C A L R E P O R T
2018 Final Report Page 15-2
No dilution was included in the conversion of mineral resources to mineral reserves. The block modelling methodology already accounts for dilution.
The cut-off grade for the mineral reserves is US$12.25/t milling net smelter return (NSR) for ore that will be processed by milling and US$6.86/t heap leaching NSR for ore that will be processed by heap leaching.
The reference point at which Kişladağ’s mineral reserves are defined is the point where the ore is delivered to the processing facility.
The mineral reserves are effective December 31, 2017.
15 .2 O P E N P I T O P T I M I Z AT I O N
15.2.1 Introduction The open pit optimization was carried out using Minesight® mine planning software. A series of unsmoothed pit shells were created using a Lerchs-Grossmann algorithm with revenue factors declining from unity. The unsmoothed pit shells were then used as a guide for developing a detailed design to be used in production scheduling.
15.2.2 Economic Parameters applied to Mine Design
15.2.2.1 Metal Prices
Base case pit optimization metal prices were as follows:
• Gold: US$1,200/ounce • Silver: US$16/ounce
15.2.2.2 Refining and Royalties
Gold will be refined and shipped as doré. The basis for pit optimization was the net mine gate revenue per tonne calculated for each block in the resource model. Metal prices described above and refining costs of US $4.00/ounce were used in the resource value determination. A silver credit of US$8.50/ounce of gold was applied based upon a historic Ag/Au ratio of 1.323:1 and initial planned mill recoveries of 75.0% Au and 30.0% Ag.
The milling NSR calculations used allow for the accounting of:
• Ore grades (Au and Ag) thus taking into account the variability in the metal content of the deposit.
• Ore mill recoveries. • Metal prices. • Refining charges.
For simplicity, royalty charges of 1.6% were directly applied to NSR; approximately equal to the actual royalties from 2017.

K I Ş L A D A Ğ M I L L I N G P R O J E C T , T U R K E Y
T E C H N I C A L R E P O R T
2018 Final Report Page 15-3
15.2.2.3 Onsite Operating Costs and Increments
The onsite operating costs used for pit limit analysis include general and administration, processing and mining costs. The G&A and processing costs were estimated to be US$1.85/t and US$9.70/t milled respectively. Sustaining capital costs for milling was estimated to be US$0.50/t. Preliminary operating costs for mining ore and waste were US$1.50/t and US$1.69/t respectively. An incremental haulage cost of US$0.034/t/bench was added for each 10 m bench below the open pit entrance at 960 masl.
Kişladağ is a mature mine that has been in continuous operation for over a decade. To date more than 334 Mt have been excavated from the open pit and over 120 Mt have been crushed and stacked for leaching. The operating and maintenance costs and performances for the mining and crushing operations are well understood and have been incorporated into the cost modelling used for the reserve estimate.
15.2.3 Metallurgical Parameters
15.2.3.1 Process Selection
The existing processing method at Kişladağ is primary crushing followed by secondary and tertiary crushing and conveyance to heap leaching pads. The processing method now proposed is for primary crushing followed by secondary and tertiary crushing to single stage grinding, whole ore cyanide leaching, carbon in pulp adsorption (CIP), cyanide detox, tailings filtration, and dry stacking. Mill throughput will be 13 Mt per year.
15.2.3.2 Process Recovery
The processing recovery used to develop the milling NSR model for mine planning was based upon bottle roll test work which formed the basis of a milling recovery model (Section 14).
The milling recovery model was used to estimate recoverable gold and milling NSR in the block model. Both recoverable gold and block recovery averages were reported for mine planning and final recoveries in mine schedules carry back calculated recoveries using the recoverable grades. The back calculated average recovery of the mineral reserve is 80.1%.
The distribution of metallurgical ore types and recovery within the open pit mine limits are shown in Table 15-2. Recoveries are reported for both block model mass weighted and back calculated recoveries.
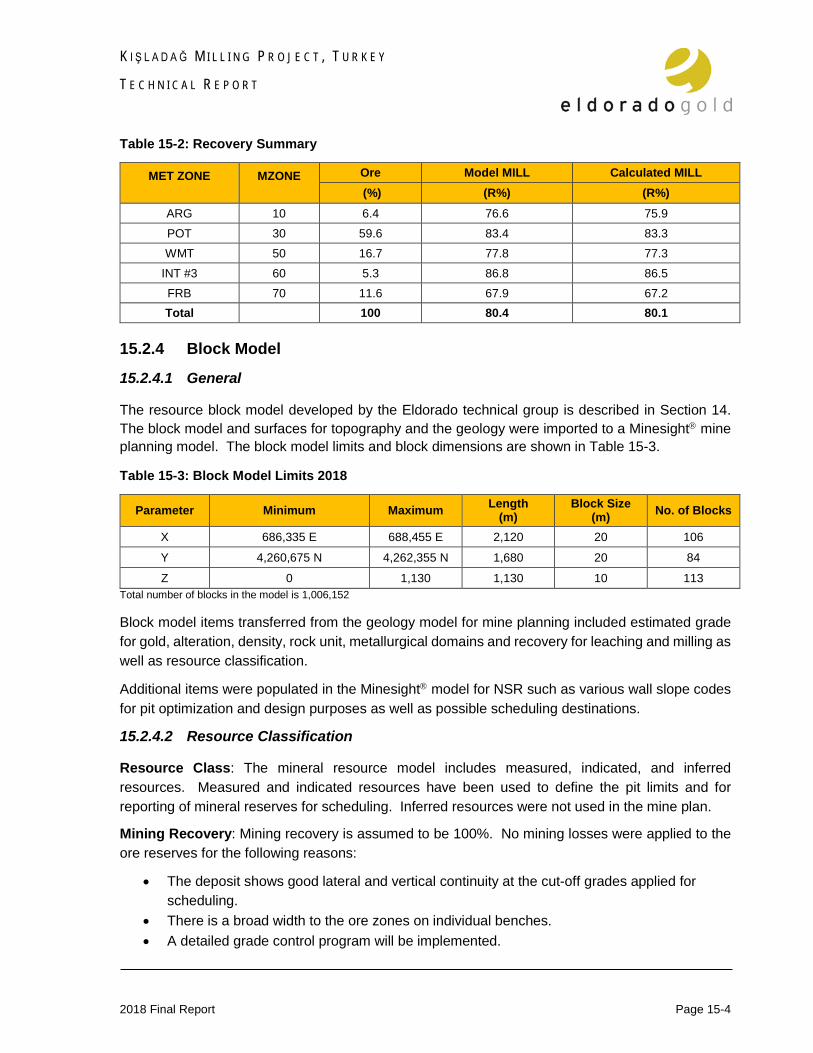
K I Ş L A D A Ğ M I L L I N G P R O J E C T , T U R K E Y
T E C H N I C A L R E P O R T
2018 Final Report Page 15-4
Table 15-2: Recovery Summary
MET ZONE
MZONE
Ore Model MILL Calculated MILL (%) (R%) (R%)
ARG 10 6.4 76.6 75.9 POT 30 59.6 83.4 83.3 WMT 50 16.7 77.8 77.3
INT #3 60 5.3 86.8 86.5 FRB 70 11.6 67.9 67.2 Total 100 80.4 80.1
15.2.4 Block Model
15.2.4.1 General
The resource block model developed by the Eldorado technical group is described in Section 14. The block model and surfaces for topography and the geology were imported to a Minesight mine planning model. The block model limits and block dimensions are shown in Table 15-3.
Table 15-3: Block Model Limits 2018
Parameter Minimum Maximum Length (m)
Block Size (m) No. of Blocks
X 686,335 E 688,455 E 2,120 20 106
Y 4,260,675 N 4,262,355 N 1,680 20 84
Z 0 1,130 1,130 10 113 Total number of blocks in the model is 1,006,152
Block model items transferred from the geology model for mine planning included estimated grade for gold, alteration, density, rock unit, metallurgical domains and recovery for leaching and milling as well as resource classification.
Additional items were populated in the Minesight model for NSR such as various wall slope codes for pit optimization and design purposes as well as possible scheduling destinations.
15.2.4.2 Resource Classification
Resource Class: The mineral resource model includes measured, indicated, and inferred resources. Measured and indicated resources have been used to define the pit limits and for reporting of mineral reserves for scheduling. Inferred resources were not used in the mine plan.
Mining Recovery: Mining recovery is assumed to be 100%. No mining losses were applied to the ore reserves for the following reasons:
• The deposit shows good lateral and vertical continuity at the cut-off grades applied for scheduling.
• There is a broad width to the ore zones on individual benches. • A detailed grade control program will be implemented.

K I Ş L A D A Ğ M I L L I N G P R O J E C T , T U R K E Y
T E C H N I C A L R E P O R T
2018 Final Report Page 15-5
Mining Dilution: Internal dilution was incorporated in the resource model by virtue of the compositing and interpolation method used to obtain the block grades. No additional dilution was applied in optimization.
15.2.5 Wall Slope Design Inter-ramp wall slopes angles were assigned by sector that were further subdivided into “Pyroclastic Oxide” zone, “Pyroclastic Sulphide” and “Intrusives & Schist”. An additional zone was coded for the “Friable Zone” where single benching and reduced geotechnical berm spacing need to be implemented in the final design. The slope sector locations and design parameters applied for pit optimization and design are shown in Figure 15-1 and Table 15-4.
Figure 15-1: Primary Slope Sector Locations

K I Ş L A D A Ğ M I L L I N G P R O J E C T , T U R K E Y
T E C H N I C A L R E P O R T
2018 Final Report Page 15-6
Table 15-4: Slope Sector Parameters
MSEP Sector SLOPC
Friable Code
SLOP1
Design Sector SLOP2
STRAT Oxide Sulphide OXIDE
Bench Face
Angle Pit Design
Tool
Bench Height
Berm Spacing
Berm Interval
Berm Width BERM
Calculated Inter-ramp
Angle Geotech.
Berm Stack Height
Adjusted Inter-ramp Angle
Flattening Effect
Pit Optimization
Input
NE 1 1 500 PYCL Oxide 10 to 20 65 10 2 20 7 50.8 20 80 43.2 7.6 39.4
2 500 PYCL Sulphide 30 75 10 2 20 7 58.3 20 100 50.7 7.6 49
3 60-400 INT-1, INT-2, INT-3, Schist 20-30 80 10 2 20 8 60 20 100 52.2 7.9 49
SE 2 4 500 PYCL Oxide 10 to 20 65 10 2 20 7 50.8 20 80 43.2 7.6 39.4
5 500 PYCL Sulphide 30 75 10 2 20 7 58.3 20 100 50.7 7.6 47.5
6 60-400 INT-1, INT-2, INT-3, Schist 20-30 80 10 2 20 8 60 20 100 52.2 7.9 47.5
SW 3 7 500 PYCL Oxide 10 to 20 65 10 2 20 7 50.8 20 80 43.2 7.6 39.4
8 500 PYCL Sulphide 30 75 10 2 20 7 58.3 20 100 50.7 7.6 47
9 60-400 INT-1, INT-2, INT-3, Schist 20-30 80 10 2 20 8 60 20 100 52.2 7.9 47
NW 4 10 500 PYCL Oxide 10 to 20 65 10 2 20 7 50.8 20 80 43.2 7.6 39.4
11 500 PYCL Sulphide 30 75 10 2 20 7 58.3 20 100 50.7 7.6 45
12 60-400 INT-1, INT-2, INT-3, Schist 20-30 80 10 2 20 8 60 20 100 52.2 7.9 45
1 to 4 1 13 Friable 10 to 30 65 10 1 10 7 40.6 20 40 31 9.6 36
External 14 65 10 2 20 8 49.1 20 0 49.1 39.4
Fill 15 35 10 1 10 0 35 20 0 35 35
The Lithology (STRAT) codes are as follows:
• 60 is schist. It is a waste rock at the base and to the north of the main orebody. • 100 (or anything in the 100’s) is Intrusive-1. This is the main ore bearing lithology and was the first of the intrusions. • 200’s are Intrusive-2 (220 & 240). This is also mostly mineralized in the 0.2 to 1.0 g/t range and consists of two separate masses, only one of which reaches surface. • 300’s are Intrusive-3 and similar Dykes (300, 330 & 350). This was probably the last intrusive and it is not well mineralized. Generally, the rock is more silicified and therefore has some better
geotechnical properties. • 400’s are Intrusive-2A. It is a partially mineralized mass in the south east and it has poor geotechnical properties. It grades in the half gram range. • 500 is pyroclastics. They are mineralized at the Int-1 contact but beyond that are almost barren. They make up most of the waste rock.

K I Ş L A D A Ğ M I L L I N G P R O J E C T , T U R K E Y
T E C H N I C A L R E P O R T
2018 Final Report Page 15-7
15.2.6 Pit Limit Analysis
Unsmoothed pit limits were developed using a Minesight variable slope Lerchs-Grossmann algorithm. The preliminary estimates of net mine gate revenue and operating costs were used to determine the value of each regular block in the model. A series of 30 nested pit limits were defined using revenue factors between 0.10 and 1.00. Those nested pit limits used to guide pit design are shown in Figure 15-2, Figure 15-3 and Figure 15-4.
Figure 15-2: Bench Plan NSR & Lerchs-Grossmann Pit Limits

K I Ş L A D A Ğ M I L L I N G P R O J E C T , T U R K E Y
T E C H N I C A L R E P O R T
2018 Final Report Page 15-8
Figure 15-3: Cross Section Looking North
Figure 15-4: Cross Section Looking West
The resources within the unsmoothed nested Lerchs-Grossmann pit limits are summarized in Table 15-5 at US$12.25/t milling NSR cut-off.
Pit optimization results are shown graphically in Figure 15-5 and Figure 15-6.

K I Ş L A D A Ğ M I L L I N G P R O J E C T , T U R K E Y
T E C H N I C A L R E P O R T
2018 Final Report Page 15-9
Table 15-5: Lerchs-Grossmann in-Pit Resources
Shell Factor
Ore (kt)
Waste Total (kt)
Total
(kt)
Strip Ratio (w:o)
Au
(g/t)
Recoverable
Au (g/t)
Milling NSR
(US$/t)
Model
Recovery (%)
Calculated Recovery
(%)
Years
Gold
Contained (oz x 1,000)
Recoverable (oz x 1,000)
1 0.10 39,920 3,501 43,421 0.09 1.03 0.83 31.55 80.07 80.15 3.07 1,326 1,063
2 0.13 41,515 4,419 45,934 0.11 1.03 0.82 31.30 80.11 80.10 3.19 1,368 1,096
3 0.16 43,890 5,761 49,651 0.13 1.01 0.81 30.87 80.01 80.04 3.38 1,428 1,143
4 0.19 45,086 6,514 51,600 0.14 1.01 0.80 30.65 79.96 80.00 3.47 1,457 1,165
5 0.22 46,677 7,998 54,675 0.17 1.00 0.80 30.45 80.03 80.06 3.59 1,498 1,199
6 0.26 50,746 12,491 63,237 0.25 0.98 0.79 30.00 79.97 79.98 3.90 1,605 1,284
7 0.29 53,090 14,177 67,267 0.27 0.97 0.78 29.60 79.98 80.02 4.08 1,657 1,326
8 0.32 57,394 20,208 77,602 0.35 0.96 0.77 29.27 79.96 79.92 4.41 1,773 1,417
9 0.35 60,118 23,536 83,654 0.39 0.95 0.76 28.99 80.00 80.02 4.62 1,838 1,471
10 0.38 62,154 26,257 88,411 0.42 0.94 0.76 28.77 80.03 80.06 4.78 1,884 1,509
11 0.41 64,003 28,470 92,473 0.44 0.94 0.75 28.55 80.06 80.02 4.92 1,926 1,541
12 0.44 74,709 45,680 120,389 0.61 0.91 0.73 27.67 79.56 79.52 5.75 2,193 1,744
13 0.47 75,441 46,379 121,820 0.61 0.91 0.72 27.59 79.54 79.56 5.80 2,207 1,756
14 0.50 79,023 50,629 129,652 0.64 0.90 0.72 27.25 79.70 79.62 6.08 2,282 1,817
15 0.53 102,554 94,306 196,860 0.92 0.86 0.68 26.06 79.90 79.72 7.89 2,829 2,255
16 0.57 103,183 95,389 198,572 0.92 0.86 0.68 26.04 79.93 79.70 7.94 2,843 2,266
17 0.60 108,854 109,585 218,439 1.01 0.85 0.68 25.91 79.91 79.72 8.37 2,985 2,380
18 0.63 110,460 112,713 223,173 1.02 0.85 0.68 25.86 79.92 79.67 8.50 3,022 2,408
19 0.66 113,285 118,201 231,486 1.04 0.85 0.68 25.74 79.92 79.69 8.71 3,085 2,458
20 0.69 115,980 125,446 241,426 1.08 0.85 0.67 25.68 79.95 79.76 8.92 3,151 2,513
21 0.72 119,918 137,473 257,391 1.15 0.84 0.67 25.63 80.08 79.93 9.22 3,246 2,595
22 0.75 123,008 142,159 265,167 1.16 0.84 0.67 25.47 80.02 79.71 9.46 3,314 2,642
23 0.78 173,857 245,167 419,024 1.41 0.79 0.63 23.99 79.96 79.62 13.37 4,416 3,516
24 0.81 174,454 246,213 420,667 1.41 0.79 0.63 23.97 79.98 79.62 13.42 4,431 3,528
25 0.84 193,666 304,167 497,833 1.57 0.78 0.63 23.87 80.32 79.95 14.90 4,875 3,898
26 0.88 194,053 304,957 499,010 1.57 0.78 0.63 23.86 80.31 79.95 14.93 4,885 3,906
27 0.91 195,917 310,669 506,586 1.59 0.78 0.63 23.84 80.32 80.05 15.07 4,926 3,943
28 0.94 197,385 312,456 509,841 1.58 0.78 0.63 23.81 80.34 80.03 15.18 4,956 3,966
29 0.97 206,742 341,280 548,022 1.65 0.78 0.62 23.71 80.35 79.95 15.90 5,171 4,134
30 1.00 207,397 341,967 549,364 1.65 0.78 0.62 23.69 80.37 80.05 15.95 5,181 4,147

K I Ş L A D A Ğ M I L L I N G P R O J E C T , T U R K E Y
T E C H N I C A L R E P O R T
2018 Final Report Page 15-10
Figure 15-5: Pit Optimization Shells
$-
$200,000
$400,000
$600,000
$800,000
$1,000,000
$1,200,000
$1,400,000
1 2 3 4 5 6 7 8 9 10 11 12 13 14 15 16 17 18 19 20 21 22 23 24 25 26 27 28 29 30
Ope
ratin
g Su
rplu
s US$
x 10
00
Pit Shell
OPERATING SURPLUS - SHELLS
Surplus Cumulative NPV 5%
-
100,000
200,000
300,000
400,000
500,000
600,000
1 2 3 4 5 6 7 8 9 10 11 12 13 14 15 16 17 18 19 20 21 22 23 24 25 26 27 28 29 30
Mat
eria
l ton
nes x
100
0
Pit Shell
ORE - WASTE - SHELLS
Ore Waste
-
0.20
0.40
0.60
0.80
1.00
1.20
1 2 3 4 5 6 7 8 9 10 11 12 13 14 15 16 17 18 19 20 21 22 23 24 25 26 27 28 29 30
Gold
Gra
de A
u g/
t
Pit Shell
AVERAGE GRADE - SHELLS
Gold Grade - Au g/t

K I Ş L A D A Ğ M I L L I N G P R O J E C T , T U R K E Y
T E C H N I C A L R E P O R T
2018 Final Report Page 15-11
Figure 15-6 Pit Optimization Shells
-
1,000.0
2,000.0
3,000.0
4,000.0
5,000.0
6,000.0
1 2 3 4 5 6 7 8 9 10 11 12 13 14 15 16 17 18 19 20 21 22 23 24 25 26 27 28 29 30
Gold
-O
unce
s x 1
000
Pit Shell
CONTAINED GOLD - SHELLS
Gold ounces x 1000 Contained
$-
$2.00
$4.00
$6.00
$8.00
$10.00
$12.00
$14.00
$16.00
$18.00
1 2 3 4 5 6 7 8 9 10 11 12 13 14 15 16 17 18 19 20 21 22 23 24 25 26 27 28 29 30
Ope
ratin
g Sur
plus
US$
/t
Pit Shell
INCREMENTAL OPERATING SURPLUS - SHELLS
Operating Surplus $/t
$-
$100.00
$200.00
$300.00
$400.00
$500.00
$600.00
$700.00
1 2 3 4 5 6 7 8 9 10 11 12 13 14 15 16 17 18 19 20 21 22 23 24 25 26 27 28 29 30
Ope
ratin
g Sur
plus
US$
/oun
ce R
ecov
ered
Pit Shell
INCREMENTAL OPERATING SURPLUS - SHELLS
Operating Surplus $/ounce
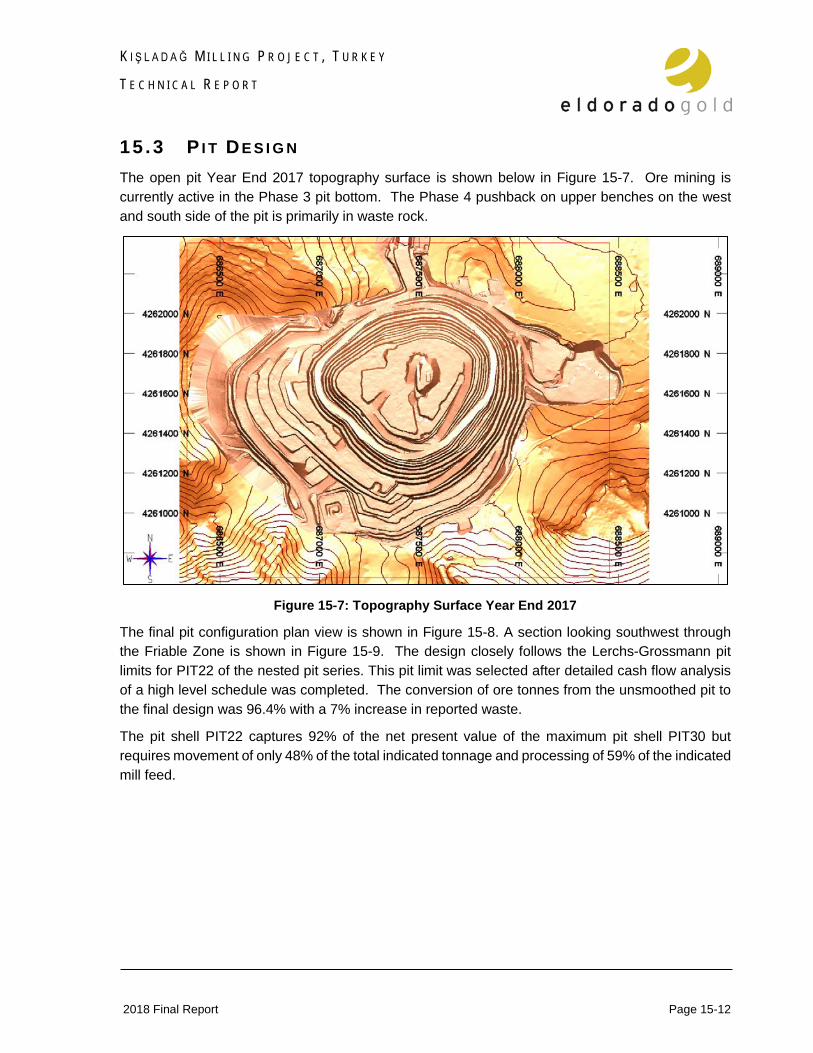
K I Ş L A D A Ğ M I L L I N G P R O J E C T , T U R K E Y
T E C H N I C A L R E P O R T
2018 Final Report Page 15-12
15 .3 P I T D E S I G N The open pit Year End 2017 topography surface is shown below in Figure 15-7. Ore mining is currently active in the Phase 3 pit bottom. The Phase 4 pushback on upper benches on the west and south side of the pit is primarily in waste rock.
Figure 15-7: Topography Surface Year End 2017
The final pit configuration plan view is shown in Figure 15-8. A section looking southwest through the Friable Zone is shown in Figure 15-9. The design closely follows the Lerchs-Grossmann pit limits for PIT22 of the nested pit series. This pit limit was selected after detailed cash flow analysis of a high level schedule was completed. The conversion of ore tonnes from the unsmoothed pit to the final design was 96.4% with a 7% increase in reported waste.
The pit shell PIT22 captures 92% of the net present value of the maximum pit shell PIT30 but requires movement of only 48% of the total indicated tonnage and processing of 59% of the indicated mill feed.
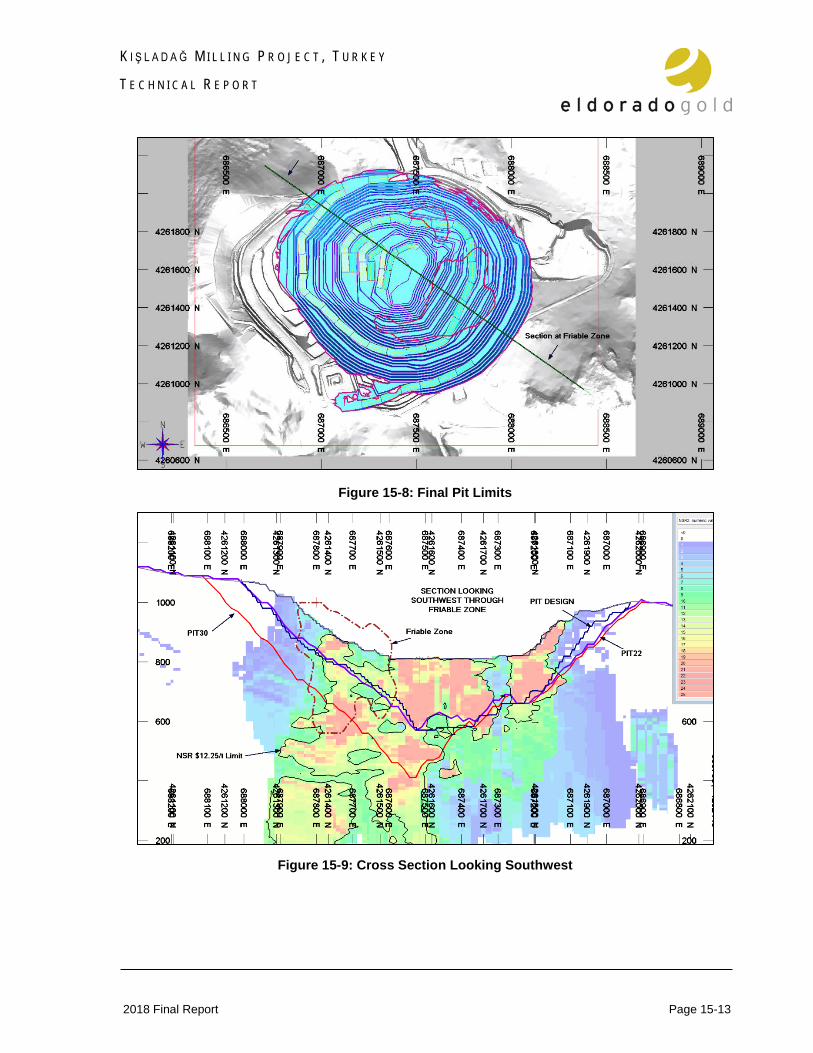
K I Ş L A D A Ğ M I L L I N G P R O J E C T , T U R K E Y
T E C H N I C A L R E P O R T
2018 Final Report Page 15-13
Figure 15-8: Final Pit Limits
Figure 15-9: Cross Section Looking Southwest

K I Ş L A D A Ğ M I L L I N G P R O J E C T , T U R K E Y
T E C H N I C A L R E P O R T
2018 Final Report Page 15-14
15 .4 M I N E R AL R E S E R V E S The mineral reserves for the deposit were estimated using a gold price of US$1200/oz. The mineral reserves are reported using a US$12.25/t milling NSR for ore that will be processed by milling and US$6.86/t heap leaching NSR for ore that will be processed by heap leaching in 2018. The reference point at which Kişladağ’s mineral reserves are defined is the point where the ore is delivered to the processing facility. The proven and probable mineral reserves are 118.6 Mt with an average grade of 0.82 g/t Au. Mineral reserves are summarized in Table 15-6.
Table 15-6: Kişladağ, Mineral Reserves Effective December 31, 2017
Crush Leach Reserve Classification
Ore
(t x 1,000)
Grade Au
(g/t)
Contained Au
(oz x 1,000)
Proven 2,999 1.18 114
Probable 50 0.63 1
Proven & Probable 3,049 1.17 115
Milling Reserve Classification
Ore
(t x 1,000)
Grade Au
(g/t)
Contained Au
(oz x 1,000)
Proven 110,254 0.82 2,918
Probable 5,256 0.60 101
Proven & Probable 115,511 0.81 3,019
Combined Reserve Classification
Ore
(t x 1,000)
Grade Au
(g/t)
Contained Au
(oz x 1,000)
Proven 113,253 0.83 3,032
Probable 5,306 0.60 102
Proven & Probable 118,560 0.82 3,134
15 .5 R I S K F AC T O R S The results of the economic analysis to support mineral reserves represent forward looking information that is subject to a number of known and unknown risks, uncertainties, and other factors that may cause actual results to differ materially from those presented here. Uncertainty that may materially impact mineral reserve estimation include realized prices, market conditions, capital and operating cost estimates, foreign exchange rates, resource model performance, recoveries, and the timely and successful implementation of recommended actions.

K I Ş L A D A Ğ M I L L I N G P R O J E C T , T U R K E Y
T E C H N I C A L R E P O R T
2018 Final Report Page 16-1
SECTION • 16 M IN I NG METHOD S
16 .1 I N T R O D U C T I O N The Kişladağ open pit mine will provide mill feed at a nominal rate of 13 Mtpa. Annual mine production will peak at 33.6 Mtpa in 2022. The life of mine (LOM) stripping ratio is 1.29:1. The major mining equipment at Kişladağ is summarized in Table 16-1.
Table 16-1: Major Mining Equipment
Description Make Model Size Units Drilling
Wall Control drill Atlas Copco ROC L6 110 mm 1 Wall Control drill Atlas Copco ROC D65 110 mm 1
Blasthole drill Atlas Copco DM45 165 mm 2 Blasthole drill Atlas Copco PV-235-D 165 mm 3 Blasthole drill Atlas Copco PV-235-E 165 mm 2
Blasting
Blasting crew flatbed truck M-Benz Sprinter 110 kW 1 ANFO truck M-Benz 3028K 280 kW 2 ANFO truck M-Benz 3029K 210 kW 1
Emulsion truck Volvo 420 315kW 1 Blasters crew truck Nissan Navara 4x4 140kW 1
Loading
Front end loader Caterpillar 993K 12 m3 1 Front end loader Le Tourneau L-1350 21.4 m3 2 Hydraulic shovel Hitachi EX3600 21 m3 2 Hydraulic shovel Hitachi EX5600-6 29 m3 1
Hauling
Haul truck Caterpillar 785C/D 136 t 14 Haul truck Hitachi EH4000AC 219 t 10
Other mine operations
Track dozer Caterpillar D9T 306 kW 2 Track dozer Caterpillar D10T 433 kW 2 Wheel dozer Caterpillar 834H 372 kW 1 Wheel dozer Caterpillar 854K 597 kW 2 Motor grader Caterpillar 16M 221 kW 4 Water truck M-Benz 4140B 20,000L 3 Excavator Caterpillar 330DL 200 kW 1 Excavator Hitachi ZX350LCH-3 202 kW 1

K I Ş L A D A Ğ M I L L I N G P R O J E C T , T U R K E Y
T E C H N I C A L R E P O R T
2018 Final Report Page 16-2
The mine fleet includes seven diesel drills, two electric drills, one 29 m3 electric hydraulic shovel, two 21 m3 diesel hydraulic shovels, two 21.4 m3 wheel loaders, one 12 m3 wheel loader, fourteen 136 t trucks and ten 219 t trucks. The major equipment is supported by a fleet of graders, dozers, a backhoe and water trucks.
Ore and waste are mined on 10 m benches. Ore will be hauled to the primary crusher for processing and waste rock will be placed in the south rock dump (SRD). The current mine plan reflects a transition from heap leaching to conventional milling. Crushing and stacking of ore for heap leaching will be halted in April 2018. The mine will continue to strip waste to prepare for a mill start-up in the first quarter of 2021.
The general arrangement of the open pit and SRD are shown in Figure 16-1.
Figure 16-1: General Arrangement

K I Ş L A D A Ğ M I L L I N G P R O J E C T , T U R K E Y
T E C H N I C A L R E P O R T
2018 Final Report Page 16-3
16 .2 M I N E D E S I G N
16.2.1 Geotechnical Wall Slope Design Sectors As described in Section 15, there are four major slope design sectors that have been further subdivided according to lithology and oxidation state. These sectors have been provided by SRK Consulting in November 2016 and modified for coding by Nilsson Mine Services (NMS). A total of thirteen (13) design sectors have been coded into the mine block model. Bench face angles and berm width codes have been used to develop the final design. Specific geotechnical berm width input was used to over-ride the general design criteria. Key elements incorporated in the design are shown in Figure 16-2.
Figure 16-2: Design Elements
16.2.2 Ultimate Pit Dimensions The final pit dimensions are summarized in Table 16-2. The final depth of the pit will be to the 570 m bench with a final wall height of 505 m to the highest point on the pit rim.
16.2.3 Haulage Roads The ultimate pit haulage road allowances have been designed for 35 m width at 10% grade. This width will provide adequate room for ditches, outside berm and travel width for 219 t trucks. In the “Friable Zone” haulage road width has been increased to 40 m to allow for potential bench face instability. Haulage road width was reduced to 25 m on the final 4 benches from 610 bench to 570 bench for single lane access during the last phase of ore recovery.
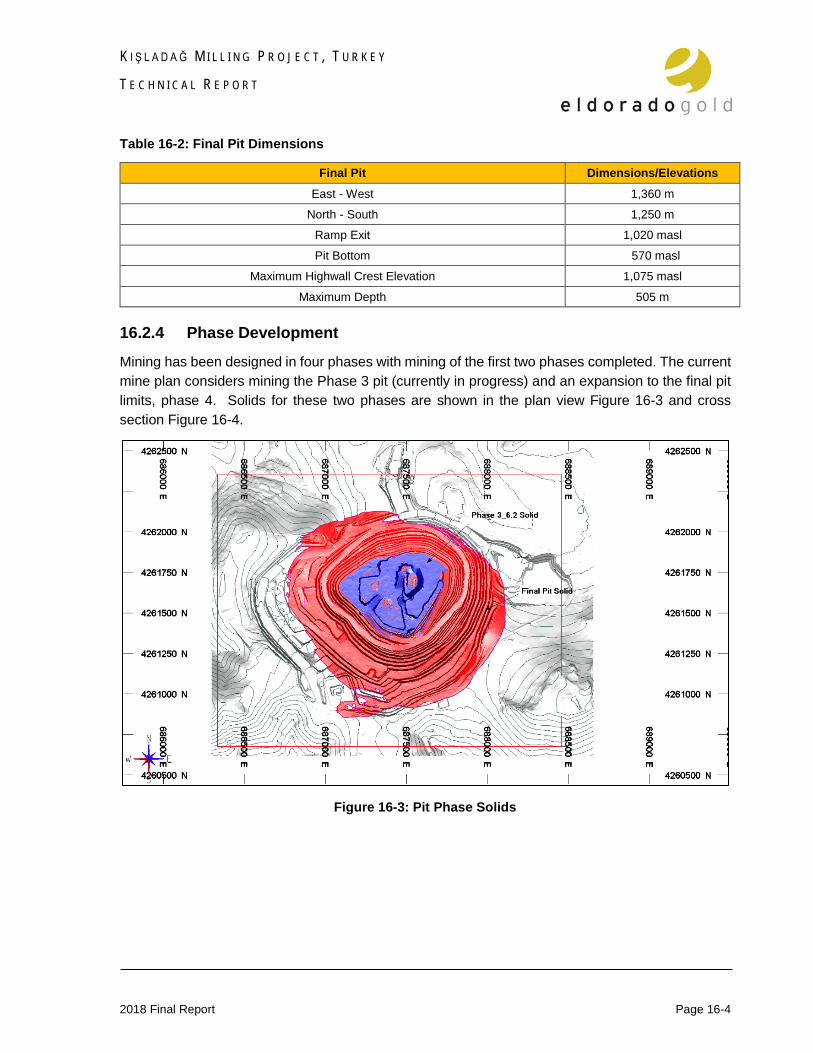
K I Ş L A D A Ğ M I L L I N G P R O J E C T , T U R K E Y
T E C H N I C A L R E P O R T
2018 Final Report Page 16-4
Table 16-2: Final Pit Dimensions
Final Pit Dimensions/Elevations East - West 1,360 m
North - South 1,250 m
Ramp Exit 1,020 masl
Pit Bottom 570 masl
Maximum Highwall Crest Elevation 1,075 masl
Maximum Depth 505 m
16.2.4 Phase Development Mining has been designed in four phases with mining of the first two phases completed. The current mine plan considers mining the Phase 3 pit (currently in progress) and an expansion to the final pit limits, phase 4. Solids for these two phases are shown in the plan view Figure 16-3 and cross section Figure 16-4.
Figure 16-3: Pit Phase Solids

K I Ş L A D A Ğ M I L L I N G P R O J E C T , T U R K E Y
T E C H N I C A L R E P O R T
2018 Final Report Page 16-5
Figure 16-4: Pit Phase Section
16 .3 M I N E P R O D U C T I O N S C H E D U L E
16.3.1 Mining Plan The LOM plan has been developed for a nine year ore mining and milling program preceded by a three year period for crush leach wind down, mill construction and pre-stripping of the final phase of mining. Approximately 3.0 Mt of ore will have been mined and placed on the heap leach pad through to April 2018. The mine will then transition to a pre-stripping program in the final phase of pit development. Approximately 63 Mt of waste will be moved during 2018 – 2020 opening up the final phase for future ore release as the Phase 3 pit is completed in 2021 – 2023. During the pre-stripping period approximately 430,000 t of ore will be stockpiled to be recovered and processed during mill commissioning in 2021. A total of 115.5 Mt of ore will be milled during the nine year LOM milling plan.
The average strip ratio over the LOM is 1.29:1. A total of 152.4 Mt of waste will be mined (inclusive of the 63 Mt of pre-stripping waste). The average LOM gold grade (inclusive of both the crush leach ore and the milling ore) is forecast to be 0.82 g/t Au. The recoverable grade is estimated to be 0.66 g/t for a LOM recovery of 80.1%. The mine schedule is shown in Figure 16-5 and Table 16-3.

K I Ş L A D A Ğ M I L L I N G P R O J E C T , T U R K E Y
T E C H N I C A L R E P O R T
2018 Final Report Page 16-6
Figure 16-5: Mine Material Movement Schedule

K I Ş L A D A Ğ M I L L I N G P R O J E C T , T U R K E Y
T E C H N I C A L R E P O R T
2018 Final Report Page 16-7
Table 16-3: Mine Material Movement Schedule
Material Units 2018 2019 2020 2021 2022 2023 2024 2025 2026 2027 2028 2029 2030 TOTAL
Ore Mined Kt 3,051 48 384 10,836 13,000 13,000 13,000 13,000 13,000 13,000 13,000 13,226 - 118,545
Au g/t 1.17 0.48 0.55 1.07 0.94 0.76 0.75 0.79 0.82 0.81 0.74 0.70 - 0.82
Recovery % 47.3 70.4 76.5 80.3 78.3 76.4 75.4 78.6 80.3 81.7 84.1 86.0 - 78.8 Stockpile Opening Balance Kt - - 48 432 - - - - - - - - - -
Au g/t - - 0.48 0.54 - - - - - - - - - -
Recovery % - - 70.4 75.9 - - - - - - - - - -
Stockpile Addition Kt - 48 384 - - - - - - - - - - 432
Au g/t - 0.48 0.55 - - - - - - - - - - 0.54
Recovery % - 70.4 76.5 - - - - - - - - - - 75.9
Stockpile Reclaim Kt - - - 432 - - - - - - - - - 432
Au g/t - - - 0.54 - - - - - - - - - 0.54
Recovery % - - - 75.9 - - - - - - - - - 75.9 Stockpile Closing
Balance Kt - 48 432 - - - - - - - - - - -
Au g/t - 0.48 0.54 - - - - - - - - - - -
Recovery % - 70.4 75.9 - - - - - - - - - - -
Waste Mined Kt 13,546 28,717 21,151 22,371 20,591 18,415 10,707 4,827 2,595 2,880 3,355 3,288 - 152,443
Total Mined1 Kt 16,597 28,765 21,535 33,207 33,591 31,415 23,707 17,827 15,595 15,880 16,355 16,514 - 270,988 Processing Schedule2 Kt 3,051 - - 11,268 13,000 13,000 13,000 13,000 13,000 13,000 13,000 13,226 - 118,545
Au g/t 1.17 - - 1.05 0.94 0.76 0.75 0.79 0.82 0.81 0.74 0.70 - 0.82
Recovery % 47.3 - - 80.1 78.3 76.4 75.4 78.6 80.3 81.7 84.1 86.0 - 78.8 Note: 1 Mining costs for Q1 2018 tonnes mined, totaling approximately 4.3 Mt, are considered sunk costs and are not included capital cost estimate described in Section 21 2 Approximately 3.0 Mt of ore is mined and placed on the heap leach pad between January and April 2018. Revenue from this ore is not considered in the economic analysis described in
Section 22.

K I Ş L A D A Ğ M I L L I N G P R O J E C T , T U R K E Y
T E C H N I C A L R E P O R T
2018 Final Report Page 16-8
16.3.2 Annual Mining Plans Annual mine plans were created to reflect the advance of mine development. Selected plans are presented in the figures below. Mine development to year end 2018 is shown in Figure 16-6. Phase 3 will be mined to 810 Bench and then mining will move to stripping the southeast highwall of the final pit.
Figure 16-6: Mine Development 2018
Development to year end 2020 is shown in Figure 16-7. Stripping has progressed to 910 Bench and access is available to ore in the bottom of the Phase 3 pit for startup and commissioning of the mill in 2021 Q1.
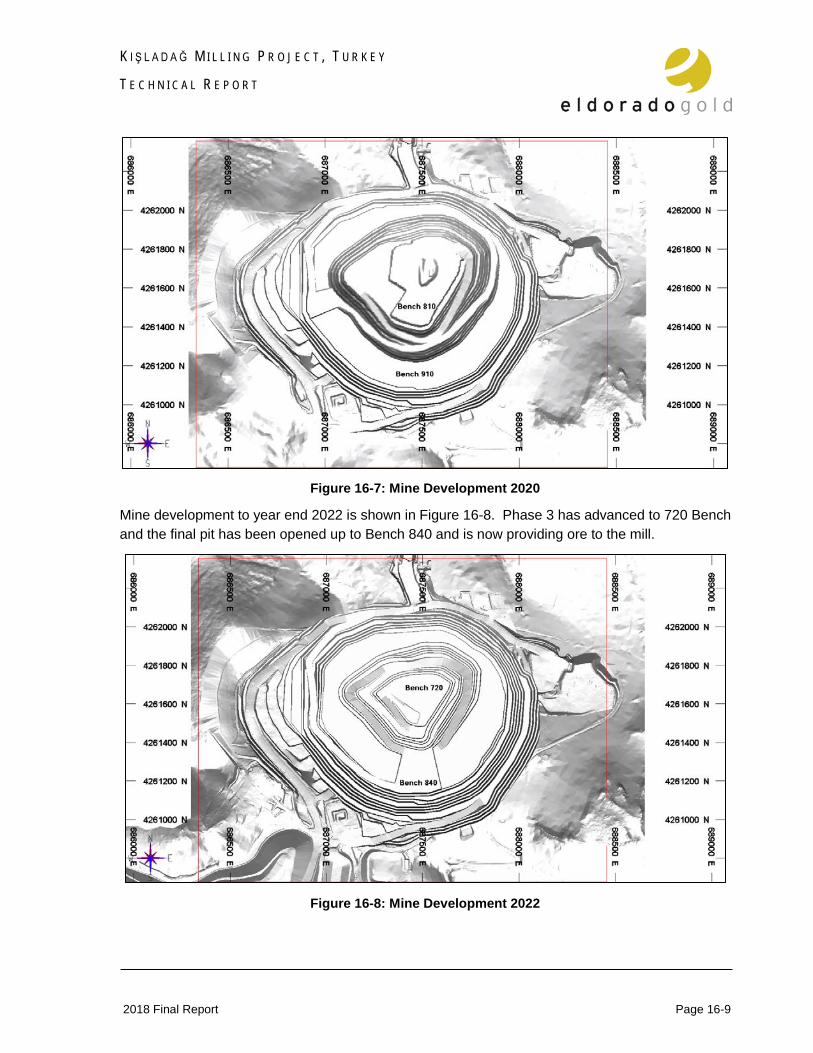
K I Ş L A D A Ğ M I L L I N G P R O J E C T , T U R K E Y
T E C H N I C A L R E P O R T
2018 Final Report Page 16-9
Figure 16-7: Mine Development 2020
Mine development to year end 2022 is shown in Figure 16-8. Phase 3 has advanced to 720 Bench and the final pit has been opened up to Bench 840 and is now providing ore to the mill.
Figure 16-8: Mine Development 2022

K I Ş L A D A Ğ M I L L I N G P R O J E C T , T U R K E Y
T E C H N I C A L R E P O R T
2018 Final Report Page 16-10
Mine development to year end 2025 is shown in Figure 16-9. Phase 3 has been mined out and the final pit has advanced to 750 Bench.
Figure 16-9: Mine Development 2025
The final pit configuration is shown in Figure 16-10.
Figure 16-10: Mine Development 2029

K I Ş L A D A Ğ M I L L I N G P R O J E C T , T U R K E Y
T E C H N I C A L R E P O R T
2018 Final Report Page 16-11
16.3.3 Waste Dump The current SRD design can accommodate 101.3 Mt of additional material. An expansion towards the open pit and to the north will provide space for an additional 51.1 Mt for a total of 152.4 Mt. Alternatively the dry stack tailings facility can provide capacity for the balance of the scheduled waste for a total capacity of 152.4 Mt. Economic trade-off studies will be undertaken during the next phase of project evaluation to optimize the waste disposal plans The current configuration and proposed SRD expansion are shown in Figure 16-11, Figure 16-12 and Figure 16-13.
Figure 16-11: Current Waste Dump Configuration

K I Ş L A D A Ğ M I L L I N G P R O J E C T , T U R K E Y
T E C H N I C A L R E P O R T
2018 Final Report Page 16-12
Figure 16-12: SRD Current Design
Figure 16-13: SRD Expansion
K I Ş L A D A Ğ M I L L I N G P R O J E C T , T U R K E Y
T E C H N I C A L R E P O R T
2018 Final Report Page 17-1
SECTION • 17 RECOV ERY ME THODS
17 .1 G E N E R AL D E S C R I P T I O N The Kişladağ Project is an open pit mine and heap leach operation with a 3-stage crushing plant. A new process plant will be constructed which consists of single-stage grinding, cyanide leach, CIP, cyanide detox, tailing filtration, and dry stack of filtered tailing, and associated infrastructure, with a capacity to process 13 Mt of ore per year resulting in approximately 241,000 to 306,000 ounces of gold production annually.
17 .2 P R E V I O U S R E C O V E R Y M E T H O D S The previous technical report entitled “Technical Report for the Kişladağ Gold Mine, Turkey”, published by Eldorado Gold in March 2010 was based on the ore being processed in a conventional heap leach facility which consists of a three-stage crushing plant, an overland conveyor from crushing plant to heap leach pad, mobile conveyors, a radial stacker for placing the crushed ore onto leach pad, and a carbon adsorption facility for recovering dissolved gold onto activated carbon. The gold-loaded carbon is then stripped on site in a refinery and the final product is a gold doré bar.
The initial design capacity was 5 Mtpa for the first two years of operation, predominantly oxide material was processed during this time. The facilities were expanded to process 10 Mtpa and subsequently to 12.5 Mtpa. As mining has progressed deeper into the pit the proportion of sulphide has increased and become dominant; since 2016 oxide ore quantities have become negligible. Typical crushed product size is 80% passing 6.5 mm.
The existing process plant consists of:
• Primary crushing and coarse ore stockpile. • Secondary screening and crushing. • Tertiary crushing and screening. • Crushed ore overland conveying and stacking. • Heap leaching. • Adsorption, desorption, regeneration (ADR) plant. • Electrowinning and gold smelting. • Reagent and air services. • Water services (fresh water, process water, potable water).
Subsequent evaluation for treatment of sulphide ore through heap leach process necessitated a change in the process flowsheet to achieve consistently higher gold recovery over the entire Kişladağ ore body. Consequently in 2017, a conventional whole ore cyanide leach-CIP based process was developed and serves as the basis for the current evaluation.

K I Ş L A D A Ğ M I L L I N G P R O J E C T , T U R K E Y
T E C H N I C A L R E P O R T
2018 Final Report Page 17-2
17 .3 P R O C E S S S E L E C T I O N Subsequent changes in leaching characteristics of the sulphide ore at depth necessitated a change in the process to achieve higher gold recovery for the remaining mineralization in the deposit.
Cyanide leach testwork using pulverized materials did not indicate problems with heap leach recovery. Separate testwork using crushed materials indicated lower recoveries when using heap leach on deeper sections of the orebody and hence, milling and CIP were considered as an alternate process. An internal scoping study was started in October 2017 to evaluate viability of various process options for treatment of sulphide gold ore, and then further metallurgical testwork followed to support further studies as outlined in Section 13.
Many batch whole ore cyanide leach tests followed by carbon adsorption tests were completed in 2017 and 2018 as reported in Section 13. The results demonstrated that the whole ore cyanide leach-CIP based process is robust for treatment of Kişladağ sulphide ore. Satisfactory gold recovery was achieved from various ore types under a wide range of operating conditions, particularly for the most important potassic ore type which accounts for about 60% of total reserves. The Kişladağ ore showed some preg-robbing or preg-borrowing properties. This means that a portion of the dissolved gold is adsorbed by some materials in the ore, causing temporary or permanent loss of gold recovery. Fortunately, the intensity of preg-robbing is relatively weak and can be effectively overcome by applying CIP or CIL.
To integrate the new process option into the existing Kişladağ processing plant, it is planned to locate the new process plant adjacent to the existing crushing plant. Fine ore from the tertiary crushing circuit will be stockpiled on a new fine ore stockpile, which will be reclaimed by new reclamation equipment and then fed to the single-stage ball mill grinding circuit.
The flowsheet as selected for processing of Kişladağ sulphide ore includes single-stage ball mill grinding, pre-leach thickening, pre-aeration and cyanide leaching followed by CIP adsorption. The CIP tail is then processed through cyanide recovery (thickening) followed by cyanide detoxification and pre-filtration thickening.
To minimize consumption of fresh water in the whole ore cyanide leach-CIP process and also to improve the stability of stored tailings, thickening and filtration of detoxified tailings are planned. The filtered tailings material will be discharged onto a conveying system which will feed the existing overland conveyor. A new conveyor will transfer the filtered tail by way of the overland conveyor to a new dry stacked tailings pad. Existing portable stacking equipment will be relocated and used for stacking the filtered tail.
The Kişladağ concentrate treatment plant (KCTP) originally constructed for treatment of Efemçukuru concentrate was decommissioned after poor metallurgical performance on the Efemçukuru concentrate was noted. The plant contains an electrowinning circuit and goldroom which will be repurposed for gold recovery from the expansion. Pregnant solution produced during carbon elution will circulate between the re-commissioned KCTP electrowinning circuit and the carbon elution columns to recover the eluted gold. Gold

K I Ş L A D A Ğ M I L L I N G P R O J E C T , T U R K E Y
T E C H N I C A L R E P O R T
2018 Final Report Page 17-3
cathode sludge from electrowinning cells will be dried and then smelted into gold doré in the re-commissioned KCTP goldroom. A simplified flowsheet of the milling flowsheet is depicted in Figure 17-1.
17 .4 P L AN T D E S I G N B AS I S The new process plant was designed on the basis of overall plant operating time of 93% and 365 days per year for a total operating time of 8,147 h/y. The process plant has been designed to produce up to approximately 290,000 oz/a gold as doré bar.
Key criteria selected for the new process plant design are:
• Annual ore throughput of 13 Mtpa. • Plant operating time of 93% (milling / leaching / filtration). • Typical ore head grade of 0.81 g/t for gold and approximately 1.0 g/t for silver. • LOM average gold recovery of 80%.
17 .5 P R O C E S S D E S C R I P T I O N
17.5.1 Milling
17.5.1.1 Ball Mills
The new Kişladağ milling circuit ties into the existing crushing plant where the crusher product is transported to the fine ore stockpile via the fine ore stockpile feed conveyor. The crushed ore from the fine ore stockpile is reclaimed by two variable speed fine ore stockpile reclaimers which feed two parallel ball milling and classification circuits respectively.
The reclaimers transfer the crushed ore onto their respective ball mill feed conveyors which discharge the ore directly into the ball mills. These conveyors are equipped with a belt scale to provide feed rate data for feed control to the grinding circuit.
The live capacity of the fine ore stockpile allows for over 19 hours of continuous milling operation at the nominal feed rate (1,596 t/h). In the event that one of the reclaimers is unavailable, front end loaders can be used to transport the fine ore from the stockpile and feed two emergency dump hoppers. Two ball mill media autoloader systems share one ball mill media bin located adjacent to the mill feed conveyor that deposits grinding balls onto the feed conveyor as needed to maintain the optimum ball charge in the ball mills.

K I Ş L A D A Ğ M I L L I N G P R O J E C T , T U R K E Y
T E C H N I C A L R E P O R T
2018 Final Report Page 17-4
Figure 17-1: Simplified Flowsheet of Kişladağ Milling

K I Ş L A D A Ğ M I L L I N G P R O J E C T , T U R K E Y
T E C H N I C A L R E P O R T
2018 Final Report Page 17-5
The crushing circuit product with 80% passing 6.5 mm is fed into the ball mill circuit consisting of two 7.92 m x 12.34 m (inside diameter by effective grinding length) ball mills, with an installed pinion power of 16.5 MW each. The classification circuit will operate at a nominal circulating load of 300% which is typical for ore of similar characteristics and target grind size. To avoid damage to the cyclone feed pumps and cyclone clusters, ball mill discharge is screened through a trommel (20 mm aperture) to scalp off oversized particles and broken grinding media.
The trommel screen undersize slurry from the two ball mills discharges to their respective ball mill discharge pumpboxes. The slurry is then pumped by the ball mill cyclone cluster feed pump to the classification cyclone clusters.
17.5.1.2 Cyclone Classification
The cyclone cluster operates in closed-circuit with each ball mill and is configured to achieve a target cyclone overflow product sizing of 80% passing 75 µm. The cyclone cluster with operating and standby units will have pneumatically actuated valves that allow automated feed pressure control as well as manually actuated isolation valves.
The slurry from the cyclone cluster underflow launders flow directly back to the ball mills while the cyclone overflow slurry from both cyclone clusters gravity flow to a trash screen distributor where the slurry is distributed between the trash screens (0.80 mm aperture) to screen off any plastic, aluminium, tramp steel, wood and organic refuse coming from the mine.
Two sump pumps will be provided in the grinding area to facilitate clean-up. These pumps will discharge into their respective area cyclone pumpboxes.
17.5.2 Leaching
17.5.2.1 Pre-Leach Thickening
The cyclone overflow slurry, which has been screened through the trash screens reports to the pre-leach thickener. The thickener increases the feed slurry density prior to the leach circuit to optimize the leach residence time. The water recovered from the thickener overflow reports to the process water tank which is then used in the grinding circuit as process water.
The thickener is a high rate unit with a hydraulic rake drive. The undersize from the trash screens gravity flows and enters the thickener at the central feed well where it is diluted inside the feed well and dosed with flocculant. The flocculated solids settle towards the thickener discharge cone and are pumped away while the supernatant water overflows an internal weir into the overflow launder. The thickened slurry exits the discharge cone at a nominal target of 55 ~ 57% w/w solids underflow density to the leach circuit distributor box where the stream is mixed, when necessary, with cyanide-bearing tailings solution water.
K I Ş L A D A Ğ M I L L I N G P R O J E C T , T U R K E Y
T E C H N I C A L R E P O R T
2018 Final Report Page 17-6
17.5.2.2 Leach Tanks
The leach feed slurry is split between two parallel trains of pre-aeration / leach tanks, each including one pre-aeration tank and eight leach tanks. It provides a total of 4.0 hours retention time for pre-aeration time and a total of 32 hours retention time for leaching.
In this circuit, the gold bearing slurry is brought into contact with first air in the pre-aeration tank to oxidize any reactive materials, and then cyanide in the leach tanks that dissolves the gold from the ore into solution by forming stable gold-cyanide complexes in the presence of sparging air. The pH of slurry in the tanks is monitored and lime is added as necessary to maintain target pH of 10.5 -11.0. Slurry from the distributor box is first fed into the pre-aeration tank where air and slaked lime slurry are added, and then enters into the leach tanks where air, concentrated cyanide solution and slaked lime slurry are added to begin the gold leaching process. Low pressure compressed air is blown into slurry in the tanks through spargers mounted at the bottom of the tanks.
Slurry exiting each leach tank flows by gravity to the next tank through an up-comer inside the tank to an overflow launder. Each tank is connected to the next two tanks via overflow launders with knife gate valves for tank isolation on each discharge point. This arrangement will allow the slurry to bypass the next tank if one of the downstream tanks must be taken out of service for maintenance. Once the slurry discharges from the final leach tank, the slurry from the two parallel leaching trains gravity flows to their respective CIP distribution boxes.
17.5.3 CIP and Carbon Adsorption
17.5.3.1 Carbon in Pulp Tanks
The leached slurry is split between two parallel trains of CIP tanks, each including eight CIP tanks, providing a total of 8.0 hours retention time per train. The purpose of the CIP circuit is to recover dissolved gold from leached slurry onto activated carbon before the barren slurry is directed to the cyanide destruction circuit. The gold is recovered by bringing the leached slurry, containing gold in solution, in contact with activated carbon so that the dissolved gold can be loaded onto it through the process of adsorption. Each CIP tank is equipped with an agitator, two inter-stage screens and a carbon advance transfer pump.
Slurry in the first tank flows through inter-stage screens to the next tank via an overflow launder while the screens hold back activated carbon from moving to the next tank. Each subsequent tank in the series sends slurry to the next tank until the slurry reaches the last tank which then gravity flows out to the cyanide destruction circuit via the CIP tailings carbon safety screens.
17.5.3.2 Loaded Carbon Screening
Loaded carbon is advanced periodically from the last CIP tank to the first tank in the series by the carbon advance transfer pumps. Periodically, reactivated carbon from the carbon

K I Ş L A D A Ğ M I L L I N G P R O J E C T , T U R K E Y
T E C H N I C A L R E P O R T
2018 Final Report Page 17-7
quench tank is screened through the carbon sizing screen where the oversize reactivated carbon is directed into the last CIP tank for carbon loading.
Once the loaded carbon in the first CIP tank is loaded to a desirable level, carbon-bearing slurry is pumped to the loaded carbon screen where the loaded carbon is screened and separated from the slurry under water spray. Water is sprayed on the vibrating screen decks to wash off slurry from the loaded carbon before reporting to the acid wash column. The loaded carbon gravity flows to the acid wash column ahead of the next elution cycle and the slurry returns to the first CIP tank.
17.5.4 Cyanide Destruction
17.5.4.1 Carbon Safety Screen
Tailings from the CIP circuit flows by gravity to the CIP tails feed box where the tailing slurry is distributed to the CIP tailings carbon safety screens (0.70 mm aperture). The safety screens retain any carbon that has reported with the slurry due to a leak in inter-stage screen mesh or seals in the CIP circuit.
Water is sprayed on the vibrating screen decks to wash off slurry from the carbon particles before reporting to a tote box. Screen underflow flows to the CIP tailings pumpbox and is pumped by the CIP tailings transfer pumps to the cyanide (CN) recovery thickener. In the event of a mechanical failure of the screens, the CIP carbon safety screen distributor can be bypassed, allowing the train 1 CIP tails and train 2 CIP tails discharge to report directly to the CN recovery thickener.
17.5.4.2 Cyanide Recovery Thickener
The underflow slurry from the CIP carbon safety screens reports to the CIP tailings pumpbox where it is pumped by the CIP tailings transfer pumps to the CN recovery thickener. Discharge from the CIP tailings pumpbox is sampled by an automatic crosscut sampler as it is pumped to the thickener.
The CN recovery thickener is a high-rate unit with an adjustable rake height. Flocculant is added to the thickener to promote settling of solids. Free cyanide is recovered from the CIP tailings in the overflow stream which reports back to leach circuit feed box to dilute the feed slurry. Recycling free cyanide in the CIP tails decreases the overall fresh cyanide consumption for the plant and reduces cyanide destruction costs in the downstream circuit.
17.5.4.3 Cyanide Destruction Tanks
The underflow from the CN recovery thickener reports to the CN destruction feed distributor where it is combined with reagents required for cyanide destruction. The cyanide destruction circuit provides a total of 3.0 hours residence time in three tanks in series for the detoxification reaction. Filtrate dilution water from the tailings filter filtrate clarifier is used to dilute the cyanide destruction feed to the optimal slurry density, typically 40-45% solid. In addition to

K I Ş L A D A Ğ M I L L I N G P R O J E C T , T U R K E Y
T E C H N I C A L R E P O R T
2018 Final Report Page 17-8
this, acid wash effluent from acid wash column of loaded activated carbon, overflow from the pre-filter thickener of detoxed tailing, copper elution solution from the elution column and the area sump pump discharge are also added to the CN destruction feed distributor box on an intermittent basis. When the effluent from acid wash column of loaded activated carbon and the effluent from copper elution contain a significant amount of gold, they may be neutralized separately and then forwarded to the CIP circuit.
The cyanide detoxification circuit reduces weak acid dissociable cyanide (CNWAD) to a target value of less than 10 ppm. Air supply for detoxification reaction is supplied to each cyanide destruction tank via a dispersion cone mounted to the bottom of each tank to maintain a high redox potential to maximize oxidation of cyanide. Dual-impeller high shear agitators are used to enhance air dispersion and dissolution in the slurry to meet the oxygen demand of cyanide destruction process. Sodium metabisulphite solution (a source of SO2) is added to the slurry in the tanks. Copper sulphate solution, when needed, is dosed as catalyst for cyanide detoxification process while lime slurry is added from a ring main into each tank to maintain the desired pH of 7.0 to 9.0.
The distributor box distributes the CIP tailings slurry to two cyanide destruction trains. Each train consists of three tanks in series. The distributor box contains dart valves that can be used to direct flow to the first (or second) cyanide destruction tank in each train. Each of the cyanide destruction tanks can be bypassed for maintenance while the other two remain operational.
17.5.5 Tailings Filtration
17.5.5.1 Pre-Filtration Thickener
Cyanide destruction tailings from the CN destruction tanks report to the CN destruction tailings pumpbox where the tailings are pumped by the CN destruction tailings transfer pumps to the pre-filter thickener. The thickener overflow reports to the pre-filter thickener overflow tank and is then pumped by the pre-filter thickener overflow pumps to the CN destruction feed distributor box. The thickener underflow is pumped by the pre-filter thickener underflow pumps to the tailings distributor box which distributes the slurry to three tailings stock tanks.
Similar to the pre-leach thickener and CN recovery thickener, the pre-filter thickener is a high-rate unit with an adjustable rake height where a flocculant is added to the thickener feed well to increase the solids density to at least 50% w/w solids ahead of the filtration circuit in order to minimize the pressing time in the filters.
17.5.5.2 Filtration
The filtration circuit includes three parallel trains of filter presses; each train includes four filter presses, each with dedicated feed pumps and compressors. In total it is projected that ten duty filters units will be required, and two filter units will act as standby. A set of three tanks,

K I Ş L A D A Ğ M I L L I N G P R O J E C T , T U R K E Y
T E C H N I C A L R E P O R T
2018 Final Report Page 17-9
one of each train, feeds the filter presses with a residence time of 2.0 hours each. The distribution box contains dart valves that can be used to direct flow of slurry to various tailings stock tanks which is further pumped to the filter presses via the tailings stock tank pumps. The tailing slurry is pumped to each plate and frame filter press for dewatering on a batch basis and the filtrate reports to the tailings filtrate tank where the filtrate is pumped to the clarifier feed tank.
The tailings filter cake discharges from the filter presses onto the tailings filter press discharge belt feeders. The belt feeders will feed either the filter cake discharge conveyor or the tailings filter cake off-spec discharge conveyor. The filtration cycle time is estimated to be around 14 minutes, which includes feeding, cake pressing, cake drying by air blow, cloth wash, and technical time (cake discharge and plate stacking). The target filter cake moisture is 14.0 ~ 18.0% w/w subject to various tailings properties. The spillage or settled filtrate from the off-spec stockpile will be collected in the area sump and be pumped back to the tailings distributor box by the off-spec return sump pump as required.
17.5.5.3 Filtrate Clarifier
Filter filtrate is collected in the clarifier feed tank, which is then either used as dilution water to various areas or directed to the tailings filter filtrate clarifier. The tailings filter filtrate clarifier is a high-rate unit with an adjustable rake height and is used to settle out the fine solids in the filtrate stream, producing a low suspended solids supernatant which is used for filter washing duties. The clarifier overflow also gravity flows to the tailings filter area process water tank where the tank supplies dilution water for the CN destruction circuit and cloth wash water for the filter presses.
The water for the filter press wash water is supplied in low pressure from the low pressure cloth wash water pumps and high pressure from the high pressure cake wash water pumps. The clarifier underflow slurry is returned to the tailings distributor box where it will be sent through the filter presses for filtration.
17.5.6 Filtered Tailings Material Handling The filter cake that discharges on to the filter cake discharge conveyor will be transported to the tailings filter cake transfer conveyor which will discharge the filter cake onto the existing crushed ore conveyor to the dry stack tailings stockpile. The off-spec filter cake, which contains a higher than optimum moisture content, discharges on to the tailings filter cake off-spec discharge conveyor and is transported to the off-spec stockpile.
17.5.7 Acid Wash and Elution
17.5.7.1 Acid Wash
Acid soluble contaminants which have loaded onto the carbon are dissolved in an acid washing stage. The loaded carbon from CIP tanks is recovered on the loaded carbon screen
K I Ş L A D A Ğ M I L L I N G P R O J E C T , T U R K E Y
T E C H N I C A L R E P O R T
2018 Final Report Page 17-10
and directed to an acid wash column with 15.0 t carbon capacity. Hydrochloric acid is diluted with fresh water in an in-line mixer to provide the required acid wash solution concentration, and then injected into the acid wash column. The acid solution is circulated through the acid wash column at two bed volumes (BVs) per hour and in the end, discharged to the CN destruction feed distributor box. If there is a significant amount of gold in the acid effluent, it will be neutralized separately, and then forwarded to CIP circuit.
Following acid solution contact, the carbon is rinsed with fresh water to remove residual acid in the carbon column. After a period of recirculation, the acid solution is drained back to the acid solution circulation tank. Washed carbon is then transferred to the elution column using pressurized transport water supplied by the transport water pump.
17.5.7.2 Elution
A pressure Zadra elution circuit has been selected for stripping of gold and silver from loaded carbon. In the elution stage, a weak sodium hydroxide and sodium cyanide solution circulates by upward flow through a stationary bed of loaded carbon at a flow rate of about two BVs per hour at temperature about 140°C. At that temperature, gold on the carbon is desorbed. Gold is recovered from the pregnant strip solution by electrowinning. The gold depleted solution is then re-heated and recycled to the elution column for additional stripping.
It is expected that a pre-elution copper stripping stage may be required whereby a portion of the warm weak sodium hydroxide and sodium cyanide solution is pumped through the column, recirculated for a period of time, and then discharged to the cyanide destruction circuit. If there is a significant amount of gold in the effluent, it will be neutralized separately, and then forwarded to CIP circuit.
The Zadra elution system comprises an elution column, elution solution tank, elution solution pump, an elution treated water tank/pump and an elution heater package. An indirect contact strip solution heater is designed to increase the temperature of strip solution up to 140°C for the stripping cycle. Also, an elution recovery heat exchanger ensures that nominal temperature of pregnant solution directed to the electrowinning cells is below boiling to prevent flashing.
This equipment operates in a closed loop with six re-commissioned electrowinning cells located inside the KCTP gold room. The pregnant and barren solution streams will be pumped between the new ADR plant and the re-commissioned electrowinning cells in a contained pipe trench with flow meters positioned at both ends for leak detection.
17.5.8 Carbon Regeneration After completion of the elution process, stripped carbon is hydraulically transferred from the elution column to the eluted carbon dewatering screen. The screened carbon is fed into the eluted carbon tank then metered into the carbon regeneration kiln. The carbon regeneration

K I Ş L A D A Ğ M I L L I N G P R O J E C T , T U R K E Y
T E C H N I C A L R E P O R T
2018 Final Report Page 17-11
kiln is typically propane-fired, and is a horizontal, rotary unit designed to regenerate 100% of the stripped carbon.
Regenerated carbon discharges by gravity from the kiln to a quench tank to cool down and is then transferred via recessed impeller transfer pump to the carbon sizing screen. The barren carbon is screened and reports to the last tank in the CIP circuit. Fine carbon is collected, stored and then sold.
17.5.9 Electrowinning and Goldroom The electrowinning and goldroom will use existing KCTP facilities; the following circuit describes the operation.
Cathode sludge and cell floor sludge are drained from the electrowinning cell to a sludge hopper. A positive displacement pump feeds a plate and frame filter. The pressed filter cake (gold/silver sludge) is loaded from the sludge filter into trays on an electrowinning sludge trolley. The trays are then moved into the gold room drying oven, which heats the sludge to remove the entrained moisture.
The dried and cooled sludge is combined with fluxes (silica, nitre, borax and sodium carbonate) in a flux mixer. The fluxes are manually added to the flux mixer after they are weighed. The sludge-flux mix is then direct smelted in an induction furnace. The fluxes react with iron, base metals and other unwanted elements to form a low viscosity, free flowing molten slag, while gold and silver remain as a molten metal.
The gold doré is poured into molds on a cascade pouring table. The slag (non-precious metal compounds) is separated from the precious metal and collected in slag trays at the bottom of the cascade tables. The doré bars solidify and are quenched in water, cleaned to remove slag, weighed, stamped for identification, sampled for analysis and stored in a safe while awaiting dispatch.
17 .6 P L AN T S E R V I C E S
17.6.1 Water
17.6.1.1 Fresh Water
Fresh water will be tied into the existing fresh water network, stored in the fresh water tank, and pumped to the plant.
Fresh water in the tank is used to supply to the following services:
• Reagent preparation water. • Slurry pumps gland seal water. • Make-up water for the process water system. • Carbon acid wash, elution and rinsing.

K I Ş L A D A Ğ M I L L I N G P R O J E C T , T U R K E Y
T E C H N I C A L R E P O R T
2018 Final Report Page 17-12
• Safety showers and eyewash station.
17.6.1.2 Potable Water
Potable water will be delivered to site and used as needed in the ablution blocks.
17.6.1.3 Gland Water
Water for the pump gland water system is supplied by fresh water from the fresh water tank. The water is collected in the gland seal water tank and distributed to each slurry pump by the gland seal water pumps in a duty/standby configuration.
17.6.1.4 Process Water
Process water is stored in three different plant areas; grinding is fed by pre-leach thickener overflow, detoxification is fed by CIP tailings thickener overflow, and lastly tailings is fed by tailings filtrate. All three will use fresh water makeup as required. Each process water tank supplies the process water pumps, in a duty/standby configuration, to non-cyanide consumption points in grinding, leaching and flocculant addition.
17.6.2 Compressed Air
17.6.2.1 Blower Air
The blowers will supply low pressure process air to the pre-aeration tank, cyanide leach tanks, CIP tanks and CN destruction tanks. Each leach and cyanide destruction train will have a dedicated blower fan, with one common standby fan which is able to supply process air to any of the four usage points.
17.6.2.2 Plant & Instrument Air
Rotary screw air compressors will provide high pressure compressed air operating in lead-lag mode, to meet the demand for plant and instrument air requirements. Plant air will be stored in the plant air receivers to account for variations in demand prior to being distributed throughout the plant. Instrument air will be dried in an instrument air dryer before being stored in the instrument air receivers and distributed throughout the plant.
A remote stand-alone air system will be located in the crushing area to provide plant and instrument air requirements. This system will be equipped with its own dedicated air dryer and receiver.
17.6.2.3 Power
Turkish Electricity Transmission Corporation (TEIAS) distributes electrical power to the Kışladağ site via a 27.7 km long 154 kV from the Uşak industrial zone. The main transformer at site is rated at 100 MVA with enough spare capacity to supply the proposed mill installation. The voltage is stepped down to 35.5 kV for site distribution. In localized areas voltage is

K I Ş L A D A Ğ M I L L I N G P R O J E C T , T U R K E Y
T E C H N I C A L R E P O R T
2018 Final Report Page 17-13
further stepped down to 6.6 kV, feeding electrical rooms, medium voltage distribution, or small switchgear. Power is distributed via overhead power lines with some underground cables in the process and ancillary areas.
The Turkish national power utility company (TEDAS) also distributes electrical power to the Kışladağ site via a 25 km long 34.5 kV transmission line from the Uşak industrial zone.
The new processing circuits will be supplied by new electrical rooms located adjacent to each major area.
17 .7 P R O C E S S C O N S U M AB L E S , R E AG E N T S AN D C H E M I C AL S
17.7.1 Lime Finely crushed quicklime is supplied by bulk trucks and is off-loaded into the storage silo. The lime will be fed into the lime slaker by the lime screw feeder using a rotary valve. Clean water is added to the slaker to produce a 20% w/w slaked lime strength. Once the mixing cycle is complete, the milk of lime is transferred to the lime hopper and pumped to the lime storage tank.
The slaked lime slurry is used as a pH modifier and is pumped by the lime distribution pumps to various dosing points in the plant via a ring main with the balance of unused lime discharging back into the lime storage tank. Spillage collected in the lime mixing bund is pumped to the lime mixing tank by the lime area sump pump.
17.7.2 Sodium Cyanide Sodium cyanide is used as a gold lixiviant and will be shipped in briquette form by road to site in 1.0 tonne bulk bags which are boxed. The boxes will be offloaded by forklift and stored in a limited access cyanide storage facility that is part of the cyanide mixing facility. Alternatively, cyanide may be supplied by a 20 t solid-to-liquid container, as is currently the case. The exact specifications on cyanide shipping form will be further developed in the next study phase.
Cyanide bulk bags will be lifted out of the boxes using a cyanide area hoist and loaded into the cyanide mixing tank, already partially filled with water and buffered with sodium hydroxide, by way of a bag splitter. Once the briquettes are added, water is added to the agitated tank to produce a solution concentration of 30% w/w.
To use the 20 t solid-to-liquid containers, a dedicated mixing facility will be installed that flushes the containers and stores the cyanide solution, without any operator contact taking place.
The mixed solution is transferred to the cyanide holding tank by the sodium cyanide transfer pump. The cyanide solution is pumped by the sodium cyanide ringmain pumps to dosing
K I Ş L A D A Ğ M I L L I N G P R O J E C T , T U R K E Y
T E C H N I C A L R E P O R T
2018 Final Report Page 17-14
points in leaching and elution. Spillage collected in the cyanide mixing bund is pumped to the cyanide holding tank by the cyanide area sump pump.
17.7.3 Copper Sulphate Copper sulphate (CuSO4.5H2O) is supplied in 1.0 tonne bulk bags. It will be shipped by road to site, offloaded by forklift and stored in the reagents storage area adjacent to the reagents mixing facility.
The bulk bags will be lifted by the copper sulphate area electric hoist and loaded into the copper sulphate mixing tank partially filled with fresh water, by way of a bag splitter. The solution is made up to a concentration of 20% w/w, and then transferred to the copper sulphate distribution tank by the copper sulphate transfer pump. The copper sulphate solution is pumped by the copper sulphate distribution pumps to dosing points in the CN destruction circuit. Spillage collected in the copper sulphate mixing bund is pumped to the copper sulphate mixing tank by the copper sulphate area sump pump.
17.7.4 Sodium Metabisulphite Sodium Metabisulphite (Na2S2O5), also known as SMBS, is the source for SO2 in the SO2/Air process and will be supplied in 1.0 tonne bulk bags. It will be shipped by road to site, offloaded by forklift, and stored in the reagents storage area adjacent to the reagents mixing facility.
The bulk bags will be lifted by the SMBS area electric hoist and loaded into the SMBS mixing tank partially filled with fresh water, by way of a bag splitter. Water is added to the agitated tank to produce a solution concentration of 20% w/w. The mixed solution is transferred to the SMBS storage tank by the SMBS transfer pumps. The SMBS solution is pumped by the SMBS distribution pumps, configured as one duty, one standby, to dosing points in the CN destruction circuit. Spillage collected in the SMBS mixing bund is pumped to the SMBS mixing tank by the SMBS area sump pump.
17.7.5 Caustic Soda Sodium hydroxide (NaOH), also known as caustic soda, is used as a pH modifier for carbon elution and cyanide solution preparation and will be supplied in bulk by tanker truck in liquid form. The truck will unload the liquid into the caustic holding tank. The solution is supplied typically at 32% w/w in summer months and 27% w/w in winter months. It is pumped by the caustic ring main pumps, to dosing points in elution, electrowinning, and cyanide mixing. Spillage collected in the caustic mixing bund is pumped to the caustic mixing tank by the caustic area sump pump.

K I Ş L A D A Ğ M I L L I N G P R O J E C T , T U R K E Y
T E C H N I C A L R E P O R T
2018 Final Report Page 17-15
17.7.6 Hydrochloric Acid Hydrochloric Acid (HCl) is used in the elution circuit and is supplied in bulk by tanker truck in liquid form at 33% w/w. The truck will unload the liquid into the hydrochloric acid at 33% storage tank. The acid from the 33% storage tank is dosed into the hydrochloric acid 10% storage tank where the acid is diluted to approximately 10% prior to being added to the required process circuits by the hydrochloric acid pumps.
17.7.7 Flocculant Due to the distance between each of the thickeners on site, each thickener will have its own dedicated flocculant mixing system and supply. There are four flocculant systems supplying flocculant to the pre-leach thickener, cyanide recovery thickener, pre-filter thickener and tailings filter filtrate clarifier. Flocculant will be shipped in bulk bag, by road to site, offloaded by forklift, lifted by reagent area electric hoist, and loaded into the flocculant feed hopper by way of a bag splitter.
Flocculant is fed to an eductor by a screw feeder and blown into the flocculant mixing tank where it is mixed with fresh water and diluted to 0.20 - 0.50% w/v (weight/volume). The mixed solution is pumped to the flocculant distribution tank by the flocculant transfer pump. The flocculant solution is pumped by the flocculant distribution pumps (one duty, one standby) to inline mixers at the thickeners where the solution is further diluted to 0.02 - 0.05% w/v.
17 .8 P R O C E S S C O N T R O L P H I L O S O P H Y
17.8.1 General The control philosophy for the Kışladağ milling project is typical of systems employed in mineral processing operations. Field instrumentation provides input to programmable logic controllers (PLC) which are monitored by process control systems (PCS). The PCS system is configured to provide outputs to alarms; control the function of selected process equipment and provide advisory comment to the plant operators. In addition, logging and trending functions are available to assist in analysis of the operating plant data.
The plant is provided with a central control room from which the status of major electrical and mechanical equipment can be monitored and major regulatory control loops can be monitored and adjusted via the operator control station (OCS). Critical safety and equipment protection interlocks are hardwired. Control of process variables is via the OCS or discrete controllers in the field. All electrical drives, which can be started via an OCS, have three faceplate operational modes.
During normal operation, operators have a choice of cascade, auto or manual mode. Cascade mode allows the drive control variable to be set by another controller. This mode allows cascading control loops to function. Auto mode allows for automated sequence control of the drive where control set points can be entered by the operator. Manual mode does not

K I Ş L A D A Ğ M I L L I N G P R O J E C T , T U R K E Y
T E C H N I C A L R E P O R T
2018 Final Report Page 17-16
allow drives to be started in a sequence, but they can still be started via the OCS. Process and safety interlocks are active for all modes.
PLCs are utilized to accept status signals from the electrical switchgear for monitoring drive status conditions on an OCS. Two OCSs will be installed in the main control room comprising two computer screens, keyboard, mouse and printer with an uninterrupted power supply (UPS) system.
17.8.2 Control Philosophy The general control philosophy for the Kışladağ milling project includes:
• Control by the process control system for all areas where equipment requires remote start and stop, sequencing, and process interlocking.
• Vendor PLCs for areas or items that are supplied as complete vendor packages. The vendor PLCs will communicate alarms and status information to the PCS for recording and monitoring.
• Monitoring of operations on the PCS and recording of selected information for data logging and/or trending.
• Control loops in the PCS, except where vendor PLCs directly controls vendor packages.
• Hard-wired safety interlocks for personnel safety. • Software interlocks for process safety and equipment protection start and stop
sequences for certain groups of equipment. • Automation of critical process components and a high level of monitoring to
minimise the possibility of human error. • Uniform architecture, hardware and software configuration throughout all non-
vendor controlled equipment. • A main plant control room with two OCS’s. • An additional control room at the primary crushing station with a single OCS. • An OCS in the plant metallurgist’s office with process viewing and data trending
capabilities only. • Closed-circuit television monitoring of key areas or transfer points.
17.8.3 Process Control System The process control system will consist of a redundant operation station located in the main control rooms which will be located at grinding, elution, and filtration buildings. Other non-redundant control stations will be located in each electrical room.
Process controllers, input/output cabinets, and human-machine interface will be located in electrical rooms or control cabinets as part of the equipment package (e.g. crusher, blower and air compressor systems).

K I Ş L A D A Ğ M I L L I N G P R O J E C T , T U R K E Y
T E C H N I C A L R E P O R T
2018 Final Report Page 17-17
Communication between the processor and remote input/output cabinet will be redundant; communication with other equipment, such as the package controller, motor control center (MCC), and switchgear will be non-redundant.

K I Ş L A D A Ğ M I L L I N G P R O J E C T , T U R K E Y
T E C H N I C A L R E P O R T
2018 Final Report Page 18-1
SECTION • 18 PRO JEC T INFR AS TRUC TURE
18 .1 S I T E LO C AT I O N The Project is located on the western edge of the Anatolian Plateau at an elevation of approximately 1,000 m. Local elevations range from a peak of 1,300 masl (Kişla Dağ) to a valley of 700 masl. The crushing plant UTM location is N 4262000 and E 688200, approximately 2 km north of the village of Gümüşkol.
18 .2 S I T E I N F R AS T R U C T U R E The project area at the end of mine life is presented on Figure 18-1.
18.2.1 Plant The crushing plant is adjacent to the open pit and the administration buildings are located on ground level between the pit and the crushing plant.
The new milling facility will be immediately adjacent to the crushing plant on the east side. Unit operations are described in Section 17.
18.2.2 Heap Leach and Mill Tailings Facilities The leach pad facility is 300 m north of the plant site. The leach-pad is located on the western toe of Kişla Dağ (Kişla Mountain) and bounded on the west side by the main basin drainage course. The leach pad extends northwards, approximately 2.4 km.
A new dry stacked tailings facility and collection ponds will be constructed approximately 600 m north of the current heap leach area and will be accessed by a new overland conveyor connected to the current conveyor along the east side of the leach pad.
Construction of the dry stacked facility will be similar to the existing heap leach facility and dry stacked facility at Eldorado’s Efemçukuru operation in Turkey. The liner system will consist of a compacted clay bed and high-density polyethylene (HDPE) liner to form a double liner. Portions of the downstream toe will be buttressed with an oxide rock berm to increase stability and reduce the overall footprint. The approximate life-of-mine footprint to accommodate the berms and 120 Mt of tailings will be 1.6 km2.
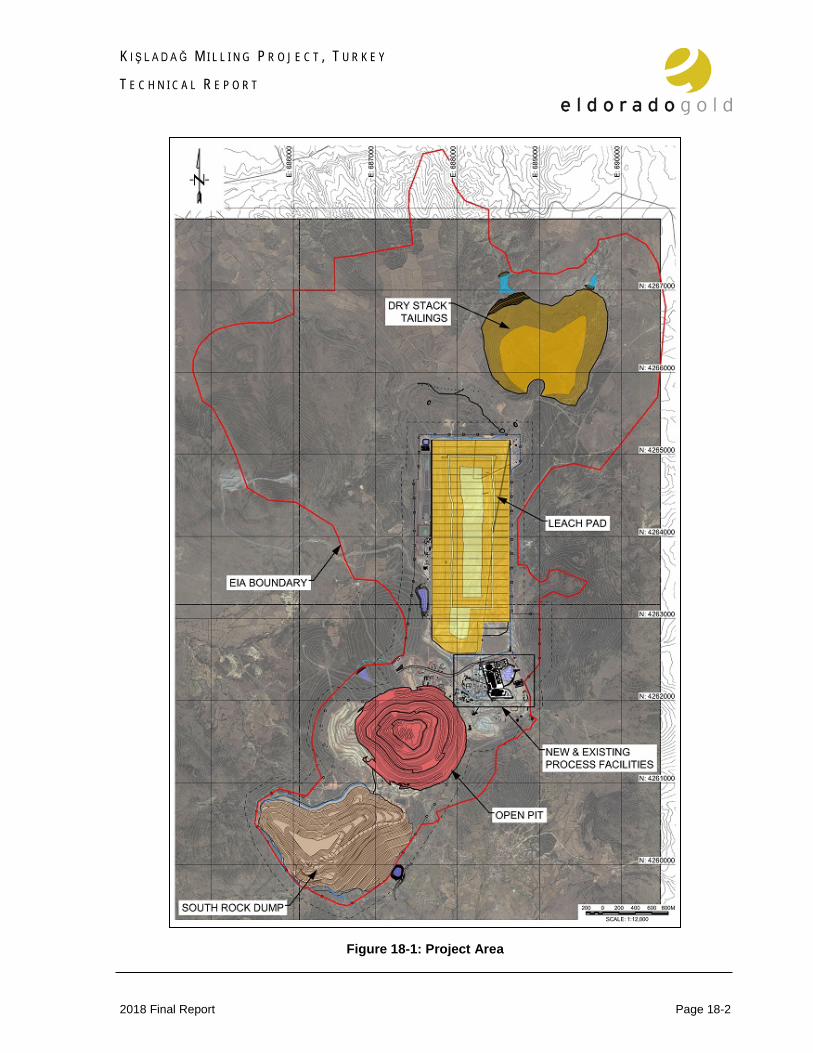
K I Ş L A D A Ğ M I L L I N G P R O J E C T , T U R K E Y
T E C H N I C A L R E P O R T
2018 Final Report Page 18-2
Figure 18-1: Project Area

K I Ş L A D A Ğ M I L L I N G P R O J E C T , T U R K E Y
T E C H N I C A L R E P O R T
2018 Final Report Page 18-3
18.2.3 Rock Disposal Site The south rock dump (SRD) is centered about 1 km southwest of the open pit, within the headwater area of a small valley drained by an intermittent stream. The rock dump holds approximately 180 Mt of waste rock with additional permitted capacity of 100 Mt. Studies have shown capacity can be increased to 155 Mt within the permit boundaries; oxide rock will also be required for tailings buttress and other construction activities. Concept studies are ongoing to potentially expand for additional capacity totaling 200 Mt.
A new north rock dump on the mountain west of the leach pad was permitted during Phase IV with a capacity of 900 Mt. Options will be further assessed against the current mine plan during the next phase.
18.2.4 Site Security A 2 m high fence has been installed along the property boundary and controls access to the mine site. There is one main access gate, which includes a gatehouse and a secondary gate near the ancillary buildings, both are manned 24 hours per day. Additional security fencing has been erected around the ADR plant and solution ponds, electrical substations, reagent, and explosives storage areas. Additional fencing will be added to encompass the tailings management facility during construction.
18.2.5 Access Road The access road is a paved road approximately 5.3 km long, 10 m wide connecting the mine site to the regional road from Ulubey to Esme. The upper portion of the road east of the pit is being relocated to accommodate a larger pit perimeter. The realignment will be completed early in 2018.
A portion of a village road connecting the villages of Gümüşkol and Katrancilar has been replaced by a new road, approximately 1.9 km long, constructed to bypass the crushing facilities and includes an underpass that can accommodate large mining trucks.
18.2.6 Water Supply Fresh water for the Project is supplied from a well field located approximately 13 km to the east of the plant site, in Neogene limestones. Five wells are in operation. Two water storage tanks and an underground distribution system at site provide the capacity for process and non-potable water requirements; a portion of the tank capacities is dedicated to fire protection.
In 2017 a new dam (Gedikler Dam) was constructed by Tüprag in conjunction with the General Directorate of State Hydraulic Works (DSI) approximately 6 km south south-west of the process plant. Kışladağ will be allotted a portion of the annual collection from the dam to supplement the well systems. A pumping station and pipe line have already been constructed between the dam and the one of the non-contact water collection ponds adjacent to the heap leach pad.

K I Ş L A D A Ğ M I L L I N G P R O J E C T , T U R K E Y
T E C H N I C A L R E P O R T
2018 Final Report Page 18-4
18.2.7 Power Supply Two power lines distribute power to site. Turkish Electricity Distribution Corporation (TEDAS), distributes electrical power to the Kışladağ site with a 25 km long 34.5 kV transmission line from the Uşak industrial zone, Turkish Electricity Transmission Corporation (TEIAS) distributes electrical power to the Kışladağ site with a 27.7 km long 154 kV transmission line from the Uşak industrial zone. The main substation at site is rated at 100 MVA with three 50 MVA 154 / 34.5 kV power transformers (one cold spare). The substation currently has abundant spare capacity and will require only minor modifications to accommodate the additional load associated with the milling expansion. Site distribution is at 34.5 kV, and in local areas at 6.6 kV or 0.4 kV, which is distributed locally via overhead power lines and underground cables in process areas and near buildings.
18.2.8 Ancillary Buildings The permanent mine buildings have been designed and constructed by local Turkish contractors. The architecture of the facilities includes local building materials and methods compatible with the surrounding infrastructure.
18.2.8.1 Warehouse
The original workshop/warehouse (760 m2) was constructed with the first phase of the crushing plant in 2006. Subsequently a separate maintenance workshop was built and a portion of the facility was converted to increased warehouse space, control room, and department offices. An adjacent outdoor fenced area together with covered area has been constructed for storage of large equipment and miscellaneous reagents. A diesel depot for dispensing fuel to small vehicles has been included. A new fabric covered warehouse was constructed in 2016 and provides 4,000 m2 of additional covered storage with added outdoor fenced storage near the proposed mill site.
18.2.8.2 Maintenance Workshop
A maintenance workshop (780 m2) has been constructed and includes an electrical workshop, an instrument workshop, tool storage, a security store, offices, storage space for maintenance items, washroom, locker and change room. An overhead traveling crane has been installed inside the main workshop. Outside paved areas have been provided for work areas and storage.
Earlier, the mining contractor established their own temporary facilities to service their mining fleet.
18.2.8.3 Mine Truckshop
The mine truckshop complex (1,850 m2) has been constructed and designed to service the fleet of mining trucks. An addition was added in 2013 to accommodate the new 200 tonne truck fleet. The complex includes five indoor heavy equipment repair bays equipped with an overhead traveling crane, a covered outdoor service bay, and an outdoor wash bay equipped with an oil/water separator. A general repair area and a welding shop have also been included in the complex. A three-story annex to the truckshop houses a mechanical room and office space. In addition, another two story annex for change room and washroom was added.

K I Ş L A D A Ğ M I L L I N G P R O J E C T , T U R K E Y
T E C H N I C A L R E P O R T
2018 Final Report Page 18-5
18.2.8.4 Administration Building
The administration building (400 m2) is a single story building and includes general areas for engineering, geology and administration personnel plus seven individual offices for management personnel.
18.2.8.5 Mine Dry and Canteen
The mine dry and canteen (540 m2) is a single story concrete building. The canteen has been equipped with a kitchen area and a seating area for 72 people and includes a covered, enclosed patio that can seat a further 60 diners. Washrooms, shower facilities, and clean and dirty lockers are provided in the mine dry area. Additional space is provided for five offices and a meeting room.
18.2.8.6 Mine Dry (Process)
A new mine dry will be constructed during the project for the additional processing personnel. The building will house washrooms, shower facilities, and clean and dirty lockers, the building will be a single story facility approximately 500 m2.
18.2.8.7 Assay Laboratory Building
The assay laboratory building (440 m2) houses the assay laboratory rooms, assayers and assistants’ offices, washrooms for personnel, and storage rooms. The assay laboratory is capable of handling 550 samples per day. It includes sample preparation, acid digestion, atomic absorption finish, fire assay, and a wet laboratory. An additional metallurgical laboratory area has been added to support additional testing inside the cyanide storage facility.
18.2.8.8 Health and Security Building
The health and security building (86 m2) provides three consulting and treatment rooms for the mine’s doctor, toilets, and separate attached office for the security contractor’s manager.
18.2.8.9 Environment and Safety Building
The environment and safety building (470 m2) provides office accommodation, meeting room, small laboratory, toilets and tea room facilities for environment, safety and process engineering management personnel.
18.2.8.10 Public Relations Building
At the main entrance gate a new public relations building (210 m2) provides office accommodation, reception room, toilets, and tearoom facilities.
18.2.8.11 Gate House
A new gate house is provided for security guards on duty controlling the main entrance. The facility also provides meeting rooms and locker space for security personnel.
K I Ş L A D A Ğ M I L L I N G P R O J E C T , T U R K E Y
T E C H N I C A L R E P O R T
2018 Final Report Page 18-6
18.2.8.12 Miscellaneous Prefabricated Buildings
Miscellaneous prefabricated buildings provide additional office accommodation, washroom facilities, storage rooms, and work areas for the construction management team, geology core logging and storage, safety rescue and demonstration, laundry, archives, and a prayer room.
Operations personnel reside in the surrounding towns and villages and there are no plans to erect a permanent camp for operations personnel or temporary construction camps. Personnel are transported to the site by buses. During construction, contractors will be responsible for providing their workforce with accommodation and transportation.
18.2.8.13 Sewage
Sewage systems on site include an underground sewer reticulation system which connects all the buildings to a treatment plant, with a capacity of 120 m3/d. A new sewage treatment plant will be installed near the new process facility to service the new dry and the contractor facilities.
18 .3 W AT E R M AN AG E M E N T
18.3.1 Water Collection and Treatment The site is bounded by a series of collection ditches to divert non-contact water around the site to reduce the volume of contact water.
All contact water is collected from the mine site and pit inflows and sent to collection ponds at the treatment plant. The treatment plant is located north of the existing ADR plant with a capacity of 625 m3/hr.
On site there are numerous ponds to collect process streams (barren and pregnant solutions at the ADR plant), contact water, non-contact water, and surge ponds for storm events. The ponds were sized based on a 100-year storm event with additional capacities for storage and process surges.
18.3.2 Water Requirements Water balance for the milling process requires an inflow of approximately 300 m3/hr. Water for the process will come from the fresh water systems including the well fields and Gedikler dam; and will be supplemented with water from the treatment plants and contact water ponds. A full water balance will be conducted during the next phase but based on the current systems and operating conditions there are no additional water requirements beyond the existing infrastructure.

K I Ş L A D A Ğ M I L L I N G P R O J E C T , T U R K E Y
T E C H N I C A L R E P O R T
2018 Final Report Page 19-1
SECTION • 19 M AR KET STUDIES AN D CONTR AC TS
19 .1 M AR K E T S
19.1.1 Market Studies Eldorado is currently selling gold from the Kişladağ operation, hence Eldorado has not performed any formalized marketing studies in respect to future Kişladağ gold production. Gold is currently sold on spot market via Turkish refiners by Tüprag’s internal sales department. During 2017 Kişladağ sold gold at an average realized selling price of US$1,258 per troy ounce.
As per the new mining code put into effect in August 2017, as of January 2018, the Turkish Central Bank has the right to purchase all gold produced at the site at LME spot prices.
19.1.2 Price The price of gold is the largest single factor in determining profitability and cash flow from operations. Therefore, the financial performance of the project has been, and is expected to continue to be, closely linked to the price of gold. Reserves and resources have been modelled at a gold price of US$1,200 per troy ounce.
19 .2 CO N T R AC T S Kişladağ has no contracts for gold sales or hedging in place. Gold is sold at spot price. Currently Kişladağ has contracts and purchase agreements that are in place including cyanide, diesel, explosives and leasing of forestry land; and service contracts for security and catering.
19 .3 T AX E S Corporate taxation for Turkish businesses is currently 22% up to the year of 2020. In the year of 2021, the rate will be reduced to 20%. Depreciation is based mostly on a unit-of-production calculation in international financial reporting standards (IFRS) recording. Turkish lira depreciation is based on government’s depreciation list and this is mainly 10% for mine assets. An investment tax incentive available in Turkey has been applied to the economic analysis. The incentive allows for 40% of applicable capital costs spent on new production facilities to be applied as an incentive value where the taxable income is taxable at a reduced rate of 4.0% until the total value of tax savings equals the incentive value. The incentive value can be carried forward; after the incentive value is utilized, the 20% corporate taxation rate is applied.
K I Ş L A D A Ğ M I L L I N G P R O J E C T , T U R K E Y
T E C H N I C A L R E P O R T
2018 Final Report Page 20-1
SECTION • 20 ENVIR ONM ENT AL ST UDIE S, PERM ITT ING AND SOCI AL OR COM M UNITY IM P AC T
20 .1 B AS E L I N E C O N D I T I O N S Initial baseline studies were been performed relating to Kışladağ, between 2000 and 2002, the combination of these studies defines the initial environmental and socioeconomic baseline conditions of the study area.
20 .2 E N V I R O N M E N T AL C O N S I D E R AT I O N S The Kişladağ Project Environmental Impact Assessment (EIA) study was completed in January 2003 and submitted to the Turkish Authorities at the Ministry of Forest and Environment. An Environmental Positive Certificate for the project was subsequently obtained in June 2003. The EIA document presents the baseline conditions and socio-economic effects associated with the development of the Project, and defines the features and measures to mitigate potential impacts.
The EIA considered the potential impact on the local and regional environment as it relates to the following project areas including:
• Open pit workings. • Waste rock impoundment. • Process plant. • Heap leaching facility and solution management • Infrastructure necessary for the Project's operation.
An Environmental Management Plan (EMP) was developed to address the potential impacts of the mining operation addressed in the EIA and additional issues. This plan was put in place prior to pre-production mining starting in 2005 and has been maintained throughout the production phase. The scope of the monitoring program within this plan includes elements of air quality, surface water and ground water monitoring, noise, blast vibration, flora and fauna, social-economy, as well as waste and hazardous waste storage and disposal. Data outlined in the monitoring program have been collected on a monthly basis since the implementation and reported to the relevant government agencies on a quarterly and annual basis.
Tüprag applied and received subsequent EIA amendments in 2011 and 2014 to increase the Kişladağ operations throughput to 12.5 Mtpa and 35 Mtpa respectively.
ENCON Environmental Consultancy Co. authored the full EIA submitted in March 2003 and the subsequent amendments.
Tüprag plans to submit a new EIA in 2018 incorporating the revised process and tailings management plans into the current EIA and EMP.

K I Ş L A D A Ğ M I L L I N G P R O J E C T , T U R K E Y
T E C H N I C A L R E P O R T
2018 Final Report Page 20-2
20 .3 S O C I AL I M P AC T The Kişladağ gold mine employs approximately 82% of its labour force from Uşak and villages surrounding the mine. As an active part of the surrounding communities the mine has completed numerous infrastructure programs within the region including primary schools, water works including the Gedikler Dam, and a 42 classroom building for Uşak University.
K I Ş L A D A Ğ M I L L I N G P R O J E C T , T U R K E Y
T E C H N I C A L R E P O R T
2018 Final Report Page 21-1
SECTION • 21 C AP IT AL AN D OPER AT I NG COS TS The currency exchange rates used are as per Q1 2018 market conditions. All costs are presented in US Dollars (US$) based on the exchange rates shown in Table 21-1.
Table 21-1: Exchange Rates
Currency Code Currency Name Exchange Rate US$ United States Dollar US$1.00 = US$1.00
₺ Turkish Lira US$1.00 = ₺3.80
CAN$ Canadian Dollar US$1.00 = CAN$1.30
€ Euro US$1.00 = €0.833
21 .1 C AP I T AL C O S T S The total project capital cost includes the initial investment cost to obtain commercial production of the mill. Sustaining capital costs are spread out from commercial production throughout the life of mine. Capital costs are summarized in Table 21-2.
The accuracies of the cost estimates are consistent with the standards outlined by the Association for the Advancement of Cost Engineering (AACE). The cost estimate is a prefeasibility-level estimate categorized as AACE Class 4.
Direct costs were developed from a combination of budget quotations, recent contract rates, relevant in-house data, historical benchmarks, and material take-offs. Indirect costs and owner’s costs were estimated in accordance with the project execution strategy, relying on historical benchmarks, first principles calculations, and allowances. Contingency was calculated based on the level of project definition by discipline.
21.1.1 Basis of Estimate
21.1.1.1 Accuracy
An analysis was conducted to confirm and support the initial capital cost accuracy statement. This was accomplished by determining the weighted average deviation of the overall estimate by grouping the costs into the AACE classifications as shown in Table 21-3.
21.1.1.2 Labour
Labour rates were built-up from first principles based on data from recent construction contracts for the Kişladağ operations. The all-in crew labour rates include all direct and indirects costs associated with the contractors. Mobilization and de-mobilization costs are captured separately from the labour rates in the indirect costs.
A labour productivity factor is used to account for the overall labour force efficiency. Non-productive time is estimated based on the expected construction conditions. The overall productivity factor was
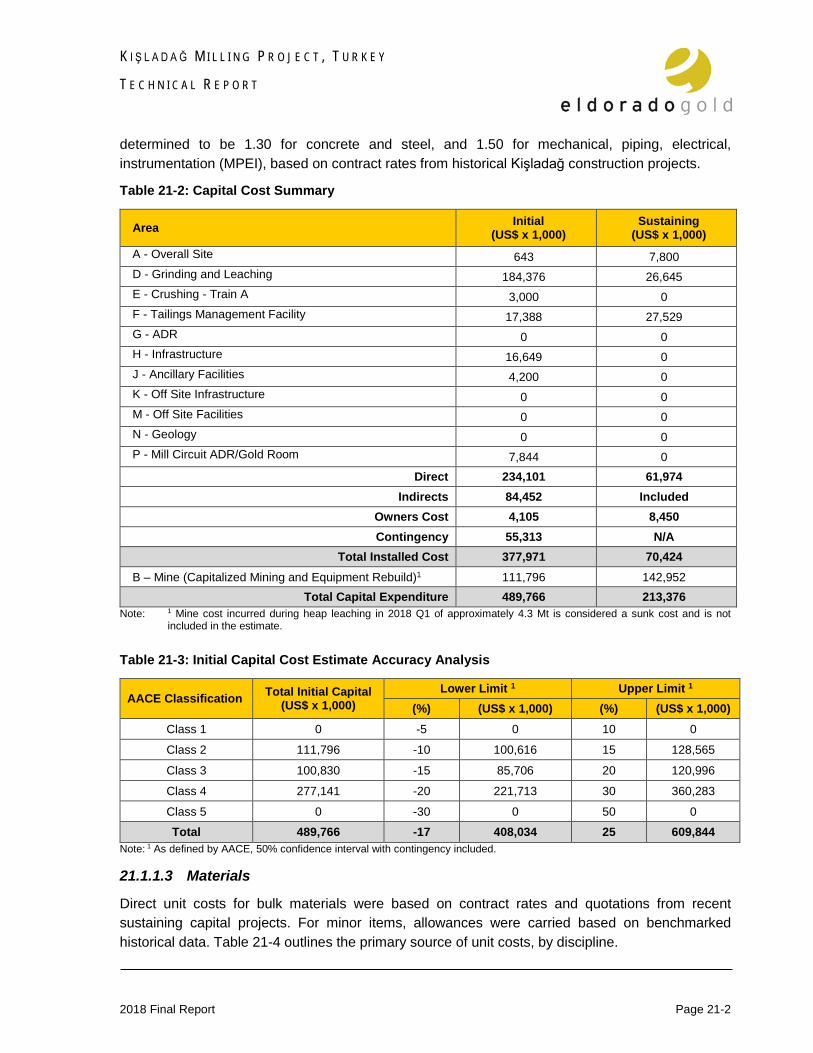
K I Ş L A D A Ğ M I L L I N G P R O J E C T , T U R K E Y
T E C H N I C A L R E P O R T
2018 Final Report Page 21-2
determined to be 1.30 for concrete and steel, and 1.50 for mechanical, piping, electrical, instrumentation (MPEI), based on contract rates from historical Kişladağ construction projects.
Table 21-2: Capital Cost Summary
Area Initial (US$ x 1,000)
Sustaining (US$ x 1,000)
A - Overall Site 643 7,800 D - Grinding and Leaching 184,376 26,645 E - Crushing - Train A 3,000 0 F - Tailings Management Facility 17,388 27,529 G - ADR 0 0 H - Infrastructure 16,649 0 J - Ancillary Facilities 4,200 0 K - Off Site Infrastructure 0 0 M - Off Site Facilities 0 0 N - Geology 0 0 P - Mill Circuit ADR/Gold Room 7,844 0
Direct 234,101 61,974 Indirects 84,452 Included
Owners Cost 4,105 8,450 Contingency 55,313 N/A
Total Installed Cost 377,971 70,424 B – Mine (Capitalized Mining and Equipment Rebuild)1 111,796 142,952
Total Capital Expenditure 489,766 213,376 Note: 1 Mine cost incurred during heap leaching in 2018 Q1 of approximately 4.3 Mt is considered a sunk cost and is not
included in the estimate.
Table 21-3: Initial Capital Cost Estimate Accuracy Analysis
AACE Classification Total Initial Capital (US$ x 1,000)
Lower Limit 1 Upper Limit 1 (%) (US$ x 1,000) (%) (US$ x 1,000)
Class 1 0 -5 0 10 0
Class 2 111,796 -10 100,616 15 128,565
Class 3 100,830 -15 85,706 20 120,996
Class 4 277,141 -20 221,713 30 360,283
Class 5 0 -30 0 50 0 Total 489,766 -17 408,034 25 609,844
Note: 1 As defined by AACE, 50% confidence interval with contingency included. 21.1.1.3 Materials
Direct unit costs for bulk materials were based on contract rates and quotations from recent sustaining capital projects. For minor items, allowances were carried based on benchmarked historical data. Table 21-4 outlines the primary source of unit costs, by discipline.

K I Ş L A D A Ğ M I L L I N G P R O J E C T , T U R K E Y
T E C H N I C A L R E P O R T
2018 Final Report Page 21-3
Table 21-4: Primary Source for Unit Costs
Commodity Primary Source Earthworks Contract Rates Concrete Contract Rates, Local Turkish Supplier Quotations Steel Contract Rates, Local Turkish Supplier Quotations
Process & Ancillary Equipment Major Equipment – Budget Quotations Minor Equipment – Consultant Historical Data
Platework Contract Rates, Local Turkish Supplier Quotations
Piping Straight Run - Contract Rates, Local Turkish Supplier Quotations Process Piping – Factored as % of Mechanical Equipment
(Based on benchmarked data of similar plants)
Electrical
Major Equipment – Budget Quotations Minor Equipment – Consultant Historical Data Bulk Materials – Factored as % of Mechanical Equipment
(Based on benchmarked data of similar plants)
Instrumentation Factored as % of Mechanical Equipment (Based on benchmarked data of similar plants)
21.1.1.4 Material Quantities
Quantities were based on detailed material take-offs and equipment lists, with allowances for minor items that are not substantial in cost. Table 21-5 summarizes the primary source of quantities by discipline.
Table 21-5: Primary Source of Quantities
Commodity Primary Source Earthworks Material take-offs based on Civil 3D modelling
Concrete Material take-offs based on dimensions from general arrangement drawings and experience from similar projects, with design consideration for region’s earthquake zone status
Steel Material take-offs based on dimensions from general arrangement drawings and experience from similar projects, with design consideration for region’s earthquake zone status
Process & Ancillary Equipment Mechanical Equipment List
Platework Material take-offs based on dimensions, previous similar designs, and quantity factors
Piping Straight Run - Material take-offs based on site layout Process Piping – Factored as % of Mechanical Equipment
(Based on benchmarked data of similar plants)
Electrical Electrical Equipment List Bulk Materials – Factored as % of Mechanical Equipment
(Based on benchmarked data of similar plants)
Instrumentation Factored as % of Mechanical Equipment (Based on benchmarked data of similar plants)

K I Ş L A D A Ğ M I L L I N G P R O J E C T , T U R K E Y
T E C H N I C A L R E P O R T
2018 Final Report Page 21-4
21.1.1.5 Indirect Cost Estimate
Indirect costs were primarily factored from direct costs based on historical experience. Table 21-6 summarizes the basis of indirect costs.
Table 21-6: Basis of Indirect Costs
21.1.1.6 Owner’s Costs
Owner’s costs included labour and general and administrative costs for the owners team during the period of active construction applied over a specified period of time. An allowance for insurance, bonds, land acquisition, owner’s construction management (CM) staff, and pre-operations training were included in the estimate. Table 21-7 summarizes the basis of owner’s costs.
No inclusions were made for corporate office costs.
Table 21-7: Basis of Owner’s Costs
Commodity Primary Source Insurance and Bonds Allowance based on in-house data Land Acquisition Budget for pre-production period Owner’s CM Team First principles build-up of manpower requirements and expenses Pre-Operations Training 3 months training for 183 personnel and operational readiness program
Site Office Expenses Allowances for modular office building for Owner’s and CM team, furnishings, general IT expenses, and general office expenses.
Area Primary Source
Q – Construction Indirects
Field indirect costs were factored from direct costs, base on historical experience, revised for site specific assumptions. Travel and Accommodation – it was assumed that most contractors will not be local and travel and accommodation must be provided. Freight and logistics costs were calculated as a percentage of equipment and material supply cost. Ocean freight and inland freight were costed separately. Vendor representatives’ costs were factored from mechanical and electrical equipment supply costs. Daily allowances for contractor’s living out allowances, site bussing, and on-site catering have been included in the estimate. Living out allowance costs have been calculated based on assessment of current accommodation and living costs.
R – Spares/First Fills
Capital and commissioning spares were calculated as a percentage of equipment supply cost based on historical data. Process first fills required for start-up were estimated based on consumption rates in accordance with the Process Design Criteria, with unit costs referenced primarily from recent quotations. Equipment first fills were factored from the plant equipment supply.
S – Engineering, Procurement, Construction Management (EPCM)
EPCM estimate was provided by the primary consultant for the processing facility. Allowances have been made for engineering of the Rock Dump, Tailings Management Facility, and the mine.

K I Ş L A D A Ğ M I L L I N G P R O J E C T , T U R K E Y
T E C H N I C A L R E P O R T
2018 Final Report Page 21-5
21.1.1.7 Sustaining Capital Costs
Sustaining capital costs were calculated based on annual averages of past Kişladağ actual costs. Table 21-8 summarizes the basis of the sustaining capital costs.
Sustaining costs were ramped down in the final three years of production, to 80% in 2027, to 30% in 2028, and zero costs incurred in 2029.
Table 21-8: Basis of Sustaining Capital
Commodity Primary Source
Mining
Allowance of US$2.0 M per annum based on historical annual costs for mine improvement projects and studies. Capitalized mining costs calculated from first principles based on actual Kişladağ mining productivities, haulage simulations, and unit rates.
Mining Equipment Rebuild Rebuild cost is calculated based on a rate of US$0.15 per tonne mined. This rate was based on historical averages at the Kisladag mine.
Process
Allowance of US$1.2 M per annum based on historical annual costs for process improvement projects for the existing crushing circuit. Additional mill maintenance of cost of US$2.9 M per year was included based on assumption of 3% of mechanical equipment supply costs.
Dry Stacked Tailings Dry stacked tailings costs were estimated from first principles based material take-offs for the Tailings Management Facility (TMF). Quantities were separated by phases, based on the production schedule.
General and Administrative G&A sustaining costs of US$1.3 M per annum was included based on historical average costs for the environmental, administration, general manager, health and safety, and finance departments.
Other Sustaining Construction Construction sustaining allowance of US$1.2 M per annum was included based on historical average costs for management of other minor projects during the operational years.
21.1.1.8 Contingency
Contingency was calculated at a summary level by each discipline. A percentage was applied for each discipline depending on the level of project definition and reliability of the cost information.
Contingency for pre-stripping was built into the mining unit rates.
For sustaining capital, contingency was built into the unit rates for the construction of the tailings management facility. No contingency was applied to other sustaining capital as they are rounded-up historical averages.
Contingency for the capital cost estimate was calculated to be 17.3% of applicable costs. 21.1.1.9 Exclusions
The following costs and scope were excluded from the capital cost estimates:
• All facilities not identified in the summary description of the project.
K I Ş L A D A Ğ M I L L I N G P R O J E C T , T U R K E Y
T E C H N I C A L R E P O R T
2018 Final Report Page 21-6
• Fees or royalties relating to use of certain technologies or processes. • Force majeure. • Working capital other than capital and commissioning spares as well as first fills. • Operating spares. • Environmental bonding. • Environmental and ecological considerations other than those incorporated in the design. • Financing charges and interest during construction. • Currency exchange fluctuations after Q1 2018. • Recoverable value added taxes (VAT). • Sunk costs. • Escalation.
21 .2 O P E R AT I N G C O S T S The operating cost estimate was developed based on a combination of actual annual costs for the crushing circuit and existing infrastructure, and from first principles for the new milling-leach plant.
Operating costs include allocations for:
• Mining. • Processing.
o Crushing (existing circuit) o Processing o Tailings filtration and management o Infrastructure (existing water, power, road, and other site maintenance)
• General & administration. • Transport and refining.
Operating costs were calculated for each year of operation, totalling average of US$181.4 M per annum for an average of US$14.13/t ore over life-of-mine, summarized in Table 21-9. No contingency was included for the operating cost estimate.
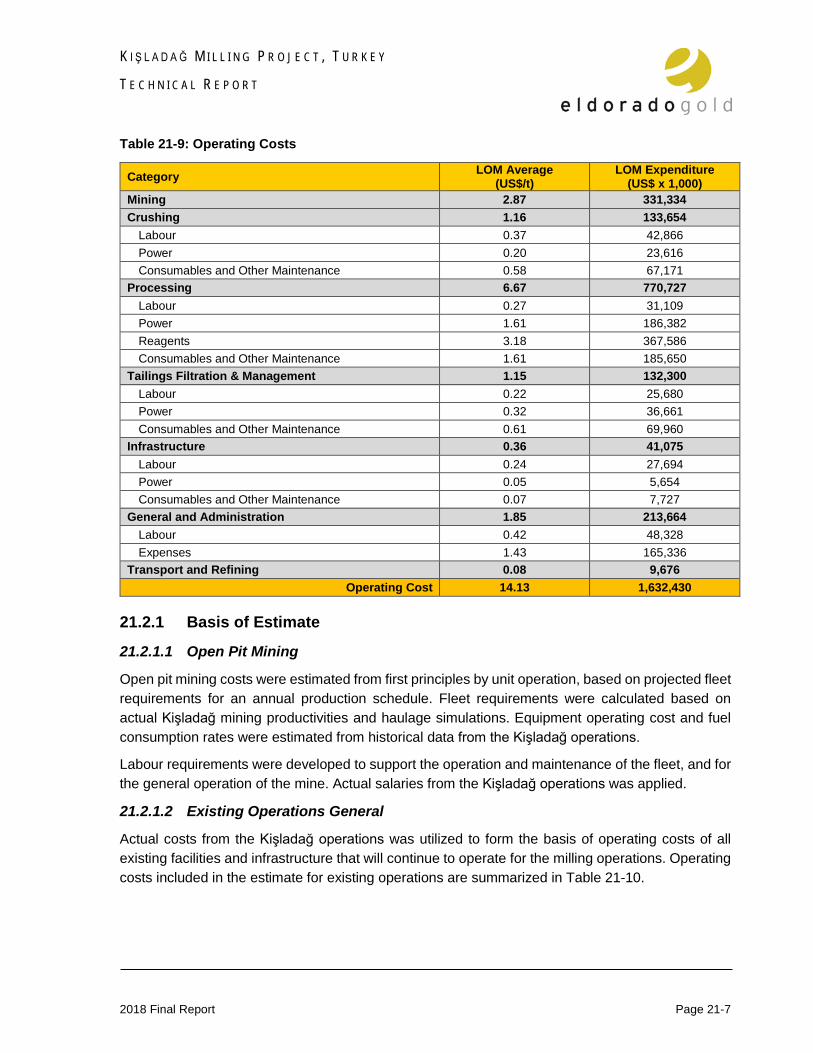
K I Ş L A D A Ğ M I L L I N G P R O J E C T , T U R K E Y
T E C H N I C A L R E P O R T
2018 Final Report Page 21-7
Table 21-9: Operating Costs
Category LOM Average (US$/t)
LOM Expenditure (US$ x 1,000)
Mining 2.87 331,334 Crushing 1.16 133,654
Labour 0.37 42,866 Power 0.20 23,616 Consumables and Other Maintenance 0.58 67,171
Processing 6.67 770,727 Labour 0.27 31,109 Power 1.61 186,382 Reagents 3.18 367,586 Consumables and Other Maintenance 1.61 185,650
Tailings Filtration & Management 1.15 132,300 Labour 0.22 25,680 Power 0.32 36,661 Consumables and Other Maintenance 0.61 69,960
Infrastructure 0.36 41,075 Labour 0.24 27,694 Power 0.05 5,654 Consumables and Other Maintenance 0.07 7,727
General and Administration 1.85 213,664 Labour 0.42 48,328 Expenses 1.43 165,336
Transport and Refining 0.08 9,676 Operating Cost 14.13 1,632,430
21.2.1 Basis of Estimate
21.2.1.1 Open Pit Mining
Open pit mining costs were estimated from first principles by unit operation, based on projected fleet requirements for an annual production schedule. Fleet requirements were calculated based on actual Kişladağ mining productivities and haulage simulations. Equipment operating cost and fuel consumption rates were estimated from historical data from the Kişladağ operations.
Labour requirements were developed to support the operation and maintenance of the fleet, and for the general operation of the mine. Actual salaries from the Kişladağ operations was applied.
21.2.1.2 Existing Operations General
Actual costs from the Kişladağ operations was utilized to form the basis of operating costs of all existing facilities and infrastructure that will continue to operate for the milling operations. Operating costs included in the estimate for existing operations are summarized in Table 21-10.

K I Ş L A D A Ğ M I L L I N G P R O J E C T , T U R K E Y
T E C H N I C A L R E P O R T
2018 Final Report Page 21-8
Table 21-10: Existing Operations Cost Summary
Category 2017 Kisladag Actuals (US$ x 1,000)
Factor (%)
PFS Annual Cost (US$ x 1,000)
Infrastructure 795 100% 795 Crushing Circuit 11,366 100% 11,366 Overland Conveyors1 3,378 100% 3,378 Stacking1 769 100% 769 Heap Leaching 36,469 0% 0 ADR & Refining2 5,377 48% 2,590 Maintenance Shop 3,677 100% 3,677 Laboratory 1,732 100% 1,732
Operating Cost 63,562 38% 24,306 Note: 1 Existing overland conveyor and stacking system will be utilized for the dry stacked tailings operations.
2 Existing ADR circuit will be decommissioned and replaced by a new ADR unit for the milling operations. 48% of the existing ADR and refining costs were applied to account for salaries and other miscellaneous expenses.
Costs summarized in Table 21-10 are further broken down into cost categories, as described in Sections 21.2.1.3 to 21.2.1.9.
Additional operating costs attributed to the new milling operations are described in Sections 21.2.1.3 to 21.2.1.10.
21.2.1.3 Power
Total power cost from the existing facilities was estimated to be US$4.92 M per annum. The total additional power consumption for the milling operations was calculated based on the electrical load list. Additional running load for the milling operations was estimated to be 48.0 MW. Power cost of $0.060 per kWh was used for the operating cost estimate, based on historical averages.
Total power cost was estimated to be US$28.4 M per annum.
21.2.1.4 Process Consumables
Process consumable costs were calculated based on the annual consumption rates of major wear parts and consumables. Consumption rates and replacement schedules were estimated based on a combination of calculations, in-house data, and vendor recommendations. Budget quotations were obtained for the supply of all significant consumables. Process consumables for existing facilities were estimated from 2017 actuals.
Process consumables for the existing facilities was estimated to be US$5.1 M per annum. Process consumables for the milling operations was estimated to add an additional US$20.5 M per annum, primarily for the ball mill media, mill liners, and filter cloths.
Total cost for process consumables was estimated to be US$25.6 M per annum.
21.2.1.5 Reagents
Reagent quantities were calculated based on the consumption rates in accordance with the Process Design Criteria and mass balance calculations. Reagent supply rates were based on current contract
K I Ş L A D A Ğ M I L L I N G P R O J E C T , T U R K E Y
T E C H N I C A L R E P O R T
2018 Final Report Page 21-9
rates or budget quotations. Reagent costs for the existing facilities were estimated based on 2017 actuals, less heap leach and ADR operations.
Reagent costs for existing facilities was estimated to be US$0.62 M per annum. Reagents for the milling operations was estimated to be US$41.0 M per annum.
Total reagent cost was estimated to be US$41.6 M per annum.
21.2.1.6 Maintenance Consumables
Maintenance consumables were factored from material and permanent equipment supply costs to account for operating spares, piping supplies, parts, tools, and other miscellaneous maintenance costs. For the milling operations, 3% factor was applied to mechanical and electrical equipment, and 2% factor was applied to piping and electrical bulk materials.
Maintenance consumable costs for the existing operations was based on 2017 actuals.
Total maintenance consumable cost was estimated to be US$6.4 M per annum.
21.2.1.7 Labour
The Kişladağ organization chart was updated as required for the Mill addition. Estimated labour for the milling operation, maintenance, and additional laboratory staff was calculated to be 182 personnel. Salaries were compiled from salaries at site and the proposed organization chart for the milling operation. An average burdened cost of US$27,764 per employee was applied per personnel, based on 2017 actual averages. Organizational chart for additional milling labour is illustrated in Figure 21-1.
Total cost for the additional mill operations labour was estimated to be US$5.0 M per annum. Salaries for the existing operations was estimated to be US$7.6 M per annum.
Total labour costs for the operation (less mining and G&A) was estimated to be US$12.7 M per annum.
21.2.1.8 Mobile Equipment – Tailings Management Facility
Operating cost for the dry stack tailings was estimated based on the actual costs of overland conveying and stacking at the Kişladağ mine. These costs are included in the values described in Sections 21.2.1.2 to 21.2.1.7.
In addition, it was assumed that four additional pieces of mobile equipment will be required for spreading and compaction of filtered tailings. The operating costs for the additional dozing and compacting equipment was calculated assuming 7,000 hours per annum utilization at a cost of US$120/hour, which includes all of operating, maintenance, and rebuild costs.
Total of US$3.4 M per annum was included in the operating cost estimate for the additional mobile equipment.
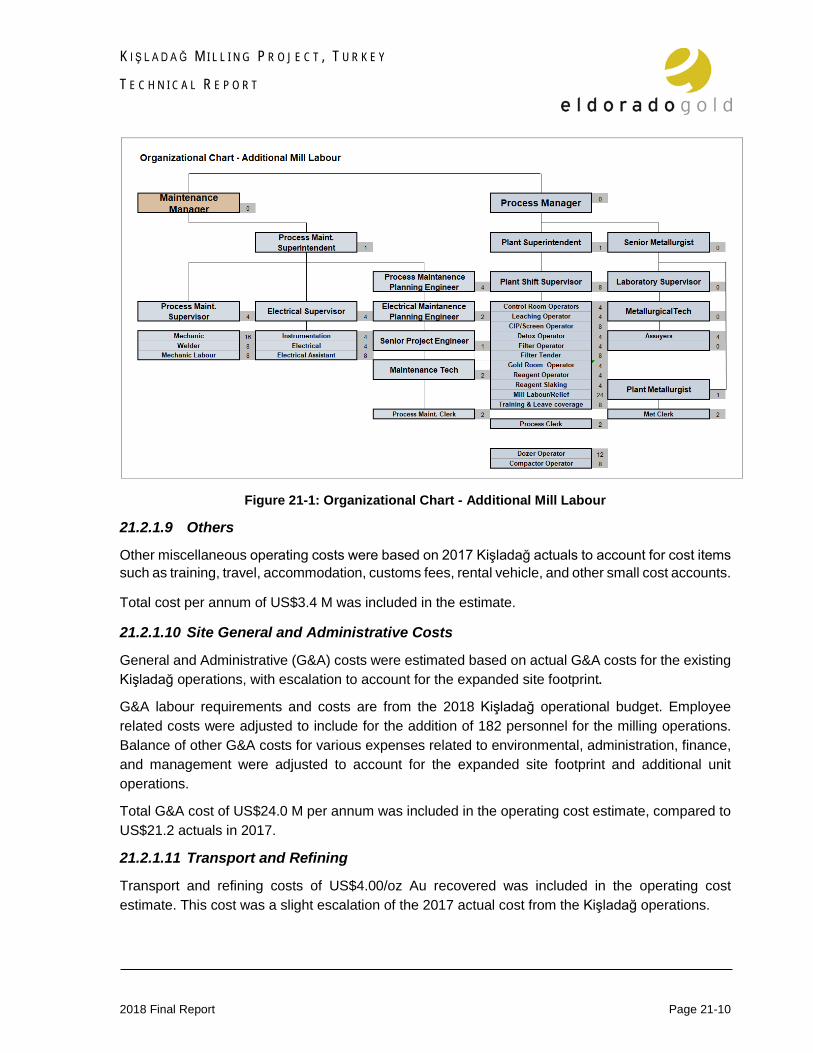
K I Ş L A D A Ğ M I L L I N G P R O J E C T , T U R K E Y
T E C H N I C A L R E P O R T
2018 Final Report Page 21-10
Figure 21-1: Organizational Chart - Additional Mill Labour
21.2.1.9 Others
Other miscellaneous operating costs were based on 2017 Kişladağ actuals to account for cost items such as training, travel, accommodation, customs fees, rental vehicle, and other small cost accounts.
Total cost per annum of US$3.4 M was included in the estimate.
21.2.1.10 Site General and Administrative Costs
General and Administrative (G&A) costs were estimated based on actual G&A costs for the existing Kişladağ operations, with escalation to account for the expanded site footprint.
G&A labour requirements and costs are from the 2018 Kişladağ operational budget. Employee related costs were adjusted to include for the addition of 182 personnel for the milling operations. Balance of other G&A costs for various expenses related to environmental, administration, finance, and management were adjusted to account for the expanded site footprint and additional unit operations.
Total G&A cost of US$24.0 M per annum was included in the operating cost estimate, compared to US$21.2 actuals in 2017.
21.2.1.11 Transport and Refining
Transport and refining costs of US$4.00/oz Au recovered was included in the operating cost estimate. This cost was a slight escalation of the 2017 actual cost from the Kişladağ operations.

K I Ş L A D A Ğ M I L L I N G P R O J E C T , T U R K E Y
T E C H N I C A L R E P O R T
2018 Final Report Page 22-1
SECTION • 22 ECO NOM IC AN AL Y SIS
22 .1 S U M M AR Y The economic analysis for the Project case using US$1,300/oz Au shows that the Kişladağ milling project provides a robust return on the investment. An internal rate of return (IRR) of 22.1% on an after-tax basis is achieved. The after-tax net present value (NPV) of the Project is estimated to be US$434.2 M using a discount rate of 5%, with a payback of the capital achieved in 3.7 years from the start of production.
The test of economic extraction for the Kisladag mineral reserves is demonstrated by means a sensitivity analysis. At the mineral reserve metals price of US$1,200/oz Au the Project shows positive economics. The after tax IRR is 16.7 % and the NPV is estimated to be US$283.7 M using the 5% discount rate, with a calculated payback period of 4.6 years.
The sensitivity analysis reported in Section 22.10 shows that the Project continues to be economical when evaluated using lower metal price assumptions, or higher operating and capital costs.
The technical report for the milling project evaluates the economics of the ore processed through the milling circuit only. No operational costs or revenues from the ongoing heap leaching was considered in the economic analysis.
22 .2 M E T H O D S , AS S U M P T I O N S AN D B AS I S The economic analysis is based on the mineral reserves as outlined in Section 15, the mining methods and production schedule as outlined in Section 16, the recovery and processing methods in Section 17, and the capital and operating costs as outlined in Section 21.
The project case metal price used in the economic model is US$1,300/oz Au, which represent Eldorado’s view of long-term metal pricing. Silver credit was assumed to be US$8.50 per ounce of gold recovered, based on historical averages from the Kişladağ gold sales. 100% of the gold recovered is payable.
Transport and refining costs of US$4.00/oz was used for economic analysis, based on historical averages at the Kişladağ operations.
Approximately 3.0 Mt of ore will be mined and placed on the heap leach pad through to April 2018. The revenue from this material is not considered in this economic analysis. Mining cost for Q1 2018 is considered sunk cost and is not included in capital cost estimate.
The model has been prepared on a yearly life of mine basis. The construction period is estimated to be two years including commissioning. The LOM is 9 years from the start of production until the depletion of economic mineral reserves.

K I Ş L A D A Ğ M I L L I N G P R O J E C T , T U R K E Y
T E C H N I C A L R E P O R T
2018 Final Report Page 22-2
22 .3 P R O D U C T I O N S C H E D U L E The Kişladağ mill will operate at the design capacity of 13.0 Mtpa over the life of the operation. The production schedule is shown in Figure 22-1. The average head grade is 0.81 g/t Au.
Gold recovery is estimated for each year of production, averaging 80.1% for the LOM.
Figure 22-1: Kişladağ Production Schedule and Grade
22 .4 C AS H FL O W S The annual cash flow forecast is built from a first principles financial model. The results are shown in Table 22-1 through to Table 22-6.
0
0.2
0.4
0.6
0.8
1
1.2
10000
10500
11000
11500
12000
12500
13000
13500
2018 2019 2020 2021 2022 2023 2024 2025 2026 2027 2028 2029 2030
Au G
rade
(g/t
)
1000
x T
onne
s per
Ann
um
Production Schedule
Mill Feed Au Grade
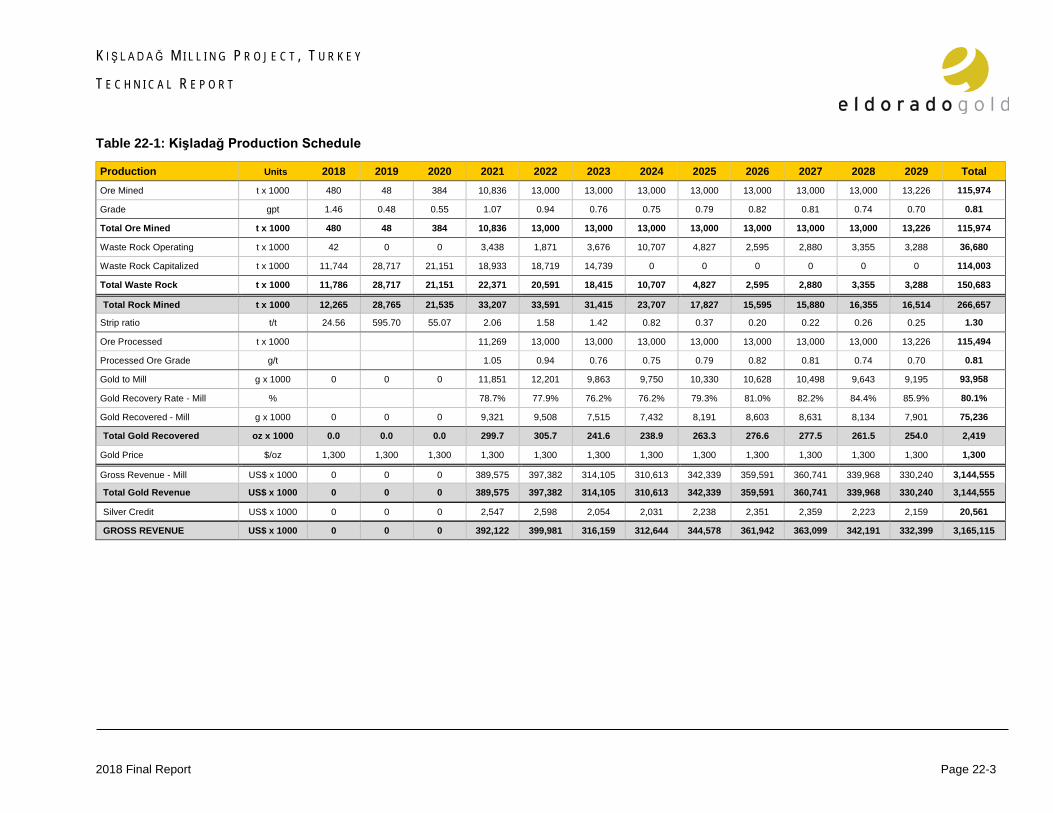
K I Ş L A D A Ğ M I L L I N G P R O J E C T , T U R K E Y
T E C H N I C A L R E P O R T
2018 Final Report Page 22-3
Table 22-1: Kişladağ Production Schedule
Production Units 2018 2019 2020 2021 2022 2023 2024 2025 2026 2027 2028 2029 Total Ore Mined t x 1000 480 48 384 10,836 13,000 13,000 13,000 13,000 13,000 13,000 13,000 13,226 115,974
Grade gpt 1.46 0.48 0.55 1.07 0.94 0.76 0.75 0.79 0.82 0.81 0.74 0.70 0.81
Total Ore Mined t x 1000 480 48 384 10,836 13,000 13,000 13,000 13,000 13,000 13,000 13,000 13,226 115,974
Waste Rock Operating t x 1000 42 0 0 3,438 1,871 3,676 10,707 4,827 2,595 2,880 3,355 3,288 36,680
Waste Rock Capitalized t x 1000 11,744 28,717 21,151 18,933 18,719 14,739 0 0 0 0 0 0 114,003
Total Waste Rock t x 1000 11,786 28,717 21,151 22,371 20,591 18,415 10,707 4,827 2,595 2,880 3,355 3,288 150,683
Total Rock Mined t x 1000 12,265 28,765 21,535 33,207 33,591 31,415 23,707 17,827 15,595 15,880 16,355 16,514 266,657
Strip ratio t/t 24.56 595.70 55.07 2.06 1.58 1.42 0.82 0.37 0.20 0.22 0.26 0.25 1.30
Ore Processed t x 1000 11,269 13,000 13,000 13,000 13,000 13,000 13,000 13,000 13,226 115,494
Processed Ore Grade g/t 1.05 0.94 0.76 0.75 0.79 0.82 0.81 0.74 0.70 0.81
Gold to Mill g x 1000 0 0 0 11,851 12,201 9,863 9,750 10,330 10,628 10,498 9,643 9,195 93,958
Gold Recovery Rate - Mill % 78.7% 77.9% 76.2% 76.2% 79.3% 81.0% 82.2% 84.4% 85.9% 80.1%
Gold Recovered - Mill g x 1000 0 0 0 9,321 9,508 7,515 7,432 8,191 8,603 8,631 8,134 7,901 75,236
Total Gold Recovered oz x 1000 0.0 0.0 0.0 299.7 305.7 241.6 238.9 263.3 276.6 277.5 261.5 254.0 2,419
Gold Price $/oz 1,300 1,300 1,300 1,300 1,300 1,300 1,300 1,300 1,300 1,300 1,300 1,300 1,300
Gross Revenue - Mill US$ x 1000 0 0 0 389,575 397,382 314,105 310,613 342,339 359,591 360,741 339,968 330,240 3,144,555
Total Gold Revenue US$ x 1000 0 0 0 389,575 397,382 314,105 310,613 342,339 359,591 360,741 339,968 330,240 3,144,555
Silver Credit US$ x 1000 0 0 0 2,547 2,598 2,054 2,031 2,238 2,351 2,359 2,223 2,159 20,561
GROSS REVENUE US$ x 1000 0 0 0 392,122 399,981 316,159 312,644 344,578 361,942 363,099 342,191 332,399 3,165,115
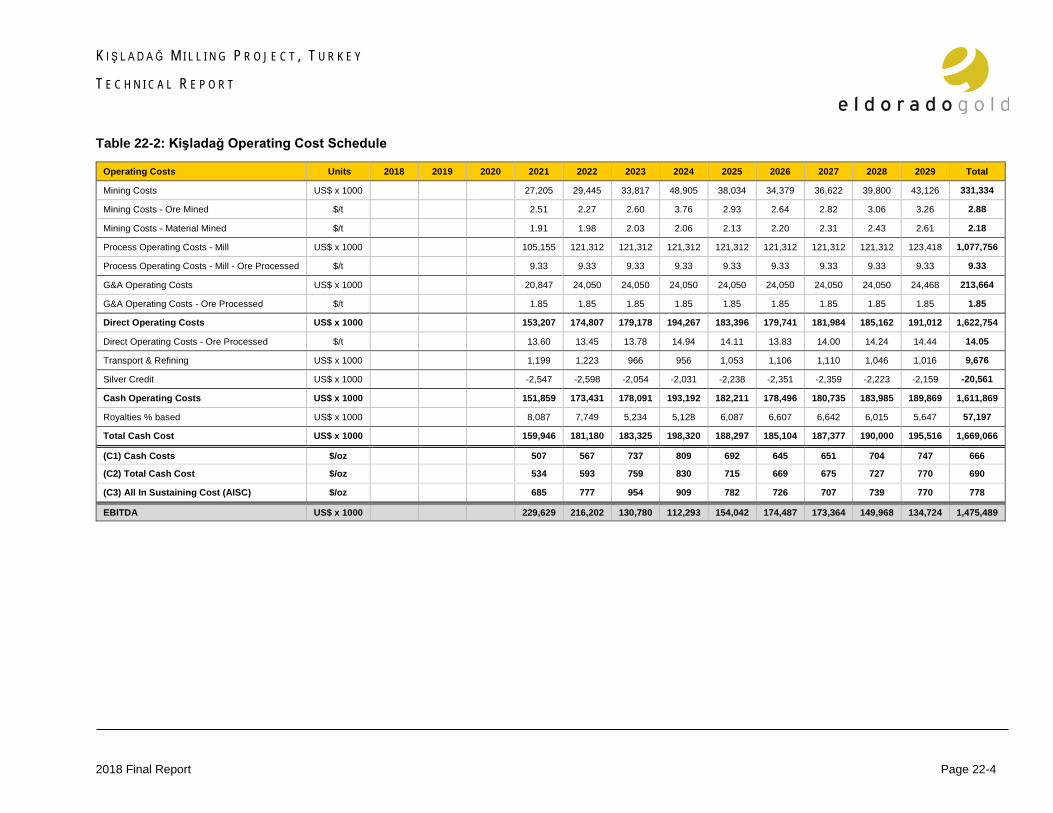
K I Ş L A D A Ğ M I L L I N G P R O J E C T , T U R K E Y
T E C H N I C A L R E P O R T
2018 Final Report Page 22-4
Table 22-2: Kişladağ Operating Cost Schedule
Operating Costs Units 2018 2019 2020 2021 2022 2023 2024 2025 2026 2027 2028 2029 Total
Mining Costs US$ x 1000 27,205 29,445 33,817 48,905 38,034 34,379 36,622 39,800 43,126 331,334
Mining Costs - Ore Mined $/t 2.51 2.27 2.60 3.76 2.93 2.64 2.82 3.06 3.26 2.88
Mining Costs - Material Mined $/t 1.91 1.98 2.03 2.06 2.13 2.20 2.31 2.43 2.61 2.18
Process Operating Costs - Mill US$ x 1000 105,155 121,312 121,312 121,312 121,312 121,312 121,312 121,312 123,418 1,077,756
Process Operating Costs - Mill - Ore Processed $/t 9.33 9.33 9.33 9.33 9.33 9.33 9.33 9.33 9.33 9.33
G&A Operating Costs US$ x 1000 20,847 24,050 24,050 24,050 24,050 24,050 24,050 24,050 24,468 213,664
G&A Operating Costs - Ore Processed $/t 1.85 1.85 1.85 1.85 1.85 1.85 1.85 1.85 1.85 1.85
Direct Operating Costs US$ x 1000 153,207 174,807 179,178 194,267 183,396 179,741 181,984 185,162 191,012 1,622,754
Direct Operating Costs - Ore Processed $/t 13.60 13.45 13.78 14.94 14.11 13.83 14.00 14.24 14.44 14.05
Transport & Refining US$ x 1000 1,199 1,223 966 956 1,053 1,106 1,110 1,046 1,016 9,676
Silver Credit US$ x 1000 -2,547 -2,598 -2,054 -2,031 -2,238 -2,351 -2,359 -2,223 -2,159 -20,561
Cash Operating Costs US$ x 1000 151,859 173,431 178,091 193,192 182,211 178,496 180,735 183,985 189,869 1,611,869
Royalties % based US$ x 1000 8,087 7,749 5,234 5,128 6,087 6,607 6,642 6,015 5,647 57,197
Total Cash Cost US$ x 1000 159,946 181,180 183,325 198,320 188,297 185,104 187,377 190,000 195,516 1,669,066
(C1) Cash Costs $/oz 507 567 737 809 692 645 651 704 747 666
(C2) Total Cash Cost $/oz 534 593 759 830 715 669 675 727 770 690
(C3) All In Sustaining Cost (AISC) $/oz 685 777 954 909 782 726 707 739 770 778
EBITDA US$ x 1000 229,629 216,202 130,780 112,293 154,042 174,487 173,364 149,968 134,724 1,475,489

K I Ş L A D A Ğ M I L L I N G P R O J E C T , T U R K E Y
T E C H N I C A L R E P O R T
2018 Final Report Page 22-5
Table 22-3: Kişladağ Capital Cost Schedule
Capital Costs Units 2018 2019 2020 2021 2022 2023 2024 2025 2026 2027 2028 2029 Total
CAPEX
Mine US$ x 1000 20,974 50,784 40,038 111,796
Plant US$ x 1000 5,200 45,437 153,896 8,076 212,609
Infrastructure US$ x 1000 0 5,269 15,549 673 21,492
Direct US$ x 1000 26,174 101,490 209,483 8,750 345,896
Indirect US$ x 1000 3,500 20,022 54,373 6,557 84,452
Owner US$ x 1000 0 1,122 2,854 129 4,105
Contingency US$ x 1000 1,040 2,528 42,062 9,683 55,313
Total Construction CAPEX US$ x 1000 30,714 125,162 308,773 25,118 0 0 0 0 0 0 0 0 489,766
Sustaining CAPEX US$ x 1000
Capitalized Waste US$ x 1000 36,085 37,064 29,888 0 0 0 0 0 0 103,036
Mine Equipment and Rebuilds US$ x 1000 5,982 7,039 6,713 5,557 4,675 4,340 3,883 1,727 0 39,916
Process US$ x 1000 2,050 4,099 4,099 4,099 4,099 4,099 3,075 1,025 0 26,645
Infrastructure US$ x 1000 600 1,200 1,200 1,200 1,200 1,200 900 300 0 7,800
Dry Stack Tailings US$ x 1000 0 5,697 3,956 6,722 6,439 4,715 0 0 0 27,529
General & Administration US$ x 1000 650 1,300 1,300 1,300 1,300 1,300 975 325 0 8,450
Total Sustaining CAPEX US$ x 1000 0 0 0 45,367 56,399 47,156 18,878 17,713 15,654 8,833 3,377 0 213,376
TOTAL CAPEX US$ x 1000 30,714 125,162 308,773 70,485 56,399 47,156 18,878 17,713 15,654 8,833 3,377 0 703,143
CAPEX per Ounce $/oz 0 0 0 235 185 195 79 67 57 32 13 0 291

K I Ş L A D A Ğ M I L L I N G P R O J E C T , T U R K E Y
T E C H N I C A L R E P O R T
2018 Final Report Page 22-6
Table 22-4: Kişladağ Income Statement Income Statement Units 2018 2019 2020 2021 2022 2023 2024 2025 2026 2027 2028 2029 Total Net Revenue (Au and Ag revenue, less royalties) US$ x 1000 0 0 0 384,035 392,232 310,925 307,515 338,491 355,335 356,457 336,176 326,752 3,107,919
Operating Cost (Direct operating cost + transport/refining) US$ x 1000 0 0 0 154,406 176,030 180,145 195,223 184,449 180,848 183,094 186,208 192,028 1,632,430
Depreciation US$ x 1000 31,020 30,587 30,209 61,440 56,326 53,357 52,576 53,171 54,061 50,376 45,998 45,845 646,997
EBITDA US$ x 1000 0 0 0 229,629 216,202 130,780 112,293 154,042 174,487 173,364 149,968 134,724 1,475,489
Income Tax US$ x 1000 0 0 0 0 2,428 1,901 2,389 4,035 4,817 4,920 4,159 3,555 28,203
Earnings After Tax US$ x 1000 -31,020 -30,587 -30,209 168,189 157,448 75,522 57,328 96,836 115,610 118,068 99,811 85,324 800,289
Table 22-5: Kişladağ Cashflows Cash Flow Units 2018 2019 2020 2021 2022 2023 2024 2025 2026 2027 2028 2029 Total
Pre-Tax Net Cash Flow US$ x 1000 -30,714 -125,162 -308,773 159,145 159,804 83,624 93,415 136,329 158,833 164,531 146,591 134,724 772,346
Cumulative Cash Flow US$ x 1000 -30,714 -155,876 -464,648 -305,504 -145,700 -62,076 31,339 167,668 326,501 491,032 637,622 772,346
Post-Tax Net Cash Flow US$ x 1000 -30,714 -125,162 -308,773 159,145 157,376 81,723 91,026 132,294 154,016 159,611 142,432 131,169 744,143
Cumulative Cash Flow US$ x 1000 -30,714 -155,876 -464,648 -305,504 -148,128 -66,405 24,621 156,915 310,931 470,542 612,974 744,143
Table 22-6: Kişladağ Economics Economics US$/oz 1200* 1250 1300 1350 1400 1450
Before Tax NPV (@ 0%) US$ x 1000 554,361 672,886 772,346 889,662 1,006,979 1,124,295
NPV (@ 5%) US$ x 1000 296,647 381,921 453,407 537,810 622,214 706,617
NPV (@ 10%) US$ x 1000 135,062 198,299 251,258 313,849 376,441 439,033
IRR % 17.1% 20.2% 22.6% 25.4% 28.1% 30.8%
Payback Period Year 4.59 4.10 3.66 3.20 2.81 2.49
After Tax
NPV (@ 0%) US$ x 1000 534,877 648,662 744,143 838,285 932,138 1,025,990
NPV (@ 5%) US$ x 1000 283,673 365,560 434,207 504,385 573,970 643,152
NPV (@ 10%) US$ x 1000 126,196 186,944 237,817 291,387 344,347 396,799
IRR % 16.7% 19.7% 22.1% 24.7% 27.2% 29.6%
Payback Period year 4.63 4.15 3.73 3.26 2.88 2.55
Note: * Reserve base metal case of US$ 1,200/oz Au

K I Ş L A D A Ğ M I L L I N G P R O J E C T , T U R K E Y
T E C H N I C A L R E P O R T
2018 Final Report Page 22-7
22 .5 RO Y AL T I E S AN D O T H E R FE E S The Kişladağ Project is subject to a mineral production royalty regime which has a sliding scale gold price type of royalty, payable to the Turkish government.
The relevant royalties are shown in Table 22-7. The royalties are calculated on revenue with deductions allowed for processing costs, depreciation, and haulage costs of ore.
The royalty regime incorporates a sliding scale depending on the metal price on the date of sale, ranging from 2% to 16%. The royalty rates in Table 22-7 are for sellers of raw ore. If the ore is processed on site the royalty is reduced by 50%. As Tüprag processes the ore on site and produces gold doré production is eligible for the reduced royalty rate.
Table 22-7: Gold Royalty
Gold Price (US$/ oz) Applied Royalty
(%) From To 0 800 1
801 1250 2 1251 1500 3 1501 1750 4 1751 2000 5 2001 2250 7 2251 2251+ 8
22 .6 CL O S U R E AN D S AL V AG E V AL U E Closure costs are captured by the economic model to account for dismantling the processing plant, ancillary buildings, power lines and roads, and rehabilitation. Rehabilitation costs include for re-grading of the tailings management facility, hauling and placing of waste rock and topsoil. The estimate used in the economic model is US$42.0 M.
The salvage value of the plant was assumed to be equivalent to the closure costs. Salvage value used in the economic model is US$42.0 M.
22 .7 T AX A T I O N Value added taxation (VAT) is redeemable in Turkey for all operating and capital spending incurred on mining projects. As such, the VAT component of any quotations or other costs used in this economic analysis have been removed. This implies that the VAT costs will be redeemed without delay and as they are incurred. There exists a low risk for delay in the reimbursement of VAT, which could have a material effect on the timing of cashflows for the Project.
The Turkish government recently implemented a temporary rate increase from 20% to 22% for the periods of 2018-2020. From 2021 onwards, the effective tax rate is expected to return to 20%.

K I Ş L A D A Ğ M I L L I N G P R O J E C T , T U R K E Y
T E C H N I C A L R E P O R T
2018 Final Report Page 22-8
Income from operations can be offset by operating costs and by depreciation of capitalized items according to a schedule of depreciation based on the type of asset. The depreciation schedule based on the type of asset is shown in Table 22-8. Waste stripping is expensed and is tax deductible in the year in which it is incurred.
Table 22-8: Depreciation Rates for Corporate Income Tax
Type of Asset Depreciation Rate (%)
Land 0 Buildings 2.5 Mining Equipment 10 Mechanical Infrastructure 10
Turkey is divided into six regions in order to determine investment incentives. Mining investment are eligible for Region 5 incentives, which is the basis of the current economic analysis. The investment tax credit (ITC) reduces the effective income tax rate from 22% to 4.4% until 2020, and from 20% to 4% from 2021 until the amount of income tax savings reaches the investment tax credit amount. There is a further opportunity to increase the incentive if the investment is accepted to be a strategic investment (Category IIC). Under the IIC scenario, the investment tax credit is increased from 40% of the qualified investment to 50% and the effective corporate tax rate is reduced to 2% until the amount of tax savings reaches the investment tax credit amount.
22 .8 F I N AN C I N G C O S T S Cost of financing the Project, such as interest on loans, are not included in the economic model. The Project is assumed to be funded by Tüprag and any costs or charges relating to Eldorado’s funding of the Tüprag subsidiary are beyond the scope of the analysis.
22 .9 TH I R D P AR T Y I N T E R E S T S Tüprag is the 100% owner of the Kişladağ Gold Mine. Eldorado owns 100% interest in Tüprag.
22 .10 S E N S I T I V I T Y AN AL Y S I S The economic model was subjected to a sensitivity analysis to determine the effects of changing metal prices and capital and operating expenditures on the Project financial returns. Results are summarized as follows. Sensitivity analysis results are summarized in Table 22-9 and Table 22-10.
The sensitivity graphs presented on Figure 22-2 and Figure 22-3 show that the project economics is more sensitive to gold price and operating costs than to capital and sustaining costs; and the Kişladağ Project economics are robust.

K I Ş L A D A Ğ M I L L I N G P R O J E C T , T U R K E Y
T E C H N I C A L R E P O R T
2018 Final Report Page 22-9
Figure 22-2: Sensitivity Analysis – NPV 5% after Tax
Table 22-9: Sensitivity Analysis – Net Present Value at 5% Discount, after Tax
Change CAPEX SUSEX OPEX Au Price
(%) (US$ x 1,000) NPV
(US$ x ,1000) NPV (US$/t
Ore) NPV
(US$/oz) NPV
($US x 1,000) (US$ x 1,000) (US$ x 1,000) (US$ x 1,000)
80 391,813 524,543 170,701 467,721 11.17 610,356 1,040 21,102
85 416,301 501,959 181,370 459,343 11.86 566,604 1,105 127,897
90 440,790 479,375 192,039 450,964 12.56 522,669 1,170 234,524
95 465,278 456,791 202,707 442,585 13.26 478,618 1,235 340,994
100 489,766 434,207 213,376 434,207 13.96 434,207 1,300 434,207
105 514,255 411,623 224,045 425,828 14.65 383,042 1,365 525,261
110 538,743 389,039 234,714 417,449 15.35 331,878 1,430 615,499
115 563,231 366,455 245,383 409,070 16.05 280,713 1,495 705,370
120 587,720 343,871 256,052 400,692 16.75 229,534 1,560 779,830

K I Ş L A D A Ğ M I L L I N G P R O J E C T , T U R K E Y
T E C H N I C A L R E P O R T
2018 Final Report Page 22-10
Figure 22-3: Sensitivity Analysis – IRR after Tax
Table 22-10: Sensitivity Analysis – Internal Rate of Return, after Tax
Change CAPEX SUSEX OPEX Au Price
(%) (US$ x 1,000) IRR (%) (US$ x 1,000) IRR
(%) (US$/t Ore) IRR (%) (US$/oz) IRR
(%) 80 391,813 29.4 170,701 23.5 11.17 28.4 1,040 6.0 85 416,301 27.3 181,370 23.2 11.86 26.9 1,105 10.6 90 440,790 25.4 192,039 22.8 12.56 25.3 1,170 14.8 95 465,278 23.7 202,707 22.4 13.26 23.7 1,235 18.8
100 489,766 22.1 213,376 22.1 13.96 22.1 1,300 22.1 105 514,255 20.6 224,045 21.7 14.65 20.3 1,365 25.4 110 538,743 19.3 234,714 21.4 15.35 18.5 1,430 28.6 115 563,231 18.0 245,383 21.0 16.05 16.6 1,495 31.7 120 587,720 16.8 256,052 20.7 16.75 14.6 1,560 34.2

K I Ş L A D A Ğ M I L L I N G P R O J E C T , T U R K E Y
T E C H N I C A L R E P O R T
2018 Final Report Page 23-1
SECTION • 23 AD J AC E N T PROP ERTIE S There are no mineral properties of importance adjacent to the Kişladağ mine site.
K I Ş L A D A Ğ M I L L I N G P R O J E C T , T U R K E Y
T E C H N I C A L R E P O R T
2018 Final Report Page 24-1
SECTION • 24 OTHE R REL EV AN T D AT A AN D INFORM AT ION
24 .1 K I ŞLADAĞ P H AS E IV I N F R AS T R U C T U R E AN D E Q U I P M E N T In preparation for the Phase IV expansion project certain infrastructure projects and equipment purchases were undertaken:
• New 154 kV substation with total bus capacity of 100 MVA; the current demand is 13 MVA, with 87 MVA of availability remaining.
• Installation of a new 27.7 km long 154 kV transmission line from the Uşak. • Purchase of new mining equipment including ten-240 ton trucks, two drills, and a large face
shovel. • Overland conveying system was upgraded and extended to the end of the leach pad. • Bulk earthworks and grading of the new plant area pad and contractor laydown have been
completed; the planned milling project overlays the Phase IV area.
The expansion project was subsequently cancelled.
The infrastructure completed and equipment purchased in preparation for Phase IV will provide significant savings in capital cost for the Kişladağ milling project.
Installation of the new powerline and substation allowed for purchase of power at a reduced cost decreasing energy rates by approximately 40%.
24 .2 S C H E D U L E The Kişladağ milling project is targeted to achieve commercial production at the end of second quarter 2021. If the next phase of the project is approved, the project will proceed to a feasibility study. During the feasibility studies, the process design and discipline engineering will progress to a basic engineering level. Request for quotations (RFQ) and full bid evaluations for all major mechanical and electrical equipment packages will be completed during this phase.
Early construction works will be undertaken during feasibility/basic engineering within the existing permit constraints. This includes preliminary earthworks, upgrades/maintenance of the existing equipment and facilities, and relocation of minor infrastructure and facilities in the milling area. Sourcing of used equipment will also be considered during this phase, specifically for the ball mills.
Towards the end of the feasibility/basic engineering phase, the project will undergo a stage gate review, which would include a Board decision. If successful, the project will proceed to detailed engineering and execution immediately.
Detailed engineering is scheduled for a total of 12 months. Construction will commence immediately after approval of the environmental impact assessment (EIA), required permits are granted and the Board has made a decision to proceed.

K I Ş L A D A Ğ M I L L I N G P R O J E C T , T U R K E Y
T E C H N I C A L R E P O R T
2018 Final Report Page 24-2
Construction is scheduled for a total of 20 months, achieving mechanical completion at the end of Q4 2020. A total of six months was scheduled for commissioning and ramp-up. A conservative duration for a ramp-up schedule was allowed because of the operations scale.
The Gantt chart summary level schedule for development of the Project is shown in Figure 24-1.
Figure 24-1: Kişladağ Milling Project, Implementation Schedule
24 .3 M AN P O W E R E S T I M AT E The existing process and G&A team will remain constant at 480 throughout pre-production to support the leaching operations. During the pre-production period, priority will be given to use existing staff in construction activities. Kişladağ operations will also support pre-production mining and heap leaching activities.
The mining team will focus on pre-production waste stripping until 2021. Mining manpower is expected to remain constant at 230 people until gradually declining throughout the balance of the mine life.
Manpower for construction is expected to peak at approximately 700 people during 2020 including construction contractors, EPCM, vendor representatives, and the owner’s construction management team.
Upon mechanical completion of the mill at the end of 2020, operations staff will have been increased to 890 (accounting for mining, process operations, and G&A) to include the operation of the new mill-leach circuit. During the feasibility stage, an optimization of staffing will be conducted to review the requirements for the milling operation and integrate the full operation. For the prefeasibility study, the milling project was considered a stand-alone unit operation.
The total manpower estimate for the Kişladağ milling project is shown in Figure 24-2.

K I Ş L A D A Ğ M I L L I N G P R O J E C T , T U R K E Y
T E C H N I C A L R E P O R T
2018 Final Report Page 24-3
Figure 24-2: Kişladağ Milling Project, Manpower Curve
24 .4 HE AP LE AC H /M I L L I N G Kişladağ was initially constructed as a heap leach operation as this was determined to be the most efficient use of capital in the prevailing metal price environment. At that time, it was anticipated that recoveries for oxide material would be 80% and sulphide recovery would yield 60%. Gold prices at this time were approximately $300 per ounce.
During initial feasibility work, mill recoveries were investigated and it was decided that the extra recovery that was expected was not sufficient to cover the extra capital required. Anticipated mill recoveries on the oxide and sulphide material based on bottle rolls was 91% and 77% respectively. This meant a delta of approximately 16% in overall gold recovery, which could not support the increase in capital and operating costs for milling. At the time it was decided that heap leaching was the more economically viable processing method.
More recently, Kişladağ received indications that recoveries on some of the deeper sections of the pit are lower than originally modelled. Recoveries on composite monthly column tests returned recoveries around 40%. Bottle roll recoveries on the same material provided recoveries around 80%. With this information, Eldorado completed a large amount of metallurgical testwork on both a milling option and a high-pressure grinding rolls (HPGR) option. The HPGR option would have involved the installation of a HPGR crusher after the existing crushing facility. The material generated would have been placed on the pad. HPGR testwork is more involved and requires a larger sample. The work to generate suitable sample for testwork is much more onerous. Despite this, Eldorado has been able to test a number of samples and ore types for suitability of HPGR technology for the Kişladağ circuit.
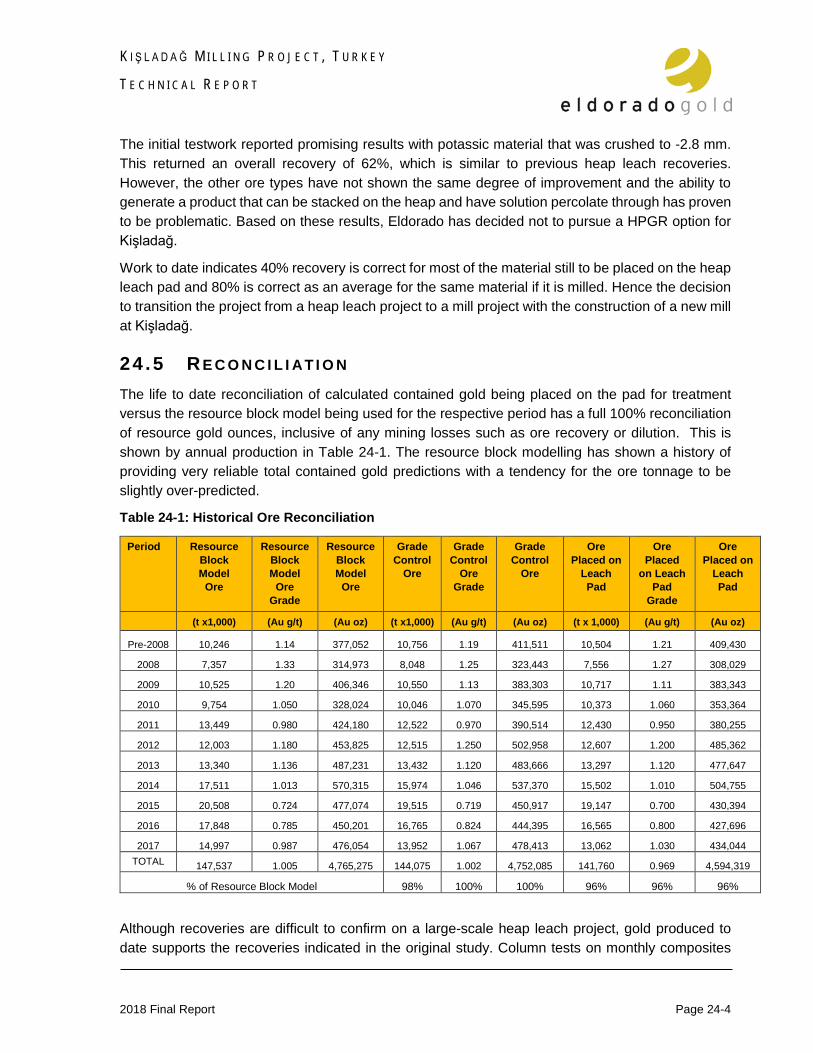
K I Ş L A D A Ğ M I L L I N G P R O J E C T , T U R K E Y
T E C H N I C A L R E P O R T
2018 Final Report Page 24-4
The initial testwork reported promising results with potassic material that was crushed to -2.8 mm. This returned an overall recovery of 62%, which is similar to previous heap leach recoveries. However, the other ore types have not shown the same degree of improvement and the ability to generate a product that can be stacked on the heap and have solution percolate through has proven to be problematic. Based on these results, Eldorado has decided not to pursue a HPGR option for Kişladağ.
Work to date indicates 40% recovery is correct for most of the material still to be placed on the heap leach pad and 80% is correct as an average for the same material if it is milled. Hence the decision to transition the project from a heap leach project to a mill project with the construction of a new mill at Kişladağ.
24 .5 RE C O N C I L I AT I O N The life to date reconciliation of calculated contained gold being placed on the pad for treatment versus the resource block model being used for the respective period has a full 100% reconciliation of resource gold ounces, inclusive of any mining losses such as ore recovery or dilution. This is shown by annual production in Table 24-1. The resource block modelling has shown a history of providing very reliable total contained gold predictions with a tendency for the ore tonnage to be slightly over-predicted.
Table 24-1: Historical Ore Reconciliation
Period Resource Block Model
Ore
Resource Block Model
Ore Grade
Resource Block Model
Ore
Grade Control
Ore
Grade Control
Ore Grade
Grade Control
Ore
Ore Placed on
Leach Pad
Ore Placed
on Leach Pad
Grade
Ore Placed on
Leach Pad
(t x1,000) (Au g/t) (Au oz) (t x1,000) (Au g/t) (Au oz) (t x 1,000) (Au g/t) (Au oz)
Pre-2008 10,246 1.14 377,052 10,756 1.19 411,511 10,504 1.21 409,430
2008 7,357 1.33 314,973 8,048 1.25 323,443 7,556 1.27 308,029
2009 10,525 1.20 406,346 10,550 1.13 383,303 10,717 1.11 383,343
2010 9,754 1.050 328,024 10,046 1.070 345,595 10,373 1.060 353,364
2011 13,449 0.980 424,180 12,522 0.970 390,514 12,430 0.950 380,255
2012 12,003 1.180 453,825 12,515 1.250 502,958 12,607 1.200 485,362
2013 13,340 1.136 487,231 13,432 1.120 483,666 13,297 1.120 477,647
2014 17,511 1.013 570,315 15,974 1.046 537,370 15,502 1.010 504,755
2015 20,508 0.724 477,074 19,515 0.719 450,917 19,147 0.700 430,394
2016 17,848 0.785 450,201 16,765 0.824 444,395 16,565 0.800 427,696
2017 14,997 0.987 476,054 13,952 1.067 478,413 13,062 1.030 434,044 TOTAL 147,537 1.005 4,765,275 144,075 1.002 4,752,085 141,760 0.969 4,594,319
% of Resource Block Model 98% 100% 100% 96% 96% 96%
Although recoveries are difficult to confirm on a large-scale heap leach project, gold produced to date supports the recoveries indicated in the original study. Column tests on monthly composites

K I Ş L A D A Ğ M I L L I N G P R O J E C T , T U R K E Y
T E C H N I C A L R E P O R T
2018 Final Report Page 24-5
support the high recoveries (80%) for the oxide ore and variable recoveries in the sulphide ore with an average life-to-date sulphide recovery in the mid-50’s %.
24 .6 R I S K S AN D O P P O R T U N I T I E S
24.6.1 Risks
• Permitting delays may impact the schedule and will have to be monitored. • Inflation and currency fluctuations - the Turkish lira has been devaluing on a long term
trend. This has been typically offset with inflation. No escalation (including inflation or currency fluctuations) has been accounted for in the estimates.
• Process operating performance and overall metallurgical recoveries. • Project cost over-runs and scheduling delays. • A sizeable filter plant may be problematic in early commissioning.
24.6.2 Opportunities
• Optimization of operational labour. • Utilization of current maintenance staff for construction activities and EPCM during
construction. • Equipment pricing is based on un-negotiated budget pricing, possible sourcing of used
equipment. • Reagent use will be optimized during further test work, costs are based on un-negotiated
budget pricing. • Further value engineering to reduce project capital. • Review of crushing requirements given that the existing circuit is designed for stringent
crush size performance. There may be opportunity to simplify the circuit.

K I Ş L A D A Ğ M I L L I N G P R O J E C T , T U R K E Y
T E C H N I C A L R E P O R T
2018 Final Report Page 25-1
SECTION • 25 INTERPR ET AT I ON AND CONCLU SION S
It is concluded that the work completed in the prefeasibility study indicate that the mineral resource and mineral reserve estimates and Project economics are sufficiently defined to indicate the Project is technically and economically viable and should advance to the basic engineering phase.
The qualified persons have a high degree of confidence in the contents of this report as outlined in the following interpretations and conclusions.
25 .1 M I N E R AL R E S O U R C E S AN D M I N E R AL R E S E R V E S The mineral resource and mineral reserve are consistent with the CIM definitions referred to in NI 43-101. It is the opinion of the qualified persons that the information and analysis provided in this report is considered sufficient for reporting mineral resources and mineral reserves.
The mineral resource estimate has been updated with new data from mining and 2014-2016 drilling campaign. The Kişladağ mineral resources as of December 31, 2017 are as follows:
• 9,006 Koz Measured and Indicated at an average grade of 0.61 g/t Au. • 4,165 Koz Inferred at an average grade of 0.45 g/t Au.
The Kişladağ mineral resource is reported at a 0.3 g/t Au cutoff grade for measured and indicated resources and 0.35 g/t Au for the inferred resources and calculated to end of 2017 mining limits.
The mineral resource model was used as input for the mineral reserve estimate. The modelling methods, grade models, resource classification, and density model were reviewed and found appropriate for the mineral reserve estimation.
The mineral reserves for the deposit were estimated using a gold price of US$1,200/oz. The mineral reserves are reported using a US$12.25/t milling NSR for ore that will be processed by milling and US$6.86/t heap leaching NSR for ore that will be processed by heap leaching in 2018. The proven and probable mineral reserves are 118.6 Mt with an average grade of 0.82 g/t Au.
25 .2 M I N I N G M E T H O D S Mining will use a conventional fleet consisting of seven diesel drills, two electric drills, one 29 m3 electric hydraulic shovel, two 21 m3 diesel hydraulic shovels, two 21.4 m3 wheel loaders, one 12 m3 wheel loader, fourteen 136 t trucks and ten 219 t trucks. The major equipment is supported by a fleet of graders, dozers, a backhoe and water trucks.
Ore and waste will be mined on 10 m benches. Mining is a conventional open pit mining delivering ore to the primary crusher for processing and waste rock will be placed in the south rock dump (SRD). The life of mine strip ratio is approximately 1.29:1.

K I Ş L A D A Ğ M I L L I N G P R O J E C T , T U R K E Y
T E C H N I C A L R E P O R T
2018 Final Report Page 25-2
A total of 152.4 Mt of waste will be mined (inclusive of the 63 Mt of pre-stripping waste). The average LOM gold grade is forecast to be 0.82 g/t Au. The recoverable grade is estimated to be 0.66 g/t for a LOM recovery of 80.1%.
25 .3 M E T AL L U R G I C AL TE S T W O R K Significant metallurgical testwork and analyses have been completed to confirm the process designs and substantiate stated recoveries.
The mineralogy of Kişladağ ore shows that gold occurs in fine grains (typically less than 10 microns in diameter) that are associated with pyrite, its oxidation products, and less commonly other sulfide phases (chalcopyrite, and sphalerite), as well as free grains attached to quartz, K-feldspar and albite. Both native gold and electrum (with up to 18 % Ag) have been identified.
For the metallurgical testwork required to support pre-feasibility, the Kişladağ ore body was divided into five different alterations (or ore types), namely argillic (ARG), potassic (POT), white mica tourmaline (WMT), friable (FRB), and Intrusion #3 (INT3).
The metallurgical testwork programs that were completed in support of the pre-feasibility study are as follows:
• Comminution testwork. • Flotation testwork. • Cyanidation and carbon adsorption testwork. • Cyanide detoxification testwork. • Geotechnical testwork. • Measurements of flow moisture point and transportable moisture limit. • Thickening and tailings filtration testwork.
Metallurgical testwork programs were performed by recognized testing facilities. Samples used for testing are considered to be representative of the various ore types at Kişladağ.
25 .4 P R O C E S S D E S I G N The process plant design will continue to utilize the existing three-stage crushing plant capable of processing 13.0 Mtpa to an 80% passing product size 6.5 mm.
The milling expansion will use conventional mineral processing equipment and the existing electrowinning and gold smelting equipment to produce a marketable gold doré.
Whole ore cyanide leach tests and carbon adsorption tests results demonstrated that the whole ore cyanide leach-CIP based process is robust for treatment of Kişladağ sulphide ore.
Bulk flotation was not considered economically viable because test results indicated that a significant mass pull is required and overall recovery would be significantly reduced compared to whole ore leaching.

K I Ş L A D A Ğ M I L L I N G P R O J E C T , T U R K E Y
T E C H N I C A L R E P O R T
2018 Final Report Page 25-3
Thickening and filtration of detoxified tailings are planned. The filtered tailings material will be transferred by means of overland conveyors to the new tailings management facility. Existing portable stacking equipment will be relocated and used for stacking the filtered tail.
The new process plant was designed on the basis of overall plant operating time of 93% and 365 days per year for a total operating time of 8,147 h/y. The process plant has been designed to produce up to approximately 306,000 oz/a gold as doré bar.
25 .5 P R O J E C T I N F R A S T R U C T U R E The new milling facility will be immediately adjacent to the crushing plant on the east side.
No upgrades are required to the existing access road, power or water supplies for the addition of the new facility.
Additional security fencing will be added to encompass the tailings management facility. There will be no additional access gate required.
Fresh water will continue to be supplied from the well fields and Gedikler dam. Existing water storage tanks and underground distribution system will continue to provide process, non-potable, and fire protection water as required.
The main substation at site is rated at 100 MVA with three 50 MVA 154 / 34.5 kV power transformers (one cold spare). The substation currently has abundant spare capacity and will require only minor modifications to accommodate the additional load associated with the milling expansion. Site distribution is at 34.5 kV and in local areas at 6.6 kV or 0.4 kV.
Existing ancillary buildings will continue to be utilized without modification. A new dry facility will be constructed to accommodate additional personnel required for the mill. The existing assay laboratory building will continue to be used for the milling operations, with new equipment as required.
Management of the site water will use the existing ponds and treatment plant as these are appropriately sized for the new facilities. The constructed areas will be sloped and ditched appropriately to tie into the existing systems.
25 .6 W AS T E R O C K D U M P The south rock dump holds approximately 180 Mt of waste with additional permitted capacity of 100 Mt. Most recent studies indicate that this can be increased to 155 Mt within the permitted boundaries. Additional capacity studies are ongoing that could accommodate an additional capacity of 200 Mt.
Options to utilize the permitted north rock dump against the mine plan will be investigated during the next phase.
K I Ş L A D A Ğ M I L L I N G P R O J E C T , T U R K E Y
T E C H N I C A L R E P O R T
2018 Final Report Page 25-4
25 .7 T AI L I N G S M AN A G E M E N T F AC I L I T Y A new dry stacked tailings facility and collection ponds will be constructed approximately 600 meters north of the current heap leach area and will be accessed by a new overland conveyor connected to the existing conveyor along the east side of the leach pad.
The approximate life-of-mine footprint to accommodate the berms and 120 Mt of tailings will be 1.6 km2.
25 .8 C AP I T AL AN D O P E R AT I N G C O S T S The capital cost estimate was developed in accordance with the standards outlined by the AACE. The cost estimate is a prefeasibility-level estimate categorized as AACE Class 4, with an expected accuracy range of -20% to +30%, including contingency.
Direct costs were developed from a combination of budget quotations, recent contract rates, relevant in-house data, historical benchmarks, and material take-offs. Indirect costs and owner’s costs were estimated in accordance with the Project execution strategy, relying on historical benchmarks, first principles calculations, and allowances.
Contingency was calculated based on the level of Project definition by discipline. Contingency for the capital cost estimate was estimated to be 17.3% of applicable costs.
Operating costs were calculated for each year of operation, totaling average of US$181.4 M per annum for an average of US$14.13/t ore over life-of-mine.
Open pit mining costs were estimated from first principles by unit operation. Historical averages of actual Kişladağ mining productivities and equipment operating cost were used for the estimate
The process operating cost estimate was developed based on a combination of actual annual costs for the crushing circuit and existing infrastructure, and from first principles for the new milling-leach plant. Reagent supply rates were based on current contract rates or budget quotations, and salaries were based on current Kişladağ actuals.
General and Administrative (G&A) costs were estimated based on actual G&A costs for the existing Kişladağ operations, with escalation to account for the expanded site footprint.
25 .9 E C O N O M I C AN AL Y S I S The economic model has been built from first principles and includes all relevant data. The qualified persons have a high level of confidence in the stated economic performance of the Project.
Based on the Project case metal price of US$1,300/oz Au and discount rate of 5%, the after-tax Project NPV is US$434.2 M and IRR is 22.1%. The payback period is 3.7 years.
The Project is also economic at the resource and reserve metal price of US$1,200/oz Au and discount rate of 5%, the after-tax Project NPV is US$283.7 M and IRR is 16.7%. The payback period is 4.6 years.

K I Ş L A D A Ğ M I L L I N G P R O J E C T , T U R K E Y
T E C H N I C A L R E P O R T
2018 Final Report Page 25-5
Silver credit was assumed to be US$8.50 per ounce of gold recovered, based on historical averages from the Kişladağ gold sales. Sales of gold receive 100% of the recovered gold in doré less the refining charges.
The economic model was subjected to a sensitivity analysis to determine the effects of changing metal prices and capital and operating expenditures on the Project financial returns. It was concluded that the Project economics are robust and will continue to be economic with higher capital and operating costs, or lower gold prices.
Eldorado’s forecasts of costs are based on a set of assumptions current as of the completion date of this report. The realized economic performance achieved on the Project may be affected by factors outside the control of Eldorado, including but not limited to mineral prices and currency fluctuations.
25 .10 P E R M I T T I N G The Kişladağ mine will require a new EIA to include the addition of the milling circuit and the storage of filtered tailings by dry stacking in a new facility.
Preparation to submit application for the revised permits is to start upon commencement of the next phase. The current schedule assumes successful EIA approval in Q2 2019.
Delays in permitting may impact the ability of Eldorado to implement the Project on time and budget.

K I Ş L A D A Ğ M I L L I N G P R O J E C T , T U R K E Y
T E C H N I C A L R E P O R T
2018 Final Report Page 26-1
SECTION • 26 RE COM M END ATI ONS The work completed in this prefeasibility study provides a technical and economic solution that forms the basis for proceeding with the development of the Kişladağ milling project. It is recommended to advance the Project by completing feasibility level design studies while undertaking the work described below.
26 .1 M I N I N G Opportunities may exist to improve the mine plan going forward during the feasibility study and basic engineering phase. These include:
• Schedule modifications to maximize the truck fleet utilization while avoiding capital equipment additions.
• Optimize the loading equipment fleet distribution including utilization of the Hitachi 5600 as the primary stripping shovel.
• Phase in the electric blasthole drills in wide areas of pit development rather than re-building older diesel drills.
• Look for opportunities to delay some of the stripping once the final pit phase development has reached a point where adequate ore has been released and operating widths might allow for sinking another internal phase.
• Continue testing and evaluate the economics to converting the haul trucks from the current conventional diesel engines to hybrid natural gas-diesel powered engines.
26 .2 P R O C E S S I N G Design opportunities that will further be investigated during the next phase include:
• Alternative systems of fine ore stockpiling and reclaiming system to compare capital and operational availability.
• Alternative comminution methods/technology and/or mill arrangement. • Comparison of existing secondary and tertiary crushing circuit versus a new SAG mill(s). • Comparison of leach density from 40% to 45%. • Confirm CIP tank stages from eight (current) versus six. • Review nomination of duty/standby pumps for secondary systems. • Samples for tailings filtration will be tested by selected vendors to obtain optimize filter
sizing and number of units to receive firm pricing. • Assess alternative sites for the tailings filtration plant closer to the tailings management
facility; compare economics of pumping tails versus using overland conveying system. • Review of elution circuit selection, compare current design selection of Zadra circuit with
AARL system. • Availability of second hand process equipment to reduce capital and mitigate schedule risk. • Overall site layout with the goal of potentially reducing footprint and therefore capital cost.
K I Ş L A D A Ğ M I L L I N G P R O J E C T , T U R K E Y
T E C H N I C A L R E P O R T
2018 Final Report Page 26-2
As cyanide destruction testing is ongoing, testwork data will to be reviewed and incorporated into future designs.
26 .3 I N F R AS T R U C T U R E
26.3.1 Tailings Management Tailings management design was preliminary as geo-stability and liner interface testing is ongoing. After the tests are completed, it is recommended to perform additional geotechnical studies in the area to optimize the design. Co-disposal of waste rock to increase the overall stability should also be reviewed.
26.3.2 Rock Dump Optimization of the south rock dump design should be reviewed. Final designs will need to be assessed after construction requirements for the plant, TMF, possible co-disposal in the TMF, and oxide waste rock requirements for closure areas are finalized and the volumes balanced.
26.3.3 Geotechnical Survey Geotechnical survey was completed for the plant site in preparation for the Phase IV expansion. Further geotechnical investigation will be initiated prior to the next phase based on the site layout completed during this phase.
26.3.4 Site Water Balance Site water balance and water catchment and distribution design will be updated to account for the new milling-leach circuit and the tailings management facility.
26 .4 O P E R AT I O N S The report outlines the milling study and economics that were developed as additional unit operations. Crushing circuit costs were taken from the current operating data. Full evaluation of the combined operation needs to be fully assessed and optimized. The use of the operational staff for early works projects and construction activities will be evaluated. Allowances made for maintenance and equipment upgrades in the existing crushing plant will need to be fully costed and scheduled.
26 .5 P E R M I T T I N G The Kişladağ mine will require a new EIA to include the addition of the milling circuit and addition of the dry stacked tailings facility. Preparation to submit an application for the revised permits will commence during the start of the next phase.

K I Ş L A D A Ğ M I L L I N G P R O J E C T , T U R K E Y
T E C H N I C A L R E P O R T
2018 Final Report Page 27-1
SECTION • 27 RE FERE NCES Agostini, S., Doglioni, C., Innocenti, F., Manetti, P., and Tonarini, S., 2010, On the geodynamics of the Aegean rift: Tectonophysics, v. 488, p. 7-21.
Baker, T., Bickford, D., Juras, S., Lewis, P., Oztas, Y., Ross, K., Tukac, A., Rabayrol, F., Miskovic, A., Friedman, R., Creaser, R.A., and Spikings, R., 2016, The Geology of the Kisladag Porphyry Gold Deposit, Turkey: SEG SPECIAL PUBLICATION 19, p. 57–83.
Eldorado Gold Corporation, 2010, Technical Report for the Kışladağ Gold Mine, Turkey, NI 43-101 Technical Report, January 2010.
Ercan, T., Dinçel, A., Metin, S., Türkecan, A., and Günay, E., 1978, Geology of the Neogene basins in Uşak region: Bulletin of the Geological Society of Turkey, v. 21, p. 97-106.
Hatch, 2003, Technical Report Kışladağ Project, Feasibility Study, NI 43-101 Technical Report, March 2003.
Jolivet, L., Faccenna, C., Huet, B., Labrousse, L., Le Pourhiet, L., Lacombe, O., Lecomte, E., Burov, E., Denèle, Y.; Brun, J.P., Philippon, M., Paul, A.; Salaün, G., Karabulut, H., Piromallo, C., Monié, P., Gueydan, F., Okay, A.I., Oberhänsli, R., Pourteau, A., Augier, R., Gadenne L., Driussi O., 2013, Aegean tectonics: Strain localization, slab tearing and trench retreat. Tectonophysics, v. 597, p. 1–33.
Karaoğlu, Ö., Helvacı, C., and Ersoy, Y., 2010, Petrogenesis and 40Ar/39Ar geochronology of the volcanic rocks of the Uşak-Güre basin, western Türkiye: Lithos, v. 119, Issues 3-4, p. 193-210.
Karaoğlu, Ö., and Helvaci, C., 2012, Structural evolution of the Uşak–Güre supra-detachment basin during Miocene extensional denudation in western Turkey: Journal of the Geological Society, v. 169, Issue 5, p. 627-642.
Micon, 2003, 2003 Update of Resources, Kışladağ Project, Usak, Turkey, NI 43-101 Technical Report, September 2003.
Richards, J. P., 2015, Tectonic, magmatic, and metallogenic evolution of the Tethyan orogen: From subduction to collision: Ore Geology Reviews, v. 70, p. 323–345.
Şengör, A.M.C., Yılmaz, Y., and Ketin, I., 1981, Remnants of a pre-Late Jurassic ocean in northern Turkey: fragments of a Permian-Triassic Paleotethys: Geological Society of American Bulletin, v. 91.
K I Ş L A D A Ğ M I L L I N G P R O J E C T , T U R K E Y
T E C H N I C A L R E P O R T
2018 Final Report Page 28-1
SECTION • 28 CER T IF IC ATES OF AU TH O RS AND D ATE AN D S IG N AT U R E P AGE
Date and Signature Page The effective date of this report entitled “Technical Report, Kışladağ Milling Project, Turkey” is March 16, 2018. It has been prepared for Eldorado Gold Corporation by David Sutherland, P. Eng., Stephen Juras, Ph.D., P.Geo, Paul Skayman, FAusIMM, and John Nilsson, P. Eng. , each of whom are qualified persons as defined by NI 43-101.
Signed the 29th day of March 2018.
“Signed and Sealed”
David Sutherland ____________________ David Sutherland, P. Eng.
“Signed and Sealed”
Stephen J. Juras _____________________ Stephen J. Juras, Ph.D., P. Geo.
“Signed”
Paul J. Skayman
______________________
Paul J. Skayman, FAusIMM
“Signed and Sealed”
John Nilsson
_____________________
John Nilsson, P. Eng.
K I Ş L A D A Ğ M I L L I N G P R O J E C T , T U R K E Y
T E C H N I C A L R E P O R T
2018 Final Report Page 28-2
CERTIFICATE OF QUALIFIED PERSON
David Sutherland, P. Eng. 1188 Bentall 5, 550 Burrard St.
Vancouver, BC Tel: (604) 601-6658 Fax: (604) 687-4026
Email: [email protected]
I, David Sutherland, am a Professional Engineer, employed as Project Manager, of Eldorado Gold Corporation located at 1188 Bentall 5, 550 Burrard St., Vancouver in the Province of British Columbia. This certificate applies to the technical report entitled Technical Report, Kışladağ Milling Project, Turkey, with an effective date of March 16th, 2018. I am a member of the Engineers & Geoscientists of British Columbia. I graduated from the Lakehead University with a Bachelor of Science (Physics) in 2003 and a Bachelor of Engineering (Mechanical) in 2005. I have practiced my profession continuously since 2005. As a result of my experience and qualifications, I am a Qualified Person as defined in National Instrument 43-101. I have visited the Kışladağ Gold Mine on numerous occasions with my most recent visit occurring on February 14 to February 16, 2018. I was responsible for coordinating the preparation of the technical report. I am responsible for the preparation or supervising the preparation of items 1, 2, 3, 4, 5, 6, 18, 19, 20, 21, 22, 23, 24, 25, 26, and 27 in the technical report. . I have not had prior involvement with the property that is the subject of this technical report. I am not independent of Eldorado Gold Corporation in accordance with the application of Section 1.5 of National Instrument 43-101. I have read National Instrument 43-101 and Form 43-101FI and the items for which I am responsible in this report entitled, Technical Report, Kışladağ Milling Project, Turkey, with an effective date of March 16th, 2018, has been prepared in compliance with same. As of the effective date of the technical report, to the best of my knowledge, information and belief, the items of the technical report that I was responsible for contain all scientific and technical information that is required to be disclosed to make the technical report not misleading
Dated at Vancouver, British Columbia, this 29th day of March 2018.
“Signed and Sealed”
David Sutherland
________________________
David Sutherland, P. Eng.

K I Ş L A D A Ğ M I L L I N G P R O J E C T , T U R K E Y
T E C H N I C A L R E P O R T
2018 Final Report Page 28-3
CERTIFICATE OF QUALIFIED PERSON
Stephen J. Juras, P.Geo. 1188 Bentall 5, 550 Burrard St.
Vancouver, BC Tel: (604) 601-6658 Fax: (604) 687-4026
Email: [email protected]
I, Stephen J. Juras, am a Professional Geoscientist, employed as Director, Technical Services, of Eldorado Gold Corporation and reside at 9030 161 Street in the City of Surrey in the Province of British Columbia. This certificate applies to the technical report entitled Technical Report, Kışladağ Milling Project, Turkey, with an effective date of March 16th, 2018. I am a member of the Engineers & Geoscientists British Columbia (formerly the Association of Professional Engineers and Geoscientists of British Columbia). I graduated from the University of Manitoba with a Bachelor of Science (Honours) degree in geology in 1978 and subsequently obtained a Master of Science degree in geology from the University of New Brunswick in 1981 and a Doctor of Philosophy degree in geology from the University of British Columbia in 1987. I have practiced my profession continuously since 1987 and have been involved in: mineral exploration and mine geology on gold, copper, zinc and silver properties in Canada, United States, Brazil, China, Greece and Turkey; and ore control and resource modelling work on gold, copper, zinc, silver, platinum/palladium and industrial mineral properties in Canada, United States, Mongolia, China, Brazil, Turkey, Greece, Romania, Peru and Australia. As a result of my experience and qualifications, I am a Qualified Person as defined in National Instrument 43-101. I have visited the Kışladağ Gold Mine on numerous occasions with my most recent visit occurring on February 14 to February 15, 2018. I was responsible for reviewing matters related to the geological data and directing the mineral resource estimation and classification work for the Kışladağ Milling Project, Turkey. I am responsible for the preparation or supervising the preparation of items 7, 8, 9, 10, 11, 12 and 14 in the technical report. I have not had prior involvement with the property that is the subject of this technical report. I am not independent of Eldorado Gold Corporation in accordance with the application of Section 1.5 of National Instrument 43-101. I have read National Instrument 43-101 and Form 43-101FI and the items for which I am responsible in this report entitled, Technical Report, Kışladağ Milling Project, Turkey, with an effective date of March 16th, 2018, has been prepared in compliance with same. As of the effective date of the technical report, to the best of my knowledge, information and belief, the items of the technical report that I was responsible for contain all scientific and technical information that is required to be disclosed to make the technical report not misleading
Dated at Vancouver, British Columbia, this 29th day of March 2018.
“Signed and Sealed”
Stephen J. Juras
________________________
Stephen J. Juras, Ph.D., P.Geo.

K I Ş L A D A Ğ M I L L I N G P R O J E C T , T U R K E Y
T E C H N I C A L R E P O R T
2018 Final Report Page 28-4
CERTIFICATE OF QUALIFIED PERSON
Paul J. Skayman, FAusIMM 1188 Bentall 5, 550 Burrard St.
Vancouver, BC Tel: (604) 601-6658 Fax: (604) 687-4026
Email: [email protected]
I, Paul J. Skayman, am a Professional Extractive Metallurgist, employed as Chief Operating Officer, of Eldorado Gold Corporation and reside at 3749 West 39th Avenue in Dunbar, Vancouver in the Province of British Columbia. This certificate applies to the technical report entitled, Technical Report, Kışladağ Milling Project, Turkey with an effective date of March 16th, 2018. I am a fellow of the Australian Institute of Mining and Metallurgy. I graduated from the Murdoch University with a Bachelor of Science (Extractive Metallurgy) degree in 1987. I have practiced my profession continuously since 1987 and have been involved in operation and management of gold extraction operations in Australia, Ghana, Tanzania, Guinea and China. This work has also included Feasibility Studies, Project Acquisition and Development / Construction of said projects. As a result of my experience and qualifications, I am a Qualified Person as defined in National Instrument 43-101. I have visited the Kışladağ Gold Mine on numerous occasions with my most recent visit occurring on January 23 to January 25, 2018. I was responsible for reviewing matters related to the metallurgical data for the Kışladağ Milling Project in Turkey. I am responsible for the preparation or supervising the preparation of Sections 13 and 17 in the technical report. I have not had prior involvement with the property that is the subject of this technical report. I am not independent of Eldorado Gold Corporation in accordance with the application of Section 1.5 of National Instrument 43-101. I have read National Instrument 43-101 and Form 43-101FI and the items for which I am responsible in this report entitled, Technical Report, Kışladağ Milling Project, Turkey , with an effective date of March 16th, 2018, has been prepared in compliance with same. As of the effective date of the technical report, to the best of my knowledge, information and belief, the items of the technical report that I was responsible for contain all scientific and technical information that is required to be disclosed to make the technical report not misleading
Dated at Vancouver, British Columbia, this 29th day of March 2018.
“Signed”
Paul J. Skayman
________________________
Paul J. Skayman, FAusIMM

K I Ş L A D A Ğ M I L L I N G P R O J E C T , T U R K E Y
T E C H N I C A L R E P O R T
2018 Final Report Page 28-5
CERTIFICATE OF QUALIFIED PERSON
John Nilsson, P. Eng. Email: [email protected]
I, John Nilsson, am a Professional Engineer, employed as President, of Nilsson Mine Services Ltd. and residing at 20263 Mountain Place in the city of Pitt Meadows in the Province of British Columbia. This certificate applies to the technical report entitled Technical Report, Kışladağ Milling Project, Turkey, with an effective date of March 16th, 2018. I am a member of the Engineers & Geoscientists British Columbia (formerly the Association of Professional Engineers and Geoscientists of British Columbia). I graduated from Queen’s University with a Bachelor of Science degree in geology in 1977 and subsequently a Master of Science degree through the Department of Mining Engineering in 1990. I have practiced my profession in geology and mining continuously since 1977 and have worked on mining related precious and base metal projects in North America, Central America, South America, Africa, Europe and Asia. As a result of my experience and qualifications, I am a qualified person as defined in National Instrument 43-101. I have visited the Kışladağ Gold Mine site on September 22 to September 27, 2017. I was responsible for developing the mine plan for the Kışladağ Milling Project in Turkey. I am responsible for the preparation or supervising the preparation of Sections 15 and 16 in the technical report. I have not had prior involvement with the property that is the subject of this technical report. I am independent of Eldorado Gold Corporation in accordance with the application of Section 1.5 of National Instrument 43-101. I have read National Instrument 43-101 and Form 43-101FI and the items for which I am responsible in this report entitled, Technical Report, Kışladağ Milling Project, Turkey, with an effective date of March 16th, 2018, has been prepared in compliance with same. As of the effective date of the technical report, to the best of my knowledge, information and belief, the items of the technical report that I was responsible for contain all scientific and technical information that is required to be disclosed to make the technical report not misleading
Dated at Vancouver, British Columbia, this 29th day of March 2018.
“Signed and Sealed”
John Nilsson
________________________
John Nilsson, P. Eng.

K I Ş L A D A Ğ M I L L I N G P R O J E C T , T U R K E Y
T E C H N I C A L R E P O R T
2018 Final Report Page 28-6