kiran project2011
TRANSCRIPT

8/6/2019 kiran project2011
http://slidepdf.com/reader/full/kiran-project2011 1/61
Inventory Management
INTRODUCTION
Inventory management is concerned with keeping enough products on hand to
avoid running out while at the same time maintaining a small enough inventory
balance at allow for a reasonable return on investment, proper inventory management
is important to the financial health of the corporation, being out of stock forces
customers to turn to competitors or results in a loss of sales excessive level of
inventory, however results in large inventory carrying costs, including the cost of the
capital tied up in inventory where house fees insurance etc. The objective of thechapter is to examine the impact of inventory on the financial decision making.
Inventories constitute the most significant part of current asserts of a large
majorities of companies in INDIA. On an average inventories are approximately 60%
of current asserts in public limited companies in INDIA. Because of the large size of
inventories maintained by firms, a considerable amount of funds is required to be
committed to them.
The investment in inventory is very high in most of the undertaking engaged
in manufacturing wholesale and retail trade. The amount of investment is sometimes
more in Inventory rather than in other assets.
In India a study of 29 major industries has revealed that the average cost of
materials is 64 paisa and the cost of labor and overheads is 36 paisa of a rupee. About
90% of working capital is invested in inventories. The main reason attributed for loss
making is financial indiscipline in managing the resources particularly in inventory
management for an organization, the product profitability considering standards and
budgets is of paramount importance needless to say that in this context, inventory
management assumes lot of significances.
The investment in inventory is very high in most of the undertaking engaged
in manufacturing wholesale and retail trade. The amount of investment is sometimes
KOTTAM KARUNAKARA REDDY INSTITUTE OF TECHNOLOGY 1

8/6/2019 kiran project2011
http://slidepdf.com/reader/full/kiran-project2011 2/61
Inventory Management
more in Inventory rather than in other assets.
In India a study of 29 major industries has revealed that the average cost of materials is 64 paisa and the cost of labor and overheads is 36 paisa of a rupee. About
90% of working capital is invested in inventories. The main reason attributed for loss
making is financial indiscipline in managing the resources particularly in inventory
management for an organization, the product profitability considering standards and
budgets is of paramount importance needless to say that in this context, inventory
management assumes lot of significances.
Hence, the inventory management determines and portrays the following
factors like what to purchase, how to purchase, from where to purchase, where to
store etc., will be critical factors. Hence forth it becomes a crucial factor to undergo a
detailed analysis to find an efficient system of the inventory. As an attempt has been
made to study the inventory management with reference to PHILLIPS INDIA (P)
LTD.
DEFINITION:
The American production and inventory society defines:
“Inventory management as the branch of business management concerned
with planning and controlling inventories. The role inventory management is to
maintain a desired stock level of specific products or items”.
NEED FOR THE STUDY:
• To facilitate smooth production and sales operation (Transaction motive).
• To guard against the risk of unpredictable changes in usage rate and delivery time
“(Precautionary motive )
• To guard against the risk of unpredictable changes in usage rate and delivery time
“(Precautionary motive )
• To take advantages of price fluctuations(Speculative motive)
KOTTAM KARUNAKARA REDDY INSTITUTE OF TECHNOLOGY 2
8/6/2019 kiran project2011
http://slidepdf.com/reader/full/kiran-project2011 3/61
Inventory Management
SCOPE OF THE STUDY:
• Work in progress arising under construction contracts including directly related
service contract.
• Work in progress arranging in ordinary course of business of services provides.
OBJECTIVES:
•
To maintain a large size of inventory of raw material and work in progress for efficient and smooth production and of finished goods for uninterrupted sales
operations.
• To maintain a minimum investment on inventory to maximise profitability.
• Study of maintain optimum level of inventory investment.
• The primary goal is to minimize inventory investment while still meeting the
functional requirements.
KOTTAM KARUNAKARA REDDY INSTITUTE OF TECHNOLOGY 3

8/6/2019 kiran project2011
http://slidepdf.com/reader/full/kiran-project2011 4/61
Inventory Management
METHODOLOGY AND DATABASE:
For this project the collection of data is by various sources. Mainly
• Primary
• Secondary
PRIMARY DATA:
The information collected directly without any reference in primary data in the study
it is mainly through concerned offers or staff member either individually or
collectively data includes
®Conducting personal interview with officers of the company.
® Individual observation inference.
®From the people who are directly involved with the transaction of the firm.
SECONDARY DATA:
Study has been taken from secondary sources that is published annual report
of the editing, classifying and tabulation of the financial data for their.
PERIOD OF THE STUDY:
This study is confined for the period of approximately Three months that is
from 9th May 2011 to 15 th June 2011.
STATISTICAL TOOL TO BE APPLIED:
Sampling statistical techniques like percentages, bar graphs, averages, chi-
squares, and z-test may be applied based on the data collected for the study.
KOTTAM KARUNAKARA REDDY INSTITUTE OF TECHNOLOGY 4

8/6/2019 kiran project2011
http://slidepdf.com/reader/full/kiran-project2011 5/61
Inventory Management
TOOLS AND TECHNIQUES OF INVENTORY MANAGEMENT:
Effective inventory management requires an effective control system for
inventories. A proper inventory control not only helps in solving the acute problem of
liquidity but also increases profits and causes substantial reduction in the working
capital of the concern. The following are the important tools and techniques of inventory management and control:
• Determination of stock levels.
• Determination of Safety Stocks.
• Selecting a proper system of Ordering for Inventory.
• Determination of Economic Order Quantity.
• A.B.C. Analysis.
• Inventory Turnover Ratios (Conversion period)
• Classification and Codification of Inventories.
• Preparation of Inventory Reports.
Determination of stock levels.
Determination of safety stock levels.
Selecting a proper system of ordering for inventory.
Determination of economic order quantity (EOQ)
A.B.C. Analysis.
KOTTAM KARUNAKARA REDDY INSTITUTE OF TECHNOLOGY 5
8/6/2019 kiran project2011
http://slidepdf.com/reader/full/kiran-project2011 6/61
Inventory Management
LIMITATIONS:
• First there is a cost of information problem in keeping track of the physical
inventories of some goods
•
Second because of number of variables involved it is very difficult to developon accurate measure of inventory turnover.
• The very nature of the organization places limitations on the collection of the
data and analysis thereof.
• The accounting procedure and other accounting principles are limited by the
company changes in them may vary the inventory performance.
• The study is limited up to the date and information provided by PHILLIPS
INDIA (P) LTD. and annual reports.
KOTTAM KARUNAKARA REDDY INSTITUTE OF TECHNOLOGY 6

8/6/2019 kiran project2011
http://slidepdf.com/reader/full/kiran-project2011 7/61
Inventory Management
INDUSTRY PROFILE
Black & white Televisions have been in the Indian market from the
inception of TV into the Indian market. After two decades entered the colour TVswhich now has become an essential household appliance. Television industry is being
invaded by many companies, however, a few have emerged as the market leaders.
These Philips, BPL, Onida, Videocon, Sansui, LG, etc. There is a slump in the sales
of colour Televisions during the past quarter year. Analysis and research work is
being done to find out reasons for the sudden slump of sales. Philips India Ltd, which
is one of the leading brands in CTV industry, is also engaged to find out the reasons
behind the slump and analyze the importance of various sales promotional schemes,which increases the sales of colour TVs.
CTV industry consists of many companies such as Philips, BPL, Onida,
Sansui, Videocon, LG, etc. the B\W TVs and CTVs are categorized as two separate
segments of the industry. The market shares held by various branded and unbranded
CTVs are given below. Philips India Ltd. Enjoys a market share of 12% in the entire
B\W TV industry. BPL enjoys market share of 14%, Videocon a share of 4%, Onidawith 13% market share and Sansui with a share of 6%$ and the remaining market is
captured by other brands.
KOTTAM KARUNAKARA REDDY INSTITUTE OF TECHNOLOGY 7

8/6/2019 kiran project2011
http://slidepdf.com/reader/full/kiran-project2011 8/61
Inventory Management
The World Consumer Electronics Industry Guide is an important source for
exclusive data and analysis that covers the consumer electronics industry. The
electronics industry is very dynamic and new products are launched everyday in the
consumer electronics sector. The demands of the consumers are ever increasing andthe companies are using state-of-the-art technologies to stay in the competition. The
ever-changing electronics sector holds a great potential not only for the new-entrants,
but also for the existing industry giants. The Industry Analysis report that we have
prepared looks at all the elements that can affect any company’s fortunes positively.
Our report sheds light on all the industry’s players, new as well as old. The
information includes the positioning of every player in the competitive environment.
The strategies, future plans, and market positioning are assessed for every industrial player.
Our report can help in analyzing and identifying the potential areas that can
be exploited by both the existing and the new entrants in the sector. An industry
analyst can utilize the data that we provide, which covers the comparative data from
previous years along with the current year (2005). The data includes a tabulated
version of the total shipment value of the consumer electronics, along with the
number of companies that report the shipments by the product codes and class. A
table that compares the domestic outputs, imports and exports is also given in the
report. Our industry analysis report is an indispensable and a valuable tool that can be
used by company analysts, decision makers, and the ones who wish to enter this
industry. The existing operators can also identify the areas that can be tapped.
KOTTAM KARUNAKARA REDDY INSTITUTE OF TECHNOLOGY 8
8/6/2019 kiran project2011
http://slidepdf.com/reader/full/kiran-project2011 9/61
Inventory Management
Overview
The consumer electronics industry manufactures and distributes everything
from stereo components, televisions, VCRs, and DVD and MP3 players basically,
everything you see when you go into a Best Buy or Circuit City store. (Some industry
observers also include desktop and laptop PC manufacturers as part of the industry.)
Needless to say, consumer electronics is big business. In 2005, in the U.S. alone,
consumers spent more than $75 billion on consumer electronics products, 8 percent
more than in 2004.
The industry employs a host of engineers, designers, marketers, salespeople,
customer service reps, and finance gurus to continually improve familiar products aswell as come up with the next big must-have gadget. Although much of the actual
manufacturing of consumer electronics products is done in Asia and other low labor-
cost locations, there are many career opportunities in the industry in the United States.
On the technical side, opportunities exist for software and electronics engineers,
quality assurance engineers, industrial designers, manufacturing design engineers, and
IT professionals. If you're a people person or if you can design a marketing campaign,
close a distribution deal with a major retail chain, write marketing copy, or help a
confused consumer understand a complex product, consumer electronics companies
may be good places for you, too.
You can earn your stripes at a multinational corporation like Samsung or
Mitsubishi, where big money backs big products such as high-definition television
(HDTV). Or you can try your hand at a startup that's pushing the consumer-
electronics envelope in one market niche or another. So before you start your job
search, think about whether you like the structure and resources (and bureaucracy)
KOTTAM KARUNAKARA REDDY INSTITUTE OF TECHNOLOGY 9

8/6/2019 kiran project2011
http://slidepdf.com/reader/full/kiran-project2011 10/61
Inventory Management
that a big organization will have or prefer the flexibility and cutting-edge spirit (and
bare-bones budget) of a younger, smaller company.
Job seekers should also keep in mind that many consumer electronics
products are global brands, so many companies have opportunities for international
positions and travel, and foreign language skills are often highly desirable. And in theUnited States, though there is some concentration of consumer electronics jobs on the
East and West Coasts, the industry is sprawled across the country. Many of the large
companies have multiple offices to choose from, with each location housing a
different product line or corporate function.
These days, because so many consumer electronics products rely on
semiconductors for their functionality, Moore's Law, which states that semiconductor
speed doubles every 18 months, applies just as much to the consumer electronics
industry as it does to computer hardware. Because of this, consumer electronics
companies are developing new and improved products all the time. If you're one of
the many consumers who need to have the latest and greatest gadgets, it's going to
cost you a pretty penny to stay on the cutting edge. But if you don't need top-of-the-
line consumer electronics products if you're happy with getting a 4-megapixel digital
camera, for instance, and are prepared to leave the 8-megapixel camera to the
hardcore gadget-heads just wait a little while, and the price on the product that’s right
for you will almost certainly decrease substantially.
As usual in consumer electronics, these days there are a number of cool, new
products on or about to reach electronics store shelves. For instance, to take advantage
of the improved sound offered by digital radio, many of the big electronics makers are
bringing digital home and car radios to market. Digital cameras, meanwhile, are
increasingly likely to include significant digital video recording capability. And there
KOTTAM KARUNAKARA REDDY INSTITUTE OF TECHNOLOGY 10

8/6/2019 kiran project2011
http://slidepdf.com/reader/full/kiran-project2011 11/61
Inventory Management
are refrigerators on the market with TV screens embedded in them, which you even
can use to surf the ’Net. Satellite TV in your car; satellite radio systems that give youlive, up-to-the-minute reports on traffic conditions; handheld media-storage devices;
live TV on your cell phone the list of innovative new consumer electronics products
already on or about to hit the market goes on and on.
COMPANY PROFILE
The company was founded in 1891 by Gerard Philips, a maternal cousin of Karl Marx, in Eindhoven, Netherlands. Its first products were light bulbs and other
electro-technical equipment. Its first factory survives as a museum devoted to light
sculpture. In the 1920s, the company started to manufacture other products, such as
vacuum tubes (also known worldwide as 'valves'), In 1927 they acquired the British
electronic valve manufacturers Mullard and in 1932 the German tube manufacturer
Valvo, both of which became subsidiaries. In 1939 they introduced their electric
razor , the Philishave (marketed in the USA using the Norelco brand name). Philipswas also instrumental in the revival of the Stirling engine.
Philips Radio
KOTTAM KARUNAKARA REDDY INSTITUTE OF TECHNOLOGY 11

8/6/2019 kiran project2011
http://slidepdf.com/reader/full/kiran-project2011 12/61
Inventory Management
On 11 March 1927 Philips went on the air with two shortwave radio
stations, PHOHI broadcasting in Dutch to the Dutch East Indies (now Indonesia) and
PCJJ (later PCJ) which broadcast in English, Spanish and German to the rest of the
world.
The international program on Sundays commenced in 1928 with host Eddie
Startz hosting the Happy Station show which became the world's longest running
shortwave program.
Broadcasts from the Netherlands were interrupted by the German invasion in
May 1940. The transmitters in Huizen were commandeered by the Germans and used
for pro-Nazi broadcasts, some originating from Germany, others concerts from Dutch
broadcasters under German control.
Philips Radio did not resume after Liberation. Instead the two shortwave
stations were nationalised and became Radio Netherlands Worldwide, the Dutch
International Service in 1946 though PCJ programs such as Happy Station continued
on the new station.
PHILIPS IN INDIA
Philips started operations in India at Kolkata (Calcutta) in 1930 under the
name Philips Electrical Co. (India) Pvt Ltd, comprising a staff of 75. It was a sales
outlet for Philips lamps imported from overseas.
KOTTAM KARUNAKARA REDDY INSTITUTE OF TECHNOLOGY 12

8/6/2019 kiran project2011
http://slidepdf.com/reader/full/kiran-project2011 13/61
Inventory Management
In 1938 ,Philips India set up its first Indian lamp-manufacturing factory in
Kolkata. After the Second World War in 1948, Philips started manufacturing radios inKolkata. In 1959, a second radio factory is established near Pune.
• In 1957, the company is converted into a public limited company, renamed
"Philips India Ltd".
• In 1965 on 3 April, the millionth Philips radio is manufactured in India.
• In 1970 a new consumer electronics factory is started in Pimpri near Pune.
(This factory was shut down in 2006.)
• In 1982, Philips brought colour television transmission to India with the
supply of four outdoor broadcast vans to DD National during the IX Asian
Games.
• In 1996, the Philips Software Centre was established in Bangalore (It is now
called the Philips Innovation Campus).
• In 2008, Philips India entered a new product category, water purifiers
designed and made in India, and exported to other countries.
As of 2008, Philips India has about 4,000 employees.
Philips India Ltd. Has broadly classified its areas of production under
consumer electronics in which it is enjoying a share of 33% in the entire industry and
domestic appliances, a share of 20%. Lighting has a share of 35% and industrial
equipment a share of 12% in the entire industry in the consumer electronics segment,
Philips India Ltd. Deals with B\W TV, CTV and Audio Systems.
In the colour TV segment it enjoys a share of 6 and B\W a share of 12% in the
entire industry. In the Audio Systems segment it enjoys a market share of 35%.
Philips Electronics India, India’s largest lighting company operates in business
areas of Lamps, Luminaries, Lighting Electronics, Automotive and Special Lighting.
Today, as global leader in Lighting, Philips is driving the switch to energy-efficient
KOTTAM KARUNAKARA REDDY INSTITUTE OF TECHNOLOGY 13
8/6/2019 kiran project2011
http://slidepdf.com/reader/full/kiran-project2011 14/61
Inventory Management
solutions. With worldwide electrical lighting using 19 per cent of all electricity, the
use of energy-efficient lighting will significantly reduce energy consumption aroundthe world.
Philips provides advanced energy-efficient solutions for all segments: road
lighting, office & industrial, hospitality and home. Philips is also a leader in shaping
the future with exciting new lighting applications and technologies such as LED
technology, which, besides energy efficiency, provides attractive benefits and endless
new ‘never-before-possible’ lighting solutions.
In 2008, Philips inaugurated a global research and development (R&D) centre
for lighting electronics in India. This was its third such unit in the world. The facility
which is situated in Noida will not only cater to the needs of the Indian market but
also the Asia-Pacific, Europe and North America. The other R&D centres are located
at Eindhoven in the Netherlands and in Shanghai, China.
KOTTAM KARUNAKARA REDDY INSTITUTE OF TECHNOLOGY 14

8/6/2019 kiran project2011
http://slidepdf.com/reader/full/kiran-project2011 15/61
Inventory Management
INVENTORY MANAGEMENT
INTRODUCTION:
The investment in inventory is very high in most of the undertakings engaged
in manufacturing, whole-sale and retail trade. The amount of investment is sometime
more in inventory than in other assets. In India, a study of 29 major industries has
revealed that the average cost of materials is 64 paisa and the cost of labour and
overheads is 36 paisa in rupee. In Industries like sugar, the raw materials cost is a s
high as 68.75 percent of the total of cost. About 90 percent part of working capital is
invested in inventories. It is necessary for every management to give proper attention
to inventory management. A proper planning of purchasing, handling, storing and
accounting should form a part of inventory management. An efficient system of
inventory management will determine (a) what to purchase (b) how much to purchase
(c) from where to purchase (d) where to store, etc.
There are conflicting interests of different departmental heads over the issue of
inventory. The finance manager will try to invest less in inventory because for him it
is an idle investment, whereas production manager will emphasize to acquire more
and more inventory as he does not want any interruption in production due to shortage
of inventory. The purpose of inventory management is to keep the stocks in such a
way that neither there is over-stocking nor under-stocking. The over-stocking will
KOTTAM KARUNAKARA REDDY INSTITUTE OF TECHNOLOGY 15

8/6/2019 kiran project2011
http://slidepdf.com/reader/full/kiran-project2011 16/61
Inventory Management
mean a reduction of liquidity and staring of other production processes; under-
stocking, on the other hand, will result in stoppage of work. The investments ininventory should be kept in reasonable limits.
Every enterprises needs inventory for smooth running its activities. It serves as
a link between production and distribution processes. There is, generally, at a
time lag between the recognition of a need and its fulfillment. The greater the
time-lag, the higher the requirement for inventory, the unforeseen fluctuations
in demand and supply of goods also necessitate the need for inventory. It also
provides a cushion for future price fluctuations.
The investment in inventories constitutes the most significant part of current
assets/working capital in most of the undertakings. Thus it is very essentials to
have proper control and management of inventories. The purpose of inventory
management is to ensure a variability of materials in confident quantity as and
when required and also to minimize Investment in inventories.
Meaning and Nature of Inventory:
Supply of goods or materials on hand. In manufacturing, inventory consists of raw
materials, work-in-process, and finished goods. In wholesaling and retailing,
inventory is the stock of merchandise on hand. In direct marketing, inventory may
refer to direct-mail package components that are available for mailing when needed.
In the broadcast and print media industry, inventory is the time or space available for
mailing when needed. In the broadcast and print media industry, inventory is the time
or space available for sale to advertisers. In magazine publishing, inventory is the
number of copies of each issue available for distribution.
An ample inventory ensures that sales will not be lost or deadlines missed but
can require a substantial cash investment in both material and storage space. There are
also risks associated excessive inventory, such as a change in circumstances that
reduces or eliminates demand for an item in inventory or that renders the item
KOTTAM KARUNAKARA REDDY INSTITUTE OF TECHNOLOGY 16
8/6/2019 kiran project2011
http://slidepdf.com/reader/full/kiran-project2011 17/61
Inventory Management
obsolete or illegal, or the risk of loss due to theft, fire, aging, and so forth. The costs
and risks must be weighed against the cost of lost sales and missed deadlines todetermine the optimal inventory level.
INVENTORY CONTROL AND ITS IMPACT ON COSTS:
Value wise inventory and consumption analysis are brought out on quarterly
basis indicating RM; SS, CT, PM are value at cost. A class items which are 70%, B
class items which are valuing 20% and C class items which are valuing 10%. Of the
total inventory are brought for verification of internal audit. The stores verified C
class items and to that extent certificate 4 is issued at the year end regarding the
correctness. Physical balances are verified with kardex and the difference is intimated
to stores FAW of the group by the internal audit.
FAW of the group verifies and gives the rectification in entries that is shortage
items values are charged of to physical inventory variation and the excess quantities
are adjusted in the inventory ledger after obtaining the competent authorities approval.
This system enables control on the inventories and at the same time costs on
some are checked.
Materials issued to subcontractors are booked to consumptions as and when
issued through MIRS. A record is being maintained at subcontracts section, park wise,
job wise and description of materials and quantities issued.
KOTTAM KARUNAKARA REDDY INSTITUTE OF TECHNOLOGY 17

8/6/2019 kiran project2011
http://slidepdf.com/reader/full/kiran-project2011 18/61
Inventory Management
Impact of inventory on working capital
Inventories are a component of the firm’s working capital and, as such,represent a current accounting cycle, which is normally one year.
1. A CURRENT ASSET: It as assumed that inventories will be
converted to cash in the current accounting cycle, with is normally one year.
2. LEVEL OF LIQUIDITY: inventories are viewed a source of
near all cash. For most products, this description is accurate, at the same time
most firms hold some slow moving items that may not be sold for a long time.
With economic slows down or changes in the markets for goods the prospects for
sale of entire product lines diminished. In these cases, the liquidity aspects of
inventories become highly important to the manager of working capital. At the
minimum the analyst must recognize that inventories are the least liquid of the
current assets.
3. LIQUIDIRY LAGS: inventories are tied to the firm’s pool of
the working capital in a process that involves three specific lags.
Creation lags: It most cases, inventories are purchased on credit, creating an
account payable. When the raw materials are processed in the factory, the case to
pay production expenses is transferred at future times. Whether manufactured or
purchases, the firms will hold inventories for some period before payment is
made. This liquidity lag offers a benefit to the firm.
Storage lags: once goods are available for resale, they will not be immediately
converted into cash. First the items must be sold. Evenly when sale are moving
briskly, affirm will hold inventory as a backup. Thus the firm will usually pay
suppliers, workers and overhead expenses before the goods actually sold.
This lag represents a cost to the firm.
Sale lag: once goods have been sold, they normally do not create cash
immediately. Most sales occur on credit and become accounts receivable. This lag
also represents a cost to the firm.
KOTTAM KARUNAKARA REDDY INSTITUTE OF TECHNOLOGY 18

8/6/2019 kiran project2011
http://slidepdf.com/reader/full/kiran-project2011 19/61
Inventory Management
4. CIRUCLATING ACTIVITY: inventories are in rotating pattern with other
current asset. They get converted into receivables which generate cash is investedagain in inventory to continue the operate cycle.
NEED TO HOLD INVENTORY
Maintaining inventories involves tying up of the company’s funds and
incurrence of storage and handling costs. There are three are general motives for
holding inventories.
1. Transactionary motive: every firm has to maintain some level of
inventory to meet the day-to-day requirements of sale, production process,
customer demand etc. transact nary motive makes the firm to keep the inventory
will provide smoothness to the operation of the firm. A business firm exists for
business transaction that requires stock of goods and raw materials.
2. Precautionary motive: a firm should keep some inventory for unforeseen
circumstances also. The firm must have inventory of raw materials as will as
finished goods for meeting any emergencies.
3. Speculative motive: the firm may be empted to keep some inventory in
order to capitalize an opportunity to make profit e.g., sufficient level of inventory
may help the firm to earn extra profit in case expected shortage in the market.
MAIN PURPOSE OF INVENTORY
The purpose of holding inventories is to allow the firm to operate the
processes of purchasing, manufacturing and marking in its primary products. The goal
is to achieve efficient in are where costs are involved and to achieve sales at
competitive prices in the marking place.
1. Avoiding loss sales: Without goods on hand that are ready to be sold most
firms would lose business. Some clusters are ready to wait, particularly when
an item must be made on order or is not widely available from competitors.
Affirm must be prepared to deliver goods on demand. Shelf stock refers to
KOTTAM KARUNAKARA REDDY INSTITUTE OF TECHNOLOGY 19

8/6/2019 kiran project2011
http://slidepdf.com/reader/full/kiran-project2011 20/61
Inventory Management
items that are stored by the firm and sold with little or no modification to the
customers.2. Gaining quantity discounts: Inurn for making bulk purchases many suppliers
will reduce the supplies and component parts. This discount will reduce cost
of goods sold and increase the profits earned.
3. Reducing order cost: each time a firm place an order it incur certain good
that arrive must be accepted, inspected and counted. Later an invoice must be
processed and payment made. Each of these costs will vary with the order
placed. By placing fewer orders the firm will pay less to process each order.
4. Achieving efficient production runs: each time a firm sets up workers and
machines produce an item startup cost are incurred. These are the absorbed as
production begins. The longer the run the smaller the costs to begin producing
the goods.
5. Reducing risk of production shortages: manufacturing firm frequently
produce goods with blunders or thousands of components. If any these are
missing entire production operation can be halted with heavy expenses. To
avoid starting a production run and then discovering the shortage of vital raw
material or other component, the firm can maintain larger than inventories.
Basically, inventory management is concern of stores management, production
management is concerned. In case of raw material, the stores management and
production management is concerned. In case of finished goods, production
and sales management is concerned.
INVENTORY-CORPORATE FINANCE:
Value of a firm’s raw materials, work in process, supplies used in operations,
and finished goods. Since inventory value changes with price fluctuations, it is
important to know the method of valuation. There are a number of inventory valuation
methods; the most widely used are First In, First out (FIFO) and Last In, First out
(LIFO). Financial statements normally indicate the basis of inventory valuation,
generally the lower figure of either cost price or current market price, which precludes
KOTTAM KARUNAKARA REDDY INSTITUTE OF TECHNOLOGY 20

8/6/2019 kiran project2011
http://slidepdf.com/reader/full/kiran-project2011 21/61
Inventory Management
potentially overstated earnings and assets as the result of sharp increases in the price
of raw materials.Personal finance;
List of all assets owned by an individual and the value of each, based on cost,
market value, or both. Such inventories are usually required for property insurance
purpose and are sometimes required with applications for credit.
Securities:
Net long or short position of a dealer or specialist. Also, securities bought and
held by a dealer for later resale.
Inventory:
An inventory is a detailed, itemized list or record of goods and materials in a
company’s possession. “The main components of inventory, “wrote Transportation
and Distribution contributors David Waller and Barbara Rosenbaum, “are cycle stock:
the order quantity or lot size received from the plant or vendor; in-transit stock:
inventory in shipment from the plant or vendor or between distribution centers; [and]
safety stock: each distribution center’s inventory buffer against forecast error and lead
time variability.”
Writing in production and Operations Management, Howard J. Weiss and
Mark E. Gershon observed that, historically, there have been two basic inventory
systems and the periodic review system. With continuous review systems, the level of
a company’s inventory is monitored at all times. Under these arrangements, business
typically track inventory until it reaches a predetermined point of “low” holdings,
whereupon the company makes an order (also of a generally predetermined level) to
push its holdings back up to a desirable level. Since the same amount is ordered on
each occasion, continuous review systems are sometimes also referred to as event-
triggered systems, fixed order size systems (FOSS), or economic order quantity
systems (EOQ) .Periodic review systems, on the other hand, check inventory levels at
fixed intervals rather than through continuous monitoring. These periodic reviews
(weekly, biweekly, or monthly checks are common) are also known as time triggered
KOTTAM KARUNAKARA REDDY INSTITUTE OF TECHNOLOGY 21

8/6/2019 kiran project2011
http://slidepdf.com/reader/full/kiran-project2011 22/61
Inventory Management
systems, fixed order interval systems (FOIS), or economic order interval systems
(EOI).The dictionary meaning of inventory is stock of goods, or a list of goods. The
word Inventory is understood differently by various authors. In accounting language it
may mean stock of finished goods only. In a manufacturing concern, it may include
raw material, work in process, etc. to understand the exact meaning of the word,
‘inventory’ we may study it from usage side or from the ‘side of point entry’ in the
operations. Inventory includes the following things:
Raw Material:
Unfinished goods used in the manufacture of a product. For example, a steelmaker
uses iron ore and other metals in producing steel. A publishing company uses
paper and ink to create books, newspapers, and magazines. Raw materials are
carried on a company’s balance sheet as inventory in the current assets section.
WIP (Work In-Progress):
Three-letter abbreviation with several meanings, as Described below:
• Work in Progress- generally signifies a project that will not be settled in one
attempt, or even several. Sometimes as WIP List, synonymous with a To-Do
list.
• “WIP” as an asset means the portion of work that is complete but not yet
billed. WIP is a good or goods in various stages of completion throughout the plant, including all material from raw material that has been released for initial
processing up to completely processed material awaiting final inspection and
acceptance as finished good inventory.
Finished Goods:
These are the goods which are ready for the consumers. The stock of finished
goods provides a buffer between production and market. The propose of maintaininginventory is to ensure proper supply of goods to customers. In some concerns the
KOTTAM KARUNAKARA REDDY INSTITUTE OF TECHNOLOGY 22

8/6/2019 kiran project2011
http://slidepdf.com/reader/full/kiran-project2011 23/61
Inventory Management
production is undertaken on order basis, in these concerns there will not be a need for
finished goods. The need for finished goods inventory will be more when productionis undertaken in general without waiting for specific orders.
Spares:
Spares also form a part of inventory. The consumption pattern of raw materials.
The stocking policies of spares are different from industry to industry. Some industry
like transport will require more spares than the other concerns. The costly spare parts
like engines, maintenance spares etc. are not discarded after use, rather they are kept
in ready position for furtherer use. All decisions about spares are based on the
financial cost of inventory on such spares and the costs that may arise due to their
non-availability.
Consumables:
These are the materials, which are needed to smooth the process of production.
These materials do not enter directly into production but they act as catalysts.
Consumables may be classified according to their consumption and critically.
Generally, consumables stores do not create any supply problem and form a small part
of production cost. There can be instances where these materials may account for
much value than the materials. The fuel oil may from a substantial part of the cost.
Cycle Inventory:
The portion of total inventory that varies directly with lot size is
called inventory. Determining how frequently to order, and in what quantity, is called
lot sizing. Two principles apply.
1. The lot size, Q, varies directly with the elapsed time (or cycle)
2. Between orders. If a lot is ordered every five weeks, the average lot size must
equal five week’s demand.
3. The longer the time between orders for a given item, the greater the cycle
inventory must be at the beginning of the interval, the cycle inventory is at its
KOTTAM KARUNAKARA REDDY INSTITUTE OF TECHNOLOGY 23

8/6/2019 kiran project2011
http://slidepdf.com/reader/full/kiran-project2011 24/61
Inventory Management
maximum or Q. At the end of the interval, just before a new lot arrives, cycle
inventory drops to its minimum, or 0. The average of these two extremes:
Average cycle inventory = Q + o = Q
This formula is exact only when the demand rate is constant and uniform.
However, it does provide reasonably good estimate even when demand rates are not
constant. Factors other than the demand rate (e.g., scrap losses) also may cause
estimating errors when this simple formula is used.
Safety Stock Inventory:
To avoid customer service problems and the hidden cost of unavailable
components, companies hold safety stock. Safety stock inventory protects against
uncertainties in demand, lead time, and supply. Safety stocks are desirable when
suppliers fail to deliver the desired quantity on the specified date with acceptable
quality or when manufactured items have significant amounts of scrap or rework.
Safety stock inventory ensures that operations are not disrupted when such problems
occur, allowing subsequent operations to continue.
To create safety stock, a firm places an order foe delivery earlier than when
the item is typically needed. The replenishment order therefore arrives ahead of time,
giving a cushion against uncertainty.
Purpose and Benefit of Holding Inventory:
Although holding inventories involves blocking of a firm’s fund and the cost of
storage and handling every business enterprises has to maintain a certain level of
inventories to facilitate uninterrupted production and smooth running of business. In
the absence of inventories a firm will have to make purchases as soon as it receives
orders. It will mean loss of time and delay in execution of orders which sometimes
may cause loss of customers and business. Firms also need to maintain inventories to
reduce ordering cost and avail quantity discount, etc. generally speaking there are
three main purpose or motives of holding inventories:
KOTTAM KARUNAKARA REDDY INSTITUTE OF TECHNOLOGY 24

8/6/2019 kiran project2011
http://slidepdf.com/reader/full/kiran-project2011 25/61
Inventory Management
I. The transaction motive which facilitates continuous production and timely
execution of sales orders.II. The precautionary Motive which necessitates the holding of inventories for
meeting the unpredictable changes in demand and supplies of materials.
III. Speculative motive which induces to keep inventories for taking advantages of
price fluctuations, saving in re-ordering costs and quantity discounts, etc.
RISKS AND COSTS OF HOLDING INVENTORIES:
The holding of inventories involves blocking of a firm’s funds and incurrence of
capital and other costs. It also exposes the firm to certain risks. The various costs and
risks involved in holding inventories are as below:
1. Capital costs: Maintaining of inventories results in blocking of the firm’s
financial resources. The firm has, therefore, to arrange for additional funds to
meet the cost of inventories. The funds may be arranged from own resources
or from outsiders. But in both the arranged from own resources or from
outsiders. But in both the cases, the firm incurs a cost. In the former case,
there is an opportunity cost of investment while in the later case, the firm has
to pay inters tot the outsider.
2. Storage and Handling costs: Holding of inventories also involves costs on
storage as well as handling of materials. The storage costs include the rental of
the go down, insurance charges, etc.
3. Risk of price decline: There is always a risk of reduction in the prices of
inventories by the suppliers in holding inventories. This may be due to
increased market supplies, competition or general depression in the market.
4. Risk of Obsolescence: The inventories may become obsolete due to improved
technology, changes in requirements, change in customer’s tastes, etc.
5. Risk Deterioration in Quality: The quality of the materials may also
deteriorate while the inventories are kept in stores.
Inventory and the Growing Company:
KOTTAM KARUNAKARA REDDY INSTITUTE OF TECHNOLOGY 25

8/6/2019 kiran project2011
http://slidepdf.com/reader/full/kiran-project2011 26/61
Inventory Management
Most successful small companies find that as their economic fortunes rise, so
too do the complexity of inventory logistics. The increase in inventory management is primarily due to two factors: 1) greater volume and variety of product, and 2)
increased allocation of company resources (such as physical space and financial
capital) to accommodate that growth in inventory “The transaction from seat-of –the
–pants ordering policies and little or no record keeping to a formal inventory system
that includes specific ordering policies and a formalized inventory record file is a
difficult one for most companies to make, ” stated Weiss and Gershon.” It is but one
of the many sources of growing pains that emerging company’s experience, especially
those in the fast-growing industries, such as fast food or high technology. This
transition requires the creation of new job functions to identify the costs (holding,
shortage) associated with inventory and to implement the inventory analysis.
The inventory record file also must be maintained by someone, and, on a
periodic basis, it must be audited by someone. In addition, the transition requires more
coordination between different company functions.” This transition, they note, often
leads into computerization of inventory management. This can be a daunting prospect,
particularly for companies lacking employees with appropriate data management
backgrounds.
Just In Time Inventory Control System:
“Just-in-time production is a simple idea that may be difficult to implement,
“wrote Gershon and Weiss.” The basic concept is that finished goods should be
produced just in time for delivery, and raw materials should be delivered just in time
for production. When this occurs, materials or goods never sit idle, which means that
a minimum amount of money is tied up in raw materials, semi finished goods …….
The just-in-time approach calls for slashing production and purchase lot sizes and also
buffer stocks-bit incrementally, a little at a time, month after month, year after year.
The result is sustained productivity and quality improvement with greater flexibility
and delivery responsiveness.”
KOTTAM KARUNAKARA REDDY INSTITUTE OF TECHNOLOGY 26

8/6/2019 kiran project2011
http://slidepdf.com/reader/full/kiran-project2011 27/61
Inventory Management
Setting an Inventory Strategy: No single inventory strategy is equally effective for all businesses. Indeed,
there are many different factors that can impact the Usefulness of a given inventory
strategy, including positioning of inventory, rationalization, segmentation, and
continuous improvement efforts. Moreover, small business in particular often faces
financial and logistical limitations when erecting their inventory systems. And of
course, different industries have different inventory needs. Consumer goods
producers, for instance, need to have well-balance inventories at the point of sale,
while producers of industrial and commercial products typically do not have clients
that require the same degree of delivery lead time.
When a company is faced with a need to establish or reevaluate its inventory
control systems, business experts often counsel their corporate clients to engage in a
practice commonly known as “inventory segmenting” or “inventory partitioning.” The
practice is in essence a breakdown and review of total inventory by classifications,
inventory stages (raw materials, intermediate inventories, and finished products) sales
and operations groupings, and excess inventories. Proponents of this method of study
say that such segmentation break the company’s total inventory into much more
manageable parts for analysis.
Key Considerations:
According to business experts, perhaps no factor is more important in ensuring
successful inventory management than regular analysis of policies, practices, and
results. Companies that hope to establish or maintain an effective inventory system
should make sure that they do the following on a regular basis:
Regularly review product offerings, including the breadth of the product line
and the impact that peripheral products have on invent.
Ensure that inventory strategies are in place for each product and reviewed on
a regular basis.
KOTTAM KARUNAKARA REDDY INSTITUTE OF TECHNOLOGY 27

8/6/2019 kiran project2011
http://slidepdf.com/reader/full/kiran-project2011 28/61
Inventory Management
Review transportation alternatives and their impact on inventory / warehouse
capacities. Undertake periodic reviews to ensure that inventory is held at the levels that
best meets customer needs; this applies to all levels of business, including raw
materials, intermediate assembly, and finished products.
Regularly canvas key employees for information that can inform future
inventory control plans.
Determine what level of service (lead time, etc.) is necessary to meet the
demands of customers. Establish and regularly review a system for effectively identifying and
managing excess or obsolete inventory, and determining why these goods
reached such status.
Devise a workable system wherein “safety” inventory stocks can be reached
and distributed on a timely basis when the company sees an unexpected rise in
product demand.
Calculate the impact of seasonal inventory fluctuations and incorporate theminto inventory fluctuations and incorporate them into inventory management
strategies.
Review the company’s forecasting mechanisms and the volatility of the
marketplace, both of which can (and do) have a big impact on inventory
decisions.
Institute “continuous improvement” philosophy in inventory in inventory
management. Make inventory management decisions that reflect a recognition that inventory
is deeply interrelated with many other areas of business operation.
To summarize, inventory management system should be regularly reviewed from
top to bottom as an essential part of the annual strategic and business and business
planning processes. Indeed, even cursory examinations of inventory statistics can
sometimes provide business owners with valuable insights into the company’s
foundations. business consultants and managers alike note that if an individual
KOTTAM KARUNAKARA REDDY INSTITUTE OF TECHNOLOGY 28

8/6/2019 kiran project2011
http://slidepdf.com/reader/full/kiran-project2011 29/61
Inventory Management
business has an inventory turnover ratio that is low in relation to the average for the
industry in which it operates, or if it is low in comparison with the average ratio for the business, it is pretty likely that the business is carrying a surplus of obsolete or
otherwise unsalable stock inventory. Conversely, they note that if a business is
experiencing unusually high inventory turnover when compared with industry or
business averages, then the company may be losing out on sales because of a lack of
adequate stock on hand.” it will be helpful to determine the turnover rate of each stock
item so that you can evaluate how will each is moving, “noted the entrepreneur
magazine small business advisor .” You may even want to base your inventory
turnover on more frequent periods than a year. For perishable items, calculating
turnover periods based on daily weekly or monthly periods may be necessary to
ensure the freshness of the product. This is especially important for food-service
operations.”
INVENTORY ACCOUNTING:
The way in which a company accounts for its inventory can have a dramatic affect
on its financial statements. Inventory is a current asset on the balance sheet.
Therefore, the valuation of inventory directly affects the inventory, total current asset,
and total asset balances. Companies intend to sell their inventory, and when they do, it
increases the cost of goods sold, which is often a significant expense on the income
statement. Therefore, how a company values its inventory will determine the cost of
goods sold amount, which in turn affects gross profit (margin), net income before
taxes, taxes owned, and ultimately net income. It is clear, then, that a company’s
inventory valuation approach can cause a ripple effect throughout its financial picture.
One may think that inventory valuation is relatively simple. For a retailer,
inventory should be valued for what it cost to acquire that inventory. When an
inventory item is sold, the inventory account should be reduced (credited) and cost of
goods sold should be increased (debited) for each inventory item. This works if a
company is operating under the specific identification method. That is, a company
knows the cost of every individual item that is sold. This method works well when the
KOTTAM KARUNAKARA REDDY INSTITUTE OF TECHNOLOGY 29

8/6/2019 kiran project2011
http://slidepdf.com/reader/full/kiran-project2011 30/61
Inventory Management
amount of inventory a company has is limited and each inventory item is unique.
Examples would car dealerships, jewelers, and art galleries.
The specific identification method, however, is cumbersome in situations
where a company owns a great deal of inventory and each specific inventory item is
relatively indistinguishable from each other. As a result, other inventory valuation
methods have been developed. The best known of these are the FIFO (first-in, first
out) and LIFO (last-in, first-out) methods.
First in, first out (FIFO):
Method of accounting for inventory whereby, quite literally, the inventory is
assumed to be sold in the chronological order in which it was purchased. For example,
the following formula is used in computing the cost of goods sold.
Under the FIFO method, inventory costs flow from the oldest purchases forward,
with beginning inventory as the starting point and ending inventory representing the
most recent purchases. The FIFO method contrasts with the LIFO or last in, first out
method, which is FIFO in reverse. The significance of the difference becomes
apparent when inflation or deflation affects inventory prices. In an inflationary period,
the FIFO method produces a higher ending inventory, a lower cost of goods sold
figure, and a higher gross profit. LIFO, on the other hand, produces a lower ending
inventory, a higher cost of goods sold figure, and a lower reported profit.
In accounting for the purchase and sale of securities for tax purposes, FIFO is
assumed by the IRS unless it is advised of the use of an alternative method.
First in, first out (FIFO):
Method of inventory valuation that assumes merchandise is sold in the order
of its receipt. The first-price in is the first-price out. Hence cost of sales is based on
KOTTAM KARUNAKARA REDDY INSTITUTE OF TECHNOLOGY 30

8/6/2019 kiran project2011
http://slidepdf.com/reader/full/kiran-project2011 31/61
Inventory Management
older dollars. Ending inventory is reflected at the most recent prices. Assume the
following data regarding inventory during the year
(LIFO) last-in, first-out:
On the other hand, is an accounting approach that assumes that the most
recently acquired items are the first one sold? Therefore, the inventory that remains is
always the oldest inventory. During economic periods in which prices are rising, this
inventory accounting method yields a lower ending inventory, a higher cost of goods
sold, a lower gross profit, and a lower taxable income. The LIFO Method is preferred
by many companies because it has the effect of reducing a company’s taxes, thus
increasing cash flow. However, these attributes of LIFO are only present in an
inflationary environment.
The other major advantage of LIFO is that it can have an income smoothing
effect. Again, assuming inflation and a company that is doing well, one would expect
inventory levels to expand. Therefore, a company is purchasing inventory, but under
LIFO, the majority of the cost of these purchases will be on the income statement as
part of cost of goods sold. Thus, the most recent and most expensive purchases will
increase cost of goods sold, thus lowering net income before taxes, and hence net
income. Net income is still high, but it does not reach the levels that it would if the
company used the FIFO method.
Given the importance differences that exist between the various inventory
accounting methodologies, it is imperative that the inventory footnote be read
carefully in financial statements, for this part of the document will inform the reader
of the method of inventory valuation chosen by a company. Assuming inflation, FIFO
will result in higher net income during growth periods and a higher and more realistic
inventory balance. In periods of growth, LIFO will result in lower net income and
lower income tax payments, thus enhancing a company’s cash flow. During periods of
KOTTAM KARUNAKARA REDDY INSTITUTE OF TECHNOLOGY 31

8/6/2019 kiran project2011
http://slidepdf.com/reader/full/kiran-project2011 32/61
Inventory Management
contraction, LIFO will result in higher income levels, but will also undervalue
inventory over time.
Small business owners weighing a switch to a LIFO inventory valuation
method should note that while making the change is a relatively simple process (the
company files IRS Form 970 with its tax return), switching away from LIFO is not so
easy. Once a company adopts the LIFO method, it can not switch to FIFO without
securing IRS approval.
Donating Excess Inventory:
In recent years, many small (and large) business have gained valuable tax
deductions by donating obsolete or excess inventory to charitable organizations,
churches, and disaster relief efforts. The type of deduction that can be claimed
depends on the business structure of the donating company. “If you’re organized as an
S corporation (S Corporation with a limited number of stockholders (35 or fewer) that
elects not to be taxed as a regular (C) corporation and meets certain other
requirements Shareholders include in their personal tax returns their pro Rata share of
capital gains, ordinary income, tax preference items, and so on. This form avoids
corporate Double Taxation while providing limited liability protection to shareholders
of a corporation.)
OBJECTIVES OF INVENTORY MANAGEMENT:
The main objective so inventory management are operation and financial. The
operational objective mean that the material and spares should be available in
sufficient quantity so that work is not disrupted for want of inventory. The financial
objective means that investments in inventories should not remain idle and minimum
working capital should be locked in it.
The objectives of inventory management are as follows:
KOTTAM KARUNAKARA REDDY INSTITUTE OF TECHNOLOGY 32

8/6/2019 kiran project2011
http://slidepdf.com/reader/full/kiran-project2011 33/61
Inventory Management
To ensure continuous supply of materials, spares and finished goods so that production should not suffer at any time and the customers demand should
also be met.
To avoid both over-stocking and under-stocking of inventory.
To maintain investment in inventories at the optimum level as required by the
operational and sales activities.
To keep material cost under control so that they contribute in reducing cost of
production and overall cost. To eliminate duplication in ordering or replenishing stocks. This is possible
with the help of centralizing purchases.
To minimize losses through deterioration, pilferage, wastages and damages.
To design proper organization for inventory management. Clear cut
accountability should be fixed at various levels of the organization.
To ensure perpetual inventory control so that materials shown in stock ledgers
should be fixed actually lying in the stores. To ensure right quality goods at reasonable prices. Suitable quality standard
will ensure proper quality of stocks. The price analysis, the cost analysis and
value analysis will ensure payment of proper prices.
To facilitate furnishing of data for short term and long term planning and
control of inventory.
Material Control:Most of the manufacturing concerns. The cost of raw materials represents a
major part of the total cost of production. Hence proper control over material is
necessary from the time the order is place with the supplier till they are actually
consumed. An efficient system of material control will lead to significant reduction in
production cost.
Material control may be defined as the “Systematic control over the
procurement, storage and usage of materials so as to maintain an even flow of
KOTTAM KARUNAKARA REDDY INSTITUTE OF TECHNOLOGY 33

8/6/2019 kiran project2011
http://slidepdf.com/reader/full/kiran-project2011 34/61
Inventory Management
materials and avoiding at the same time excessive investment in inventories”.
Material control covers three stages namely.
Purchases of material
Storing of material
Issue of material
Objectives:
The objectives of material controls as follows:
1) To ensure regular and uninterrupted supply of materials i.e., to make materials
available as and when they are needed.
2) To keep investment in stock at a reasonable levels, so that there is no loss of
interest on capital.3) To purchase the materials at a reasonable price without sacrificing the quality
of such materials.
4) To avoid abnormal wastage by exercising direct control.
5) To avoid the risk of spoilage and obsolescence of the materials by fixing the
maximum stock level.
Issue of Material Management:As per major activity groups involved in material management in any
manufacturing organization.
• Issue related to materials planning.
• Issues related to purchase
• Issues related to stores or inventory.
• Issue related to material handling & display.
Issue Related to Material Planning:
KOTTAM KARUNAKARA REDDY INSTITUTE OF TECHNOLOGY 34
8/6/2019 kiran project2011
http://slidepdf.com/reader/full/kiran-project2011 35/61
Inventory Management
•
Material Identification
• Standardization
• Make or Buy
• Coding & Classification
• Quality specification
• By providing samples or prototype.
• By providing manufacturing operation specification.• By brand or trade name.
• By specifying well accepted market grades.
• By specifying testing producer’s relevant standards.
• By specifying/ providing engineering drawing/blue prints.
Determination of Stock Levels:
Carrying of too much and too little of inventories is determinate to the firm. If
the inventory level is too little, the firm will face frequent stock-outs involving heavy
ordering cost and if the inventory level is too high it will be unnecessary tie-up of
capital. Therefore, an optimum level of inventory where cost is the minimum and at
the same time their Id. No. stock-out, which may result is loss of sale or stoppage of
production. Various stock levels are discussed as such.
Minimum Level:
This presents the quantity, which must be maintained in hands at all times. If
stock is less than the minimum level then the work will stop due to shortages of
materials.
Lead time:
KOTTAM KARUNAKARA REDDY INSTITUTE OF TECHNOLOGY 35

8/6/2019 kiran project2011
http://slidepdf.com/reader/full/kiran-project2011 36/61
Inventory Management
A purchasing firm requires some time to process the order and time is also
required by the supplying firm to execute the order. The time taken in processing theorder and then executing it is known as lead-time. It is essential some inventory
during this period.
Rate of consumption:
It is the average consumption of materials in the factory. The rate of
consumption will be decided on the basis of past experience and production.
Nature of material:
The nature of materials also affects the minimum level. If material is required
only against special orders of the consumers then minimum stock will not be required
for such materials minimum stock level can be calculated using the formula:
Minimum stock level = Re-order level – (normal consumption* normal re-
order period).
Re-order level:
When the quantity of materials reaches at a certain figures then fresh order is
sent to get materials again. The order is sent before the materials reach minimum
stock level. Re-ordering level or ordering level is fixed between minimum stock level
and maximum stock level. The rate of consumption, number of days required on any
day is taken into account while fixing reordering level. Re-ordering level is fixed with
the following formula;
Re- order level = maximum consumption * maximum re-order period
Maximum level:
It is the quantity of materials beyond which a firm should not exceed its stock.
If the quantity exceeds maximum level limit then it will be over-stocking. A firm
should avoid over-stocking because it will result in high materials costs. Over
stocking will more blocking of more working capital, more space for storing the
KOTTAM KARUNAKARA REDDY INSTITUTE OF TECHNOLOGY 36

8/6/2019 kiran project2011
http://slidepdf.com/reader/full/kiran-project2011 37/61
Inventory Management
materials, more wastage of materials and more chances of losses from obsolescence.
Maximum stock level will depend upon following factors:
The maximum requirement of materials at any point of time.
The availability of space for storing the materials.
The rate of consumption of materials during lead-time.
The cost of maintaining the stores.
The possibility of fluctuation in prices.
Availability of materials. If the materials are available only during seasonsthen they have to store for the rest of the period.
The possibility of change in fashion and production process will also affect the
maximum stock level.
The following formula may be used for calculating maximum stock level:
Maximum stock level = re-order level + re-ordering quantity – (minimum
consumption * minimum re-ordering period).Danger level:
It is the level beyond which material should not fall in any case. If level arises
then immediately steps should be taken to replenish the stock even if more cost is
incurred in arranging the materials. If materials. If material is not arranged
immediately then there is a possibility of stoppage of work. Danger level is
determined with the formula:
Danger level = consumption * maximum re- order period for emergencypurchases.
Average stock level:
The average stock level is calculated as such:
Average stock = minimum stock level + ½ of re-order quantity.
Determination of safety stock
KOTTAM KARUNAKARA REDDY INSTITUTE OF TECHNOLOGY 37

8/6/2019 kiran project2011
http://slidepdf.com/reader/full/kiran-project2011 38/61
Inventory Management
The safety stock is a buffer to meet unanticipated increase in usage. The usage
of inventory cannot be perfectly forecasted. Ft fluctuates over a period of time. Thedemand for materials may fluctuate and delivery of inventory may also be delayed
and in such a situation the firm can face a problem of stock-out. The stock-out can
prove costly by affecting the smooth working of the concern. In order to protect
against out of usage fluctuations, firms usually some margin of safety stocks. The
basic problem is to determine the level of safety stocks. Two costs are involved in
determination of this stock. I.e. opportunity cost of stock outs and the carrying costs.
The stock-outs of raw material cause production as the firm cannot provide stock-outs
will occur resulting into the large opportunity costs. On the other hand, the larger
quantity of safety stocks involves higher carrying costs.
Ordering system of inventory:
The basic problem of inventory is ton decide the re-order point. The point
indicates when an order should be placed. The re-order point is determined with the
help of these things
A.) Average consumption rate.
B.) Duration of lead time.
Economic order quantity, when the inventory is depicted to lead time
consumption, the order should be placed.
There are three prevalent system of ordering and a concern may use any one of these;
Fixed order quantity system generally known as economic order quantity
(EOQ) systems.
Fixed period order system of periodic re-ordering system or periodic review
system;
Single order and schedule part delivery system.
Economic order quantity (EOQ):
The quantity of material to be ordered at one time is known as economic
ordering quantity. This quantity is fixed in such a manner as to minimize the cost of
KOTTAM KARUNAKARA REDDY INSTITUTE OF TECHNOLOGY 38

8/6/2019 kiran project2011
http://slidepdf.com/reader/full/kiran-project2011 39/61
Inventory Management
ordering and carrying the stock. Carrying cost is the cost of holding the materials. The
quantity to be ordered should be such which minimizes the carrying and orderingcosts. The order for the material to be purchased should be large to earn more trade
discount and to take advantage of bulk transport, but at the same time it should not be
tool large to incur too heavy a payment on account of interest, storage and insurance
cost. If the price to be paid is stable, quantity to be ordered each time can be
ascertained by following formula:
Q = √2CO\I.
Where: q = quantity to be ordered.
C = consumption of the material concerned in units during a year
O = cost of placing and order including the cost of receving the goods i.e. cost of
getting an item into the firm’s inventory.
I = interest payment including variable cost of storing per unit per year i.e., holding
costs of inventory.
Economic order quantity is determined keeping in view the ordering costs and
carrying costs. With the interaction of these two costs, the economic ordering costs
During a particular period are equal to carrying costs during that period and total cost
to order and carry is lowest.
There are many variations on the basic EOQ model. I have listed most useful
once below,
KOTTAM KARUNAKARA REDDY INSTITUTE OF TECHNOLOGY 39

8/6/2019 kiran project2011
http://slidepdf.com/reader/full/kiran-project2011 40/61
Inventory Management
Quantity discount logic can programmed to work in conjunction with the EOQ
formula to determined optimum order quantity. Most systems will require thisadditional programming.
Additional logic can be programmed to determine max quantities for subject
to spoilage or to prevent obsolescence on items reaching end of their product life
cycle.
When use in manufacturing to determine lost size where production runs are
very long and finished product is being released to stock and consumed /sold through
out the production run you may need to take into account the ratio of production
consumption to more accurately represent the average inventory level.
Assumptions:
There are a number of assumptions that must be made with the EOQ. These
include:
Only one product is involved
Deterministic demand(demand is known with certainty)
Constant demand (demand is stable throughout the year)
No quantity discounts.
Constant costs (no price increase or inflating)
While these assumptions would seem to make EOQ irrelevant for use in a
realistic situation, it is relevant for items that have independent demand .this
means that the demand for the items is not derived from the demand for
something else. For example, the demand for steering wheels would be
derived from the demand for automobiles but the demand for purses is not
derived from anything else; purses have independent demand.
KOTTAM KARUNAKARA REDDY INSTITUTE OF TECHNOLOGY 40

8/6/2019 kiran project2011
http://slidepdf.com/reader/full/kiran-project2011 41/61
Inventory Management
Inventory Turnover Ratio:
Every firm has to maintain a certain level of inventory of finished goods so asto be able to meet the requirements of the business. But the level of inventory should
neither be too high nor too low. It is harmful to hold more inventories for the
following reasons.
It unnecessarily blocks capital which can otherwise be profitably used
somewhere else.
Over-stocking will require more go down space, so more rent will be paid.
There are chances of obsolescence of stocks. Consumers will prefer goodsof latest design, etc.
Slow disposal of stacks will mean slow recovery of cash also which will
adversely affect liquidity.
There are chances of deterioration in quality if the stocks are held for more
periods.
It wills there fore, be advisable to dispose off inventory as early as
possible. On the other hand, too low inventory may mean loss of business.Inventory turnover ratio also known as stock velocity is normally calculated as
sales/ average inventory or cost of goods sold/ average inventory. It would indicate
whether inventory has been efficiently used or not. The purpose is to see whether only
the required minimum funds have been locked up in inventory. Inventory turnover
ratio indicates the number of times the stock has been turned over during the period
and evaluates the efficiency with which a firm is able mange its inventory
Inventory turnover ratio is calculated to indicate whether inventories have
required minimum funds in inventory. The inventory turnover ratio also known as
stock velocity is normally calculated as sales/average inventory or cost goods sold/
average inventory cost. Inventory conversion period may also be calculated to find the
average time taken for clearing the stock.
Inventory turnover ratio = cost of goods sold/ average inventory at cost
Inventory turnover ratio = net sales / average inventory
Inventory conversion period = days in year / inventory turnover ratio
KOTTAM KARUNAKARA REDDY INSTITUTE OF TECHNOLOGY 41

8/6/2019 kiran project2011
http://slidepdf.com/reader/full/kiran-project2011 42/61
Inventory Management
Generally, the cost of goods sold may not be known from the published
financial statements. In such circumstances, the inventory turnover ratio may be
calculated by dividing net sales by average inventory at cost. If average inventory at
cost is not known then inventory at selling price may be taken as denominator and
where the opening inventory is not known the closing inventory figure may be taken
as the average inventory.
Inventory turnover ratio = net sales / average inventory at cost
Inventory Turnover ratio = Net sales/ Average inventory at selling cost
Inventory Turnover ratio = Net sales / Inventory
Inventory Conversion Period:
It may also be of interest to see average time taken for clearing the stocks.
This can be possible by calculating inventory conversion period. This period is
calculated by dividing the number of days by inventory turnover.
Inventory Reports:
From effective inventory control, the management should be kept informed
with the latest stock position of different items. This usually done by information
necessary for managerial action. On the basis of these reports management takes
corrective action wherever necessary.
Valuation of Inventory:
The value of materials has a direct bearing on the income of a concern, so it is
necessary that a method of pricing of materials should be such that it gives a realistic
value of stock the traditional method of valuing materials cost price or market price
which ever is less is no longer the only method. If management is interested to show
more profits then it can choose such methods which will more stock of vice versa. To
safe guard public interest the government of India has instituted statutory controls to
prevent frequent change of material valuation methods. A concern will have to use a
KOTTAM KARUNAKARA REDDY INSTITUTE OF TECHNOLOGY 42

8/6/2019 kiran project2011
http://slidepdf.com/reader/full/kiran-project2011 43/61
Inventory Management
particular valuation method for least three years and any changes there from must be
approved by the board.The following methods of pricing material issues or generally used:
First in First out method (FIFO method)
Last in First out method(LIFO method)
Average price method
Weighted Average price method Simple Average price method
Base stock method
Standard price method
Average Cost Method:
In average cost method of pricing all materials in stock or so mixed that a
price based on all costs are formed. Average cost may be of two types.
Simple Average Method:
In this method the prices of all lots in stock are averaged and the materials are
issued on that average price. Though this is simple method of pricing materials but
particularly this method does not give good results. The total cost of materials is not
observed in this method.
Weighted Average Method:
In this method that the total cost of all materials is divided by the total number
of items in stock. The price calculated in this way has not been for issue of materials
up to the time a fresh purchase has not been made. After a fresh purchase, the quantity
will be added to earlier balance quantity and material cost will be changed total cost.
A fresh price is calculated by dividing the changed total cost by the number of units in
stock after the purchase. A new price list calculated where even a fresh purchase is
made.
KOTTAM KARUNAKARA REDDY INSTITUTE OF TECHNOLOGY 43

8/6/2019 kiran project2011
http://slidepdf.com/reader/full/kiran-project2011 44/61
Inventory Management
Base Stock Method:In this method some quantity of materials is assumed to be necessary for
keeping the concern going. The quantity is not issued unless otherwise there is an
emergency. This material which is not issued as is kept in stock is known as base
stock.
Standard Price Method:
The issue price of the materials is pre determined or estimated in this method.
The standard price is based on market conditions, usage rare, handling facilities,
storage facilities, etc. The materials are priced at standard price irrespective of price
for various purchases.
Market Price Method:
In this method the prices charged to production are not costs incurred on the
materials but latest market prices. The market prices may either be replacement prices
or realizable prices. The replacement prices are used for the materials which are kept
in stock for use in production and realizable prices are used for the goods kept for
resale. The prices of issue for materials are always the replacement prices.
SYSTEM OVERVIEW
Before analysis is attempted, it is proposed to present material accounting
practices along with documentation at Phillips india (p) ltd. overseas.
The main objective of inventory accounting and valuation of inventories are:
Accurate and regular recording of all transactions in the books.
Proper valuation of material receipts, issues, return and balances.
System Overview:
KOTTAM KARUNAKARA REDDY INSTITUTE OF TECHNOLOGY 44

8/6/2019 kiran project2011
http://slidepdf.com/reader/full/kiran-project2011 45/61
Inventory Management
The following system is being followed in Phillips india (p) ltd. overseas, and the
main features of the system are as follows:1. Receipt vouchers are prepared on receipt of materials.
2. Issues voucher are prepared for all issues of out of stores.
3. All receipts, issues and returns are recorded in priced stores ledger (PSL).
4. Stock transfer voucher (STV) is used for recording transferring raw materials
from one division/ group to another. Transfers are made at weighted average
prices.
5. Finished goods delivery notes (FGDN) are used for transferring finished
production in shop floor to finished stores.
6. Physical verification is carried out at regular interval and discrepancies and
reconciles and recorded.
7. Finished goods, work in progress valuation is as per the accounting policy of
company.
Materials Documentation and Cost Controls:
The materials accounting and cost accounting system have been designed the
frame work of accounts codes and accounting policies which would facilitate
identifying direct elements of cost, such as direct material, direct labour and directly
allocable expenses (such as expenses of sub contracting) which are booked manually
to the direct material.
The following documentation and system is being followed in Phillips india (p) ltd.
overseas:
Receipt documents:
Certified Stores Receipt Voucher (CSRV) : This is issued by stores personnel
to bills section to F&A wing in order to classify the material into raw material stores
and spares, consumable tools, packing materials, sub contractors services, and other
operational expenses. Based on the purchase order, the bill section does the
provisional valuation by using fixed percentage for freight, insurance, and other
KOTTAM KARUNAKARA REDDY INSTITUTE OF TECHNOLOGY 45

8/6/2019 kiran project2011
http://slidepdf.com/reader/full/kiran-project2011 46/61
Inventory Management
incidental and regard to customs duty the percentages as per tariff is adopted and
purposed the following entry:
Stock A/c Dr
To Sundry Creditors A/c
Material code, quantity etc which is fed to EDP which calculates the value based on
monthly weight average method.
Based on MIR data the WIP is brought out by collating material analysis. The direct
material is booked job wise in WIP ledger and the same is reconciled with financial
records. Thus, the direct materials job wise may be traced from WIP ledger.
In the similar fashion, some other receipt document and issue document are operated
like;
1. Cash purchases receipt voucher for cash purchases.
2. Finished goods issue note for the finished products
3. Stock transfer voucher for any stock transfer transactions.
4. Material return note for any materials being returned.
Based on the above documentations EDP generates the following prints outs for
material viz.
Priced stores ledger is brought out on monthly basis consisting of that months
receipts, issues, balance stock available with value and with summary and cumulative
receipts, issues and consumption values for materials like raw materials, stores and
spares, consumable tools and packing materials.
Inventory is brought on monthly basis comprising of materials codes in
seriatim along with material description unit code. Quantity available as at the end of
the month rate of the material and total value and also indicating cumulative receipts
and cumulative consumption.
KOTTAM KARUNAKARA REDDY INSTITUTE OF TECHNOLOGY 46

8/6/2019 kiran project2011
http://slidepdf.com/reader/full/kiran-project2011 47/61
Inventory Management
Job wise material analysis is brought out on monthly basis for those jobs, for
which materials have been consumed along with value and description of the materialin order to have monthly record of material used for each job.
Inventory Control and its Impact on Cost:
Value wise inventory and consumption analysis are brought out on quarterly
basis indicating RM; SS, CT, PM are valued at cost. A class items which are 70%, B
class items which are valuing 20%, C class items are verified by the stores and to the
extent certificate are issued at the year end regarding the correctness. Physical balance
is verified with kardex and the difference is intimated to stores. FAW(Farm workers)
of the group verifies and gives the rectification entries i.e., shortage items value are
charges off to physical inventory variation and the excess quantities are adjusted in
the inventory ledger after obtaining the component authority’s approval.
The system enables to control the inventories and at the same time costs on
some are controlled.
ABC analysis:
The material is divided into a number of categories for adopting a selective
approach for material control. It is generally seen that in manufacturing concern, a
small percentage of items contribute a large percentage of value of consumption and a
large percentage of items of materials contribute a small percentage of value. In
between these two limits there are some items which have almost equal percentage of
value of material. Under ABC analysis, all the materials are divided in to three
categories viz. A, B&C. past experience has shown that almost 10% of items
contribute to 70% of value of consumption and this category is called category A.
about 20% of the items contribute about 20% of value of consumption and this is
known as category B. category C covers about 70% of items of material which
contribute only 10% of value of consumption. There may be some variation in
different organizations and an adjustment can be made in these percentages.
MAKING OF ABC ANALYSIS:
KOTTAM KARUNAKARA REDDY INSTITUTE OF TECHNOLOGY 47

8/6/2019 kiran project2011
http://slidepdf.com/reader/full/kiran-project2011 48/61
Inventory Management
The entire procedure for making ABC analysis can be summarized in the following
steps:
Determine the number of units sold or used in the past 12-months period.
Determine the unit-cot standard for each item.
Compute the annual consumption value (in rupees) of each consumed item by
multiplying annual consumption (of units) with the unit price.
Arrange these items in descending order of the usage value compute above.
ABC Classification of Items:
Graphical presentation:
KOTTAM KARUNAKARA REDDY INSTITUTE OF TECHNOLOGY 48

8/6/2019 kiran project2011
http://slidepdf.com/reader/full/kiran-project2011 49/61
Inventory Management
INTERPRETATION:
The value of percentage for Class-A products is very high
when compare to Class-B and Class-C products.
Inventory, Materials, Sales and Production at a Glance.
KOTTAM KARUNAKARA REDDY INSTITUTE OF TECHNOLOGY 49
CLASS NO.OF.ITEMS
PERCENTAGE
OF ITEMS
CONSUMPTION
VALUE
VALUE
PERCENTAGE
A 4 27 2,014,576.67 91%
B 4 27 1,55,753.16 6%
C 4 27 17,636.22 3%
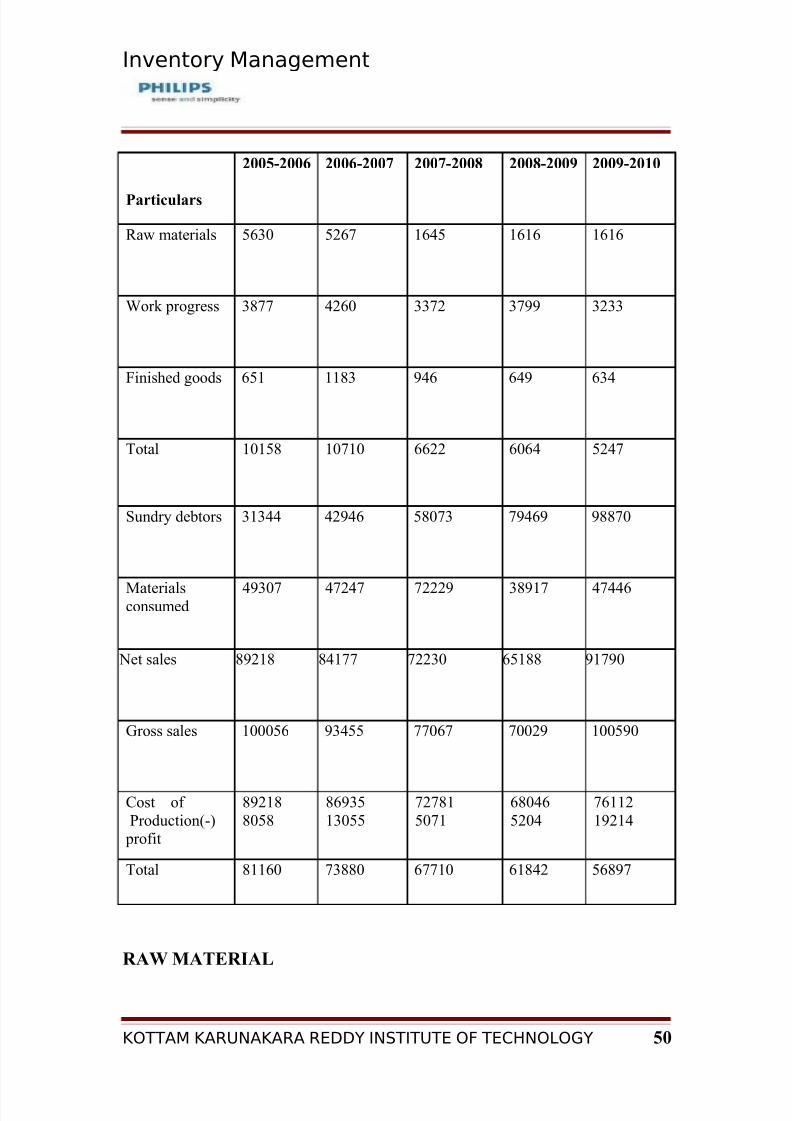
8/6/2019 kiran project2011
http://slidepdf.com/reader/full/kiran-project2011 50/61
Inventory Management
Particulars
2005-2006 2006-2007 2007-2008 2008-2009 2009-2010
Raw materials 5630 5267 1645 1616 1616
Work progress 3877 4260 3372 3799 3233
Finished goods 651 1183 946 649 634
Total 10158 10710 6622 6064 5247
Sundry debtors 31344 42946 58073 79469 98870
Materialsconsumed 49307 47247 72229 38917 47446
Net sales 89218 84177 72230 65188 91790
Gross sales 100056 93455 77067 70029 100590
Cost of Production(-)
profit
892188058
8693513055
727815071
680465204
7611219214
Total 81160 73880 67710 61842 56897
RAW MATERIAL
KOTTAM KARUNAKARA REDDY INSTITUTE OF TECHNOLOGY 50

8/6/2019 kiran project2011
http://slidepdf.com/reader/full/kiran-project2011 51/61
Inventory Management
INTERPRETATION
The corporation held a maximum stock of Raw material in the year 2005-2006
and the stock of raw material fluctuated from 2005-2006 to 2009-2010.
WORK IN PROGRESS:
KOTTAM KARUNAKARA REDDY INSTITUTE OF TECHNOLOGY 51
Particulars 2005-2006 2006-2007 2007-2008 2008-2009 2009-2010
Raw material 5630 5267 2304 1616 1878
MaterialConsumed(per Month)
49307/12 47247/12 41979/12 38917/12 47447/12
MonthlyConsumption(2)
4108 3937 3939 3243 3954
No. of monthsRaw materialStock availablew.r.t. monthlyconsumption(3)=R.M/monthlyConsumption(1/2)
1.37 1.34 0.66 0.50 0.47

8/6/2019 kiran project2011
http://slidepdf.com/reader/full/kiran-project2011 52/61
Inventory Management
Particulars 2005-2006 2006-2007 2007-2008 2008-2009 2009-2010
Work in progress
3877 4260 3372 3799 3233
Cost of production (per
month)
81160/12 73880/12 67710/12 62842/12 56897/12
Monthlyconsumption(2)
6763 6157 5643 5237 4741
No .of monthswork in progress held inInventory=W.I.P/MMonthlyConsumption
0.57 0.69 0.60 0.73 0.68
Graph presentation for work in progress:
work in progress
0.57
0.69
0.6
0.73 0.68
0
0.1
0.2
0.3
0.4
0.5
0.6
0.7
0.8
2005-06 2006-07 2007-08 2008-09 2009-10
W o r k i n P r o g r e s s
work i
INTERPRETATION:
The corporation held a peak Work in progress during the year 2008-2009 and
the year 2009-10, there is slight fluctuations in work in progress.
KOTTAM KARUNAKARA REDDY INSTITUTE OF TECHNOLOGY 52

8/6/2019 kiran project2011
http://slidepdf.com/reader/full/kiran-project2011 53/61
Inventory Management
FINISHED GOODS:
Particulars 2005-2006 2006-2007 2007-2008 2008-2009 2009- 2010
Finished goods 651 1183 946 945 649
Net sales 89218/12 84177/12 72231/12 65787/12 91791/12
Monthly
Consumption
7435 7015 6019 5482 7649
No. of Months F.GHeld ininventory
0.09 0.17 0.16 0.17 0.08
INTERPRETATION:
The corporation held peak finished goods stock during the year 2005-2006 to
2008-2009 and the finished goods stock is decreased from 2009-10.
KOTTAM KARUNAKARA REDDY INSTITUTE OF TECHNOLOGY 53

8/6/2019 kiran project2011
http://slidepdf.com/reader/full/kiran-project2011 54/61
Inventory Management
SUNDRY DEBTORS:
Particulars 2005-2006 2006-2007 2007-2008 2008-2009 2009-2010
Sundry debtors 31344 42946 36774 74468 98871
Gross sales 10056/12 93455/12 77067/12 70029/12 10059/12
Monthly
consumption
8338 7788 6422 5836 8383
No of monthOf sales
3.76 5.51 5.73 12.76 11.79
INTERPRETATION:
The sundry debtors of the corporation are at peak level during
year 2008-2009. And this number is fluctuated from 2005-2006 to 2009-2010.
KOTTAM KARUNAKARA REDDY INSTITUTE OF TECHNOLOGY 54

8/6/2019 kiran project2011
http://slidepdf.com/reader/full/kiran-project2011 55/61
Inventory Management
CALCULATION OF INVENTORY TURNOVER RATIO:Inventory turnover ratio=Cost of goods sold/average inventory
Cost of goods sold=sales/gross profit.
Average inventory = (Opening stock+ closing stock)/2.
KOTTAM KARUNAKARA REDDY INSTITUTE OF TECHNOLOGY 55
Particulars 2005-2006 2006-2007 2007-2008 2008-2009 2009-2010
Sales(A) 100055.98 93455.40 77066.76 70029.03 100590
Gross profit(B) 82683.22 78965.66 70139.75 6222.80 20702
Cost of Goods
sold(C)(A-B=C)
82683.22 78965.66 70139.75 63806.23 79888
Inventory opening
stock(D)
14531.93 10158.94 10710.86 6622.64 7681
Closing stock(E) 10158.94 10710.86 6622.64 7681.96 6855
Average
inventory(F)
(D+E/2=F)
12345.44 10434.9 8666.75 7152.30 7268
Inventory turnover
ratio(C/F)
6.7 7.57 8.09 8.92 10.99

8/6/2019 kiran project2011
http://slidepdf.com/reader/full/kiran-project2011 56/61
Inventory Management
INVENTORY TURNOVER RATIO:
INVENTORY TURNOVER RATIO
10.
8.92
8.097.57
6.7
0
2
4
6
8
10
12
2005-2006 2006-2007 2007-2008 2008-2009 2009
YEARS
I N V E N T O R Y T U R N O
V E R R A T I O
INTERPRETATION:
From the above calculation it is found that the inventory turnover has
gradually increased from 6.7 to 10.99 from the year 2005-06 to 2009-2010 which is
indicative of good inventory management.
KOTTAM KARUNAKARA REDDY INSTITUTE OF TECHNOLOGY 56

8/6/2019 kiran project2011
http://slidepdf.com/reader/full/kiran-project2011 57/61
Inventory Management
Inventory conversion period
Years Days in year/
Inventory
turnover ratio
No of days
2005-2006 365/6.70 24.45
2006-2007 365/7.57 27.63
2007-2008 365/8.09 29.52
2008-2009 365/8.92 32.55
2009-2010 365/10.99 33.21
Inventory Conversion Period
33.32.55
29.52
27.6324.45
0
5
10
15
20
25
30
35
2005-2006 2006-2007 2007-2008 2008-2009 2009
Years
I n v e n t o r y C o n v e r s i o n P e r i o d
INTERPRETATION:
From the above calculation the inventory conversion period hasgradually increased from 2005-2006 to 2009-2010.
KOTTAM KARUNAKARA REDDY INSTITUTE OF TECHNOLOGY 57

8/6/2019 kiran project2011
http://slidepdf.com/reader/full/kiran-project2011 58/61
Inventory Management
FINDINGS
• The corporation has maintained maximum stock of raw material during the
year 2005-2006.
• The corporation held peak work in progress during the year 2008-2009 and
there are fluctuations in work in progress between 2006-07 to 2007-2008.
• The corporation has maintained maximum finished goods stock during the
year 2006-2007 and it is decreased from 2007-2008 to 2009-2010.
• The sundry debtors of the corporation are at peak level during year 2008-2009.
And this number is fluctuated from 2005-2006 to 2009-2010.
• The inventory turnover ratio of the corporation has gradually increased fromthe year 2005-2006 to 2009-2010.
• The inventory conversion period of the corporation has also gradually
increased from 2005-2006 to 2009-2010.
KOTTAM KARUNAKARA REDDY INSTITUTE OF TECHNOLOGY 58
8/6/2019 kiran project2011
http://slidepdf.com/reader/full/kiran-project2011 59/61
Inventory Management
SUGGESTIONS
• A-category of products must be taken care of properly as it forms a major
part and appropriate method of valuing the product must be used.
• The credit policy of the corporation is one month credit. However the
study revealed that the organization has never maintained one month credit
during the study of the project so my request is to check on credit period
• Keep check on creditors as it effects the working capital, which may even
leads to losses
• Organization has to pay attention on the amount of % of raw material on
cost of production, which is high when compared to earlier and slightly
low when compared to ideal percentage.
• Suggestion must be taken form all department of the organization for
proper different department in the organization
• Under-stocking will results in stoppage of work the investment in
inventory management should be kept in reasonable limits.
KOTTAM KARUNAKARA REDDY INSTITUTE OF TECHNOLOGY 59

8/6/2019 kiran project2011
http://slidepdf.com/reader/full/kiran-project2011 60/61
Inventory Management
CONCLUSIONS
• As PHILLIPS INDIA (P) LTD. is a multi product organization
catering to different customers on divergent technologies the
inventory procurement for various ranges of product is quite high.
• Inventory procurement is also based on and does not conform to
economic batch quantities leading to surplus inventories and non
moving inventories.
• A preventive measure there should be a regular monitoring
mechanism at the stage of procurement, whether there is a controlexercised in purchasing materials in line with estimates, to have a
better control on the inventory levels.
• A regular reporting system on inventory should be placed to highlight
on carrying cost and opportunity cost.
•
Organization needs to upgrade of the technology, which in turnincreases effective utilization of material.
• There is a regular physical verification for A and B class items by
internal audit department to highlight on non-moving inventories.
KOTTAM KARUNAKARA REDDY INSTITUTE OF TECHNOLOGY 60

8/6/2019 kiran project2011
http://slidepdf.com/reader/full/kiran-project2011 61/61
Inventory Management
BIBILIOGRAPHY
S.N.CHARY (2001), PRODUCTION AND OPERATION MANAGEMENT
CHUNAWALLA PATEL (2004), PRODUCTION AND OPERATION MANAGEMENT
I.M.PANDEY (1999), FINANCIAL MANAGEMENT
Website Referenced
http://www.india.Phillips.com
http://www.google.com