king s research portal file3 abstract the antileukemic drug asparaginase, a key component in the...
TRANSCRIPT
King’s Research Portal
DOI:10.2967/jnumed.116.177741
Document VersionPeer reviewed version
Link to publication record in King's Research Portal
Citation for published version (APA):van der Meer, L., Terry, S. Y. A., van Ingen Schenau, D., Andree, K., Franssen, G., Roeleveld, D., ... vanLeeuwen, F. (2016). In vivo imaging of antileukemic drug asparaginase reveals a rapid macrophage mediatedclearance from the bone marrow. Journal of Nuclear Medicine. https://doi.org/10.2967/jnumed.116.177741
Citing this paperPlease note that where the full-text provided on King's Research Portal is the Author Accepted Manuscript or Post-Print version this maydiffer from the final Published version. If citing, it is advised that you check and use the publisher's definitive version for pagination,volume/issue, and date of publication details. And where the final published version is provided on the Research Portal, if citing you areagain advised to check the publisher's website for any subsequent corrections.
General rightsCopyright and moral rights for the publications made accessible in the Research Portal are retained by the authors and/or other copyrightowners and it is a condition of accessing publications that users recognize and abide by the legal requirements associated with these rights.
•Users may download and print one copy of any publication from the Research Portal for the purpose of private study or research.•You may not further distribute the material or use it for any profit-making activity or commercial gain•You may freely distribute the URL identifying the publication in the Research Portal
Take down policyIf you believe that this document breaches copyright please contact [email protected] providing details, and we will remove access tothe work immediately and investigate your claim.
Download date: 29. Mar. 2019
1
In vivo imaging of antileukemic drug asparaginase reveals a rapid macrophage mediated clearance
from the bone marrow
Laurens T van der Meer1*, Samantha YA Terry2,3*, Dorette S van Ingen Schenau1, Kiki C Andree1,
Gerben M Franssen2, Debbie M Roeleveld1,4, Josbert M Metselaar5, Thomas Reinheckel6,7,8, Peter M
Hoogerbrugge9, Otto C Boerman2, Frank N van Leeuwen1
1Laboratory of Pediatric Oncology, Radboud Insititute for Molecular Life Sciences, Radboud university
medical center, Nijmegen, the Netherlands 2 Department of Radiology and Nuclear Medicine,
Radboud university medical center, Nijmegen, the Netherlands 3Department of Imaging Chemistry
and Biology, Division of Imaging Sciences and Biomedical Engineering, King’s College London, London,
United Kingdom 4Experimental Rheumatology, Radboud Insititute for Molecular Life Sciences,
Radboud university medical center, Nijmegen, the Netherlands 5Department of Experimental
Molecular Imaging, University Clinic and Helmholtz Institute for Biomedical Engineering, RWTH-
Aachen University, Aachen, Germany 6Institute of Molecular Medicine and Cell Research, Albert-
Ludwigs-University, Freiburg, Germany 7German Cancer Consortium (DKTK), Freiburg, Germany
8BIOSS Centre for Biological Signalling Studies, Albert-Ludwigs-University, Freiburg, Germany
9Princess Maxima Center for Pediatric Oncology, Utrecht, the Netherlands
* L.T.v.d.M. and S.Y.A.T. contributed equally to this study
Running title
Imaging of asparaginase biodistribution and clearance
Keywords
Leukemia, asparaginase, imaging, macrophages, cathepsin B
2
Financial Support
This work was supported in part by research funding from KiKa (grant #134) (L.T.v.d.M.)
Corresponding Author
Frank N. van Leeuwen
412 Laboratory of Pediatric Oncology,
Radboud university medical center, PO Box 9101,
6500 HB Nijmegen, The Netherlands
+31 (0) 243666203
Conflict of interest disclosure
The authors have no relevant conflict of interest to declare.
Word count: 4859
Figure count: 4 figures, 5 supplemental figures
3
Abstract
The antileukemic drug asparaginase, a key component in the treatment of acute lymphoblastic
leukemia, acts by depleting asparagine from the blood. However, little is known about its
pharmacokinetics and mechanisms of therapy resistance are poorly understood. Here, we explored
the in vivo biodistribution of radiolabeled asparaginase, using a combination of imaging and
biochemical techniques, and provide evidence for tissue specific clearance mechanisms, which could
reduce effectiveness of the drug at these specific sites.
Methods. In vivo localization of Indium-111-labeled E.coli asparaginase was carried out in C57Bl/6
mice by both microSPECT/CT and by ex vivo biodistribution studies. Mice were treated with
liposomal clodronate to investigate the effect of macrophage depletion on tracer localization and
drug clearance in vivo. Moreover, macrophage cell line models RAW264.7 and THP-1, as well as
knockout mice, were used to identify the cellular and molecular components controlling
asparaginase pharmacokinetics.
Results. In vivo imaging and biodistribution studies showed a rapid accumulation of asparaginase in
macrophage-rich tissues such as liver, spleen and in particular bone marrow. Clodronate-mediated
depletion of phagocytic cells markedly prolonged the serum half-life of asparaginase in vivo and
decreased drug uptake in these macrophage rich organs. Immunohistochemistry and in vitro binding
assays confirmed the involvement of macrophage-like cells in the uptake of asparaginase. We
identified the activity of the lysosomal protease cathepsin B in macrophages as a rate-limiting factor
in degrading asparaginase both in vitro and in vivo.
Conclusion. We show that asparaginase is rapidly cleared from the serum by liver, spleen and bone
marrow-resident phagocytic cells. As a consequence of this efficient uptake and protease mediated
degradation, particularly bone marrow resident macrophages may provide a protective niche to
leukemic cells.
4
Introduction
The therapeutic enzyme asparaginase is an essential component of the multi-drug regimen used in
the treatment of children and adults with acute lymphoblastic leukemia (ALL). Upon administration,
this drug converts serum asparagine into aspartate, thereby effectively depleting the blood from this
amino acid. Unlike most other cells in the body, lymphocytes, including leukemic blasts, are fully
dependent on uptake of asparagine from the blood and die as a result of nutrient stress 1.
The effectiveness of asparaginase treatment relies on the complete depletion of asparagine from the
leukemic cell niche. It has been suggested that during asparaginase treatment, leukemic cell survival
is supported by asparagine released by surrounding mesenchymal cells 2, 3. Although asparagine
levels are significantly higher in bone marrow aspirates when compared to matched blood samples,
these levels drop upon treatment with asparaginase 4, 5. However, analyses of aspirates may not
accurately reflect asparagine concentrations in situ.
Despite the fact that asparaginase has been a cornerstone of ALL treatment protocols since its
introduction in the 1970s, little is known about the fate of the infused asparaginase and the
mechanisms that determine the pharmacodynamics of this drug. With a molecular weight of 170 kDa
that greatly exceeds the limits for renal filtration (~60 kDa), mononuclear phagocyte system (MPS)
based (or reticulo-endothelial) clearance is the suggested mode of degradation6.
Furthermore, the intracellular/molecular mechanisms that influence asparaginase pharmacokinetics
remain poorly understood. One study showed that the lysosomal cysteine proteases legumain (or
Asparagine Endopeptidase (AEP)) and cathepsin B efficiently degrade asparaginase in vitro 7.
Consistent with these observations, we recently identified a patient carrying a germline mutation in
cathepsin B who showed strongly delayed asparaginase degradation 8. However, further validation of
these findings and their clinical implications is needed.
5
In the present study we used microSPECT/CT imaging to visualize the in vivo distribution of 111Indium-
labeled asparaginase in a mouse model and identified both cellular and molecular components that
determine asparaginase pharmacokinetics.

6
Materials and Methods
Mouse models
All animal experiments were approved by the Animal Experimental Committee of the Radboud
university medical center and performed in accordance with institutional and national guidelines.
Wildtype C57Bl/6J mice were obtained from Charles River (Leiden, the Netherlands). Cathepsin B
knockout mice were described previously 9 and have been backcrossed to C57Bl/6J for 10
generations. All mice were housed in individually ventilated filter-top cages, and a standard diet and
water were provided ad libitum. The mice were used between ages 8 and 10 weeks.
Micro-SPECT/CT imaging
Mice were injected intravenously with 3 I.U. / gram of bodyweight of 111In-DTPA-asparaginase (21-24
MBq/mouse in 200 μL, see supplemental methods for labeling procedure) and scanned under
anesthesia (isoflurane/O2) at indicated time points after injection using the U-SPECT-II/CT ((MILabs,
Utrecht, the Netherlands 10). CT scans (spatial resolution 160 µm, 65 kV, 615 µA) were acquired for
anatomical reference. SPECT scans, (3 frames of 17 min), were reconstructed using an ordered-
subset expectation maximization algorithm, with a voxel size of 0.4 mm. SPECT images were analyzed
quantitatively as described previously11.
Biodistribution experiments
Mice were injected intravenously with 3 I.U. 111In-DTPA-asparaginase / gram of bodyweight. Mice
were euthanized by CO2/O2 asphyxiation at the indicated times after injection. Blood and major
organs and tissues were dissected, weighed, and counted in a gamma counter. In addition, organs
were used for autoradiography and immunohistochemical analysis (see supplemental methods for
procedures).
Pharmacokinetics experiments

7
Mice were injected intravenously with 3 I.U. Asparaginase/gram of bodyweight (Takeda, Hoofddorp,
the Netherlands). At the indicated times after injection, mice were euthanized by CO2/O2
asphyxiation, a blood sample was drawn and tissues of interest were dissected. When indicated,
mice were pretreated with 150 μl (1 mg/ml clodronate) liposomes or control liposomes 12 via tail vein
injection 24 hours before administration of 111In-labeled asparginase. Residual asparaginase activity
in serum was determined by photometric detection of the ammonia release after reaction with
Nessler’s reagent (Sigma-Aldrich, Gorinchem, the Netherlands). In brief, 15 µl serum was diluted with
60 µl 44 mM L-asparagine (Sigma-Aldrich) dissolved in 15 mM Tris-HCl buffer, pH 7.3, supplemented
with 0.015% (w/v) BSA and incubated at 37 °C for 30-45 min. The reaction was stopped by the
addition of 50 µl trichloroacetic acid (24.5% (w/v), Sigma-Aldrich). After centrifugation 15 µl of the
supernatant was added to 120 µl Nessler’s solution diluted with deionized water (1:8). The optical
density of the solution was measured at 450 nm using the Multiskan Ascent plate reader (MTX Lab
systems, Vienna, VA).
Cathepsin B activity assay
Cathepsin B activity was measured using the fluorescent substrate Ac-RR-AFC according to
manufacturer’s instructions (BioVision, San Francisco, CA). Prism software was used to plot the data
and for statistical analysis. p< 0.05 was considered a significant difference.
Asparaginase degradation assay
THP-1 and RAW264.7 cells (see supplemental methods for culture conditions) were lysed by freeze-
thawing in degradation buffer (50 mM trisodium citrate buffer, pH 4.5, 5 mM DTT), cleared by
centrifugation. For each timepoint, 5 I.U./ml asparaginase was incubated in lysate containing 20 µg of
protein. Where indicated, 1 µM Ca-074 (Sigma-Aldrich) was added to inhibit cathepsin B activity.
After incubation, asparaginase activity was determined by photometric detection of the ammonia
release after reaction with Nessler’s reagent using the Multiskan Ascent plate reader as described

8
above. Prism software was used to plot the data and for statistical analysis. ANOVA was used to test
for significance; p< 0.05 was considered a significant difference.
shRNA mediated knockdown
For lentiviral transduction, HEK293FT cells were transfected with one lentiviral pLKO.1-puro vector
(Dharmacon / GE Healthcare), see Supplemental Table 1 for shRNA sequences) together with pVSV-G
and psPAX2 using Lipofectamine 2000 (Invitrogen). THP-1 cells were transduced in the presence of
8µg/mL polybrene and 24 hours after transduction selected with 1µg/mL puromycin (Sigma-Aldrich).
See supplemental method section for details on the asparaginase binding assay, immunoblotting
and RT-qPCR.
9
Results
MicroSPECT/CT and biodistribution of Asparaginase
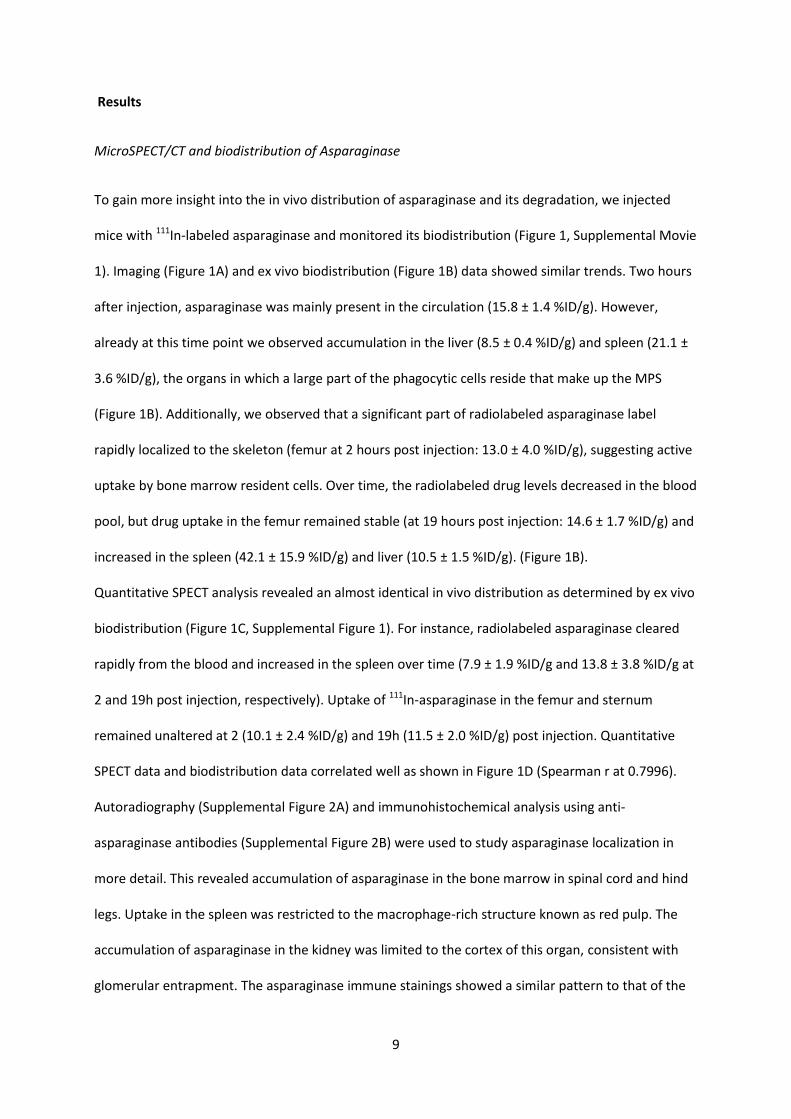
To gain more insight into the in vivo distribution of asparaginase and its degradation, we injected
mice with 111In-labeled asparaginase and monitored its biodistribution (Figure 1, Supplemental Movie
1). Imaging (Figure 1A) and ex vivo biodistribution (Figure 1B) data showed similar trends. Two hours
after injection, asparaginase was mainly present in the circulation (15.8 ± 1.4 %ID/g). However,
already at this time point we observed accumulation in the liver (8.5 ± 0.4 %ID/g) and spleen (21.1 ±
3.6 %ID/g), the organs in which a large part of the phagocytic cells reside that make up the MPS
(Figure 1B). Additionally, we observed that a significant part of radiolabeled asparaginase label
rapidly localized to the skeleton (femur at 2 hours post injection: 13.0 ± 4.0 %ID/g), suggesting active
uptake by bone marrow resident cells. Over time, the radiolabeled drug levels decreased in the blood
pool, but drug uptake in the femur remained stable (at 19 hours post injection: 14.6 ± 1.7 %ID/g) and
increased in the spleen (42.1 ± 15.9 %ID/g) and liver (10.5 ± 1.5 %ID/g). (Figure 1B).
Quantitative SPECT analysis revealed an almost identical in vivo distribution as determined by ex vivo
biodistribution (Figure 1C, Supplemental Figure 1). For instance, radiolabeled asparaginase cleared
rapidly from the blood and increased in the spleen over time (7.9 ± 1.9 %ID/g and 13.8 ± 3.8 %ID/g at
2 and 19h post injection, respectively). Uptake of 111In-asparaginase in the femur and sternum
remained unaltered at 2 (10.1 ± 2.4 %ID/g) and 19h (11.5 ± 2.0 %ID/g) post injection. Quantitative
SPECT data and biodistribution data correlated well as shown in Figure 1D (Spearman r at 0.7996).
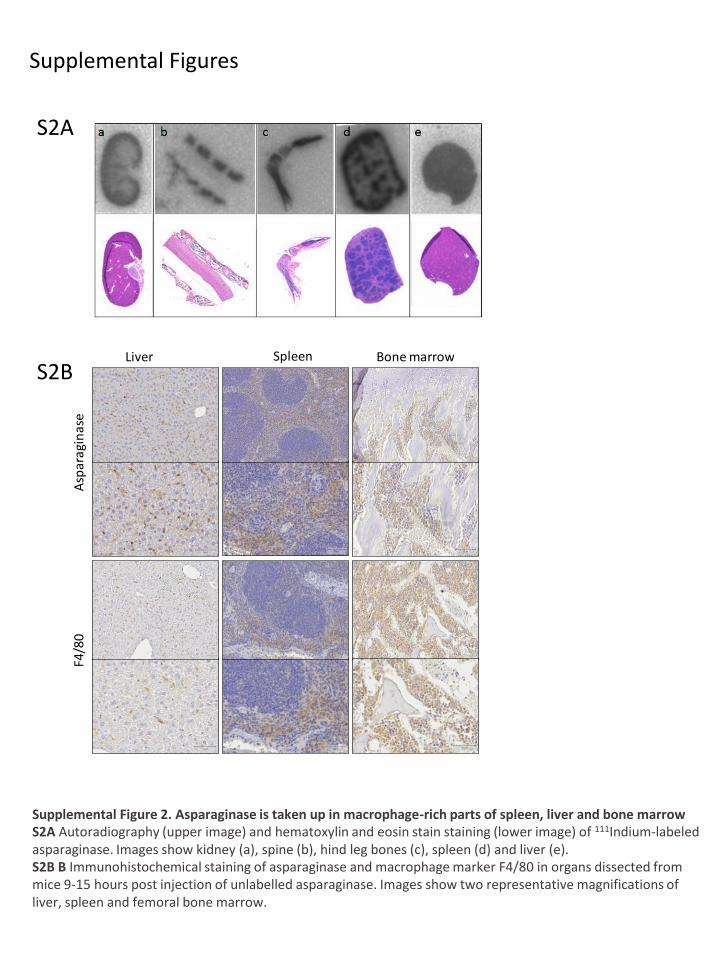
Autoradiography (Supplemental Figure 2A) and immunohistochemical analysis using anti-
asparaginase antibodies (Supplemental Figure 2B) were used to study asparaginase localization in
more detail. This revealed accumulation of asparaginase in the bone marrow in spinal cord and hind
legs. Uptake in the spleen was restricted to the macrophage-rich structure known as red pulp. The
accumulation of asparaginase in the kidney was limited to the cortex of this organ, consistent with
glomerular entrapment. The asparaginase immune stainings showed a similar pattern to that of the
10
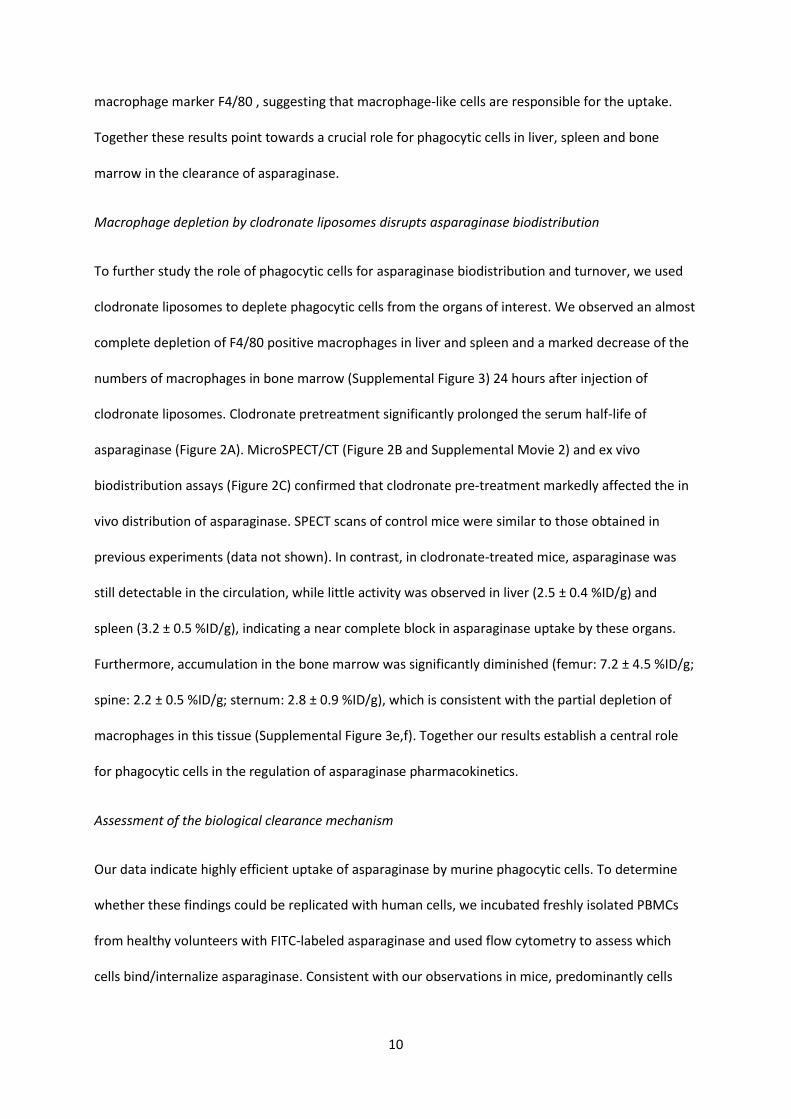
macrophage marker F4/80 , suggesting that macrophage-like cells are responsible for the uptake.
Together these results point towards a crucial role for phagocytic cells in liver, spleen and bone
marrow in the clearance of asparaginase.
Macrophage depletion by clodronate liposomes disrupts asparaginase biodistribution
To further study the role of phagocytic cells for asparaginase biodistribution and turnover, we used
clodronate liposomes to deplete phagocytic cells from the organs of interest. We observed an almost
complete depletion of F4/80 positive macrophages in liver and spleen and a marked decrease of the
numbers of macrophages in bone marrow (Supplemental Figure 3) 24 hours after injection of
clodronate liposomes. Clodronate pretreatment significantly prolonged the serum half-life of
asparaginase (Figure 2A). MicroSPECT/CT (Figure 2B and Supplemental Movie 2) and ex vivo
biodistribution assays (Figure 2C) confirmed that clodronate pre-treatment markedly affected the in
vivo distribution of asparaginase. SPECT scans of control mice were similar to those obtained in
previous experiments (data not shown). In contrast, in clodronate-treated mice, asparaginase was
still detectable in the circulation, while little activity was observed in liver (2.5 ± 0.4 %ID/g) and
spleen (3.2 ± 0.5 %ID/g), indicating a near complete block in asparaginase uptake by these organs.
Furthermore, accumulation in the bone marrow was significantly diminished (femur: 7.2 ± 4.5 %ID/g;
spine: 2.2 ± 0.5 %ID/g; sternum: 2.8 ± 0.9 %ID/g), which is consistent with the partial depletion of
macrophages in this tissue (Supplemental Figure 3e,f). Together our results establish a central role
for phagocytic cells in the regulation of asparaginase pharmacokinetics.
Assessment of the biological clearance mechanism
Our data indicate highly efficient uptake of asparaginase by murine phagocytic cells. To determine
whether these findings could be replicated with human cells, we incubated freshly isolated PBMCs
from healthy volunteers with FITC-labeled asparaginase and used flow cytometry to assess which
cells bind/internalize asparaginase. Consistent with our observations in mice, predominantly cells

11
expressing the monocyte/macrophage marker CD14 (76.4 ± 14.8 %) were found to bind asparaginase
(Figure 3B).
In an earlier study, we identified lysosomal protease cathepsin B as a critical determinant of
asparaginase half-life 8. In order to link this observation to the potential role for phagocytic cells
identified here, we studied the role of cathepsin B in macrophage-mediated degradation of
asparaginase. To this end, we used THP-1 cells, a human monocytic cell line that can be forced into
differentiation towards a macrophage like phenotype using phorbol-12-myristate-13-acetate (PMA).
Similar to freshly isolated CD14+ cells, THP-1 cells efficiently bound asparaginase (Supplemental
Figure 4). We used a previously described in vitro degradation assay 8 to show that asparaginase
activity remained unaffected in the monocyte lysate, while the protein was rapidly degraded in
lysates from differentiated cells. We observed a similar, but even more efficient degradation in
lysates of the murine macrophage cell line RAW264.7. Importantly, degradation in both macrophage
lysates was completely inhibited by the addition of the cathepsin B inhibitor CA-074 (Figure 3C, red
marked values).
To investigate the correlation between cathepsin B expression and asparaginase degradation, we
compared cathepsin B mRNA expression levels in undifferentiated versus differentiated THP-1 cells,
(Figure 4A) and found that cathepsin B mRNA expression is strongly induced upon differentiation.
RNAi mediated suppression of cathepsin B activity (Figure 4B and Supplemental Figure 5A and B)
resulted in a complete or partial block of asparaginase degradation, depending on knockdown
efficiency (Figure 4C). Furthermore, we observed that the serum half-life of asparaginase was
strongly prolonged in cathepsin B knockout mice compared (Figure 4D). Together, these data firmly
establish that cathepsin B activity is an essential and a rate-limiting enzyme for asparaginase
degradation by macrophages.

12
Discussion
Although asparaginase has been used for decades in the treatment of patients with ALL, little is
known about its metabolic fate in patients. Although depletion of asparagine in serum and bone
marrow aspirates can be monitored and shows complete depletion when asparaginase
concentrations reach threshold levels, concentrations in situ and the supportive role of the
microenvironment are subject of debate 2, 3, 5, 13-16. The question remains whether asparaginase is
sufficiently active at this particular niche where the leukemia originates and where leukemia-
initiating cells reside.
We applied in vivo imaging of radiolabeled asparaginase with microSPECT/CT to visualize
asparaginase biodistribution. In addition to spleen and liver, both organs most frequently involved in
uptake of foreign (macro)molecules and particles, we found a remarkably rapid and strong
accumulation of asparaginase in the bone marrow. Although bone marrow resident macrophages are
part of the MPS, the role of these cells in clearing the blood from macromolecules is often secondary
to spleen and liver resident cells and is directed by the size of the molecule 17, 18. Because for its
therapeutic action, asparaginase needs to be present in the serum, this raises the question whether
rapid clearance of the drug by bone marrow resident macrophages will negatively affect the
depletion of asparagine in the bone marrow niche. Hence, our imaging approach may reflect a rapid
local elimination of the drug that could provide a mechanism by which leukemic cells can escape
from apoptosis as a result of the asparaginase induced nutrient limitation.
Only a few studies have addressed the potential molecular mechanisms involved in the regulation of
asparaginase kinetics. We show a highly efficient uptake of asparaginase by phagocytic cells,
predominantly macrophages. These cells express a large variety of antigen uptake receptors that
recognize macromolecules based on charge, peptide structure or modification, which are
subsequently internalized and degraded in the endosomal compartment 19. Previous reports discuss

13
the role of lysosomal proteases in controlling asparaginase degradation in vitro and in vivo 7, 8. Our
recent finding that the prolonged half-life of asparaginase in a pediatric patient suffering from ALL
could be attributed to a germline mutation in the cathepsin B 8, is now further supported by the in
vitro and in vivo experiments presented here. Since lysosomal processing of epitopes is a crucial step
towards successful antigen presentation, blocking cathepsin B mediated degradation by altering the
amino acid sequence of asparaginase may enhance the therapeutic efficacy of this drug by reducing
the immunogenicity.
We have limited our studies to E.coli asparaginase. Two other formulations are in use in clinic
practice. Erwinia chrysamthemi asparaginase is frequently used as a second line treatment option
after development of inhibitory antibodies. In our previous study 8, we showed that the kinetics of
E.coli and Erwinia asparaginase are similarly affected by a mutation in cathepsin B. In addition to its
native form, a PEGylated form of E.coli asparaginase, which was introduced to reduce
hypersensitivity reactions to the drug, is widely used in the clinic. The PEG coat reduced the
immunogenicity due to its shielding properties: it inhibits direct, primarily charge mediated, binding
of the protein to cells and prevents opsonization. Indeed, patients treated with PEG-asparaginase
develop anti-asparaginase antibodies less frequently than patients treated with the native form 20.
Another most welcome effect of the PEGylation of asparaginase, is the prolonged half-life of this
modified drug. This is consistent with our findings that the interaction between asparaginase and
phagocytic cells is a critical determinant of the pharmacokinetics.
With an increased use of PEGylated drugs, not limited to asparaginase, it has become clear that
patients do develop anti-PEG antibodies and that this can compromise therapeutic efficacy 21-24.
Therefore, use of PEG-asparaginase should also be supported by therapeutic drug monitoring to
prevent underexposure25 and as a result, the benefits compared to the use of native asparaginase are
reduced.
14
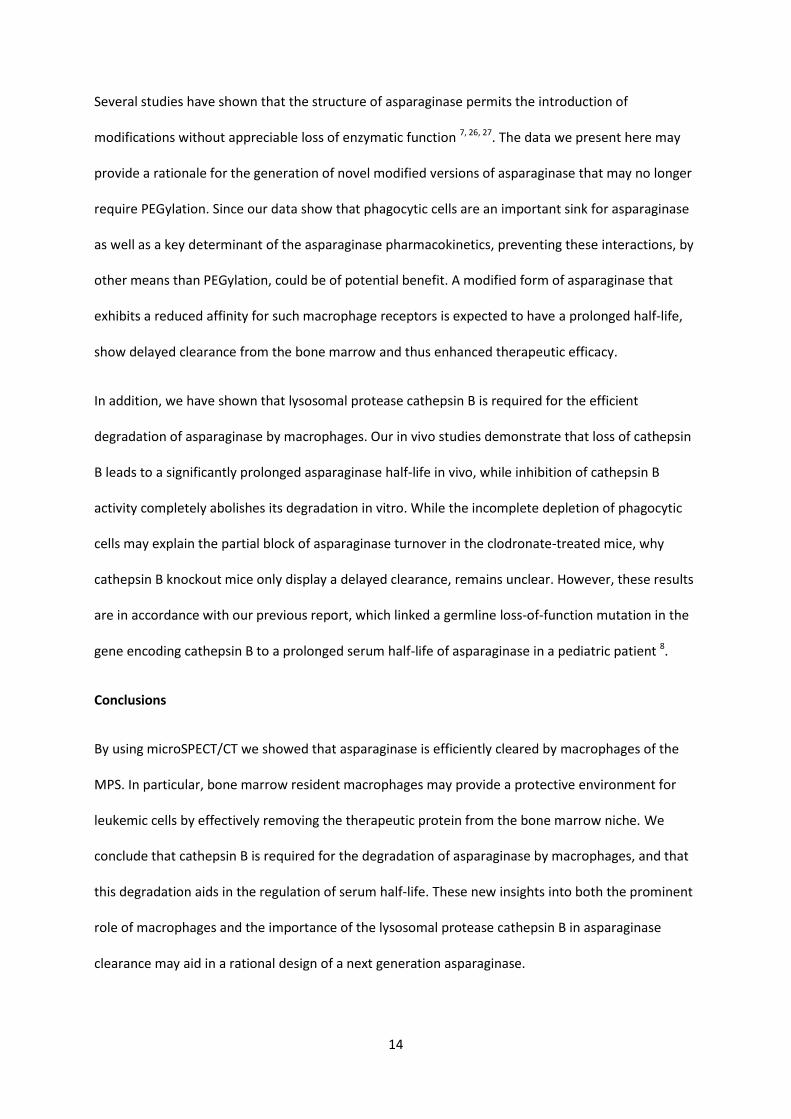
Several studies have shown that the structure of asparaginase permits the introduction of
modifications without appreciable loss of enzymatic function 7, 26, 27. The data we present here may
provide a rationale for the generation of novel modified versions of asparaginase that may no longer
require PEGylation. Since our data show that phagocytic cells are an important sink for asparaginase
as well as a key determinant of the asparaginase pharmacokinetics, preventing these interactions, by
other means than PEGylation, could be of potential benefit. A modified form of asparaginase that
exhibits a reduced affinity for such macrophage receptors is expected to have a prolonged half-life,
show delayed clearance from the bone marrow and thus enhanced therapeutic efficacy.
In addition, we have shown that lysosomal protease cathepsin B is required for the efficient
degradation of asparaginase by macrophages. Our in vivo studies demonstrate that loss of cathepsin
B leads to a significantly prolonged asparaginase half-life in vivo, while inhibition of cathepsin B
activity completely abolishes its degradation in vitro. While the incomplete depletion of phagocytic
cells may explain the partial block of asparaginase turnover in the clodronate-treated mice, why
cathepsin B knockout mice only display a delayed clearance, remains unclear. However, these results
are in accordance with our previous report, which linked a germline loss-of-function mutation in the
gene encoding cathepsin B to a prolonged serum half-life of asparaginase in a pediatric patient 8.
Conclusions
By using microSPECT/CT we showed that asparaginase is efficiently cleared by macrophages of the
MPS. In particular, bone marrow resident macrophages may provide a protective environment for
leukemic cells by effectively removing the therapeutic protein from the bone marrow niche. We
conclude that cathepsin B is required for the degradation of asparaginase by macrophages, and that
this degradation aids in the regulation of serum half-life. These new insights into both the prominent
role of macrophages and the importance of the lysosomal protease cathepsin B in asparaginase
clearance may aid in a rational design of a next generation asparaginase.

15
References
1. Pieters R, Hunger SP, Boos J, et al. L-asparaginase treatment in acute lymphoblastic leukemia:
a focus on Erwinia asparaginase. Cancer. Jan 15 2011;117(2):238-249.
2. Ehsanipour EA, Sheng X, Behan JW, et al. Adipocytes cause leukemia cell resistance to L-
asparaginase via release of glutamine. Cancer Res. May 15 2013;73(10):2998-3006.
3. Iwamoto S, Mihara K, Downing JR, Pui CH, Campana D. Mesenchymal cells regulate the
response of acute lymphoblastic leukemia cells to asparaginase. J Clin Invest. Apr
2007;117(4):1049-1057.
4. Tong WH, Pieters R, Hop WC, Lanvers-Kaminsky C, Boos J, van der Sluis IM. No evidence of
increased asparagine levels in the bone marrow of patients with acute lymphoblastic
leukemia during asparaginase therapy. Pediatr Blood Cancer. Feb 2013;60(2):258-261.
5. Steiner M, Hochreiter D, Kasper DC, et al. Asparagine and aspartic acid concentrations in
bone marrow versus peripheral blood during Berlin-Frankfurt-Munster-based induction
therapy for childhood acute lymphoblastic leukemia. Leuk Lymphoma. Sep 2012;53(9):1682-
1687.
6. Brueck M, Koerholz D, Nuernberger W, Juergens H, Goebel U, Wahn V. Elimination of l-
asparaginase in children treated for acute lymphoblastic leukemia. Dev Pharmacol Ther.
1989;12(4):200-204.
7. Patel N, Krishnan S, Offman MN, et al. A dyad of lymphoblastic lysosomal cysteine proteases
degrades the antileukemic drug L-asparaginase. J Clin Invest. Jul 2009;119(7):1964-1973.
8. van der Meer LT, Waanders E, Levers M, et al. A germ line mutation in cathepsin B points
toward a role in asparaginase pharmacokinetics. Blood. Nov 6 2014;124(19):3027-3029.
9. Halangk W, Lerch MM, Brandt-Nedelev B, et al. Role of cathepsin B in intracellular
trypsinogen activation and the onset of acute pancreatitis. J Clin Invest. Sep 2000;106(6):773-
781.

16
10. van der Have F, Vastenhouw B, Ramakers RM, et al. U-SPECT-II: An Ultra-High-Resolution
Device for Molecular Small-Animal Imaging. J Nucl Med. Apr 2009;50(4):599-605.
11. Terry SY, Abiraj K, Lok J, et al. Can 111In-RGD2 monitor response to therapy in head and neck
tumor xenografts? J Nucl Med. Nov 2014;55(11):1849-1855.
12. Terry SY, Boerman OC, Gerrits D, et al. In-anti-F4/80-A3-1 antibody: a novel tracer to image
macrophages. Eur J Nucl Med Mol Imaging. Aug 2015;42(9):1430-1438.
13. Chiu M, Franchi-Gazzola R, Bussolati O, D'Amico G, Dell'Acqua F, Rizzari C. Asparagine levels
in the bone marrow of patients with acute lymphoblastic leukemia during asparaginase
therapy. Pediatr Blood Cancer. Nov 2013;60(11):1915.
14. Tiziani S, Kang Y, Harjanto R, et al. Metabolomics of the tumor microenvironment in pediatric
acute lymphoblastic leukemia. PLoS One. 2013;8(12):e82859.
15. Dimitriou H, Choulaki C, Perdikogianni C, Stiakaki E, Kalmanti M. Expression levels of ASNS in
mesenchymal stromal cells in childhood acute lymphoblastic leukemia. Int J Hematol. Mar
2014;99(3):305-310.
16. Zhang W, Trachootham D, Liu J, et al. Stromal control of cystine metabolism promotes cancer
cell survival in chronic lymphocytic leukaemia. Nat Cell Biol. Mar 2012;14(3):276-286.
17. Rennen HJ, Makarewicz J, Oyen WJ, Laverman P, Corstens FH, Boerman OC. The effect of
molecular weight on nonspecific accumulation of (99m)T-labeled proteins in inflammatory
foci. Nucl Med Biol. May 2001;28(4):401-408.
18. Brinkhuis RP, Stojanov K, Laverman P, et al. Size dependent biodistribution and SPECT
imaging of (111)In-labeled polymersomes. Bioconjug Chem. May 16 2012;23(5):958-965.
19. Aderem A, Underhill DM. Mechanisms of phagocytosis in macrophages. Annu Rev Immunol.
1999;17:593-623.
20. Avramis VI, Sencer S, Periclou AP, et al. A randomized comparison of native Escherichia coli
asparaginase and polyethylene glycol conjugated asparaginase for treatment of children with

17
newly diagnosed standard-risk acute lymphoblastic leukemia: a Children's Cancer Group
study. Blood. Mar 15 2002;99(6):1986-1994.
21. Armstrong JK, Hempel G, Koling S, et al. Antibody against poly(ethylene glycol) adversely
affects PEG-asparaginase therapy in acute lymphoblastic leukemia patients. Cancer. Jul 1
2007;110(1):103-111.
22. Richter AW, Akerblom E. Polyethylene glycol reactive antibodies in man: titer distribution in
allergic patients treated with monomethoxy polyethylene glycol modified allergens or
placebo, and in healthy blood donors. Int Arch Allergy Appl Immunol. 1984;74(1):36-39.
23. Verhoef JJ, Carpenter JF, Anchordoquy TJ, Schellekens H. Potential induction of anti-PEG
antibodies and complement activation toward PEGylated therapeutics. Drug Discov Today.
Dec 2014;19(12):1945-1952.
24. Garay RP, El-Gewely R, Armstrong JK, Garratty G, Richette P. Antibodies against polyethylene
glycol in healthy subjects and in patients treated with PEG-conjugated agents. Expert Opin
Drug Deliv. Nov 2012;9(11):1319-1323.
25. Tong WH, Pieters R, Kaspers GJ, et al. A prospective study on drug monitoring of
PEGasparaginase and Erwinia asparaginase and asparaginase antibodies in pediatric acute
lymphoblastic leukemia. Blood. Mar 27 2014;123(13):2026-2033.
26. Offman MN, Krol M, Patel N, et al. Rational engineering of L-asparaginase reveals importance
of dual activity for cancer cell toxicity. Blood. Feb 3 2011;117(5):1614-1621.
27. Verma S, Mehta RK, Maiti P, Rohm KH, Sonawane A. Improvement of stability and enzymatic
activity by site-directed mutagenesis of E. coli asparaginase II. Biochim Biophys Acta. Jul
2014;1844(7):1219-1230.

Figure 1A Figure 1B
2h p.i. 7h p.i. 13h p.i. 19h p.i. 19h p.i. 19h p.i.
a b c d e f
Asparaginase
Figure 1C Figure 1D
FIGURE 1. Asparaginase rapidly accumulates in spleen, liver and bone marrow
A Ventral (a-d) and lateral (e,f) 3-dimensional volume projections of fused SPECT/CT scans of mice injected with 111Indium-labeled asparaginase at the indicated hours post injection (h.p.i.). B Ex vivo quantification of 111Indium-labeled asparaginase uptake in various organs at the indicated hours post injection (h.p.i.). Data represent mean ± SEM of n = 5 mice per timepoint. C Biodistribution of asparaginase as quantified from SPECT images. N=3 per timepoint. D Uptake of 111Indium-labeled asparaginase as quantified from micro-SPECT images plotted against values derived from ex vivo biodistribution studies.
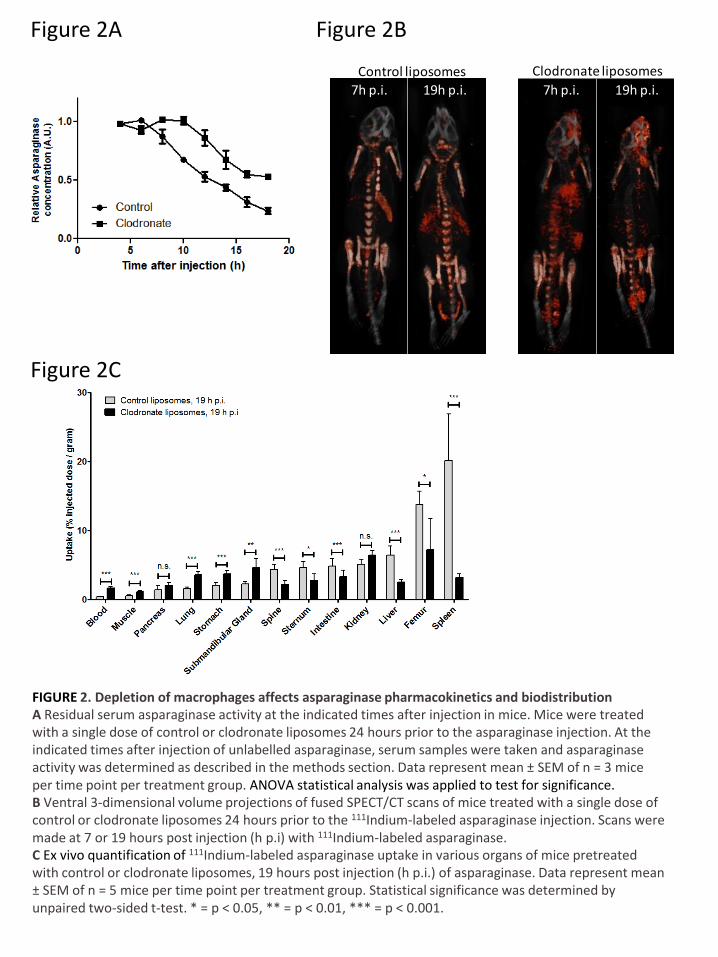
Figure 2B
Control liposomes Clodronate liposomes
7h p.i. 19h p.i. 7h p.i. 19h p.i.
AsparaginaseFigure 2C
Figure 2A
FIGURE 2. Depletion of macrophages affects asparaginase pharmacokinetics and biodistribution
A Residual serum asparaginase activity at the indicated times after injection in mice. Mice were treated with a single dose of control or clodronate liposomes 24 hours prior to the asparaginase injection. At the indicated times after injection of unlabelled asparaginase, serum samples were taken and asparaginase activity was determined as described in the methods section. Data represent mean ± SEM of n = 3 mice per time point per treatment group. ANOVA statistical analysis was applied to test for significance. B Ventral 3-dimensional volume projections of fused SPECT/CT scans of mice treated with a single dose of control or clodronate liposomes 24 hours prior to the 111Indium-labeled asparaginase injection. Scans were made at 7 or 19 hours post injection (h p.i) with 111Indium-labeled asparaginase. C Ex vivo quantification of 111Indium-labeled asparaginase uptake in various organs of mice pretreated with control or clodronate liposomes, 19 hours post injection (h p.i.) of asparaginase. Data represent mean ± SEM of n = 5 mice per time point per treatment group. Statistical significance was determined by unpaired two-sided t-test. * = p < 0.05, ** = p < 0.01, *** = p < 0.001.

Figure 3A
Figure 3C
CD45+
CD14+
CD3+
CD19+
Figure 3B
FIGURE 3. Human macrophages bind and degrade asparaginase
A Histograms showing binding of asparaginase to various cellular subsets in PBMCs. Freshly isolated PBMCs were incubated with FITC-labelled asparaginase and subsequently indentified based on the indicated cell surface markers using flowcytometry. Lineages were defined as follows: CD45-all nucleated cells, CD14-monocytes/macrophages, CD3-T cells, CD19-B cells. B Average of percentage of PBMC subsets binding FITC-labeled asparaginase (N=2). C Asparaginase degradation in lysates of cell lines. Asparaginase was incubated in lysate of human undifferentiated, monocyte like THP-1 cells (squares), differentiated, macrophage like THP-1 cells (circles) and the murine macrophage cell line RAW264.7 (triangles). After incubation, residual ASNase activity was assayed as described in the methods section. Cathepsin inhibitor CA-074 was included to selected samples to confirm the contribution of Cathepsin B in this degradation (red data points).
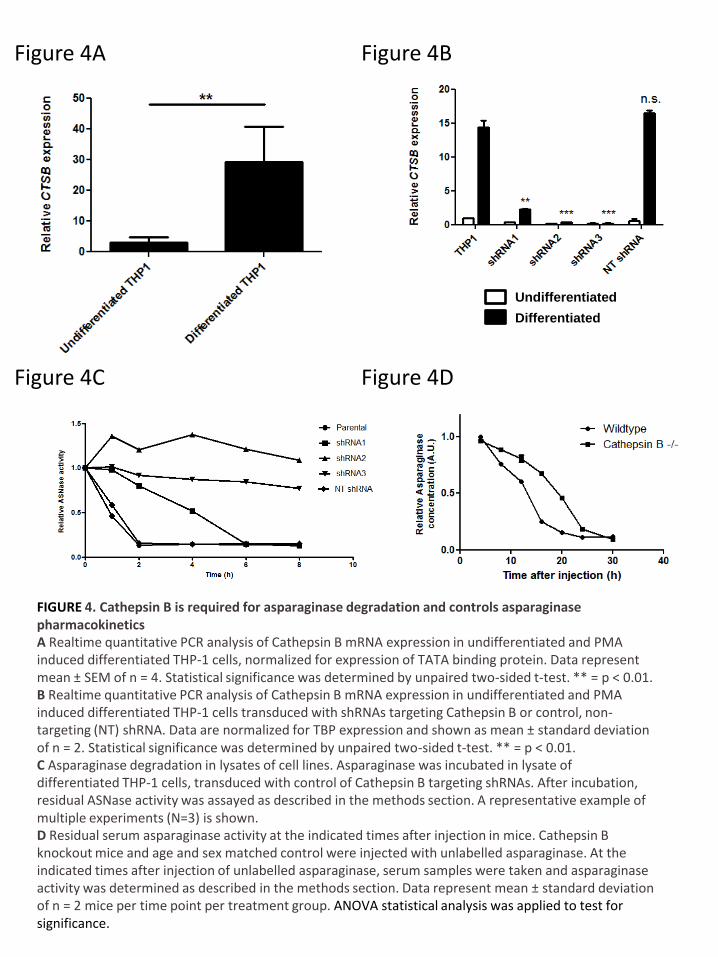
Figure 4A Figure 4B
Differentiated
Undifferentiated
Figure 4C Figure 4D
FIGURE 4. Cathepsin B is required for asparaginase degradation and controls asparaginase pharmacokinetics
A Realtime quantitative PCR analysis of Cathepsin B mRNA expression in undifferentiated and PMA induced differentiated THP-1 cells, normalized for expression of TATA binding protein. Data represent mean ± SEM of n = 4. Statistical significance was determined by unpaired two-sided t-test. ** = p < 0.01. B Realtime quantitative PCR analysis of Cathepsin B mRNA expression in undifferentiated and PMA induced differentiated THP-1 cells transduced with shRNAs targeting Cathepsin B or control, non-targeting (NT) shRNA. Data are normalized for TBP expression and shown as mean ± standard deviation of n = 2. Statistical significance was determined by unpaired two-sided t-test. ** = p < 0.01. C Asparaginase degradation in lysates of cell lines. Asparaginase was incubated in lysate of differentiated THP-1 cells, transduced with control of Cathepsin B targeting shRNAs. After incubation, residual ASNase activity was assayed as described in the methods section. A representative example of multiple experiments (N=3) is shown. D Residual serum asparaginase activity at the indicated times after injection in mice. Cathepsin B knockout mice and age and sex matched control were injected with unlabelled asparaginase. At the indicated times after injection of unlabelled asparaginase, serum samples were taken and asparaginase activity was determined as described in the methods section. Data represent mean ± standard deviation of n = 2 mice per time point per treatment group. ANOVA statistical analysis was applied to test for significance.
Supplemental Figures
S1
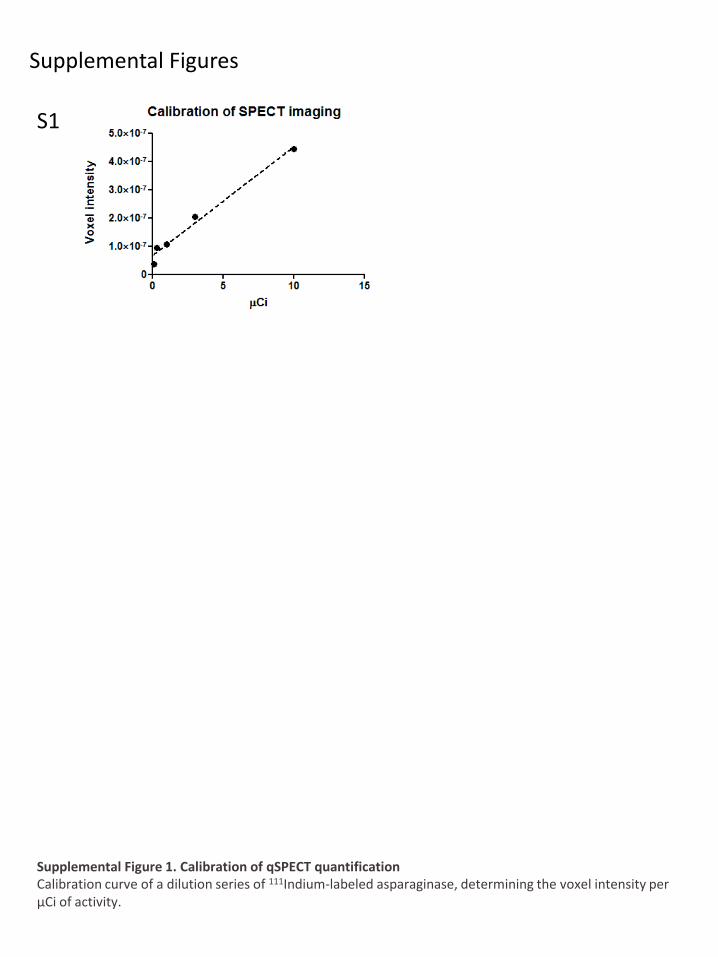
Supplemental Figure 1. Calibration of qSPECT quantification
Calibration curve of a dilution series of 111Indium-labeled asparaginase, determining the voxel intensity per µCi of activity.
S2A
S2B Liver Spleen Bone marrow
Asp
ara
gin
ase
F4/8
0Supplemental Figures
Supplemental Figure 2. Asparaginase is taken up in macrophage-rich parts of spleen, liver and bone marrow S2A Autoradiography (upper image) and hematoxylin and eosin stain staining (lower image) of 111Indium-labeled asparaginase. Images show kidney (a), spine (b), hind leg bones (c), spleen (d) and liver (e). S2B B Immunohistochemical staining of asparaginase and macrophage marker F4/80 in organs dissected from mice 9-15 hours post injection of unlabelled asparaginase. Images show two representative magnifications of liver, spleen and femoral bone marrow.

Supplemental Figures
S3
Supplemental Figure 3. Immunohistochemical analysis of clodronate mediated macrophage depletion
Immunohistochemical staining of macrophage marker F4/80 in organs dissected from mice 9-15 hours post injection of control and clodronate liposomes. Representative images of, spleen (a and b) liver (c and d) and femoral bone marrow (e and f) are shown.

Supplemental Figures
S4
5 µg 10 µg
20 µg No Asparaginase
Incubation at 4°C
Incubation at 37°C
FITC FITC
FITC
C
ou
nts
C
ou
nts
C
ou
nts
Supplemental Figure 4. Differentiated THP1 cells bind asparaginase
Histograms showing binding of asparaginase to differentiated THP-1 cells. PMA induced differentiated cells were incubated with different concentrations of FITC-labeled asparaginase at different temperatures. Binding was analyzed by flowcytometry.
Supplemental Figures
S5A
β-tubulin
Cathepsin B
+ - + - + - + - + - differentiation
S5B
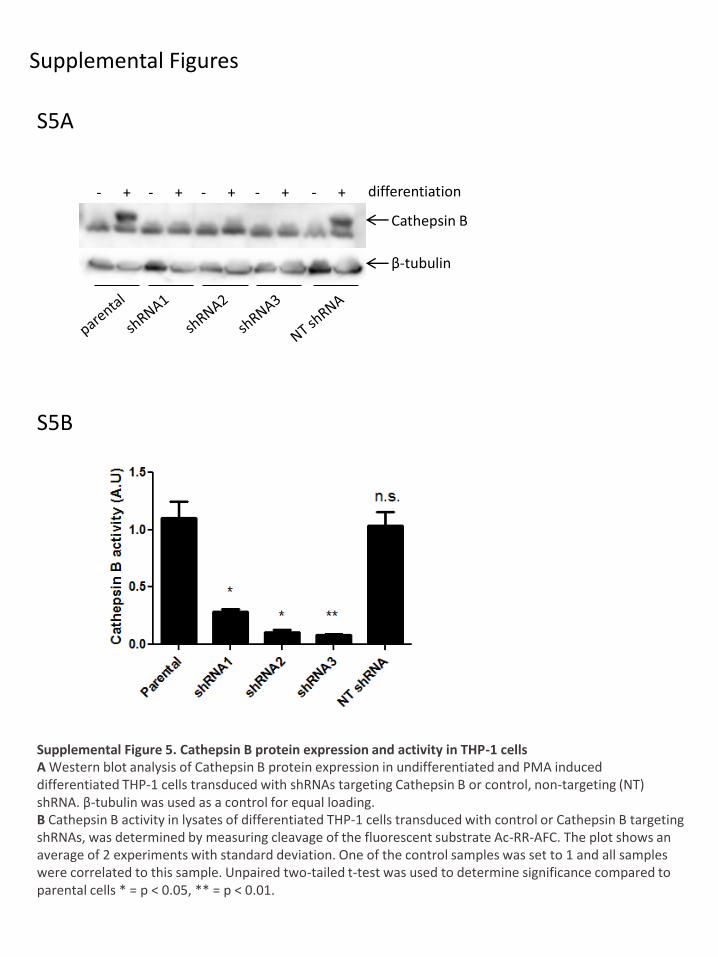
Supplemental Figure 5. Cathepsin B protein expression and activity in THP-1 cells
A Western blot analysis of Cathepsin B protein expression in undifferentiated and PMA induced differentiated THP-1 cells transduced with shRNAs targeting Cathepsin B or control, non-targeting (NT) shRNA. β-tubulin was used as a control for equal loading. B Cathepsin B activity in lysates of differentiated THP-1 cells transduced with control or Cathepsin B targeting shRNAs, was determined by measuring cleavage of the fluorescent substrate Ac-RR-AFC. The plot shows an average of 2 experiments with standard deviation. One of the control samples was set to 1 and all samples were correlated to this sample. Unpaired two-tailed t-test was used to determine significance compared to parental cells * = p < 0.05, ** = p < 0.01.
Supplemental tables
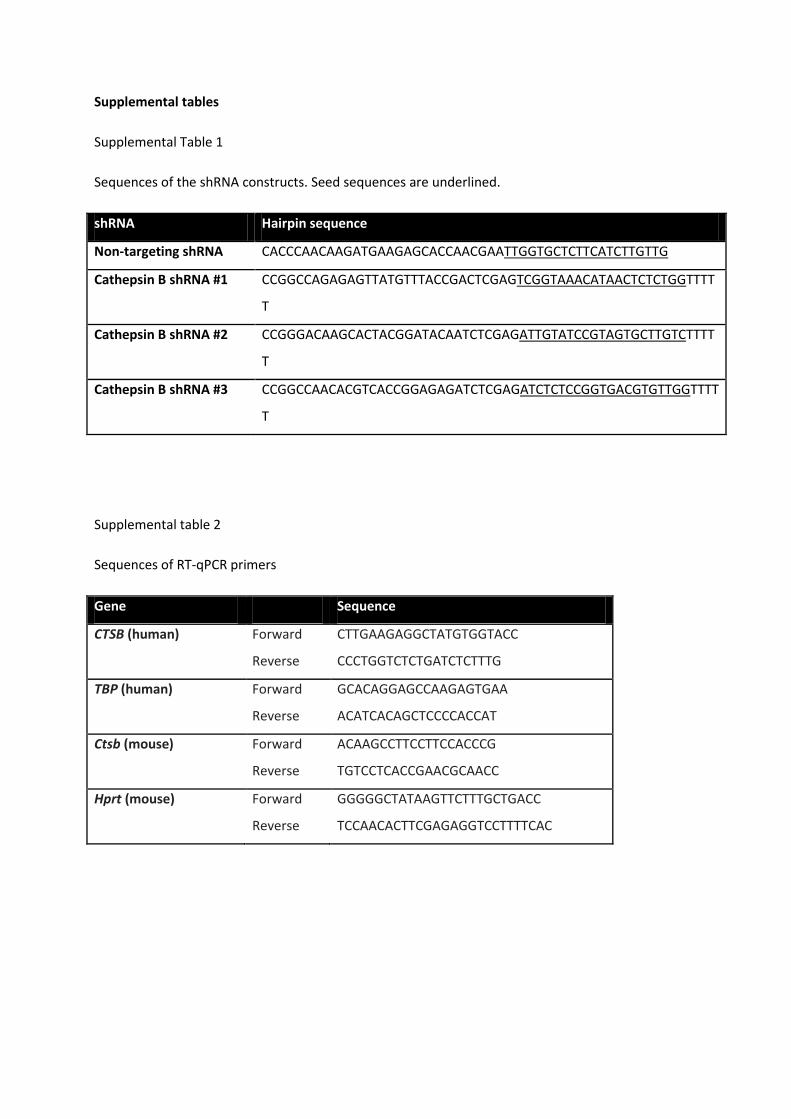
Supplemental Table 1
Sequences of the shRNA constructs. Seed sequences are underlined.
shRNA Hairpin sequence
Non-targeting shRNA CACCCAACAAGATGAAGAGCACCAACGAATTGGTGCTCTTCATCTTGTTG
Cathepsin B shRNA #1 CCGGCCAGAGAGTTATGTTTACCGACTCGAGTCGGTAAACATAACTCTCTGGTTTT
T
Cathepsin B shRNA #2 CCGGGACAAGCACTACGGATACAATCTCGAGATTGTATCCGTAGTGCTTGTCTTTT
T
Cathepsin B shRNA #3 CCGGCCAACACGTCACCGGAGAGATCTCGAGATCTCTCCGGTGACGTGTTGGTTTT
T
Supplemental table 2
Sequences of RT-qPCR primers
Gene Sequence
CTSB (human) Forward
Reverse
CTTGAAGAGGCTATGTGGTACC
CCCTGGTCTCTGATCTCTTTG
TBP (human) Forward
Reverse
GCACAGGAGCCAAGAGTGAA
ACATCACAGCTCCCCACCAT
Ctsb (mouse) Forward
Reverse
ACAAGCCTTCCTTCCACCCG
TGTCCTCACCGAACGCAACC
Hprt (mouse) Forward
Reverse
GGGGGCTATAAGTTCTTTGCTGACC
TCCAACACTTCGAGAGGTCCTTTTCAC

Supplemental methods
Radiolabeling of asparaginase
Asparaginase (4 mg) was conjugated under strict metal-free conditions with isothiocyanatobenzyl–
diethylenetriaminepentaacetic acid (ITC-DTPA, Macrocyclics, Dallas, TX) in 0.1 M NaHCO3, pH 9.5,
using a 10-fold molar excess of ITC-DTPA. After 1 hour incubation at RT the conjugation mixture was
dialyzed in a dialysis cassette with a molecular cut-off value of 20 kDa (Slide-A-Lyzer 20K, Thermo
Scientific, Waltham, MA) against 0.25 M Ammonium Acetate, pH 5.5 to remove the unconjugated
ITC-DTPA. The substitution ratio, as determined by labeling the conjugation mixture with 111InCl3
(600-800 MBq, Mallinckrodt, Petten, The Netherlands), was 0.8 DTPA/asparaginase molecule. 111InCl3
was added to DTPA-asparaginase (50-65 μg) for 1 h at RT in 0.1 M 2-(N-morpholino)ethanesulfonic
acid buffer, pH 5.4. Free In-111 was complexed by adding 50 mM ethylenediaminetetraacetic acid
(EDTA; final concentration of 5 mM). Quality control was performed using instant thin-layer
chromatography. To obtain a radiochemical purity ≥95%, 111In-labeled protein was purified by gel
filtration on a disposable PD10 column (GE Healthcare Life Sciences, Eindhoven, the Netherlands),
eluted with PBS containing 0.5% bovine serum albumin (BSA). The specific activity of the radiolabeled
asparaginase preparations used in the experiments was (5-12 MBq/μg).
Autoradiography
Formalin-fixed, paraffin-embedded tissue sections (4 μm) from mice injected intravenously with
111In-asparaginase were dewaxed, rehydrated and exposed to a phosphor imaging screen for up to 7
days. The screen was scanned in a phosphor imager system (Bioimaging Analyzer System 1800-II;
Fujifilm, Tilburg, the Netherlands) at a pixel size of 50 × 50 μm.
Asparaginase binding assay
Human peripheral blood mononuclear cells (PBMCs) were isolated from blood obtained from healthy
volunteers upon informed written consent, using density gradient centrifugation (Lymphoprep; Axis-
Shield, Dundee, Scotland). Asparaginase (Takeda, Hoofddorp, the Netherlands) was conjugated with
Fluorescein isothiocyanate according to manufacturer’s instructions (Pierce / Life Technologies,
Carlsbad, CA). PBMCs or THP-1 cells were incubated with FITC labeled asparaginase in culture
medium for 1 hour at the indicated temperatures. After incubation, PBMCs were stained for
expression of lineage markers with anti-CD14, -CD45, -CD3 and -CD19 antibodies purchased form BD
Biosciences and analyzed using a LSRII flow cytometer (BD Biosciences, Breda, the Netherlands). The
data were collected and analyzed by FlowJo software version 8.8.7 FlowJo, Ashland OR).
Immunohistochemistry
For histological analysis, tissues and organs, including spleen, lymph nodes, thymus, liver and
femur/tibia were fixed in 4% formalin during 24 hours. Bone containing tissues were decalcified using
Osteosoft (Merck Laboratories). Specimens were embedded in paraffin, 4 µM serial sections were cut
and stained with hematoxylin and eosin (HE) following standard procedures. After dewaxing,
rehydration and antigen retrieval using sodium citrate, slides were blocked with 2% normal goat
serum (Vector Laboratories, Burlingame, CA) and 2% BSA in 0.05% PBS, Tween20 prior to overnight
staining with F4/80 (MCA497GA, AbD Serotec, Oxford, United Kingdom) and Asparaginase (ab21013,
Abcam, Cambridge, United Kingdom) antibodies. Appropriate biotinylated antibodies (Vector
Laboratories) were used as secondary antibody and staining was revealed by incubation with metal-
enhanced diaminobenzidine in stable peroxide substrate buffer (Thermo Fisher Scientific Inc.). After
counterstaining with hematoxylin (1:3) sildes were dehydrated and coverslipped using entellan
(Merck Laboratories). Images were captured using a VisionTek digital microscope (Sakura Finetek,
Torrance, CA).
Cell culture
The human acute monocytic leukemia cell line THP-1 was obtained from the American Type Culture
Collection (ATCC, #TIB-202) cultured in RPMI 1640 containing L-glutamine (Invitrogen /Life
technologies), supplemented with 10% heat-inactivated fetal bovine serum (Greiner Bio-One), and
100 units/ml penicillin/streptomycin (Invitrogen). The mouse leukemic monocyte macrophage cell
line RAW264.7 (ATCC #TIB-71) and HEK293 FT (Invitrogen) cells were cultured in DMEM containing L-
glutamine (Invitrogen), supplemented with 10% heat-inactivated fetal bovine serum, 100 units/ml
penicillin/streptomycin, and 1% non-essential amino acids (Invitrogen). All cells were incubated at
37°C in a 5% CO2 humidified atmosphere. All cell Lines were used within 3 months of culture. THP-1
differentiation was induced by culturing 5 – 8 x 10⁶ cells in the presence of 100 nM phorbol myristate
acetate (PMA; Sigma-Aldrich) for three days. After three days the medium was refreshed by medium
without PMA and terminal differentiation was continued for an additional three days.
Real-time Quantitative Polymerase Chain Reaction
Total RNA was extracted using the RNeasy mini-kit (Qiagen, Venlo, the Netherlands) according to
manufacturer’s instructions. Subsequently, cDNA was synthesized of 500 ng RNA template using the
iScriptTM cDNA synthesis kit (Bio-Rad, Hercules, CA). mRNA expression levels were determined by
use of Power SYBR® Green PCR master mix using gene-specific primers (sequences are listed in
Supplemental Table 2) and the CFX96 TouchTM Real-Time PCR detection system (Bio-Rad). TBP
mRNA expression was used as a reference to obtain the relative fold expression of target genes using
the comparative cycle threshold 2(-ΔΔCt) method. Prism software (Graphpad, La Jolla, CA) was used to
plot the data and for statistical analysis. p< 0.05 was considered a significant difference.
Immunoblotting
Whole cell extracts were prepared in NP-40 lysis buffer (200 mM NaCl, 0.5% NP-40, 20 mM Tris-HCl,
pH 8.0, 5 mM EDTA) and cleared by centrifugation. Protein lysates were resolved by sodium dodecyl
sulfate polyacrylamide gel electrophoresis (SDS-PAGE) and transferred to a polyvinylidene difluoride
(PVDF) membrane. The membranes were probed with primary antibodies against cathepsin B (sc-
13985, Santa Cruz Biotechonology, Dallas, TX) or β tubulin (#2128, Cell Signalling Technology, Leiden,
the Netherlands), followed by horseradish peroxidase (HRP) conjugated secondary antibody (DAKO,
Heverlee, Belgium). Proteins were visualized with ECL reagent (GE Healthcare) and expression was
detected with Fluorchem (Protein Simple, San Jose, CA).
References
1. Terry SY, Boerman OC, Gerrits D, et al. In-anti-F4/80-A3-1 antibody: a novel tracer to image
macrophages. Eur J Nucl Med Mol Imaging. Aug 2015;42(9):1430-1438.
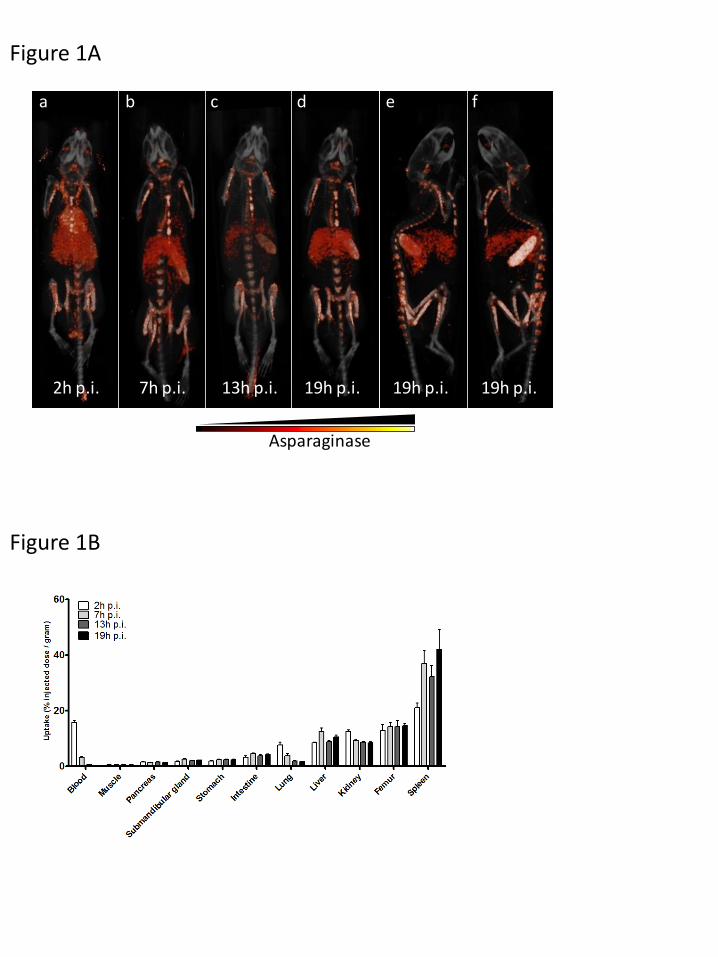
Figure 1A
Figure 1B
2h p.i. 7h p.i. 13h p.i. 19h p.i. 19h p.i. 19h p.i.
a b c d e f
Asparaginase
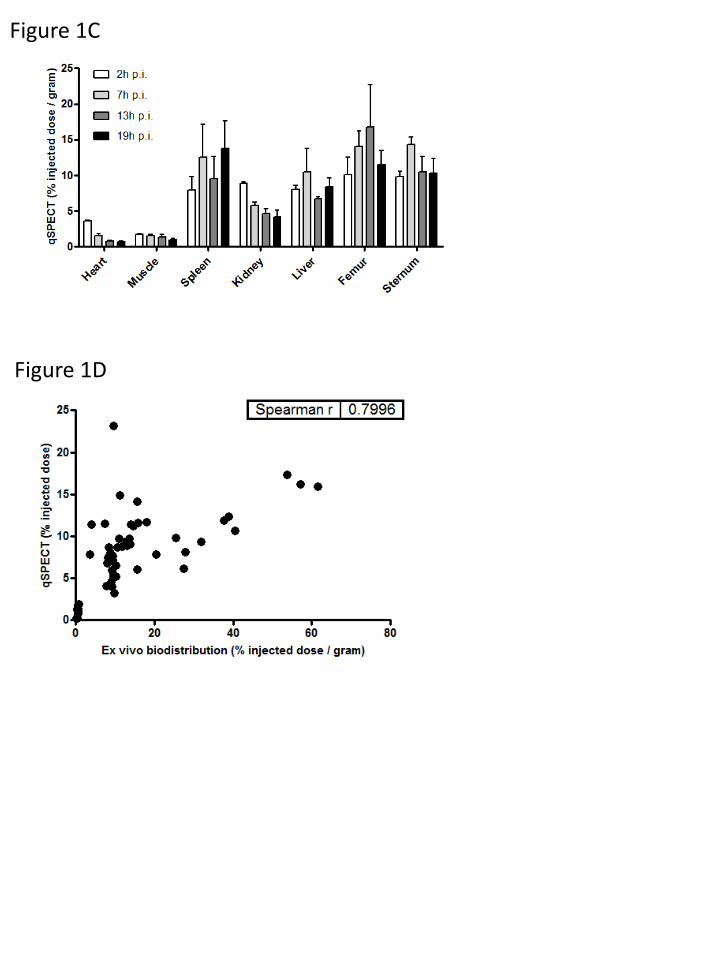
Figure 1C
Figure 1D

Figure 2B Control liposomes Clodronate liposomes
7h p.i. 19h p.i. 7h p.i. 19h p.i.
AsparaginaseFigure 2C
Figure 2A

Figure 3A
Figure 3C
CD45+
CD14+
CD3+
CD19+
Figure 3B
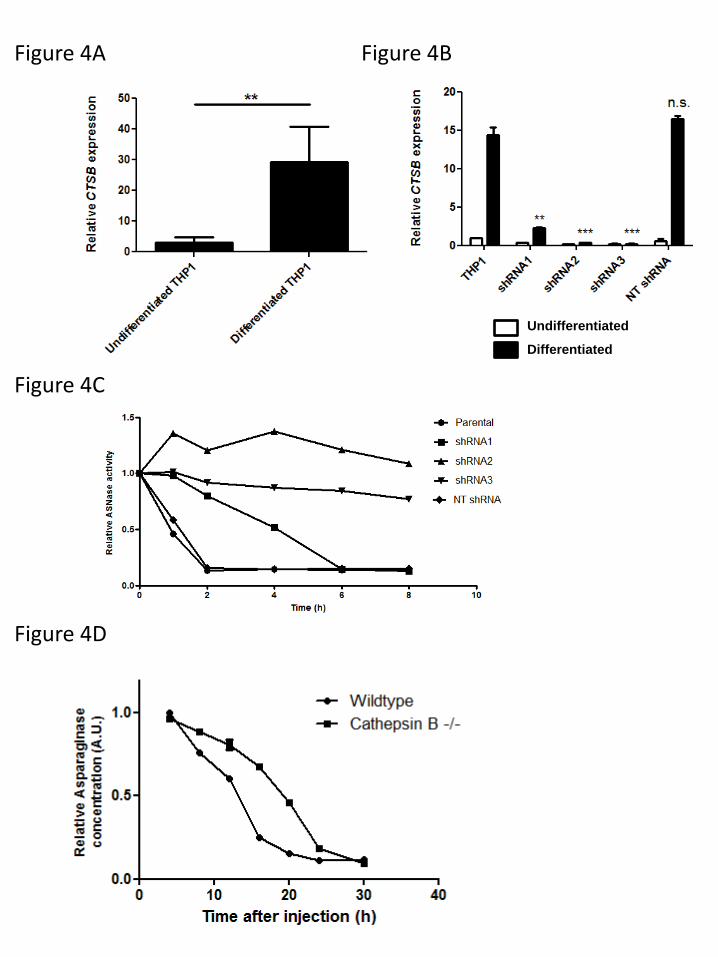
Figure 4A Figure 4B
Differentiated
Undifferentiated
Figure 4C
Figure 4D