kinematic quantification of gait symmetry based on ... · kinematic quantification of gait symmetry...
TRANSCRIPT
KINEMATIC QUANTIFICATION OF GAIT SYMMETRY BASED ON BILATERAL CYCLOGRAMS
Ambarish Goswami
Honda Research Institute Mountain View, California, USA
[email protected] Abstract Symmetry is considered to be an important indicator of healthy gait and a lack of symmetry the effect of various pathologies. Information on gait symmetry can be instrumental in clinical diagnosis, decision-making and for tracking the progress of rehabilitation procedures. We introduce a system of new gait symmetry measures that are derived from the geometric properties of bilateral cyclograms (also called angle-angle diagrams). The symmetry measures are simple, physically meaningful, objective, reliable and well suited for statistical study. We compute the symmetry measures for gaits in both non-paretic (healthy) and hemiparetic subjects and demonstrate how they can be used to characterize normal gait and identify and quantify gait asymmetry. INTRODUCTION Symmetry is considered to be an important indicator of healthy gait. It is one of the first casualties of a gait pathology. Gait symmetry can be compromised due to various factors such as limb asymmetry, injury, use of prosthesis, stroke, cerebral palsy and other mobility-affecting diseases. The presence and nature of asymmetry in gait can be a useful diagnostic tool for the clinicians. Despite the broad agreement in the fundamentals of what constitutes symmetry there is yet to emerge a consensual objective measure of gait symmetry among the researchers. See Sadeghi et al., 2000 for a comprehensive review of the background and state of the art of gait symmetry research. Among the existing gait symmetry quantifiers, algebraic indices and statistical parameters represent two major classes. Algebraic indices include the so-called symmetry index (Robinson et al., 2000) and the ratio index, both comparing bilateral variables such as step period or step length. Notwithstanding their successful use in some cases, both the algebraic quantifiers suffer from major limitations (Sadeghi et al., 2000). Additionally, these parameters depend on discrete variables and are thus unable to reflect the
asymmetry as it evolves over a complete gait cycle. Statistical techniques such as paired t-test (Sadeghi et al., 1997) and PCA, and parameters such as correlation coefficients, coefficient of variation and variance ratio have also been used to measure gait asymmetry (Pierotti, 1991). While the statistical parameters do not suffer from the limitations of the algebraic indices, their computation is more involved and their interpretation perhaps less transparent. In this paper we introduce a novel technique to compute gait symmetry measures. The method is based on the geometric properties of bilateral cyclograms. The measures capture symmetry mismatch over an entire gait cycle and are amenable to statistical analysis. Furthermore the technique is strongly rooted in geometry and the symmetry measures are intuitively understandable. SYMMETRY Since natural healthy gait appears almost symmetric, symmetry issues were ignored for a long time in most gait studies (Sadeghi et al., 2000). Gait asymmetry generally refers to the extent in which the two sides of the body behave differently during a walk cycle. The study of symmetry is traditionally related to the study of laterality or limb dominance, but this is not the topic of the current work. Symmetry can be measured through virtually any measurable or computable gait variable. One may use kinematic variables such as step period and step length or individual joint positions or velocities at specific gait events. Comparison between left and right foot trajectories is also a kinematic approach. Kinetic variables, on the other hand, involve acceleration, force, moment, energy and power. Analyzing entire trajectories or specific discrete values of joint moment and segment power fall under this category. Symmetry can also be studied by comparing the ground reaction force profiles under the individual feet. Our current approach is kinematic and is based on the symmetry of joint angle evolution. We compare the evolution of a single joint with that of its contra-lateral counterpart.
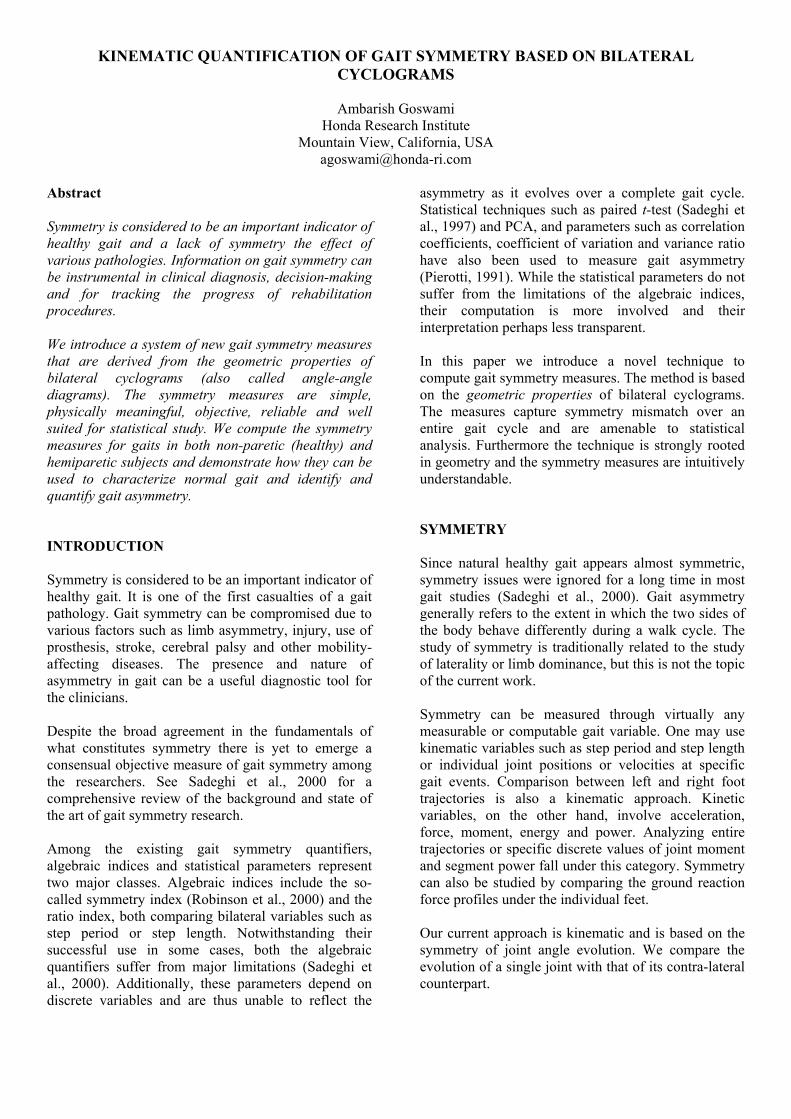
CYCLOGRAMS (ANGLE-ANGLE DIAGRAMS) Although symmetry can be measured through discrete variables as well as through the analysis of time-signal curves, our strong favorite is the cyclogram (Grieve, 1968; Hershler and Milner,1980). Depending on the cyclicity of the gait, cyclograms are closed trajectories generated by simultaneously plotting two (or more) joint variables. In gait study the easily identifiable planar hip-knee cyclograms have traditionally received the most attention (Goswami, 1998). In order to quantify symmetry we instead introduce bilateral cyclograms obtained from the same joint from two sides of the body, as explained in Fig. 1. Because the legs move approximately out-of-phase during natural gait (top row), we cannot compare the bilateral joint signals directly for testing symmetry. Rather as a pre-processing step the two signals should be synchronized, preferably using a clearly identifiable gait event such as the heel touchdown. The plot in the bottom row is obtained after the joint signals are synchronized. Before synchronization the cyclogram appears as in the middle row. METHODS For a perfectly symmetric gait a properly synchronized twin trajectories from corresponding joints should be identical. In other words, the bilateral cyclogram should lie entirely on a 45o straight line, referred to as the symmetry line henceforth. In reality, however, no gait is perfectly symmetric. Hence the cyclogram deviates from the symmetry line, as seen in Fig. 1, bottom row. We claim that the nature and magnitude of the cyclogram’s deviation from the symmetry line is a measure of asymmetry in the gait. We will mathematically measure these deviations to obtain a quantification of gait symmetry. For this purpose, a number of geometric parameters descriptive of the symmetry line may be utilized. In this paper we will focus on three parameters: the area within the cyclogram, its orientation and its minimum moment. For the angle-angle diagram of a perfectly symmetric gait 1) the area within the curve is zero, 2) its orientation is 45o and 3) the magnitude of its minimum geometric moment is zero. Let us recognize certain geometric characteristics of the bilateral cyclograms. Cyclograms are not continuous curves but are polyline contours or simply irregular polygons. The smoothness of the contour is a function of the amount of noise in the overall data registration system. One should filter the data before its geometric features are computed. Finally, the cyclograms may consist of self-intersecting loops,
complicating area computation. See Goswami, 1998 for detailed discussion and computation of these shape-related geometric quantities.
Left Knee Right Knee
Left
Kne
e
Right Knee
Synchronization
Figure 1: Construction of a bilateral knee-kneecyclogram: Time-angle plots of the left and rightknee of a normal walk (top row) are used to obtainthis bilateral cyclogram. Since during natural walkthe legs execute approximately “out of phase”motion, the bilateral joint data is time-shifted, asrevealed in the diagram in the middle row. Thebottom row shows the bilateral cyclogram after thetwo knee-angle plots are synchronized (made “in-phase”). A prominent gait event such as the heel-touchdown can be used to synchronize the twoplots. The 45o symmetry line, on which thesynchronized cyclogram should lie for a perfectlysymmetric gait, is shown dotted.
Out of the three features selected above, the area criterion is relatively straightforward. Orientation of a
planar geometric entity is defined as the angle (bounded by +/-90o) between the positive abscissa and the line of least second-order moment. The moments of a planar curve is computed by making a physical analogy of the curve with a thin polygonal wire loop with uniform mass distribution along its length. For example, the orientation of a straight line is along the direction of the line; that of an elliptical contour is along its major axis. A circular contour has no preferable orientation.
Figcycsixsub
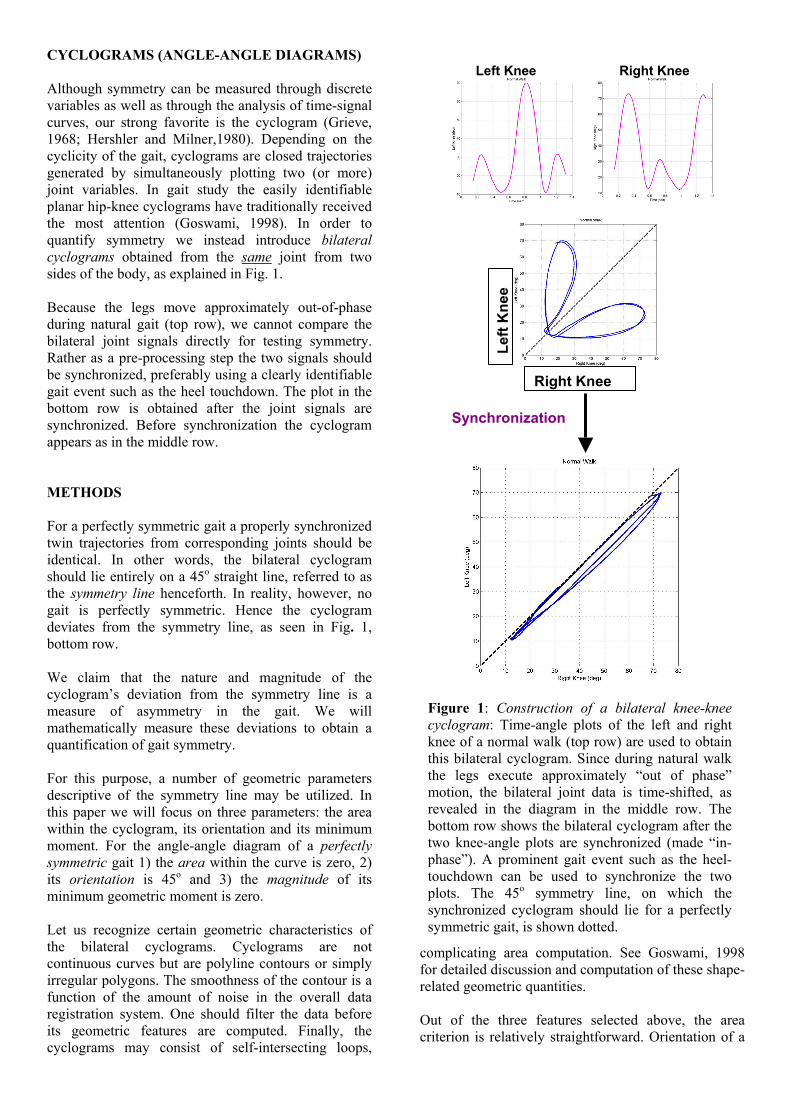
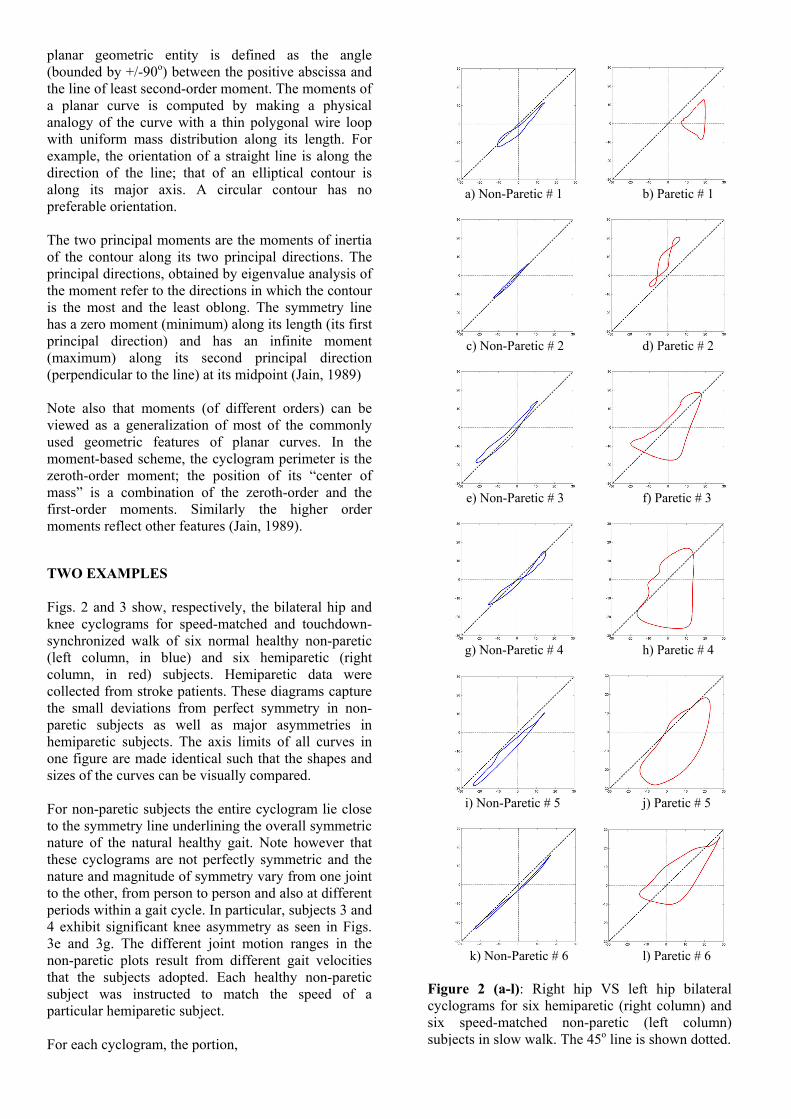
The two principal moments are the moments of inertia of the contour along its two principal directions. The principal directions, obtained by eigenvalue analysis of the moment refer to the directions in which the contour is the most and the least oblong. The symmetry line has a zero moment (minimum) along its length (its first principal direction) and has an infinite moment (maximum) along its second principal direction (perpendicular to the line) at its midpoint (Jain, 1989) Note also that moments (of different orders) can be viewed as a generalization of most of the commonly used geometric features of planar curves. In the moment-based scheme, the cyclogram perimeter is the zeroth-order moment; the position of its “center of mass” is a combination of the zeroth-order and the first-order moments. Similarly the higher order moments reflect other features (Jain, 1989). TWO EXAMPLES Figs. 2 and 3 show, respectively, the bilateral hip and knee cyclograms for speed-matched and touchdown-synchronized walk of six normal healthy non-paretic (left column, in blue) and six hemiparetic (right column, in red) subjects. Hemiparetic data were collected from stroke patients. These diagrams capture the small deviations from perfect symmetry in non-paretic subjects as well as major asymmetries in hemiparetic subjects. The axis limits of all curves in one figure are made identical such that the shapes and sizes of the curves can be visually compared. For non-paretic subjects the entire cyclogram lie close to the symmetry line underlining the overall symmetric nature of the natural healthy gait. Note however that these cyclograms are not perfectly symmetric and the nature and magnitude of symmetry vary from one joint to the other, from person to person and also at different periods within a gait cycle. In particular, subjects 3 and 4 exhibit significant knee asymmetry as seen in Figs. 3e and 3g. The different joint motion ranges in the non-paretic plots result from different gait velocities that the subjects adopted. Each healthy non-paretic subject was instructed to match the speed of a particular hemiparetic subject. For each cyclogram, the portion,
a) Non-Paretic # 1 b) Paretic # 1
c) Non-Paretic # 2 d) Paretic # 2
e) Non-Paretic # 3 f) Paretic # 3
g) Non-Paretic # 4 h) Paretic # 4
i) Non-Paretic # 5 j) Paretic # 5
k) Non-Paretic # 6 l) Paretic # 6
ure 2 (a-l): Right hip VS left hip bilateral lograms for six hemiparetic (right column) and speed-matched non-paretic (left column) jects in slow walk. The 45o line is shown dotted.
- above symmetry line =>
a) Non-Paretic # 1 b) Paretic # 1
c) Non-Paretic # 2 d) Paretic # 2
e) Non-Paretic # 3 f) Paretic # 3
g) Non-Paretic # 4 h) Paretic # 4
i) Non-Paretic # 5 j) Paretic # 5
k) Non-Paretic # 6 l) Paretic # 6
Figure 3 (a-l): Right knee VS left knee bilateralcyclograms for six hemiparetic (right column) and sixspeed-matched non-paretic (left column) subjects inslow walk. The 45o symmetry line is shown dotted.
Left hip (or knee) angle > right hip (or knee) angle
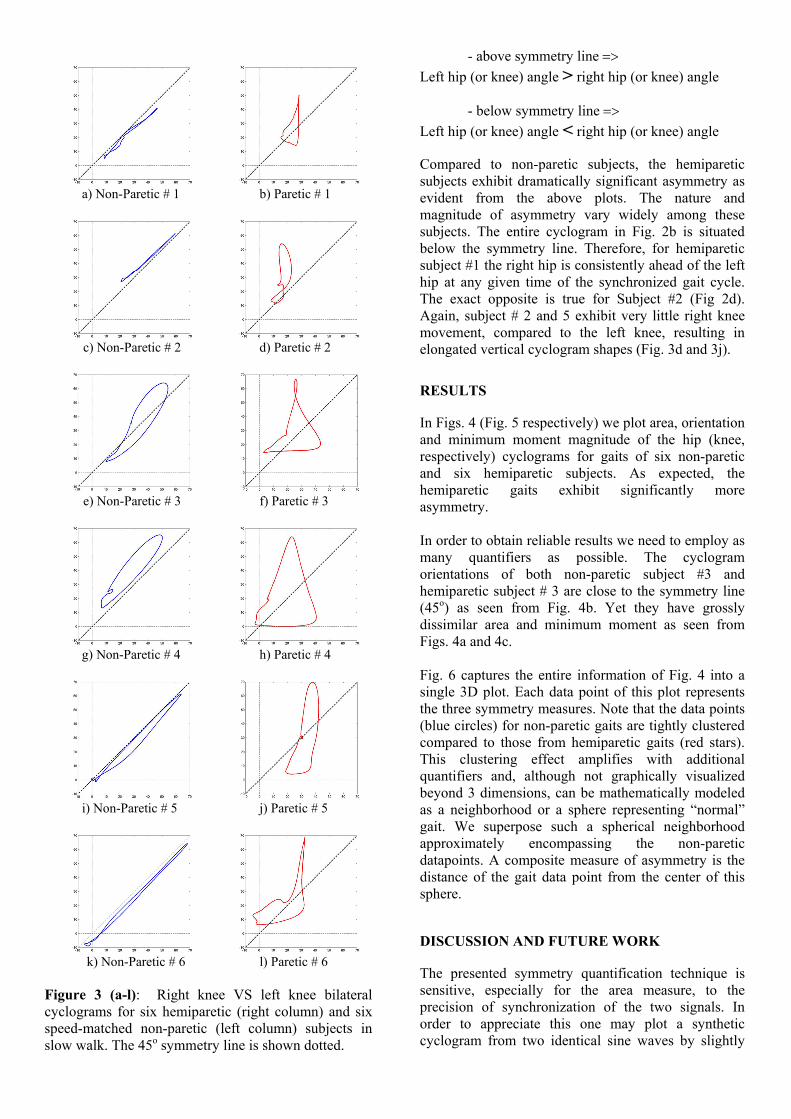
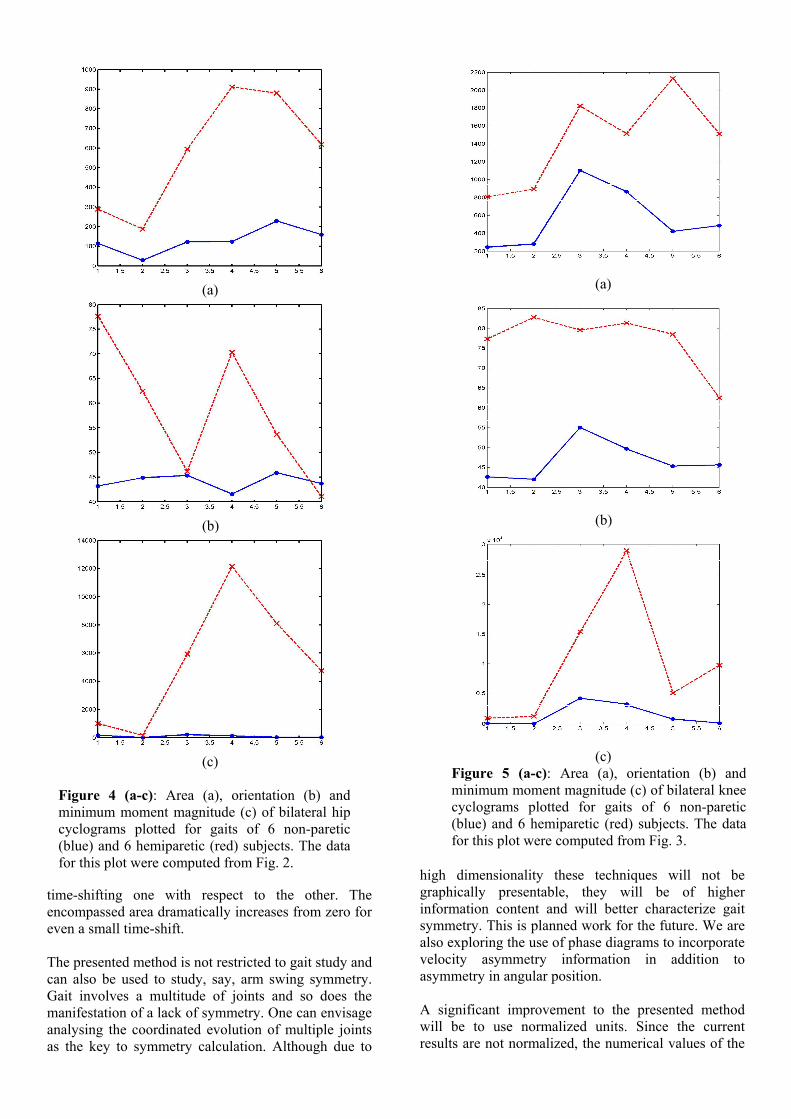
- below symmetry line => Left hip (or knee) angle < right hip (or knee) angle Compared to non-paretic subjects, the hemiparetic subjects exhibit dramatically significant asymmetry as evident from the above plots. The nature and magnitude of asymmetry vary widely among these subjects. The entire cyclogram in Fig. 2b is situated below the symmetry line. Therefore, for hemiparetic subject #1 the right hip is consistently ahead of the left hip at any given time of the synchronized gait cycle. The exact opposite is true for Subject #2 (Fig 2d). Again, subject # 2 and 5 exhibit very little right knee movement, compared to the left knee, resulting in elongated vertical cyclogram shapes (Fig. 3d and 3j). RESULTS In Figs. 4 (Fig. 5 respectively) we plot area, orientation and minimum moment magnitude of the hip (knee, respectively) cyclograms for gaits of six non-paretic and six hemiparetic subjects. As expected, the hemiparetic gaits exhibit significantly more asymmetry. In order to obtain reliable results we need to employ as many quantifiers as possible. The cyclogram orientations of both non-paretic subject #3 and hemiparetic subject # 3 are close to the symmetry line (45o) as seen from Fig. 4b. Yet they have grossly dissimilar area and minimum moment as seen from Figs. 4a and 4c. Fig. 6 captures the entire information of Fig. 4 into a single 3D plot. Each data point of this plot represents the three symmetry measures. Note that the data points (blue circles) for non-paretic gaits are tightly clustered compared to those from hemiparetic gaits (red stars). This clustering effect amplifies with additional quantifiers and, although not graphically visualized beyond 3 dimensions, can be mathematically modeled as a neighborhood or a sphere representing “normal” gait. We superpose such a spherical neighborhood approximately encompassing the non-paretic datapoints. A composite measure of asymmetry is the distance of the gait data point from the center of this sphere. DISCUSSION AND FUTURE WORK The presented symmetry quantification technique is sensitive, especially for the area measure, to the precision of synchronization of the two signals. In order to appreciate this one may plot a synthetic cyclogram from two identical sine waves by slightly
(a)
(b)
(c) Figure 5 (a-c): Area (a), orientation (b) and minimum moment magnitude (c) of bilateral knee cyclograms plotted for gaits of 6 non-paretic (blue) and 6 hemiparetic (red) subjects. The data for this plot were computed from Fig. 3.
time-shifting one with respect to the other. The encompassed area dramatically increases from zero for even a small time-shift. The presented method is not restricted to gait study and can also be used to study, say, arm swing symmetry. Gait involves a multitude of joints and so does the manifestation of a lack of symmetry. One can envisage analysing the coordinated evolution of multiple joints as the key to symmetry calculation. Although due to
high dimensionality these techniques will not be graphically presentable, they will be of higher information content and will better characterize gait symmetry. This is planned work for the future. We are also exploring the use of phase diagrams to incorporate velocity asymmetry information in addition to asymmetry in angular position.
(a)
(b)
(c) Figure 4 (a-c): Area (a), orientation (b) andminimum moment magnitude (c) of bilateral hipcyclograms plotted for gaits of 6 non-paretic(blue) and 6 hemiparetic (red) subjects. The datafor this plot were computed from Fig. 2.
A significant improvement to the presented method will be to use normalized units. Since the current results are not normalized, the numerical values of the
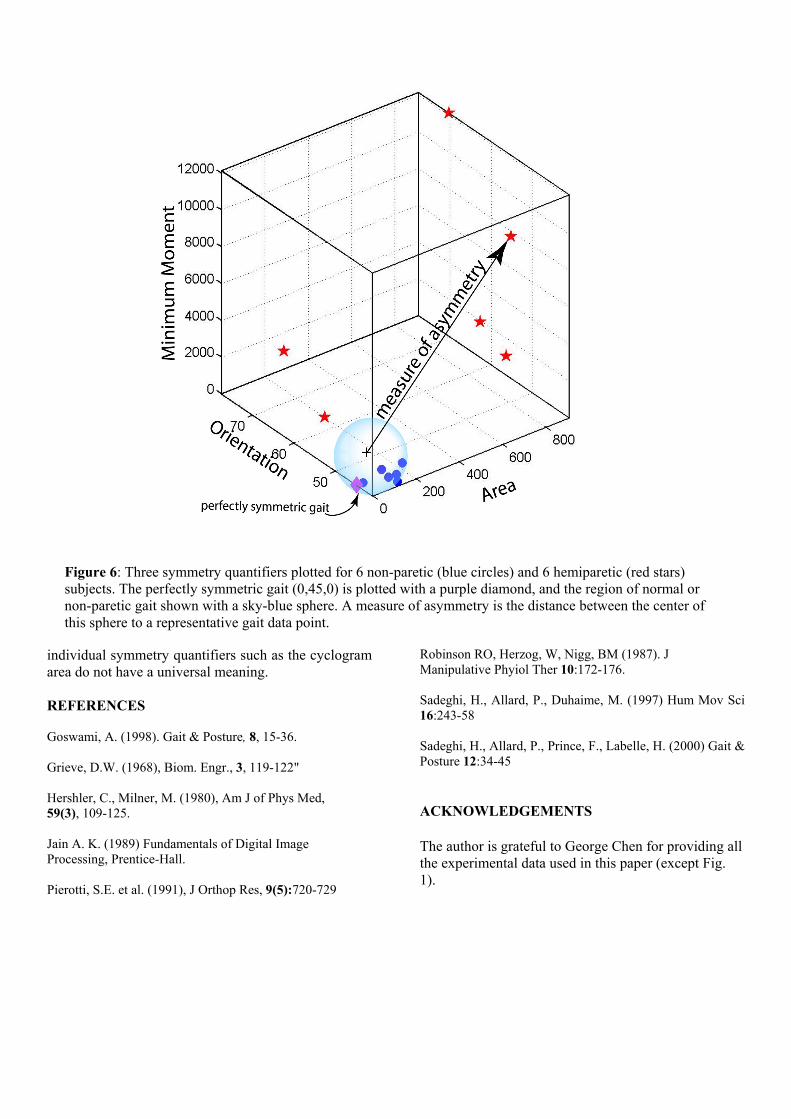
Figure 6: Three symmetry quantifiers plotted for 6 non-paretic (blue circles) and 6 hemiparetic (red stars) subjects. The perfectly symmetric gait (0,45,0) is plotted with a purple diamond, and the region of normal or non-paretic gait shown with a sky-blue sphere. A measure of asymmetry is the distance between the center of this sphere to a representative gait data point.
individual symmetry quantifiers such as the cyclogram area do not have a universal meaning. REFERENCES Goswami, A. (1998). Gait & Posture, 8, 15-36. Grieve, D.W. (1968), Biom. Engr., 3, 119-122" Hershler, C., Milner, M. (1980), Am J of Phys Med, 59(3), 109-125. Jain A. K. (1989) Fundamentals of Digital Image Processing, Prentice-Hall. Pierotti, S.E. et al. (1991), J Orthop Res, 9(5):720-729
Robinson RO, Herzog, W, Nigg, BM (1987). J Manipulative Phyiol Ther 10:172-176. Sadeghi, H., Allard, P., Duhaime, M. (1997) Hum Mov Sci 16:243-58 Sadeghi, H., Allard, P., Prince, F., Labelle, H. (2000) Gait & Posture 12:34-45 ACKNOWLEDGEMENTS The author is grateful to George Chen for providing all the experimental data used in this paper (except Fig. 1).