kiawah island east end erosion and beach restoration · pdf filekiawah island east end erosion...
TRANSCRIPT

KIAWAH ISLAND EAST END EROSION AND BEACH
RESTORATION PROJECT:
SURVEY OF CHANGES IN POTENTIAL MACROINVERTEBRATE
PREY COMMUNITIES IN PIPING PLOVER (Charadrius melodus)
FORAGING HABITATS
FINAL REPORT
Submitted to: Town of Kiawah
Prepared by: Marine Resources Research Institute
Marine Resources Division South Carolina Department of Natural Resources


i
KIAWAH ISLAND EAST END EROSION AND BEACH
RESTORATION PROJECT:
SURVEY OF CHANGES IN POTENTIAL MACROINVERTEBRATE
PREY COMMUNITIES IN PIPING PLOVER (Charadrius melodus)
FORAGING HABITATS
Final Report
Prepared by:
Derk C. Bergquist
Martin Levisen
Leona Forbes
Marine Resources Research Institute Marine Resources Division
South Carolina Department of Natural Resources Post Office Box 12559 Charleston, SC 29422
Submitted to:
Town of Kiawah 21 Beachwalker Drive
Kiawah Island, SC 29455
2011

ii
iii
TABLE OF CONTENTS
EXECUTIVE SUMMARY…………………………………………………………. v BACKGROUND……………………………………………………………………… 1 MATERIALS AND METHODS…………………………………………………….. 4 Study Sites………………………………………………………………………… 4 Study Design……………………………………………………………………… 7 Field and Laboratory Methods……………………………………………………. 7 Data Analysis……………………………………………………………………… 11 RESULTS…………………………………………………………………………….. 13 Habitat Utilization………………………………………………………………… 13 Macroinvertebrate Community…………………………………………………… 14 Macroinvertebrates Identified in Fecal Samples………………………………….. 25 DISCUSSION………………………………………………………………………… 30 Caveats Regarding Impact Detection……………………………………………… 30 Macroinvertebrate Communities in Occupied Piping Plover Foraging Areas…………………………………………………………………………… 30 Macroinvertebrate Communities in Abandoned Foraging Areas…………………. 33 Macroinvertebrate Prey as a Component of Migratory/Overwintering Habitat Quality…………………………………………………………………. 35 CONCLUSIONS AND RECOMMENDATIONS…………………………………… 39 ACKNOWLEDGEMENTS………………………………………………………….. 41 LITERATURE CITED……………………………………………………………….. 43 APPENDICES……………………………………………………………………….. 47 Appendix 1: List of site locations on Kiawah Island and Bird Key……………… 47 Appendix 2: Summary of benthic macroinvertebrate taxa collected on Kiawah Island and Bird Key………………………………………………… 49

iv

v
EXECUTIVE SUMMARY
Modification of ocean shorelines can significantly impact the quality of shorebird
habitat and may pose a serious threat for threatened and endangered shorebirds that use
these areas for migratory stopover and overwintering habitat. In 2006, a lagoon
supporting an overwintering population of piping plovers (Charadrius melodus) was
modified as part of a tidal inlet relocation and beach restoration project on Kiawah Island,
SC, USA. As part of a larger monitoring project, the macroinvertebrate communities
within the project area and a second nearby island were monitored in order to address two
objectives: 1) assess changes in the macroinvertebrate community in piping plover
foraging sites around the Kiawah Island lagoon, 2) determine changes in the
macroinvertebrate community associated with piping plover foraging site abandonment
within the lagoon.
Between April 2006 and April 2011, specific piping plover foraging areas in the
lagoon system on Kiawah Island and on Bird Key, a nearby undeveloped island also used
as piping plover overwintering habitat, were monitored during April/May (“Spring”) and
August/September (“Fall”) each year. At least two sites of active foraging by piping
plovers (occupied sites) were identified through bird surveys. A transect passing through
each site was sampled every season until it was abandoned, at which point it was sampled
one more time. Macroinvertebrates were surveyed by collecting ten randomly-placed
push cores along each transect, sieving the core contents and identifying all invertebrates
under a microscope. Differences in total infaunal, polychaete, amphipod, and mollusk
densities in occupied foraging sites were examined using analysis of variance with island
(Kiawah Island vs. Bird Key), season (Spring vs. Fall) and year as main factors. Changes
in these same measures between a site being occupied and subsequently abandoned were
examined using the same procedure. The same analyses were also performed using only
a subset of macroinvertebrate taxa found in piping plover fecal samples. Differences in
finer-scale taxonomic composition were examined using multivariate statistics.
Due to a late start in the monitoring efforts and unexpected modification of the
intended control island (Bird Key), the necessary controls for a Before-After-Control-
Impact study design were not attainable, and it was not possible to detect impacts to the

vi
macroinvertebrate communities of piping plover foraging areas due to Kiawah Island
East End Erosion and Beach Restoration Project. The data were sufficient to address
study objectives as well as provide substantial information on the kinds of changes that
may influence overwintering/migratory piping plovers in this area. Rates of site
abandonment were similar on both islands and were fairly consistent through time. Early
in the study, most occupied foraging sites were in protected lagoon or back beach habitats
while later in the study, foraging sites were often in exposed active beach and inlet edge
habitats. Overall, there was little evidence the macroinvertebrate communities differed
between islands or sampling seasons or that they changed differently through time at the
two islands. Because both the project area and the intended control area were
anthropogenically modified, this only indicates that no differences were observed
between two human-disturbed systems. The most apparent pattern was a significant shift
from relatively high polychaete densities and low amphipod densities early in the study to
low polychaete densities and high amphipod densities later in the study. As many of the
taxa found in piping plover fecal samples were among those that changed during this
period, the temporal shift in community composition likely affected the diet of migratory
and overwintering piping plovers in this system. The cause of this change is not clear,
but may be partially explained by a change in foraging habitat from more protected to
more exposed habitats. The decreasing trend in polychaete density was accompanied by
a decrease in the number of overwintering piping plovers in the system, suggesting a link
between the two. Abandoned foraging sites supported lower densities of practically all
taxa regardless of island, season or year, and the changes that occurred in association
with site abandonment were very similar to the changes that occurred at occupied feeding
areas over the course of the study. Multivariate analyses showed that many of the taxa
responsible for the temporal changes in community composition of occupied foraging
sites were also responsible for the changes occurring with site abandonment. This
reinforced the hypothesis that changes specific to taxa in the diets of
migratory/overwintering piping plovers were occurring both within individual foraging
sites leading to subsequent abandonment and within the larger Kiawah Island/Bird Key
system, perhaps leading to declines in the overwintering population. The quantity and
quality of prey are often critical during the energetically demanding process of foraging
and migration. The data presented here suggests that larger, errant polychaetes such as

vii
the families Nereididae, Glyceridae and Oenonidae may be particularly important to
piping plover overwintering in this region. Consequently, habitat changes, whether
natural or anthropogenic in origin, that affect polychaete densities may also affect
overwintering populations of the piping plover.

viii

1
INTRODUCTION
Coastal habitats experience a wide range of anthropogenic impacts stemming
from the need to protect human infrastructure in areas facing chronic or storm-induced
erosion. “Soft” engineering solutions such as inlet dredging and beach nourishment have
become the preferred methods over “hard” solutions (seawalls, groins, revetments, etc.)
for countering erosion as soft solutions are typically less expensive and considered lower-
impact. Although substantial data have been advanced to support a relatively low impact
of soft solutions (e.g. Wilber et al. 2003; NRC 1995), the assumption that these solutions
are benign has come under increasing scrutiny (Peterson and Bishop 2005; Speybroeck et
al. 2006; Defeo et al. 2007). In fact, a recent study found that physical habitat changes
following one kind of soft solution, beach nourishment, may be associated with changes
in infaunal macroinvertebrate distributions and subsequent reductions in shorebird
utilization of the affected habitat (Peterson et al. 2006). The ubiquity of impacts of
anthropogenic coastal modification to shorebirds is not currently known, but where beach
systems support threatened and endangered shorebirds, physical and biological habitat
impacts could prove a serious obstacle to species recovery.
Ocean shorelines of the southeastern U.S. form an important part of the
overwintering range for the threatened/endangered shorebird, the piping plover
(Charadrius melodus) (USFWS 2009). Piping plovers form three primary distinct
breeding populations, Atlantic, Great Lakes, and Great Plains (USFWS 1985). While
migrants from all three breeding populations will use habitats in the southeast,
individuals from the Great Lakes and Great Plains populations comprise the greatest
proportion of the birds overwintering in this region. In fact, coastal habitats in the
southeastern US may host approximately 75% of the Great Lakes population, the smallest
and most at-risk of the three populations and the only population to be listed as
endangered on the breeding grounds (USFWS 1985; USFWS 2001; Gratto-Trevor et al.
2009). Consequently, of the entire piping plover wintering range, impacts to
overwintering habitats in this region could have the severe effects on the persistence of
this endangered population.
2
For migratory birds, conditions on overwintering habitats can be critically
important for long-term survival and population growth and, for many, may be more
important than conditions on their breeding grounds (Sherry and Holmes 1996; Marra et
al. 1998; Webster et al. 2002; Norris et al. 2003). This is particularly true of piping
plovers which spend up to ten months migrating and overwintering and spend up to eight
of those months as overwintering residents (Haig and Oring 1985; Nicholls and
Baldassarre 1990). While overwintering, piping plovers divide time between roosting
and foraging, with a majority of that time spent foraging (Nichols and Baldassarre 1990;
Maddock et al. 2009). Overwintering foraging activity occurs almost entirely in
intertidal coastal habitats including tidal sand and sandy-mud flats, spits, overwash areas,
lagoons, coastal ponds and inlet-associated shoals and sandbars (Harrington 2008;
Nichols and Baldassarre 1990). The primary dietary prey include infaunal and epifaunal
marine invertebrates such as polychaete worms, crustaceans and bivalve mollusks as well
as occasional insects (Nichols 1989; Zonick and Ryan 1996). Because piping plovers
display a strong site fidelity both within and between overwintering seasons (Drake et al.
2001; Stucker et al. 2010), disruption of the physical and biological characteristics of
overwintering areas could have substantial long-lasting impacts on their remaining
populations.
Disturbance, modification and loss of coastal habitats can negatively affect habitat
use, survival, condition and reproductive success of migrant and overwintering shorebirds
(Myers 1983; Sutherland 1996; Durell et al. 1997; West 2003; McLuskey et al. 1992;
Foster et al. 2009; Convertino et al. 2011). In some cases, habitat losses and subsequent
shorebird impacts have been associated with coincident losses in invertebrate biomass
and density (McLuskey et al. 1992), but explicit linkages between these responses can be
very hard to quantify using field data. However, numerous modeling studies have
suggested that loss or reductions in the densities of specific prey items can adversely
affect the survival of a wide range of foraging shorebirds (Goss-Custard 1995; Stillman et
a. 2005; West et al. 2007). Of the few direct studies of relationships between piping
plover habitat use and coastal land impacts, Lott (2009) found a strong negative
correlation between beach nourishment projects and the presence of non-breeding piping
plovers on the west coast of Florida. Also along the Florida Gulf coast, Convertino et al.
(2011) found that habitats that had experienced renourishment were 3.1 times more likely

3
to not be used as overwintering habitat by piping plovers compared to habitats that had
not been renourished. Very little direct evidence is available to determine the potential
consequences of the loss or modification of overwintering habitat for piping plovers or
the relationships between habitat modification, invertebrate prey communities and piping
plover overwintering behavior.
Many beach-associated systems in South Carolina are either routinely or
episodically modified via nourishment, inlet relocation, and groin construction to reduce
or compensate for erosion. In 2006, ongoing shoreline erosion on the eastern end of
Kiawah Island had removed close to 100m of dunes along the Oceans Golf Course and
threatened existing infrastructure in the area. To protect infrastructure and benefit
recreational and commercial use of these beaches, the Kiawah Island East End Erosion
and Beach Restoration Project (for brevity, hereafter referred to as the Kiawah Erosion
Project) was performed with the goal of preventing further erosion and reversing the
erosion that had occurred (CSE 2007). Prior to the Kiawah Erosion Project, the east end
of Kiawah Island hosted a large intertidal-subtidal lagoon that exchanged tidally with the
Atlantic Ocean through a narrow channel on the lagoon’s west end. The erosion had
occurred in association with tidal flushing through this channel. The Kiawah Erosion
Project filled the channel and constructed a series of dunes using ~550,000 cy of sand
excavated from intertidal shoals along the seaward edge of the dunes separating the
lagoon from the ocean. A new channel was then excavated at the east end of the lagoon
near the Stono River tidal inlet. While the project was expected to benefit human use of
the area, numerous concerns persisted regarding impacts to a large number of shorebirds
that utilized the lagoon for roosting and foraging, including an overwintering population
of the threatened/endangered piping plover.
The purpose of the effort reported here was to determine whether the
macroinfaunal community in piping plover foraging habitat showed evidence of changing
following the Kiawah Erosion Project. This study was conducted as one component of a
larger series of studies that also included aerial photograph mosaics, habitat classification
maps, and bird count surveys within and around the lagoon. The prey surveys sought to
address two objectives: 1) assess changes in the macroinvertebrate community in piping
plover foraging sites around the Kiawah Island lagoon, 2) determine changes in the
macroinvertebrate community associated with piping plover foraging site abandonment

4
within the lagoon. The study addressed these objectives by examining the invertebrate
communities in active and abandoned piping plover foraging sites both in the lagoon at
Kiawah Island and on a reference area, Bird Key.
METHODS
Study Sites
The long axis of Kiawah Island is oriented roughly east-west at its east end and is
bounded to the north by the Kiawah River, the northeast and east by the Stono River and
the southeast and south by the Atlantic Ocean (Figure 1). The lagoon that forms the
primary study area was formed by sand that migrated onshore from the south and east,
attached to the shore and slowly formed an enclosing arc (CSE 2007). At the time of the
present study, the lagoon consisted of a range of different habitat types including
vegetated dunes, salt marsh (Spartina alterniflora), and both intertidal and subtidal sand
flats and mudflats. The sand bar separating the lagoon from the ocean was largely
supralittoral although parts of it were overwashed during spring high tides. Over the
course of this study, the location and morphology of the tidal exchange channel between
the lagoon and Atlantic Ocean changed substantially. During the summer 2006, the
Kiawah Erosion Project moved the channel from the west end to the east end of the
lagoon, but the channel did not remain at that location (Figure 2A,B). By the spring
2007, the new channel at the east end of the lagoon had largely closed and a new channel
breached the overwash habitat between the lagoon and the ocean near the center of the
lagoon (Figure 2C). This channel increased in sinuosity and slowly migrated west over
the next four years, and a second channel breached the lagoon to the east of the first
channel in 2010. The lagoon and surrounding environs proved a dynamic environment
that changed in numerous ways during the study. Most notably, salt marsh encroached
into previously unvegetated portions of the lagoon and a sand bar moved onshore at the
eastern corner of the lagoon creating large intertidal sandflats along the Atlantic
shoreline.
Nearby Bird Key is also known as an overwintering habitat for piping plovers.
The Bird Key study area is the largest and most distal feature within the Skimmer Flats
complex located between Folly Island and Kiawah Island and near the intersection of the

5
Folly and Stono Rivers (Figure 1). Although this area is commonly known as Bird Key,
the island historically referred to as Bird Key was located further west and south (closer
to Kiawah) and dissappeared following the dredging of the Folly River in 1993. The
“new” Bird Key consisted of many of the same habitat types as the Kiawah Island
lagoon. The landward side of the island along the Folly River was dominated by
intertidal and subtidal sand flats and mudflats. Early in the project, salt marsh was
present on the landward side but was not particularly pervasive; by the end of the study,
this part of the island had transitioned to primarily salt marsh habitat. The active beach
Figure 1. Map showing location of the lagoon on the east end of Kiawah Island and the reference island, Bird Key.

6
Figure 2. Maps showing major events in the evolution of the lagoon on Kiawah Island’s east end A) prior to inlet relocation, B) immediately following inlet relocation, and C) one year following inlet relocation. The white arrow indicates the location of the primary lagoon inlet during each time.
7
habitats along the seaward and Stono River sides of the island also accumulated
substantial volumes of sand and transitioned to extensive intertidal sand flats during the
study period. Bird Key was intended to provide an undisturbed control site with which to
compare any changes occurring at Kiawah Island. However, Bird Key was modified
unexpectedly when the US Army Corps of Engineers placed sand onto Bird Key in 2006
as part of a beneficial re-use of dredge material to increase bird habitat in the area. This
sand was placed on the Atlantic shoreface of Bird Key, but some overwashed into the
small lagoon on the Folly River side of the island.
Study Design
Due to short notice, applicability of a Before-After Control-Impact (BACI) study
design was limited. Both areas were sampled twice during each year: once during spring
migration from the overwintering grounds to the nesting grounds (late-March/early-April,
referred to here as the “spring” season), and once during the summer/fall migration from
the nesting grounds to the overwintering grounds (late-August/early-September, referred
to here as the “fall” season). Because project construction occurred during the summer of
2006 and the earliest monitoring could begin was spring 2006, pre-project sampling
involved only a single event (spring 2006). No pre-project fall sampling was possible.
Unexpected modification of the control area (Bird Key) further prevented even a more
simplified comparison of the impacted area to a non-impacted control area.
Consequently, the study areas will not be referred to as control and impact but simply as
Bird Key and Kiawah Island, respectively. Because long-term changes may be expected
as new erosion and accretion patterns become established, both study areas were sampled
during the spring and fall seasons for five years post-project (2006-2011).
Field and Laboratory Methods
Based on observations by Town of Kiawah and USFWS biologists, the piping
plovers in the study sites fed primarily at low tide and appeared to forage consistently in
small, spatially-discreet areas at each site. Prior to the start of sampling for this study,
foraging activity occurred on exposed yet saturated sand flats and along steeper emersed
shores near the water’s edge (pers. comm., J. Jordan and M. Bimbi). The rather small
8
size of the foraging sites relative to the overall size of the lagoon on Kiawah suggested
that a random sampling pattern within the entire lagoon habitat would require an
unfeasibly large number of samples to adequately characterize and detect changes in
those areas where the plovers foraged. To overcome this challenge, the decision was
made to identify specific foraging sites using routine bird count surveys then sample
those sites while being actively foraged by plovers (hereafter “occupied”) and until the
first sampling season after the plovers ceased foraging at the site (hereafter
“abandoned”). No study sites remained occupied for more than three consecutive
seasons, and no abandoned sites were ever re-occupied. The result was that a study site
was sampled at least twice (first season when occupied and first season when
abandoned). This allowed the identification of potential changes or difference in the
types of communities being foraged (comparison of occupied sites through time and
between islands) and of potential changes in communities following abandonment of a
previous foraging site.
In each season, specific foraging sites at each location were identified by
monitoring studies performed by the Town of Kiawah and USFWS. On Kiawah Island,
bird count surveys were performed weekly during the migratory period and monthly
during the overwintering period as part of the larger monitoring program for the project.
The Town of Kiawah biologists performing the surveys noted those areas being used
most regularly for foraging and, in later study periods, whether those areas continued to
be used by at least one piping plover. The former identified candidates for “occupied”
foraging sites, and the latter identified whether previous foraging areas had become
“abandoned”. Because the larger monitoring plan did not require bird count surveys be
performed anywhere but on Kiawah Island, similar surveys were not performed on Bird
Key. Independent surveys of Bird Key were further complicated by boat-only access to
that area. Consequently, bird count surveys were only conducted twice during each
sampling season on Bird Key: once in the week leading up to invertebrate sampling and
once on the day invertebrate sampling occurred. These surveys were performed by
SCDNR and/or USFWS personnel. The only exception was between 2007 and 2009
when USFWS had contracted monthly surveys of all plover overwintering grounds
(Maddock et al. 2009). Regardless, identification of occupied and abandoned foraging
sites on Bird Key were based on surveys with a lower temporal resolution.

9
During the first sampling period (spring 2006), two active foraging sites at each of
Kiawah and Bird Key were sampled. In the fall 2006 sampling season, the same
transects were sampled and identified as occupied or abandoned. For each site that had
been abandoned, a new occupied site was identified and sampled. This pattern continued
throughout the study, ensuring that at least two active foraging sites were sampled on
each island during each sampling time (Table 1). Additionally up to two abandoned
foraging sites were sampled on each island during each later sampling period. In a few
instances, at the time sampling was performed, plovers were observed foraging at a site
not noted during bird count surveys; this site was sometimes also sampled as it
represented a site of active current foraging.
Each foraging site was sampled by walking a transect across the site and counting
the number of paces required to cross it. A random number table was then used to choose
ten random points along the transect based on the number of paces (Figure 3). At each
random point, actual sample locations were determined by randomly walking between
zero and five paces perpendicular to the transect (Figure 3). On sloped surfaces, transects
were walked along the water’s edge and sample locations were walked upslope. On flat
surfaces, transects crossed through the center of a feeding area and sample locations were
placed on a single randomly-chosen side of the transect. At each of the ten sample
locations, a 7.62 cm diameter PVC push core, referred to as the “benthic core”, was
inserted to a depth of 20 cm to collect infaunal macroinvertebrates, and the contents were
placed in a cloth bag for later processing. A second core (3.5 cm diameter), referred to as
the “sediment” core, was inserted beside the larger core for potential later determination
Figure 3. Layout of sampling positions along transects through foraging habitats. Note the scale perpendicular to the transect is enlarged for purposes of illustration.
10
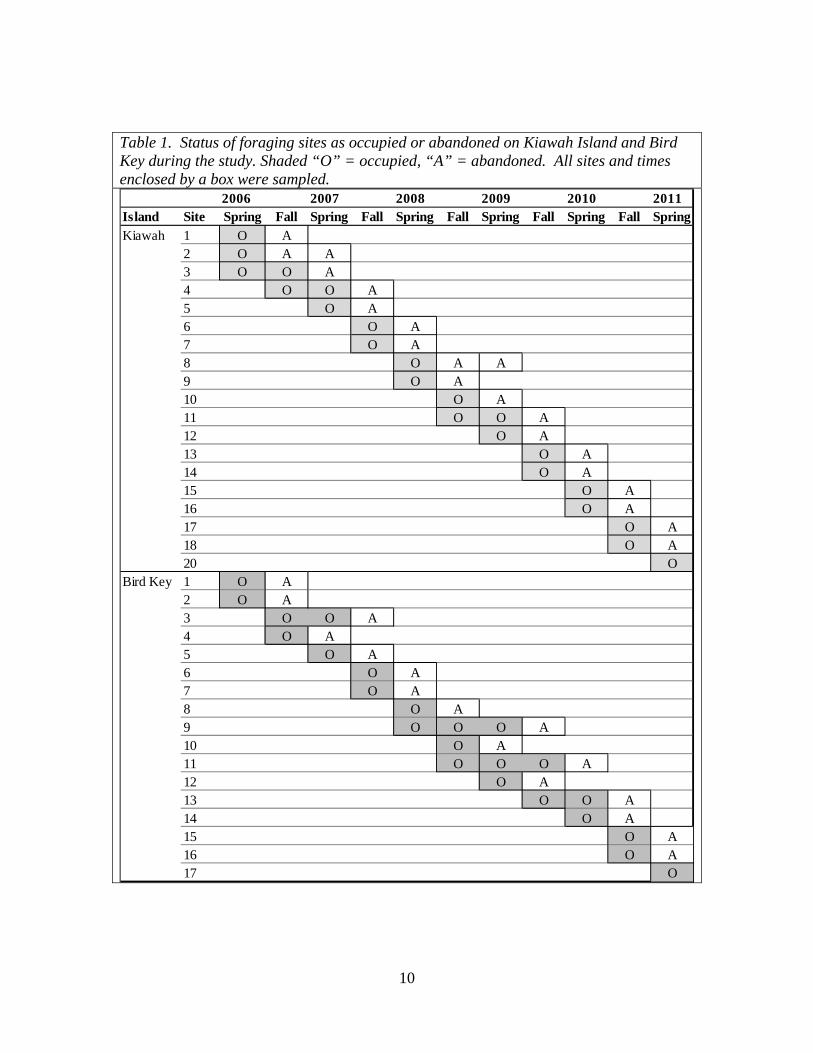
Table 1. Status of foraging sites as occupied or abandoned on Kiawah Island and Bird Key during the study. Shaded “O” = occupied, “A” = abandoned. All sites and times enclosed by a box were sampled.
2006 2007 2008 2009 2010 2011Island Site Spring Fall Spring Fall Spring Fall Spring Fall Spring Fall SpringKiawah 1 O A
2 O A A3 O O A4 O O A5 O A6 O A7 O A8 O A A9 O A10 O A11 O O A12 O A13 O A14 O A15 O A16 O A17 O A18 O A20 O
Bird Key 1 O A2 O A3 O O A4 O A5 O A6 O A7 O A8 O A9 O O O A10 O A11 O O O A12 O A13 O O A14 O A15 O A16 O A17 O

11
of sediment characteristics. Determination of sediment characteristics was not part of the
original scope of work for the project, but these samples were collected in case large
changes in invertebrate community structure were detected and the opportunity arose to
process the samples.
Benthic core samples were washed through a 0.5 mm sieve to retain all infaunal
macroinvertebrates. Organisms and sediment retained on the sieve were preserved in a
buffered solution of 10% formalin/seawater containing rose bengal stain. Benthic
organisms were sorted from retained material under a magnifying lens, and each
individual specimen was identified to the lowest possible taxonomic level under
dissecting and compound microscopes. All subsequent analyses excluded meiofaunal
species (such as nematodes and copepods that are not well quantified using a 0.5 mm
sieve). Organisms which could not be identified to species level due to damage were
merged with those that could be identified to species to avoid overestimating the total
number of species (e.g. Prionospio sp. included Prionospio that could be identified to
species) unless the damaged organism was clearly representing a unique taxon. A
voucher collection of representative specimens of each taxon was created for the project
and maintained by the Environmental Research Section at the SCDNR Marine Resources
Research Institute (Charleston, SC).
Data Analysis
Total macroinvertebrate density, polychaete density, amphipod density, and
mollusk density (the dominant faunal taxa) were calculated for each core and
quantitatively compared amongst seasons, control and impact sites, and occupied and
abandoned feeding areas. The data were subdivided into a series of data subsets and
general linear models were used to make several specific comparisons.
Objective 1 of this study was to assess changes the macroinvertebrate community
in occupied foraging habitats. To address this objective, the dataset was limited to only
occupied sites on Kiawah Island and Bird Key and examined using Analysis of Variance
(ANOVA) with Island (Bird Key vs. Kiawah), Season (Spring vs. Fall) and Year as the
main factors. The interaction terms Island X Season and Island X Year were also
included in order to determine whether the islands were changing differently through
time. A nested analysis (site nested within Island) could not be performed using
12
individual sample data, because an abundance of zero values in individual samples (push
cores) for most measures caused uncorrectable heteroscedasticity. Instead, densities in
the ten individual samples collected along each transect were averaged and statistical
comparisons were performed using those averages.
Objective 2 of this study was to determine whether macroinvertebrate
communities changed between the time when forging habitats were occupied and later
abandoned by piping plovers. To examine this statistically, the sample average (average
of ten cores along the transect) of the last occupied season for each site was subtracted
from the subsequent sample average of the site once abandoned. This produced a
difference value that would be negative if the measure decreased between being occupied
and abandoned or positive if the measure increased between being occupied and
abandoned. These differences were then analyzed using ANOVA with Island,
Abandonment Season (whether the site went from occupied to abandoned during the fall
to spring or spring to fall period), and Abandonment Year (the year in which the site was
abandoned) as main factors. The interaction terms Island X Abandonment Season and
Island X Abandonment Year were also included.
In a recent study, piping plover fecal samples were collected on Bird Key and
Harbor Island (another overwintering area in South Carolina) and examined under a
microscope for refractory materials that may indicate invertebrate taxa consumed by
piping plovers in this area (USFWS, unpublished data). The dominant recognizable
components in these samples were various polychaete parts (setae, acicula and jaws),
primarily from the large, errant genera Nereididae, Glyceridae, and Oenonidae (formerly
Arabellidae), which were found in eight of twelve fecal samples at Bird Key and five of
six fecal samples from Harbor Island. The remaining recognizable marine invertebrate
parts belonged to crustaceans (primarily exoskeletal parts of Haustoriid amphipods) and
molluscan shell fragments (mostly of the small intertidal bivalve Donax spp. and one
piece of a gastropod potentially belonging to the genus Assiminea). With the exception
of the gastropod, all of these taxa were also found in the push cores collected in piping
plover foraging areas on Kiawah Island and Bird Key. In order to focus on more
probable food items, additional analyses were performed on groupings of the taxa found
in fecal samples: 1) “consumed polychaetes”--the sum of the polychaetes belonging to
the families Neriididae, Glyceridae, and Oenonidae, 2) “consumed amphipods”--sum of

13
amphipods in the family Haustoriidae, 3) “consumed molluscs”--sum of molluscs in the
genus Donax, and 4) “total consumed fauna”--the sum of 1, 2 and 3 representing all
primary marine macroinvertebrates found in the fecal samples. These four groups were
analyzed following the same procedures described above.
Multivariate analysis of the macroinvertebrate communities was performed using
Primer v6.1.9 software (Clarke and Gorley 2006). The average density of each taxon was
calculated for each transect during each sampling time period for a total of 46 occupied
and 33 abandoned transects/sites. Bray-Curtis similarities were calculated among all
pairs of sites following a fourth-root transformation of taxon densities to improve
normality. Analysis of Similarities (ANOSIM) was used to determine if community
composition varied significantly between occupied and abandoned foraging sites overall.
Similarity Percentages (SIMPER) was used to determine the taxa most responsible for the
dissimilarities between occupied and abandoned sites. The species matrix was then
reduced to include only occupied sites. Because of the large number of factor levels
relative to the overall sample size, hypothesis testing under a full model involving Island,
Year, and Season was not possible, instead an exploratory analysis of the data structure
was undertaken. First, hierarchical clustering was performed using the CLUSTER
routine and the significance of different clusters were tested using similarity profile
permutation tests (SIMPROF). The significant clusters were overlaid on an MDS
ordination plot and SIMPER was used to identify which taxa were most responsible for
the between-cluster dissimilarity.
RESULTS
Habitat Utilization
On both Kiawah Island and Bird Key, piping plovers tended to abandon foraging
sites between sampling seasons (Figure 4). Piping plovers abandoned 81% and re-
occupied only 19% of sampled foraging sites between seasons, while on Bird Key piping
plovers abandoned 73% and re-occupied 27% of sites between seasons (Figure 4).
Foraging site abandonment occurred throughout the study, and incidence of abandonment
did not show a tendency to increase or decrease through time on either island (Figure 4).
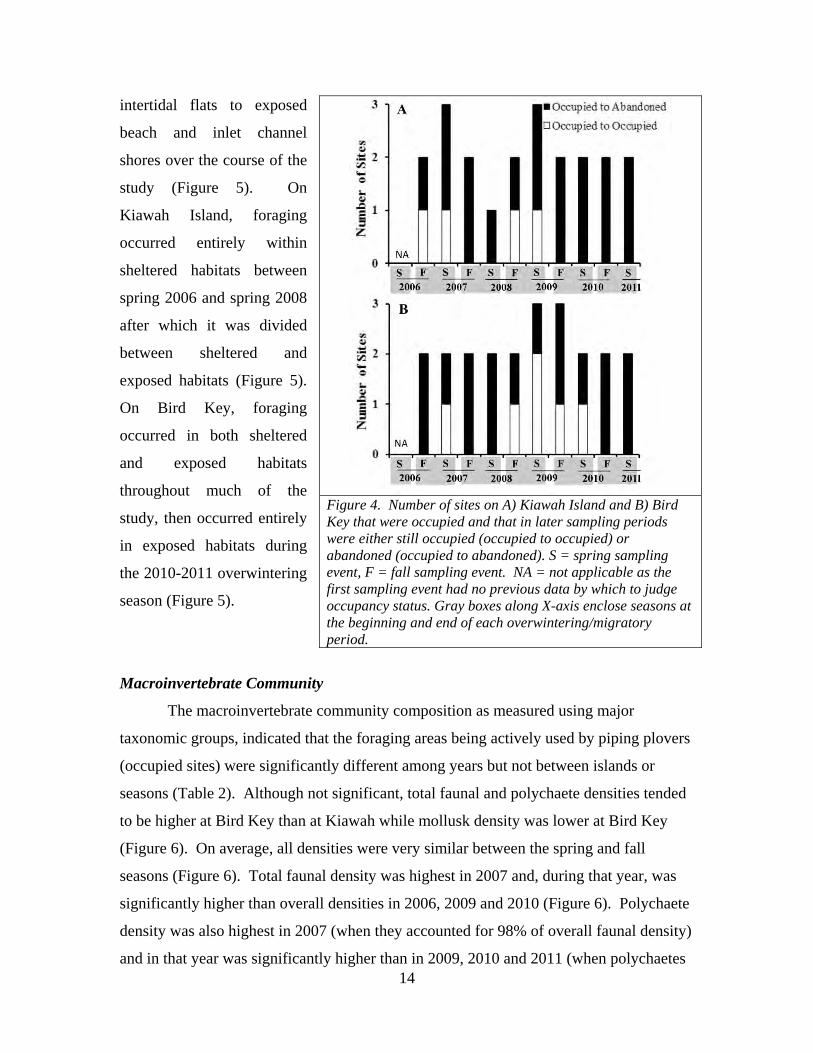
Piping plover foraging activity showed evidence of shifting from primarily sheltered
14
intertidal flats to exposed
beach and inlet channel
shores over the course of the
study (Figure 5). On
Kiawah Island, foraging
occurred entirely within
sheltered habitats between
spring 2006 and spring 2008
after which it was divided
between sheltered and
exposed habitats (Figure 5).
On Bird Key, foraging
occurred in both sheltered
and exposed habitats
throughout much of the
study, then occurred entirely
in exposed habitats during
the 2010-2011 overwintering
season (Figure 5).
Macroinvertebrate Community
The macroinvertebrate community composition as measured using major
taxonomic groups, indicated that the foraging areas being actively used by piping plovers
(occupied sites) were significantly different among years but not between islands or
seasons (Table 2). Although not significant, total faunal and polychaete densities tended
to be higher at Bird Key than at Kiawah while mollusk density was lower at Bird Key
(Figure 6). On average, all densities were very similar between the spring and fall
seasons (Figure 6). Total faunal density was highest in 2007 and, during that year, was
significantly higher than overall densities in 2006, 2009 and 2010 (Figure 6). Polychaete
density was also highest in 2007 (when they accounted for 98% of overall faunal density)
and in that year was significantly higher than in 2009, 2010 and 2011 (when polychaetes
Figure 4. Number of sites on A) Kiawah Island and B) Bird Key that were occupied and that in later sampling periods were either still occupied (occupied to occupied) or abandoned (occupied to abandoned). S = spring sampling event, F = fall sampling event. NA = not applicable as the first sampling event had no previous data by which to judge occupancy status. Gray boxes along X-axis enclose seasons at the beginning and end of each overwintering/migratory period.

15
only accounted for 15-54%
of overall faunal density).
Both total faunal and
polychaete densities
decreased from 2007 to 2011
in occupied foraging sites.
Amphipod density and
mollusk density also varied
significantly among years,
but these measures were
lowest in 2006 and 2007 and
increased later in the study
with amphipod density
peaking in 2011 and mollusk
density peaking in 2010
(Table 2; Figure 6).
Transects through occupied
foraging sites on both islands
exhibited a similar pattern of
variation through time with both islands having peak abundances of total fauna densities
and polychaete densities between fall of 2006 and spring 2008 and peak amphipod and
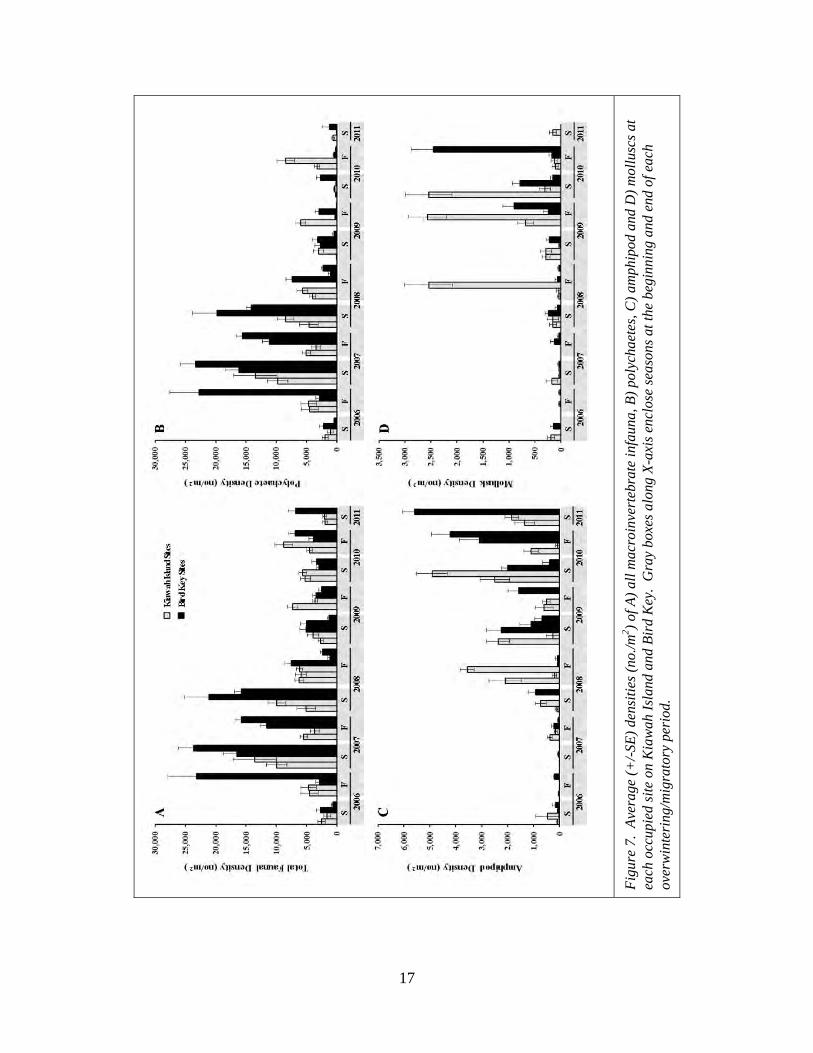
mollusk densities later in the study (Figure 7).
Table 2. Results (p-values) of ANOVAs examining differences in macroinvertebrate communities of occupied foraging habitats. The factors in the models included Island (Kiawah vs. Bird Key), Season (Fall vs. Spring) and Year (2006-2011). Source All Fauna Polychaetes Amphipods Molluscs Island 0.499 0.345 0.515 0.362 Season 0.259 0.801 0.735 0.831 Island X Season 0.227 0.354 0.672 0.330 Year <0.001 0.002 <0.001 0.002 Island X Year 0.122 0.681 0.182 0.405
Figure 5. Number of sampled occupied sites on A) Kiawah Island and B) Bird Key that were in sheltered (lagoon or protected flat) or exposed (active beach or river inlet) habitats. S = spring sampling event, F = fall sampling event. Gray boxes along X-axis enclose seasons at the beginning and end of each overwintering/migratory period.

16
Figure 6. Average (+/-SE) densities (no./m2) of all macroinvertebrate infauna and major taxonomic groups at occupied sites by A-D) island (Kiawah or Bird Key), E-H) season (Fall or Spring), and I-L) year. Replicate cores were averaged within each transect and transects within each island, season and year were averaged prior to calculating the averages shown.
17
Fig
ure
7. A
vera
ge (
+/-
SE)
dens
itie
s (n
o./m
2 ) of
A)
all m
acro
inve
rteb
rate
infa
una,
B)
poly
chae
tes,
C)
amph
ipod
and
D)
mol
lusc
s at
ea
ch o
ccup
ied
site
on
Kia
wah
Isl
and
and
Bir
d K
ey.
Gra
y bo
xes
alon
g X
-axi
s en
clos
e se
ason
s at
the
begi
nnin
g an
d en
d of
eac
h ov
erw
inte
ring
/mig
rato
ry p
erio
d.

18
Piping plover foraging areas generally hosted substantially lower overall
macroinvertebrate densities and densities of major macroinvertebrate taxa when
abandoned than when occupied (negative values for “density when abandoned minus
density when occupied”) (Figure 8). These changes were strongest for total faunal
density, polychaete density and amphipod density and weakest for mollusk density
(Figure 8). The changes in densities associated with abandonment were not significantly
different between the two islands but tended to be slightly more negative at Bird Key
than at Kiawah Island (Table 3; Figure 9A-D). The changes were significantly different
between seasons in which abandonment occurred for total macroinvertebrate density and
polychaete density, but not for amphipod and mollusk densities (Table 3). Foraging sites
occupied in the spring and abandoned in the fall experienced greater decreases in total
macroinvertebrate densities and polychaete densities than foraging sites occupied in the
fall and abandoned in the spring (Figure 9E-H). Total macroinvertebrate density,
polychaete density and amphipod density varied significantly by year in which
abandonment occurred, but mollusk density did not (Table 3). The most substantial
changes occurred coincident with periods in which densities were greatest. For example,
total macroinvertebrate density and polychaete density were highest in occupied foraging
sites in 2007, and the greatest decreases in these densities associated with abandonment
subsequently occurred in 2007 and 2008 (Figure 9I,J). Amphipod densities were greatest
during the last couple of years of the study and the greatest decreases in densities of this
Table 3. Results of ANOVAs (p-values) examining the effects of Island (Kiawah vs. Bird Key), Season (Fall vs. Spring) and Year (2006-2011) on the change in foraging habitat macroinvertebrate communities following abandonment. Source All Fauna Polychaetes Amphipods Mollusks Island 0.926 0.855 0.157 0.287 Season of Abandonment 0.005 0.023 0.134 0.565 Island X Season 0.075 0.167 0.305 0.198 Year of Abandonment 0.005 0.014 0.017 0.241 Island X Year 0.087 0.147 0.039 0.371

19
Fig
ure
8. C
hang
es in
the
aver
age
dens
itie
s ((
no./m
2 ) ;
+/-
poo
led
SE)
of A
) al
l mac
roin
vert
ebra
te in
faun
a, B
) po
lych
aete
s, C
) am
phip
od a
nd D
) m
ollu
sks
foll
owin
g ab
ando
nmen
t of e
ach
occu
pied
sit
e on
Kia
wah
Isl
and
and
Bir
d K
ey.
Gra
y bo
xes
alon
g X
-axi
s en
clos
e se
ason
s at
the
begi
nnin
g an
d en
d of
eac
h ov
erw
inte
ring
/mig
rato
ry p
erio
d.

20
Figure 9. Average (+/-SE) changes in densities (no./m2) of all macroinvertebrate infauna and major taxonomic groups at occupied sites by A-D) island (Kiawah or Bird Key), E-H) season (Fall or Spring), and I-L) year following abandonment of occupied foraging sites. Replicate cores were averaged within each transect, the differences were calculated between the last occupied season and the subsequent abandoned season then then the site differences averaged within each island, season and year prior to calculating the averages shown.

21
taxon occurred during those latter periods (Figure 9K). Decreases in mollusk densities
were also greatest during the latter years of the study, but this was not a significant
temporal trend (Table 3; Figure 9K). In general, changes associated with abandonment
were similar through time on both islands (no significant Island X Year interaction in
Table 3), although amphipod densities were an exception, due to differences occurring in
2010 and 2011 when foraging areas occurred primarily in exposed habitats (Figure 8C).
Multivariate ANOSIM comparing changes in community composition between
occupied and abandoned sites identified a marginally significant difference (R = 0.062; p
= 0.059). SIMPER analysis identified a diverse suite of fauna responsible for the
dissimilarity between occupied and abandoned sites but the list was dominated by
polychaetes (Table 4). All taxa were more abundant at occupied sites than at abandoned
sites with the exception of the very long and thin polychaete Heteromastus filiformis.
Also on the list were three haustoriid amphipods and two mollusk taxa including the
common bean clam Donax variabilis.
Table 4. All taxa responsible for at least 2% of the dissimilarity between occupied and abandoned sites at Kiawah Island and Bird Key based on similarity percentage (SIMPER) analysis. Higher Taxa: P = polychaete, A = amphipod, M = mollusk, no abbreviation = other For each taxon, replicate cores were averaged within each transect and fourth root transformed prior to analysis. Densities shown in the table were derived from those transformed data and do not represent absolute densities. Taxon
Higher Taxon
Average Density in Percent Contribution to
Dissimilarity Occupied
Sites Abandoned
Sites Neohaustorius schmitzi A 2.92 2.53 4.79 Paraonis fulgens P 5.38 4.26 4.56 Streblospio benedicti P 3.76 3.49 4.47 Laeonereis culveri P 3.51 3.00 4.34 Capitella capitata P 3.68 3.18 4.31 Donax variabilis M 2.06 0.59 3.52 Lepidactylis dytiscus A 2.80 1.78 3.37 Heteromastus filiformis P 1.97 2.50 3.04 Nereis succinea P 1.95 1.65 2.82 Mediomastus sp. P 1.78 1.48 2.78 Tharyx acutus P 1.45 1.13 2.68 Tellinidae M 1.35 1.08 2.45 Cirratulidae P 1.36 1.24 2.31 Eteone heteropoda P 1.44 0.55 2.17 Leitoscoloplos fragilis P 1.32 0.69 2.04 Acanthohaustorius sp. A 0.91 0.71 2.03 Nemertea 1.32 0.52 2.00

22
When the species matrix was reduced to include only occupied foraging sites,
cluster analysis identified six unique and significant clusters (I-VI in Figure 10). When
these clusters were delineated on an MDS plot of the sites, two patterns emerged: 1) the
two islands were not clearly differentiated in terms of community composition and 2) the
communities of the two islands transitioned through time (Figure 11). The occupied
foraging sites on Kiawah Island and Bird Key were highly mixed throughout the
ordination plot indicating they were very similar throughout the study. Four of the
significant clusters formed a series moving from left to right across the ordination plot,
roughly representing the time course of the study. Cluster V included periods sampled
only in 2006, 2007 and 2008. Clusters III and VI included only sampling periods in 2009
Figure 10. Results of cluster analysis involving only occupied sites in Kiawah island and Bird Key. Individual taxon densities on transects within each island, season and year were averaged prior to analysis to simplify interpretation. Solid lines – significant clusters based on similarity profile permutation tests (SIMPROF), dashed lines—non-significant clusters. Roman numerals identify significant clusters plotted in Figure 11.
23
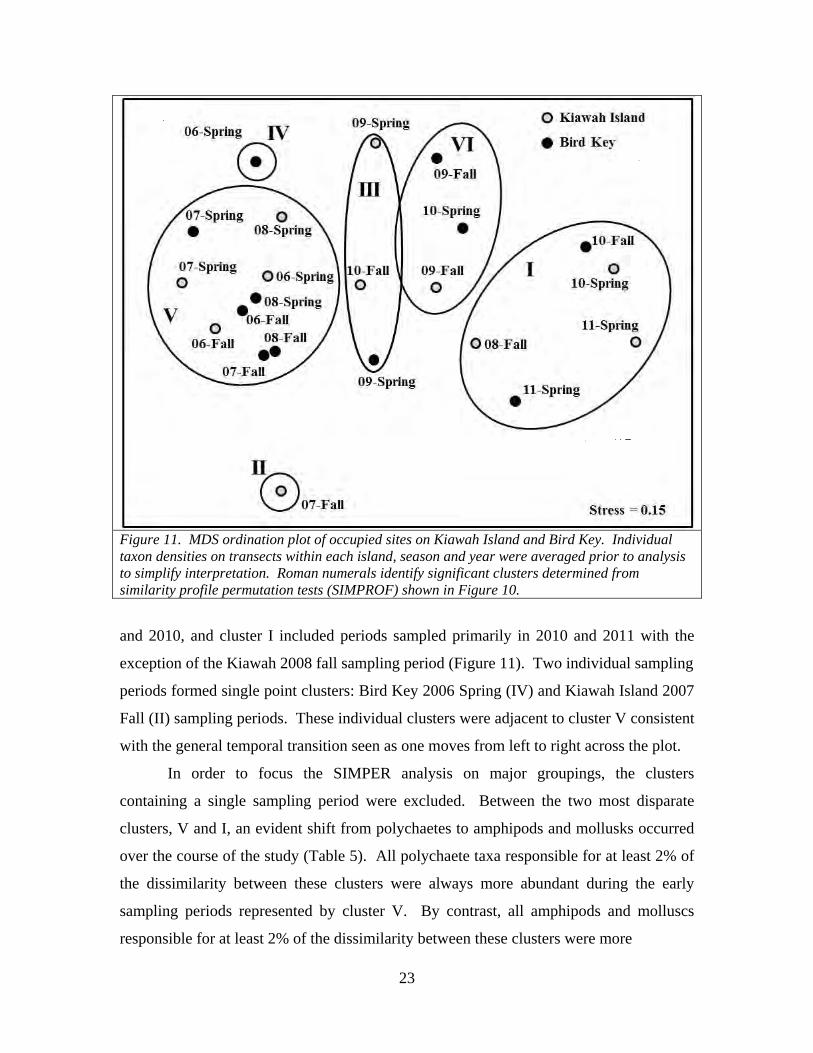
Figure 11. MDS ordination plot of occupied sites on Kiawah Island and Bird Key. Individual taxon densities on transects within each island, season and year were averaged prior to analysis to simplify interpretation. Roman numerals identify significant clusters determined from similarity profile permutation tests (SIMPROF) shown in Figure 10.
and 2010, and cluster I included periods sampled primarily in 2010 and 2011 with the
exception of the Kiawah 2008 fall sampling period (Figure 11). Two individual sampling
periods formed single point clusters: Bird Key 2006 Spring (IV) and Kiawah Island 2007
Fall (II) sampling periods. These individual clusters were adjacent to cluster V consistent
with the general temporal transition seen as one moves from left to right across the plot.
In order to focus the SIMPER analysis on major groupings, the clusters
containing a single sampling period were excluded. Between the two most disparate
clusters, V and I, an evident shift from polychaetes to amphipods and mollusks occurred
over the course of the study (Table 5). All polychaete taxa responsible for at least 2% of
the dissimilarity between these clusters were always more abundant during the early
sampling periods represented by cluster V. By contrast, all amphipods and molluscs
responsible for at least 2% of the dissimilarity between these clusters were more

24
Table 5. All taxa responsible for at least 2% of the dissimilarity between occupied and abandoned sites at Kiawah Island and Bird Key based on similarity percentage (SIMPER) analysis. Higher Taxa: P = polychaete, A = amphipod, M = mollusk, no abbreviation = other. For each taxon, replicate cores were averaged within each transect and fourth root transformed prior to analysis. Densities shown in the table were derived from those transformed data and do not represent absolute densities. Taxon
Higher Taxon
Average Density in Percent Contribution to Dissimilarity Cluster V Cluster I
Neohaustorius schmitzi A 0.44 6.83 7.68 Capitella capitata P 6.16 0.43 6.73 Laeonereis culveri P 5.83 0.49 6.24 Streblospio benedicti P 5.23 0.88 5.04 Donax variabilis M 0.20 4.12 4.49 Nereis succinea P 3.36 0.00 3.90 Heteromastus filiformis P 3.34 0.53 3.50 Tharyx acutus P 2.78 0.00 3.10 Paraonis fulgens P 6.12 4.82 3.01 Cirratulidae P 2.46 0.36 2.48 Acanthohaustorius sp. A 0.32 2.05 2.29 Eteone heteropoda P 2.29 0.51 2.22 Lepidactylus dytiscus A 2.39 4.05 2.16 Mediomastus ambiseta P 2.05 0.00 2.14 Parahaustorius sp. A 0.00 1.62 2.03
abundant during the latter time periods represented by cluster I. SIMPER produced
similar results for comparisons amongst all other pairs of clusters along the left-right
temporal axis identified in the MDS ordination (clusters representing earliest to latest
sampling periods: V to III to VI to I). When cluster V was compared to cluster III, taxa
more abundant in V included only polychaetes (eg. Capitella capitata, Laeonereis
culveri, Paraonis fulgens, Tharyx acutus, and Heteromastus filiformis) while those more
abundant in cluster III were primarily amphipods (Neohaustorius schmitzi and
Lepidactylus dytiscus) and molluscs (Tellinidae and Donax variabilis) but also the
polychaete Leitoscoloplos fragilis. The comparison of clusters III and VI was less clearly
differentiated based on taxa. Taxa more abundant in cluster III were mostly polychaetes
(P. fulgens, L. fragilis, Nereis succinea, Eteone heteropoda and Streblospio benedicti) but
the amphipod L. dytiscus was also more abundant in this cluster; taxa more abundant in
cluster VI included a mix of amphipods (Parahaustorius sp., Parahaustorius longimerus,
N. schmitzi, and Acanthohaustorius sp.), mollusks (D. variabilis and M. lateralis) and
polychaetes (L. culveri, T. acutus, and C. capitata). Finally, when cluster VI was

25
compared to cluster I, the same general pattern held, but again was less clearly
differentiated (both clusters included overlapping sampling periods). Taxa more
abundant in cluster VI included a mix of polychaetes (S. benedicti, C. capitata,
Mediomastus sp., L. culveri, L fragilis and T. acutus), amphipods (P. longimerus, and
Parahaustorius sp.) and mollusks (Tellinidae, D. variabilis and M. lateralis); taxa more
abundant in cluster I included mostly amphipods (N. schmitzi, Acanthohaustorius sp., L.
dytiscus) and the polychaete P. fulgens.
Macroinvertebrates Identified in Fecal Samples
When the invertebrate community present in foraging sites of Kiawah Island and
Bird Key was reduced to just those taxa found in piping plover fecal samples
(“consumed” taxa), statistical analysis produced similar results to those obtained using
the entire community. The consumed macroinvertebrate community was significantly
different among years but not between islands or seasons (Tables 6 and 7). Although not
significant, consumed total faunal, polychaete, and amphipod densities tended to be
higher at Bird Key than at Kiawah while consumed mollusk density was lower at Bird
Key (Tables 6 and 7). On an annual basis, consumed total faunal densities peaked twice:
once in 2007 coincident with the peak in consumed polychaete density and again in 2010
and 2011 coincident with peak consumed amphipod density (Table 7). Although among-
transect variation was high, the transition among the consumed community from a
polychaete dominated assemblage to an amphipod-dominated assemblage was apparent
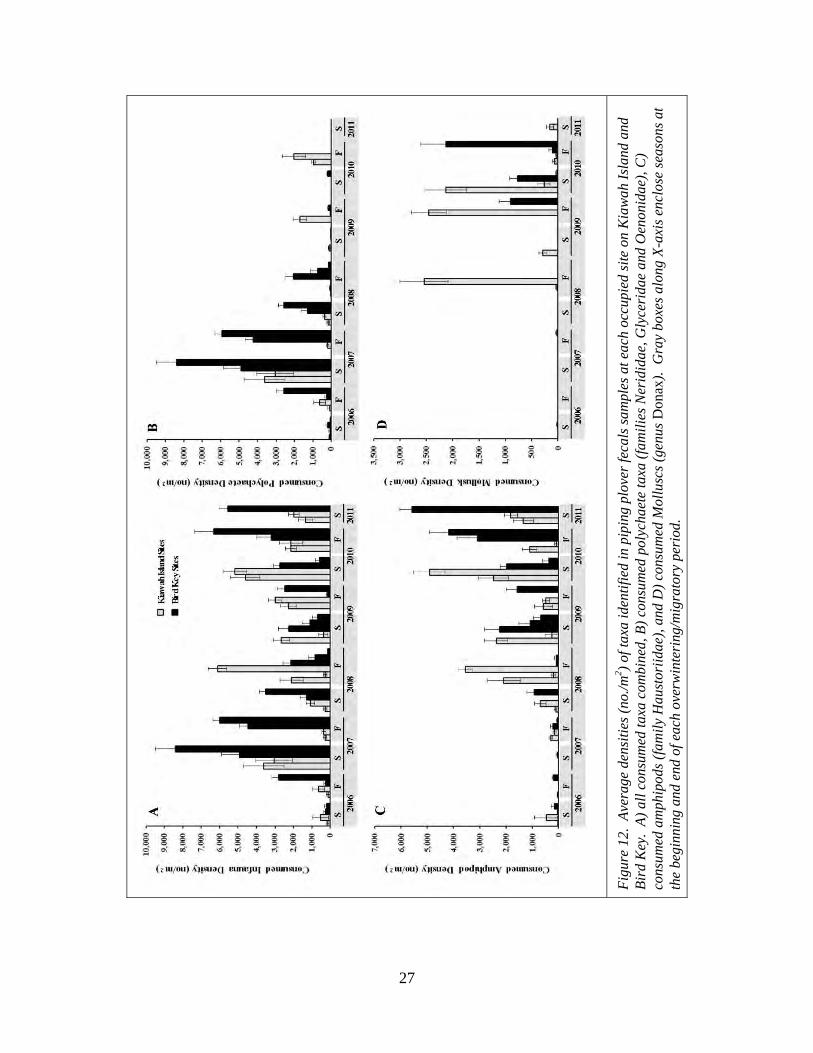
at the transect level (Figure 12B,C). This transition resulted in total faunal densities not
changing as substantially through time as the individual taxa (Figure 12A). In general,
the two islands followed the same pattern through time, but the interaction between
Table 6. Results (p-values) of ANOVAs using only those taxa identified in piping plover fecal samples and examining differences in the macroinvertebrate communities of occupied foraging habitats. The factors in the models included Island (Kiawah vs. Bird Key), Season (Fall vs. Spring) and Year (2006-2011). Source All Fauna Polychaetes Amphipods Molluscs Island 0.113 0.127 0.477 0.336 Season 0.855 0.913 0.801 0.269 Island X Season 0.620 0.843 0.693 0.863 Year 0.004 <0.001 <0.001 0.001 Island X Year 0.131 0.007 0.185 0.451
26
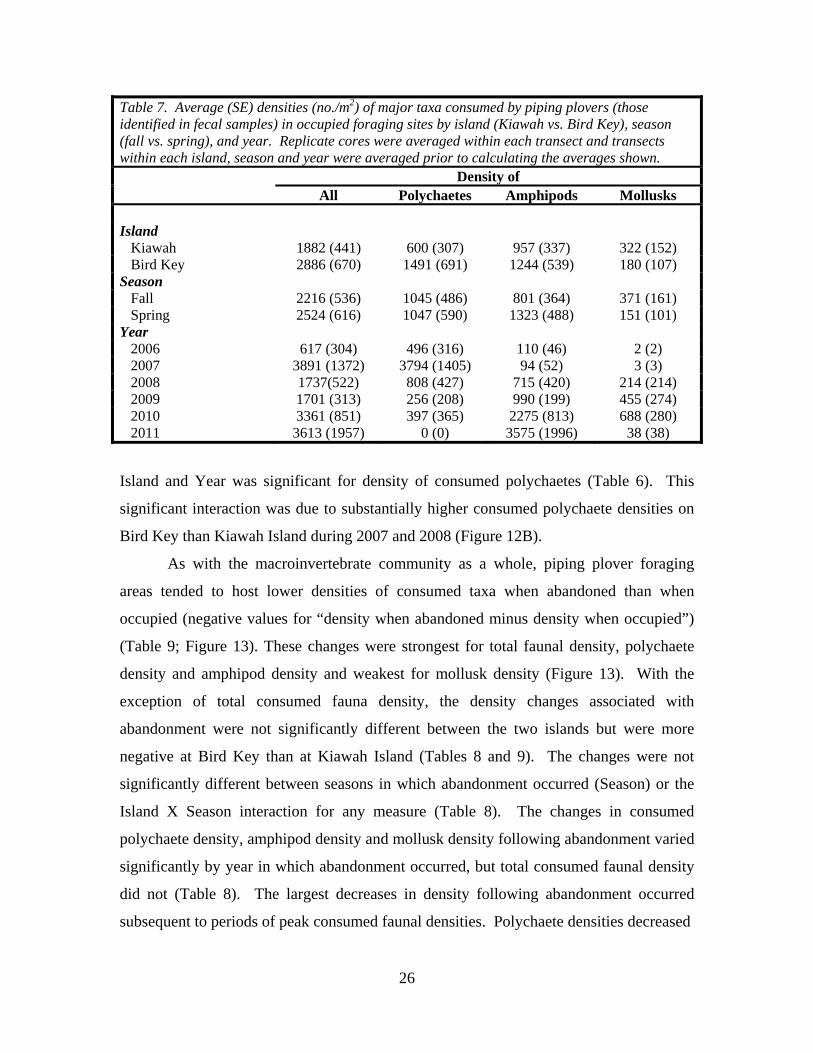
Table 7. Average (SE) densities (no./m2) of major taxa consumed by piping plovers (those identified in fecal samples) in occupied foraging sites by island (Kiawah vs. Bird Key), season (fall vs. spring), and year. Replicate cores were averaged within each transect and transects within each island, season and year were averaged prior to calculating the averages shown. Density of All Polychaetes Amphipods Mollusks Island Kiawah 1882 (441) 600 (307) 957 (337) 322 (152) Bird Key 2886 (670) 1491 (691) 1244 (539) 180 (107) Season Fall 2216 (536) 1045 (486) 801 (364) 371 (161) Spring 2524 (616) 1047 (590) 1323 (488) 151 (101) Year 2006 617 (304) 496 (316) 110 (46) 2 (2) 2007 3891 (1372) 3794 (1405) 94 (52) 3 (3) 2008 1737(522) 808 (427) 715 (420) 214 (214) 2009 1701 (313) 256 (208) 990 (199) 455 (274) 2010 3361 (851) 397 (365) 2275 (813) 688 (280) 2011 3613 (1957) 0 (0) 3575 (1996) 38 (38)
Island and Year was significant for density of consumed polychaetes (Table 6). This
significant interaction was due to substantially higher consumed polychaete densities on
Bird Key than Kiawah Island during 2007 and 2008 (Figure 12B).
As with the macroinvertebrate community as a whole, piping plover foraging
areas tended to host lower densities of consumed taxa when abandoned than when
occupied (negative values for “density when abandoned minus density when occupied”)
(Table 9; Figure 13). These changes were strongest for total faunal density, polychaete
density and amphipod density and weakest for mollusk density (Figure 13). With the
exception of total consumed fauna density, the density changes associated with
abandonment were not significantly different between the two islands but were more
negative at Bird Key than at Kiawah Island (Tables 8 and 9). The changes were not
significantly different between seasons in which abandonment occurred (Season) or the
Island X Season interaction for any measure (Table 8). The changes in consumed
polychaete density, amphipod density and mollusk density following abandonment varied
significantly by year in which abandonment occurred, but total consumed faunal density
did not (Table 8). The largest decreases in density following abandonment occurred
subsequent to periods of peak consumed faunal densities. Polychaete densities decreased
27
Fig
ure
12.
Ave
rage
den
siti
es (
no./m
2 ) of
taxa
iden
tifie
d in
pip
ing
plov
er fe
cals
sam
ples
at e
ach
occu
pied
site
on
Kia
wah
Isl
and
and
Bir
d K
ey.
A)
all c
onsu
med
taxa
com
bine
d, B
) co
nsum
ed p
olyc
haet
e ta
xa (
fam
ilie
s N
erid
idae
, Gly
ceri
dae
and
Oen
onid
ae),
C)
cons
umed
am
phip
ods
(fam
ily H
aust
orii
dae)
, and
D)
cons
umed
Mol
lusc
s (g
enus
Don
ax).
Gra
y bo
xes
alon
g X
-axi
s en
clos
e se
ason
s at
th
e be
ginn
ing
and
end
of e
ach
over
win
teri
ng/m
igra
tory
per
iod.

28
the most following peak polychaete densities in 2007 and 2008 and consumed amphipod
and mollusk densities decreased the most following their peak densities during the latter
portion of the study (Table 9).
Table 8. Results of ANOVAs (p-values) examining the effects of Island (Kiawah vs. Bird Key), Season (Fall vs. Spring) and Year (2006-2011) on the change in foraging habitat macroinvertebrate communities following abandonment. Source All Fauna Polychaetes Amphipods Molluscs Island 0.046 0.308 0.156 0.134 Season 0.362 0.575 0.130 0.861 Island X Season 0.573 0.512 0.299 0.470 Year 0.062 0.042 0.016 0.007 Island X Year 0.159 0.110 0.038 0.005
Table 9. Average (SE) changes in densities (no./m2) of major taxa consumed by piping plovers (those found in fecal samples) between foraging sites being occupied and abandoned. Replicate cores were averaged within each transect, the differences were calculated between the last occupied season and the subsequent abandoned season then then the site differences averaged within each island, season and year prior to calculating the averages shown. Change in density of All Polychaetes Amphipods Mollusks Islands Kiawah -1286 (553) -855 (609) -410 (430) -20 (355) Bird Key -2848 (1285) -1784 (1139) -760 (725) -304 (229) Abandonment Season Fall -1829 (1253) -1367 (1028) -603 (724) 141 (299) Spring -2305 (715) -1272 (813) -568 (439) -465 (270) Abandonment Year 2006 110 (102) -102 (15) 208 (91) 4 (4) 2007 -2856 (1780) -3026 (1874) 164 (224) 5 (5) 2008 -2900 (2269) -2911 (2380) 16 (253) -5 (5) 2009 -921 (737) 313 (244) -1156 (549) -77 (70) 2010 -888 (714) -400 (457) -334 (990) -153 (991) 2011 -5647 (3520) -1042 (1086) -3443 (3531) -1162 (1075)

29
Fig
ure
13.
Ave
rage
den
siti
es (
no./m
2 ) of
taxa
iden
tifie
d in
pip
ing
plov
er fe
cals
sam
ples
at e
ach
occu
pied
site
on
Kia
wah
Isl
and
and
Bir
d K
ey.
A)
all c
onsu
med
taxa
com
bine
d, B
) co
nsum
ed p
olyc
haet
e ta
xa (
fam
ilie
s N
erid
idae
, Gly
ceri
dae
and
Oen
onid
ae),
C)
cons
umed
am
phip
ods
(fam
ily H
aust
orii
dae)
, and
D)
cons
umed
Mol
lusc
s (g
enus
Don
ax).
Gra
y bo
xes
alon
g X
-axi
s en
clos
e se
ason
s at
th
e be
ginn
ing
and
end
of e
ach
over
win
teri
ng/m
igra
tory
per
iod.

30
DISCUSSION
Caveats regarding impact detection
Whether modification of the lagoon at the east of Kiawah Island significantly
impacted macroinvertebrate prey densities in associated piping plover foraging habitats
was not clearly resolvable in this study. Limitations in the temporal controls were
recognized from the outset, but Before-After comparisons should have been possible
using only the spring sampling season data. Modification of the intended control area
(Bird Key) prevented a meaningful analysis of even that dataset under a BACI
framework. The analyses performed here compared the two islands and examined
relative changes in foraging areas on the two islands through time (Island X Year
interaction), but it is important to keep in mind that both islands experienced
anthropogenic modification at approximately the same time. Under these circumstances,
the comparison if the two islands could only identify whether one modified habitat
changed differently relative to another modified habitat. Despite these limitations, the
dataset still provided the ability to address the two primary study objectives: 1) assess
changes in the macroinvertebrate community in piping plover foraging sites around the
Kiawah Island lagoon, 2) determine changes in the macroinvertebrate community
associated with piping plover foraging site abandonment within the lagoon.
Macroinvertebrate Communities in Occupied Piping Plover Foraging Areas
Based on total faunal and major taxa densities, there was little evidence of
differences between foraging sites on the two islands, of differences between seasons, or
of the two islands changing differently through time (ie. few Island X Year interactions
were detected). The density of polychaete taxa identified in fecal samples (consumed
polychaetes) was the only parameter to show a significantly different trend between the
two islands through time, and this was due to particularly high polychaete densities on
Bird Key during 2007 and 2008. The occupied foraging sites on Kiawah Island also
hosted elevated polychaete densities during this same period, but they were much lower
than on Bird Key. This depression of polychaete numbers on Kiawah Island relative to
those on Bird Key could have been due to a wide range of factors including differential
31
disturbance from modification, recruitment patterns, interspecific competition or
predation pressure.
The most apparent temporal patterns in macroinvertebrate community
composition were those that occurred on both islands over the course of the study.
Polychaete densities were relatively high on both islands during the 2006-2007 and 2007-
2008 overwintering seasons but then declined over subsequent overwintering seasons.
While polychaete densities were declining, amphipod densities and, to a lesser extent
mollusk densities, were increasing. This same scenario played out at finer taxonomic
levels as polychaete taxa including Laeonereis culveri and Nereis succinea (both nereid
polychaetes) were replaced by various haustoriid amphipods such as Neohaustorius
schmitzi and Lepidactylus dytiscus and molluscs such as Donax variabilis. This trend
was particularly striking as many of the taxa most responsible for the dissimilarities
between foraging area communities early in the study and later in the study were taxa
also found in piping plover fecal samples. This suggests that the temporal changes
occurring in foraging areas impacted the diet of migratory and overwintering piping
plovers in the Kiawah Island/Bird Key system.
Piping plovers on Kiawah Island and Bird Key shifted their primary foraging
areas from protected lagoon habitats to exposed shoreline habitat (active beach face or
inlet channel edges) over the course of the study. Some studies have found communities
of greater total invertebrate abundances and biomasses in protected intertidal shorelines
than in exposed ocean beach shorelines (Cohen et al. 2006). This pattern was not
particularly strong in the current study in terms of abundances, but the shift in plover
habitat use likely contributed to the concurrent changes observed in the available prey
community from polychaetes to amphipods (and mollusks) at occupied foraging sites.
Polychaetes tend to be most abundant and diverse in more protected and/or dissipative
shoreline environments, while crustaceans (such as amphipods) tend to fare better in
more exposed and higher energy environments (McLachlan and Brown 2006).
Consistent with this general pattern, the relative abundance of polychaetes was greater in
protected foraging areas while the relative abundance of amphipods was greater in
exposed habitats on Kiawah Island and Bird Key (Figure 14A,B). When examined by

32
Figure 14. Relative abundances of polychaetes and amphipods in sheltered and exposed habitats overall on A) Kiawah Island and B) Bird Key and by year on C) Kiawah Island and D) Bird Key. year, relative abundances of polychaetes and amphipods followed this same trend with
respect to habitat type, but with some exceptions (Figure 14C,D). The habitat-specific
pattern was very consistent on Kiawah Island, except in the spring of 2011 when a
sheltered foraging site was dominated by amphipods. On Bird Key, the pattern was less
consistent with exposed habitats having very high relative abundances of polychaetes
during the years of peak polychaete densities (2006-2008). This suggests that the decline
in polychaetes and increase in amphipods over the course of this study reflected a
combination of shifting piping plover habitat use and broader change in the relative
abundances these taxa at the two islands.
The temporal trend of declining polychaete densities from the earlier to the later
portions of the study period was very similar to the trends observed in the piping plover
count surveys in the area. The numbers of piping plovers using the lagoon at the east end
of Kiawah Island during the migratory period and during the overwintering period were
highest during the 2006-2007 period, declined over the next two overwintering periods
and remained low thereafter (Figure 15; USFWS, unpublished data). The specific
polychaete taxa observed in piping plover fecal samples (Neriidae, Glyceridae, and

33
Oenonidae) also followed the same
temporal trend, becoming almost
absent from most foraging sites
during the latter portion of the study.
Other studies using more formal
methodology have documented
significant positive correlations
between numbers of foraging
shorebirds and polychaete densities
in migratory stopovers and
overwintering habitats (Mercier and
McNeil 1994; Muhammad 2009),
suggesting these taxa are an
important part of the habitat quality of shorebird stopover and overwintering grounds.
Although amphipod densities increased substantially during the latter portion of the study
and partially compensated for the polychaete declines in terms of total faunal
abundances, plover numbers did not appear to respond.
Macroinvertebrate Communities in Abandoned Foraging Areas
As foraging sites transitioned from being occupied to being abandoned by
migratory and overwintering piping plovers, the over-riding trend was a decrease in
macroinvertebrate densities. This pattern generally held regardless of island, season of
abandonment, year of abandonment, or major invertebrate taxon examined. The majority
of the 33 foraging sites that were occupied and subsequently abandoned experienced
decreases in total faunal densities (27 sites) and all the major taxa densities. Of the major
taxa, polychaetes most consistently decreased following abandonment (25 sites) while
amphipods and molluscs decreased at a majority of sites but not as consistently as
polychaetes (19 and 20 sites, respectively). In fact, multivariate analyses confirmed that
many of the fauna consumed by plovers (haustoriid amphipods, nereid polychaetes, etc.)
were among those most responsible for the community changes occurring with
abandonment. This suggests that piping plovers were relocating to other foraging sites as
prey became scarce and/or as associated environmental conditions (sediment
Figure 15. Count of the number of piping plovers observed during weekly (migratory period) and monthly (overwintering period) surveys of the lagoon at the east end of Kiawah Island. Data source: USFWS.

34
composition, vegetation distribution, elevation, etc.) became unsuitable for foraging
activity or their prey.
The causes of the changes leading up to foraging site abandonment are unclear
but they may partially reflect changing environmental conditions over the course of the
study. Some intertidal forging sites transitioned to subtidal or supralittoral habitats (or at
least elevated close to the high water mark) at some point leading up to abandonment.
These types of changes appeared to be associated with shifting tidal channel locations or
with the accumulation of wind and wave-driven sand (Bergquist and Levisen personal
observations). Because piping plovers prefer to forage in intertidal habitats, such
severely altered sites were no longer suitable foraging habitat for piping plovers or
suitable habitat for many intertidal invertebrates. Other foraging areas remained
intertidal following abandonment, thus more subtle changes in sediment composition,
grain size or penetrability, known to influence invertebrate communities (Gray 1974),
may have occurred in these cases. Determining those characteristics on Kiawah Island
was outside of the scope of the current study, but sediment samples from a small number
of sites (5) were processed and little variation was found in sand content (92.4 - 98.8% of
dry mass) or silt and clay content (silt/clay = 1.2 - 7.6% of dry mass). Despite these
results, relative compositions of the major taxonomic groups suggest that the physical
environment changed in association with abandonment in a somewhat predictable
manner. In particular, the change in polychaete density was inversely related to the
change in amphipod density following abandonment (Figure 14). The different habitat
preferences of polychaetes and
amphipods and the different
magnitudes of change of the taxa
following abandonment (polychaetes
decreased more often and to a greater
extent than amphipods), indicate that
the changes may be related to
sediments becoming coarser or
foraging areas becoming more
exposed to greater wave action.
Figure 14. Relationship between the changes in the density (no./m2) of amphipods and density of polychaetes of occupied foraging sites following abandonment.

35
More detailed physical data on elevation, sediment composition, water flow and wave
exposure as well as data on invertebrate recruitment patterns, predatory prey depletion
and shorebird behavior are needed to determine the mechanisms driving changes
observed in macroinvertebrate communities following foraging site abandonment.
The compositional changes in the macroinvertebrate communities associated with
abandonment of foraging sites were similar to the changes that occurred at occupied sites
over the course of the study. Occupied foraging sites shifted from relatively high
polychaete and low amphipod densities in the early part of the study to relatively low
polychaete densities later in the study. Similarly, foraging sites when occupied had
higher densities of polychaetes than when later abandoned. In both cases, piping plovers
appeared to respond similarly with decreasing numbers of overwintering birds through
time in the Kiawah Island/Bird Key system and with abandonment of individual foraging
sites on both islands in all years. Interestingly, based on multivariate analyses, practically
all of individual taxa responsible for most of the dissimilarity (at least 2% individually)
between occupied foraging sites early in the study and occupied foraging sites later in the
study were also responsible for the dissimilarity between occupied and subsequently
abandoned sites. These taxa included many of those also found in piping plover fecal
samples such as the nereids Nereis succinea and Leionereis culveri and the haustoriid
amphipods Neohaustorius schmitzi, Lepidactylus dytiscus and Acanthohaustorius sp.
This further reinforces that changes specific to taxa in the diets of
migratory/overwintering piping plovers were occurring both within individual foraging
sites leading to subsequent abandonment and within the larger Kiawah Island/Bird Key
system, perhaps leading to declines in the overwintering population.
Macroinvertebrate Prey as a Component of Migratory/Overwintering Habitat Quality
Migratory birds expend enormous amounts of energy during seasonal migrations
of sometimes thousands of miles (Blem 1980; Myers et al. 1987), and up to 90% of the
migratory period is spent at stopover sites where migrants refill energy stores
(Hedenström and Alerstam 1998). Because of the high energy demands of active
foraging during these migratory stopovers (Evans 1976; McWilliams et al. 2004), energy
expended during this time may be twice that expended during migratory flight
36
(Hedenström and Alerstam 1998). Consequently, quantity and quality of prey at stopover
and overwintering habitats are critical considerations of overall habitat quality.
Polychaetes form a major part of the diet for many migrant shorebirds (eg. Kalejta
1992; Tsipoura and Burger 1999; Verkuil et al. 2006) including piping plovers (Nichols
1989; Zonick and Ryan 1996). Polychaete densities, including those found to be
consumed by piping plovers in South Carolina stopover/overwintering habitats, declined
in foraging areas over the course of this study. Coincident with this decrease was an
increase in amphipod densities that at least partially compensated for the loss of
polychaetes in terms of total invertebrate abundances. Whether the amphipods were
capable of providing similar or better quality forage as compared to polychaetes depends
on a number of factors including the relative biomasses of these two prey taxa, the
assimilation efficiency of the prey items when consumed by piping plovers (the
proportion of the ingested prey energy content that is assimilated into the tissues of the
predator), and the amount of foraging effort required by plovers to obtain the two
different prey taxa. The polychaete taxa found in piping plover fecal samples are
substantially larger than the amphipod taxa found in the fecal samples. This indicates that
piping plovers must capture many more haustorid amphipods in order to equal the mass
available in a single nereid or glycerid polychaete. Most studies indicate intertidal
marine invertebrates are assimilated by shorebirds with an efficiency of ~75-85%
(Kersten and Piersma 1987; Stillman et al. 2005; Castro 2008), so the greater mass of a
polychaete prey item would provide a greater energy gain for the predatory shorebird.
It is not known whether piping plovers forage more successfully on polychaetes
or amphipods. In order to determine whether the quality of foraging habitat is
undermined by a community shift from a polychaete-dominated to a amphipod-
dominated assemblage, more information on the foraging behavior of piping plovers is
required. It is currently not known whether piping plovers search for greater lengths of
time or successfully capture when foraging on one prey taxon versus the other.
Regardless, the relative ubiquity of polychaete remains in piping plover fecal samples
and the potentially greater energy content of this prey taxon suggest that the density of
large errant polychaetes is an important component of piping plover stopover and
overwintering habitat quality. Because piping plovers have a site high fidelity both
within and between wintering seasons (Drake et al. 2001; Stucker et al. 2010) changes in

37
the condition of wintering habitats in terms of prey composition may have severe
consequences for returning migrants.

38
39
CONCLUSIONS AND RECOMMENDATIONS
A late start in the monitoring efforts and unexpected modification of the intended
control island (Bird Key) inhibited the ability to detect impacts from the Kiawah Island
East End Erosion and Beach Restoration Project, but these limitations did not affect the
primary study objectives. There was little evidence the macroinvertebrate communities
differed between islands or sampling seasons or that they changed differently through
time at the two islands, although these between-island comparisons were capable only of
indicating whether two human-modified systems changed differently through time.
Macroinvertebrate community composition changed significantly through time from a
polychaete-dominated assemblage early in the study to an amphipod dominated
assemblage later in the study. At least part of this change may be due to a change in
piping plover foraging behavior as they foraged primarily in protected habitats during
2006-2008 and foraged more in exposed habitats during 2009-2011, thus the
macroinvertebrate community changed from taxa typically of lower-energy environments
to those typical of higher energy environments. Many of the taxa found in piping plover
fecal samples were among those that changed during this period, the temporal shift in
community composition likely affected the diet of migratory and overwintering piping
plovers in this system. The decreasing trend in polychaete density was accompanied by a
decrease in the number of overwintering piping plovers in the system, suggesting a link
between the two. Abandoned foraging sites supported lower densities of practically all
taxa. The changes in macroinvertebrate community composition that occurred in
association with site abandonment were almost identical to the changes that occurred at
occupied feeding areas over the course of the study (these similarities were true at broad
taxonomic levels and at the species level). As a result, the potential link between
macroinvertebrate prey and overwintering piping plovers was apparent at two diffferent
spatial scales: 1) prey changes in individual foraging sites and subsequent abandonment
of those sites by piping plovers, 2) prey changes in the larger Kiawah Island/Bird Key
system and declines in the overwintering piping plover population. The quantity and
quality of prey are often critical during the energetically demanding process of foraging
and migration. The relative importance of various prey taxa in meeting the energetic

40
demands of migrating and overwintering piping plovers will require further study. The
data presented here suggest that larger, errant polychaetes such as the families
Nereididae, Glyceridae and Oenonidae may be particularly important to piping plovers
overwintering in this region.
Based on the findings of this study and the obstacles experienced here, the
following recommendations are proposed to improve future investigations and ensure
anthropogenic modification does not significantly impair critical shorebird habitats:
1) Improve communication and coordination among project participants so that
appropriate Before-After-Control-Impact study designs are employed and all data (bird
surveys, aerial photography, and physical and biological habitat characterization) are
collected to maximize usefulness.
2) Perform more thorough monitoring of physical habitat characteristics (including
elevation, tidal inundation, sediment characteristics, vegetation, surface microtopography,
etc.) recognized by ornithologists as important to migratory and overwintering shorebird
habitat choice at spatial scales relevant to piping plover foraging activities.
3) Perform more thorough studies of prey community composition (including
determining biomasses of key taxa) and piping plover foraging behavior (attack rates,
foraging efficiency, etc.) to better determine the relationship between different prey taxa
and the energetic costs/benefits of foraging in different migratory stopover and
overwintering habitats.
41
ACKNOWLEDGEMENTS
We wish to thank the staff of the Environmental Research Section at the Marine
Resources Research Institute for their hard work and dedication to this project. Patrick
Biondo, Stephen Burns, Stacie Crowe, Jordan Felber, Jeremy Grigsby, John Heinsohn,
Jared Hulteen, Brooke James, and George Riekerk assisted with field sample collection.
Stephen Burns assisted with benthic sample sorting. A very special thanks to Melissa
Bimbi at the US Fish and Wildlife Service for her assistance in the field, lessons in
shorebird identification, and insight into piping plover ecology. Thanks also to Jim
Jordan and Aaron Givens for their assistance identifying foraging areas on Kiawah Island
and accessing those areas using many fun, and sometimes memorably troublesome,
methods. This project was funded by the Town of Kiawah.

42

43
LITERATURE CITED
Blem, C. R. 1980. The energetics of migration. In: Gauthreaux, S. A. Jr. (ed.), Animal
migration, orientation, and navigation. Academic Press, New York, pp. 175-224. Castro, M. J.A.Masero, C. Megina, J.A. Amat, A. Perez-Hurtado. 2008. Energy and
macronutrient assimilation efficiencies of Snowy Plover (Charadrius alexandrinus) feeding on the polychaete ragworm Nereis diversicolor. Auk 125:368-373.
Clarke, K.R., R.N. Gorley. 2006. PRIMER v6: User Manual/Tutorial. PRIMER-E, Plymouth
Coastal Science and Engineering. 2007. East end erosion and beach restoration project, Kiawah Island, Charleston County, SC. Final Report for Town of Kiawah Island, SC. CSE, Columbia, South Carolina, 54 pp + appendices.
Cohen, J.B., S. M. Karpanty, D.H. Caitlin, J.D. Fraser, and R.A. Fischer. 2006. Draft. Winter ecology of piping plovers at Oregon Inlet, North Carolina. Journal of Wildlife Management. In Prep. 28 pp.
Convertino, M., J.F. Donoghue, M.L. Chu-Agor, G. A. Kiker, R. Munoz-Carpena, R.A. Fischer, I. Linko. 2011. Anthropogenic renourishment feedback on shorebirds: A multispecies Bayesian perspective. Ecological Engineering 37:1184–1194.
Defeo, O., A. McLachlan, D.S. Schoeman, T.A. Schlacher, J. Dugan, A. Jones, M. Lastra, F. Scapini. 2007. Threats to sandy beach ecosystems: a review. Estuarine, Coastal and Shelf Science 81:1-12.
Drake, K.R., J.E. Thompson, K.L. Drake, C. Zonick. 2001. Movements, habitat use, and survival of non-breeding piping plovers. Condor 103:259-267.
Durell, S. E. A. l. V. d., J.D. Goss-Custard, R.T. Clarke. 1997. Differential response of migratory subpopulations to winter habitat loss. Journal of Applied Ecology 34:1155–1164.
Evans, P.R. 1976. Energy balance and optimal foraging strategies in shorebirds: some implications for their distributions and movements in the non-breeding season. Ardea 64:117–139.
Foster, C.R., A.F. Amos and L.A. Fuiman. 2009. Trents in abundance of coastal birds and human activity on a Texas barrier island over three decades. Estuaries and Coasts 32: 1079-1089.
Goss-Custard, J. D., R. T. Clarke, S. E. A. Le V. Dit Durell, R. W. G. Caldow, B. J. Ens. 1995. Population Consequences of Winter Habitat Loss in a Migratory Shorebird. II. Model Predictions. Journal of Applied Ecology 32:337-351.
Gratto-Trevor, C., D. Amirault-Langlais, D. Catlin, F. Cuthbert, J. Fraser, S. Maddock, E. Roche, F. Shaffer. 2009. Wintering distribution of four different piping plover breeding populations. Submitted to U.S. Fish and Wildlife Service. 11p.
Gray, J.S. 1974. Animal-sediment relationships. Oceanography and Marine Biology: An Annual Review 12:223-261.
Haig, S.M., L.W. Oring. 1985. The distribution and status of the piping plover throughout the annual cycle. Journal of Field Ornithology 56:334-335.
Harrington, B. R. 2008. Coastal inlets as strategic habitat for shorebirds in the

44
southeastern United States. DOER Technical Notes Collection. ERDC TN-DOER-E25. Vicksburg, MS: U.S. Army Engineer Research and Development Center.
Hedenström, A., T. Alerstam, T. 1998. How fast can birds migrate? Journal of Avian Biology 29: 424–432.
Kalejta, B . 1992. Time budgets and predatory impact of waders at the Berg River estuary, South Africa. Ardea 80:327-342.
Kersten, M., T. Piersma. 1987. High levels of energy expenditure in shorebirds: metabolic adaptations to an energetically expensive way of life. Ardea 75:175-187.
Lott, C.A. 2009. Distribution and Abundance of Piping Plovers (Charadrius melodus) and Snowy Plovers (Charadrius alexandrinus) on the West Coast of Florida Before and After the 2004/2005 Hurricane Seasons. Prepared for U.S Army Corps of Engineers, Dredging Operations and Environmental Research Program. ERDC/EL TR-09-13. 47pp.
Maddock, S., M. Bimbi, W. Golder. 2009. South Carolina shorebird project, draft 2006-2008 piping plover summary report. Audubon North Carolina and U.S. Fish and Wildlife Service, Charleston, South Carolina. 135 pp.
Marra, P.P., K.A. Hobson, R.T. Holmes. 1998. Linking winter and summer events in a migratory bird by using stable-carbon isotopes. Science 282, 1884–1886.
McLachlan, A., A.C. Brown AC 2006. The ecology of sandy shores. Academic Press, Burlington, MA, USA. 373 p.
McLusky, D. S., D. M. Bryant, M. Elliott. 1992. The impact of land-claim on macrobenthos, fish and shorebirds on the forth estuary, eastern Scotland. Aquatic Conservation: Marine and Freshwater Ecosystems 2: 211–222.
McWilliams, S.R., C. Guglielmo, B. Pierce, M. Klaassen. 2004. Flying, fasting, and feeding in birds during migration: a nutritional and physiological ecology perspective. Journal of Avian Biology 35:377–393.
Mercier, F., R McNeil. 1994. Seasonal variations in intertidal density of invertebrate prey in a tropical lagoon and effects of shorebird predation. Canadian Journal of Zoology 72: 1755-1763
Muhammad, A.K. 2009. Some Aspects of Feeding Ecology of the Lesser Sand Plover Charadrius mongolus in Three Different Zones in the Kadalundy Estuary, Kerala, South India. Podoces 4: 100–107.
Myers, J.P. 1983. Conservation of migrating shorebirds: staging areas, geographic bottlenecks, and regional movements. American Birds 37:23-25.
Myers, J. P., IL I. G. Morrison, P. Z. Antas, B. A. Harrington, T. E. Lovejoy, M. Sallaberry, S.E. Senner, and A. Tarak. 1987. Conservation strategy for migratory species. American Scientist 75:18-26.
Nicholls, J.L. 1989. Distribution and other ecological aspects of piping plovers (Charadrius melodus) wintering along the Atlantic and Gulf Coasts. M.S. Thesis. Auburn University, Auburn, Alabama.
Nicholls, J.L. and G.A. Baldassarre. 1990b. Habitat associations of piping plover wintering in the United States. Wilson Bulletin 102:581-590.
Norris D.R., P.P. Marra, T.K. Kyser, T.W. Sherry, L.M. Ratcliffe. 2003. Tropical winter habitat limits reproductive success on the temperate breeding grounds in a migratory bird. Proc. R. Soc. Lond. B (2004) 271, 59–6.

45
NRC (National Research Council). 1995. Beach Nourishment and Protection. National Academy Press, Washington DC. 334pp.
Peterson, C.H., Bishop M.J. 2005. Assessing the environmental impacts of beach nourishment. Bioscience 55:887-896.
Peterson, C.H, M.J. Bishop, G.A. Johnson, L.M. D’Anna, L.M. Manning. 2006. Exploiting beach fill as an unaffordable experiment: benthic intertidal impacts propagating upwards to shorebirds. Journal of Experimental Marine Biology and Ecology 338:205-221.
Sherry, T.W., R.T. Holmes. 1996. Winter habitat quality, population limitation and conservation of neotropical-nearctic migrant birds. Ecology 77:36-48.
Speybroeck, J., D. Bonte, W. Courtens, T. Gheskiere, P. Grootaert, J. Maelfait, M. Mathys, S. Provoost, K. Sabbe, E.W.M. Stienen, V. Van Lancker, M. Vincx, S. Degraer. 2006. Beach nourishment: an ecologically sound coastal defence alternative? A review. Aquatic Conservation: Marine and Freshwater Ecosystems 16:419-435.
Stillman, R.A., A.D. West, J.D. Goss-Custard, S. McGrorty, N.J. Frost, D.J. Morrisey, A.J. Kenny, A. Drewitt. 2005. Predicting site quality for shorebird communities: a case study on the Humber estuary, UK. Marine Ecology Progress Series 305:203–217.
Stucker, J.H., F.J. Cuthbert, B. Winn, B.L. Noel, S.B. Maddock, P.R. Leary, J. Cordes, L.C. Wemmer. 2010. Distribution of non-breeding Great Lakes piping plovers (Charadrius melodus) along Atlantic and Gulf of Mexico coastlines: ten years of band sightings. Waterbirds 33:22-32.
Sutherland , W.J. 1996. Predicting the Consequences of Habitat Loss for Migratory Populations. Proceedings: Biological Sciences 263:1325-1327.
Tsipoura, N., J. Burger. 1999. Shorebird Diet during Spring Migration Stopover on Delaware Bay. The Condor 101:635-644.
U.S. Fish and Wildlife Service. 1985. Endangered and Threatened Wildlife and Plants; Determination of Endangered and Threatened Status for the Piping Plover. Federal Register 50:50726-50734.
U.S. Fish and Wildlife Service. 2001. Final determination of critical habitat for the Great Lakes breeding population of the piping plover. Federal Register 66:22938-22969.
U.S. Fish and Wildlife Service. 2009. Piping plover (Charadrius melodus) five year review: summary and evaluation.
Verkuil, Y., A. Dekinga, A. Koolhaas, J. van der Winden, T. van der Have, I.I. Chernichko. 2006. Migrating Broad-billed Sandpipers achieve high fuelling rates by taking a multi-course meal. Wader Study Group Bulletin 110:15–20.
Webster, M. S., Marra, P. P., Haig, S. M., Bensch, S., Holmes, R. T. 2002. Links between worlds: unraveling migratory connectivity. Trends Ecol. Evol. 17, 76–83.
West, A.D., J.D. Goss-Custard, S. McGrorty, R.A. Stillman, , S.E.A.l.V.d. Durell, B. Stewart, P. Walker, D.W. Palmer, P. Coates. 2003. The Burry shellfishery and oystercatchers: using a behaviour-based model to advise on shellfishery management policy. Marine Ecology Progress Series 248:279–292.
West A.D., M.G. Yates, S. McGrorty, R.A. Stillman. 2007. Predicting site quality for shorebird communities: A case study on the Wash embayment, UK. Ecological Modelling 202:527-539.

46
Wilber, D.H., D.G. Clarke, G.L. Ray, M. Burlas. 2003. Response of surf zone fish to beach nourishment operations on the northern coast of New Jersey, USA. Marine Ecology Progress Series 250:231-246. Zonick, C., M. Ryan. 1996. The ecology and conservation of piping plovers
(Charadrius melodus) wintering along the Texas Gulf Coast. Annual Report. Department of Fisheries and Wildlife, University of Missouri, Columbia, Missouri. 49pp.

Island Site Season Year Collection Date Status Habitat TypeBird Key 1 Spring 2006 4/19/2006 Occupied ProtectedBird Key 2 Spring 2006 4/19/2006 Occupied ProtectedBird Key 1 Fall 2006 8/21/2006 Abandoned ProtectedBird Key 2 Fall 2006 8/21/2006 Abandoned ProtectedBird Key 3 Fall 2006 8/21/2006 Occupied ProtectedBird Key 4 Fall 2006 8/21/2006 Occupied ExposedBird Key 3 Spring 2007 3/29/2007 Occupied ProtectedBird Key 4 Spring 2007 3/29/2007 Abandoned ExposedBird Key 5 Spring 2007 3/29/2007 Occupied ProtectedBird Key 3 Fall 2007 9/5/2007 Abandoned ProtectedBird Key 5 Fall 2007 9/5/2007 Abandoned ProtectedBird Key 6 Fall 2007 9/5/2007 Occupied ExposedBird Key 7 Fall 2007 9/5/2007 Occupied ExposedBird Key 6 Spring 2008 4/1/2008 Abandoned ExposedBird Key 7 Spring 2008 4/1/2008 Abandoned ExposedBird Key 8 Spring 2008 4/1/2008 Occupied ProtectedBird Key 9 Spring 2008 4/1/2008 Occupied ExposedBird Key 8 Fall 2008 9/10/2008 Abandoned ProtectedBird Key 9 Fall 2008 9/10/2008 Occupied ExposedBird Key 10 Fall 2008 9/10/2008 Occupied ExposedBird Key 11 Fall 2008 9/10/2008 Occupied ProtectedBird Key 9 Spring 2009 4/1/2009 Occupied ExposedBird Key 10 Spring 2009 4/1/2009 Abandoned ExposedBird Key 11 Spring 2009 4/1/2009 Occupied ProtectedBird Key 12 Spring 2009 4/1/2009 Occupied ExposedBird Key 9 Fall 2009 9/29/2009 Abandoned ExposedBird Key 11 Fall 2009 9/29/2009 Occupied ProtectedBird Key 12 Fall 2009 9/29/2009 Abandoned ExposedBird Key 13 Fall 2009 9/29/2009 Occupied ExposedBird Key 11 Spring 2010 4/7/2010 Abandoned ProtectedBird Key 13 Spring 2010 4/7/2010 Occupied ExposedBird Key 14 Spring 2010 4/7/2010 Occupied ProtectedBird Key 13 Fall 2010 9/16/2010 Abandoned ExposedBird Key 14 Fall 2010 9/16/2010 Abandoned ProtectedBird Key 15 Fall 2010 9/16/2010 Occupied ExposedBird Key 16 Fall 2010 9/16/2010 Occupied ExposedBird Key 15 Spring 2011 4/12/2011 Abandoned ExposedBird Key 16 Spring 2011 4/12/2011 Abandoned ExposedBird Key 17 Spring 2011 4/12/2011 Occupied ExposedKiawah 1 Spring 2006 4/19/2006 Occupied ProtectedKiawah 2 Spring 2006 4/19/2006 Occupied ProtectedKiawah 3 Spring 2006 4/19/2006 Occupied Protected
Appendix 1. Foraging sites sampled on Kiawah Island and Bird Key between 2006 and 2011.
47
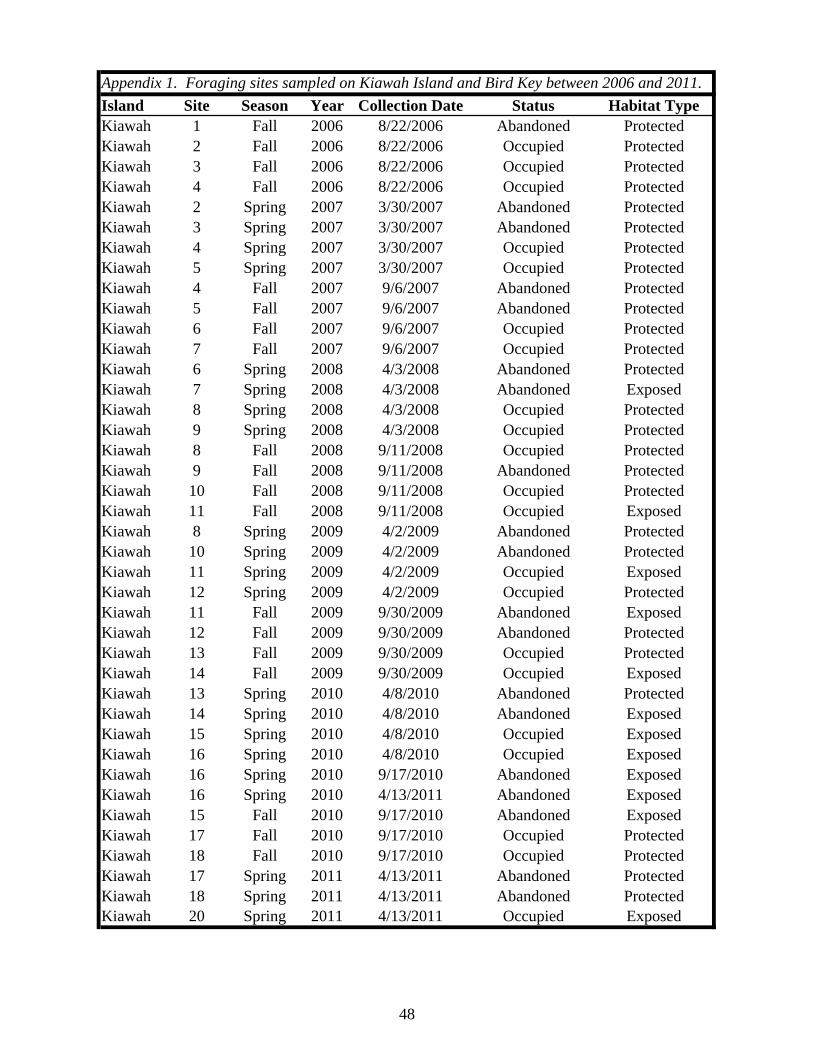
Island Site Season Year Collection Date Status Habitat TypeKiawah 1 Fall 2006 8/22/2006 Abandoned ProtectedKiawah 2 Fall 2006 8/22/2006 Occupied ProtectedKiawah 3 Fall 2006 8/22/2006 Occupied ProtectedKiawah 4 Fall 2006 8/22/2006 Occupied ProtectedKiawah 2 Spring 2007 3/30/2007 Abandoned ProtectedKiawah 3 Spring 2007 3/30/2007 Abandoned ProtectedKiawah 4 Spring 2007 3/30/2007 Occupied ProtectedKiawah 5 Spring 2007 3/30/2007 Occupied ProtectedKiawah 4 Fall 2007 9/6/2007 Abandoned ProtectedKiawah 5 Fall 2007 9/6/2007 Abandoned ProtectedKiawah 6 Fall 2007 9/6/2007 Occupied ProtectedKiawah 7 Fall 2007 9/6/2007 Occupied ProtectedKiawah 6 Spring 2008 4/3/2008 Abandoned ProtectedKiawah 7 Spring 2008 4/3/2008 Abandoned ExposedKiawah 8 Spring 2008 4/3/2008 Occupied ProtectedKiawah 9 Spring 2008 4/3/2008 Occupied ProtectedKiawah 8 Fall 2008 9/11/2008 Occupied ProtectedKiawah 9 Fall 2008 9/11/2008 Abandoned ProtectedKiawah 10 Fall 2008 9/11/2008 Occupied ProtectedKiawah 11 Fall 2008 9/11/2008 Occupied ExposedKiawah 8 Spring 2009 4/2/2009 Abandoned ProtectedKiawah 10 Spring 2009 4/2/2009 Abandoned ProtectedKiawah 11 Spring 2009 4/2/2009 Occupied ExposedKiawah 12 Spring 2009 4/2/2009 Occupied ProtectedKiawah 11 Fall 2009 9/30/2009 Abandoned ExposedKiawah 12 Fall 2009 9/30/2009 Abandoned ProtectedKiawah 13 Fall 2009 9/30/2009 Occupied ProtectedKiawah 14 Fall 2009 9/30/2009 Occupied ExposedKiawah 13 Spring 2010 4/8/2010 Abandoned ProtectedKiawah 14 Spring 2010 4/8/2010 Abandoned ExposedKiawah 15 Spring 2010 4/8/2010 Occupied ExposedKiawah 16 Spring 2010 4/8/2010 Occupied ExposedKiawah 16 Spring 2010 9/17/2010 Abandoned ExposedKiawah 16 Spring 2010 4/13/2011 Abandoned ExposedKiawah 15 Fall 2010 9/17/2010 Abandoned ExposedKiawah 17 Fall 2010 9/17/2010 Occupied ProtectedKiawah 18 Fall 2010 9/17/2010 Occupied ProtectedKiawah 17 Spring 2011 4/13/2011 Abandoned ProtectedKiawah 18 Spring 2011 4/13/2011 Abandoned ProtectedKiawah 20 Spring 2011 4/13/2011 Occupied Exposed
Appendix 1. Foraging sites sampled on Kiawah Island and Bird Key between 2006 and 2011.
48
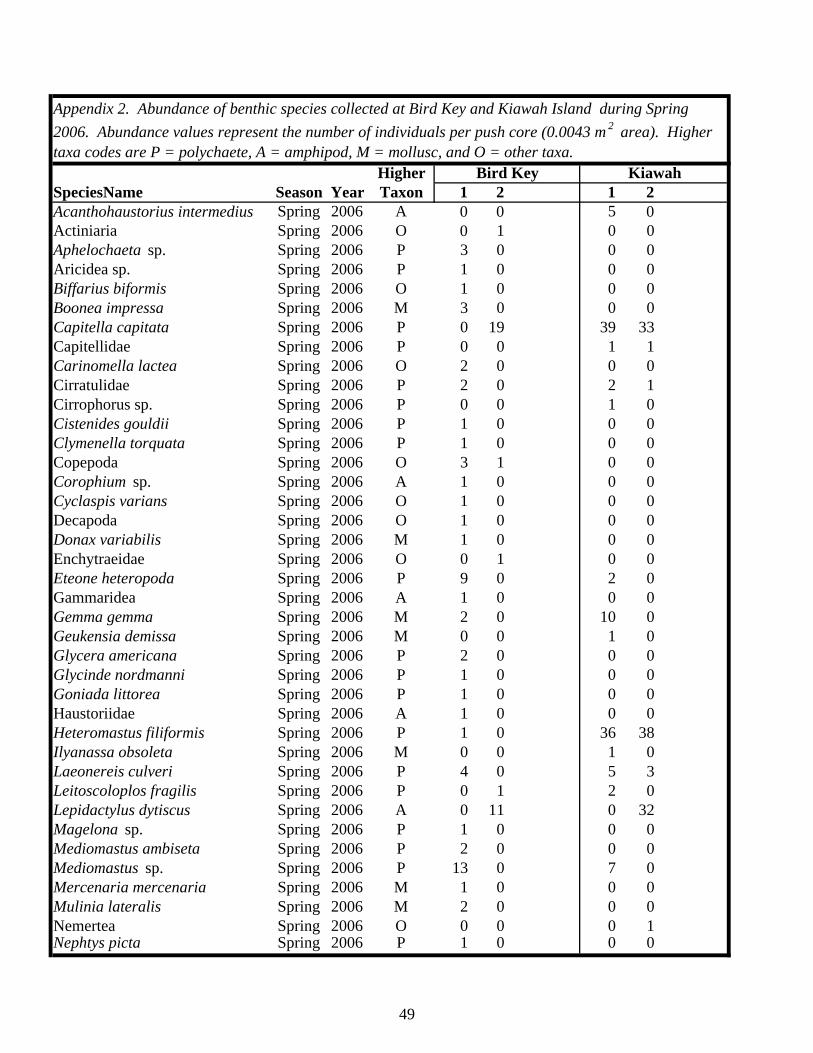
HigherSpeciesName Season Year Taxon 1 2 1 2Acanthohaustorius intermedius Spring 2006 A 0 0 5 0Actiniaria Spring 2006 O 0 1 0 0Aphelochaeta sp. Spring 2006 P 3 0 0 0Aricidea sp. Spring 2006 P 1 0 0 0Biffarius biformis Spring 2006 O 1 0 0 0Boonea impressa Spring 2006 M 3 0 0 0Capitella capitata Spring 2006 P 0 19 39 33Capitellidae Spring 2006 P 0 0 1 1Carinomella lactea Spring 2006 O 2 0 0 0Cirratulidae Spring 2006 P 2 0 2 1Cirrophorus sp. Spring 2006 P 0 0 1 0Cistenides gouldii Spring 2006 P 1 0 0 0Clymenella torquata Spring 2006 P 1 0 0 0Copepoda Spring 2006 O 3 1 0 0Corophium sp. Spring 2006 A 1 0 0 0Cyclaspis varians Spring 2006 O 1 0 0 0Decapoda Spring 2006 O 1 0 0 0Donax variabilis Spring 2006 M 1 0 0 0Enchytraeidae Spring 2006 O 0 1 0 0Eteone heteropoda Spring 2006 P 9 0 2 0Gammaridea Spring 2006 A 1 0 0 0Gemma gemma Spring 2006 M 2 0 10 0Geukensia demissa Spring 2006 M 0 0 1 0Glycera americana Spring 2006 P 2 0 0 0Glycinde nordmanni Spring 2006 P 1 0 0 0Goniada littorea Spring 2006 P 1 0 0 0Haustoriidae Spring 2006 A 1 0 0 0Heteromastus filiformis Spring 2006 P 1 0 36 38Ilyanassa obsoleta Spring 2006 M 0 0 1 0Laeonereis culveri Spring 2006 P 4 0 5 3Leitoscoloplos fragilis Spring 2006 P 0 1 2 0Lepidactylus dytiscus Spring 2006 A 0 11 0 32Magelona sp. Spring 2006 P 1 0 0 0Mediomastus ambiseta Spring 2006 P 2 0 0 0Mediomastus sp. Spring 2006 P 13 0 7 0Mercenaria mercenaria Spring 2006 M 1 0 0 0Mulinia lateralis Spring 2006 M 2 0 0 0Nemertea Spring 2006 O 0 0 0 1Nephtys picta Spring 2006 P 1 0 0 0
Appendix 2. Abundance of benthic species collected at Bird Key and Kiawah Island during Spring
2006. Abundance values represent the number of individuals per push core (0.0043 m 2 area). Higher taxa codes are P = polychaete, A = amphipod, M = mollusc, and O = other taxa.
Bird Key Kiawah
49

HigherSpeciesName Season Year Taxon 1 2 1 2Nereididae Spring 2006 P 8 1 0 0Nereis succinea Spring 2006 P 0 2 1 1Oxyurostylis smithi Spring 2006 O 0 1 0 0Paraonis fulgens Spring 2006 P 8 1 7 0Pinnixa sp. Spring 2006 O 1 0 0 0Polydora cornuta Spring 2006 P 1 0 0 0Pseudohaustorius caroliniensis Spring 2006 A 1 0 0 0Spionidae Spring 2006 P 3 2 3 0Spiophanes bombyx Spring 2006 P 3 0 0 0Streblospio benedicti Spring 2006 P 88 2 24 0Tellinidae Spring 2006 M 1 0 1 0Tharyx acutus Spring 2006 P 0 0 4 0
Appendix 2. Abundance of benthic species collected at Bird Key and Kiawah Island during Spring
2006. Abundance values represent the number of individuals per push core (0.0043 m 2 area). Higher taxa codes are P = polychaete, A = amphipod, M = mollusc, and O = other taxa.
Bird Key Kiawah
50
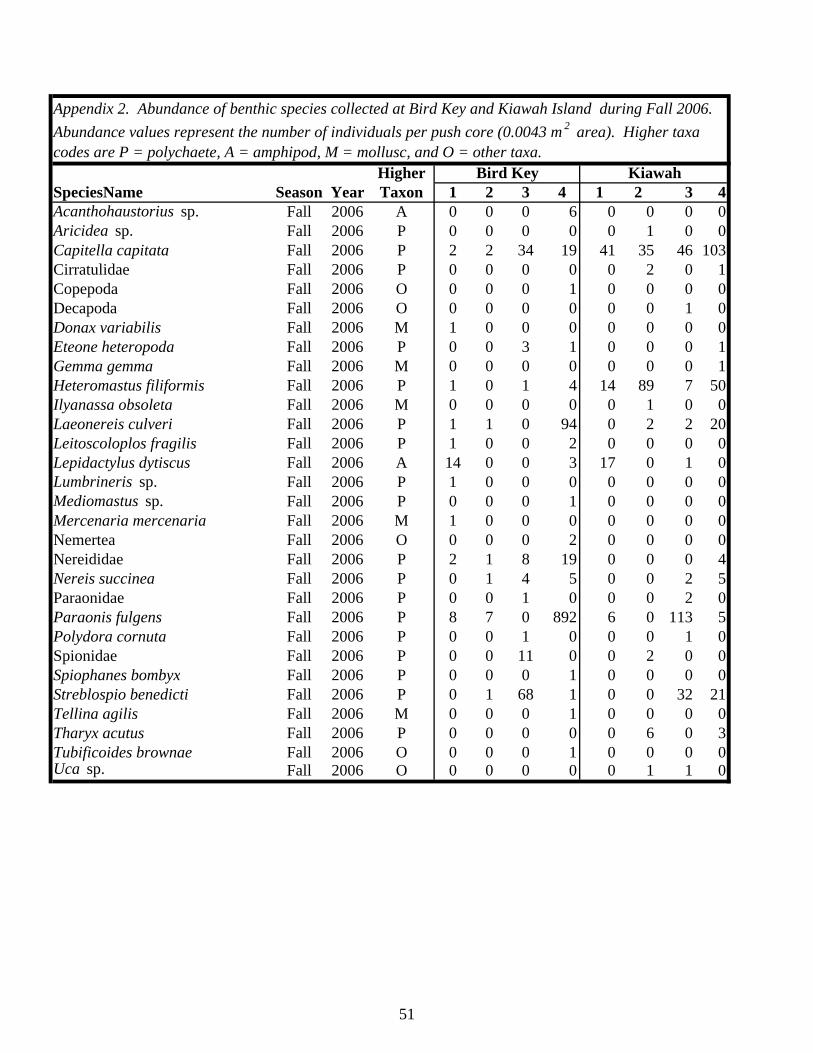
HigherSpeciesName Season Year Taxon 1 2 3 4 1 2 3 4Acanthohaustorius sp. Fall 2006 A 0 0 0 6 0 0 0 0Aricidea sp. Fall 2006 P 0 0 0 0 0 1 0 0Capitella capitata Fall 2006 P 2 2 34 19 41 35 46 103Cirratulidae Fall 2006 P 0 0 0 0 0 2 0 1Copepoda Fall 2006 O 0 0 0 1 0 0 0 0Decapoda Fall 2006 O 0 0 0 0 0 0 1 0Donax variabilis Fall 2006 M 1 0 0 0 0 0 0 0Eteone heteropoda Fall 2006 P 0 0 3 1 0 0 0 1Gemma gemma Fall 2006 M 0 0 0 0 0 0 0 1Heteromastus filiformis Fall 2006 P 1 0 1 4 14 89 7 50Ilyanassa obsoleta Fall 2006 M 0 0 0 0 0 1 0 0Laeonereis culveri Fall 2006 P 1 1 0 94 0 2 2 20Leitoscoloplos fragilis Fall 2006 P 1 0 0 2 0 0 0 0Lepidactylus dytiscus Fall 2006 A 14 0 0 3 17 0 1 0Lumbrineris sp. Fall 2006 P 1 0 0 0 0 0 0 0Mediomastus sp. Fall 2006 P 0 0 0 1 0 0 0 0Mercenaria mercenaria Fall 2006 M 1 0 0 0 0 0 0 0Nemertea Fall 2006 O 0 0 0 2 0 0 0 0Nereididae Fall 2006 P 2 1 8 19 0 0 0 4Nereis succinea Fall 2006 P 0 1 4 5 0 0 2 5Paraonidae Fall 2006 P 0 0 1 0 0 0 2 0Paraonis fulgens Fall 2006 P 8 7 0 892 6 0 113 5Polydora cornuta Fall 2006 P 0 0 1 0 0 0 1 0Spionidae Fall 2006 P 0 0 11 0 0 2 0 0Spiophanes bombyx Fall 2006 P 0 0 0 1 0 0 0 0Streblospio benedicti Fall 2006 P 0 1 68 1 0 0 32 21Tellina agilis Fall 2006 M 0 0 0 1 0 0 0 0Tharyx acutus Fall 2006 P 0 0 0 0 0 6 0 3Tubificoides brownae Fall 2006 O 0 0 0 1 0 0 0 0Uca sp. Fall 2006 O 0 0 0 0 0 1 1 0
Appendix 2. Abundance of benthic species collected at Bird Key and Kiawah Island during Fall 2006.
Abundance values represent the number of individuals per push core (0.0043 m 2 area). Higher taxa codes are P = polychaete, A = amphipod, M = mollusc, and O = other taxa.
Bird Key Kiawah
51

HigherSpeciesName Season Year Taxon 3 4 5 2 3 4 5Abra aequalis Spring 2007 M 0 0 1 0 0 0 0Actiniaria Spring 2007 O 0 0 2 0 0 0 0Aphelochaeta sp. Spring 2007 P 10 0 26 0 0 0 0Capitella capitata Spring 2007 P 143 32 416 17 11 215 150Capitellidae Spring 2007 P 0 3 1 0 0 0 0Cirratulidae Spring 2007 P 1 1 16 0 2 1 0Drilonereis sp. Spring 2007 P 0 1 0 0 0 0 0Eteone heteropoda Spring 2007 P 24 3 37 0 4 1 0Gastropoda Spring 2007 M 0 0 0 0 0 1 0Gemma gemma Spring 2007 M 0 1 0 0 0 0 0Glycera americana Spring 2007 P 0 0 1 0 0 0 0Haustoriidae Spring 2007 A 2 0 0 0 0 0 0Heteromastus filiformis Spring 2007 P 1 3 0 6 2 19 0Ilyanassa obsoleta Spring 2007 M 0 0 0 0 0 1 0Laeonereis culveri Spring 2007 P 116 73 316 1 24 139 100Leitoscoloplos fragilis Spring 2007 P 0 2 3 0 4 0 0Lepidactylus dytiscus Spring 2007 A 0 4 0 0 0 0 0Macoma tenta Spring 2007 M 0 0 0 0 1 0 1Mediomastus ambiseta Spring 2007 P 1 0 5 0 6 1 0Mediomastus sp. Spring 2007 P 3 7 15 2 6 0 0Mercenaria mercenaria Spring 2007 M 1 0 1 0 1 1 0Nemertea Spring 2007 O 1 0 4 0 1 0 1Nereididae Spring 2007 P 1 0 0 0 0 1 0Nereis succinea Spring 2007 P 106 1 66 0 34 25 39Oligochaeta Spring 2007 O 0 0 0 0 1 0 1Paraonis fulgens Spring 2007 P 0 870 11 18 2 7 4Pelecypoda Spring 2007 M 0 0 0 0 0 5 0Pinnixa sayana Spring 2007 O 0 1 0 0 0 0 0Polydora cornuta Spring 2007 P 4 5 1 0 6 2 12Polydora sp. Spring 2007 P 1 0 0 0 0 0 0Spionidae Spring 2007 P 1 0 0 0 0 0 0Spiophanes bombyx Spring 2007 P 0 3 1 0 0 0 0Streblospio benedicti Spring 2007 P 325 2 131 0 322 35 306Terebellidae Spring 2007 P 0 8 0 0 0 0 0Tharyx acutus Spring 2007 P 0 0 19 0 0 0 3
Appendix 2. Abundance of benthic species collected at Bird Key and Kiawah Island during Spring
2007. Abundance values represent the number of individuals per push core (0.0043 m 2 area). Higher taxa codes are P = polychaete, A = amphipod, M = mollusc, and O = other taxa.
Bird Key Kiawah
52
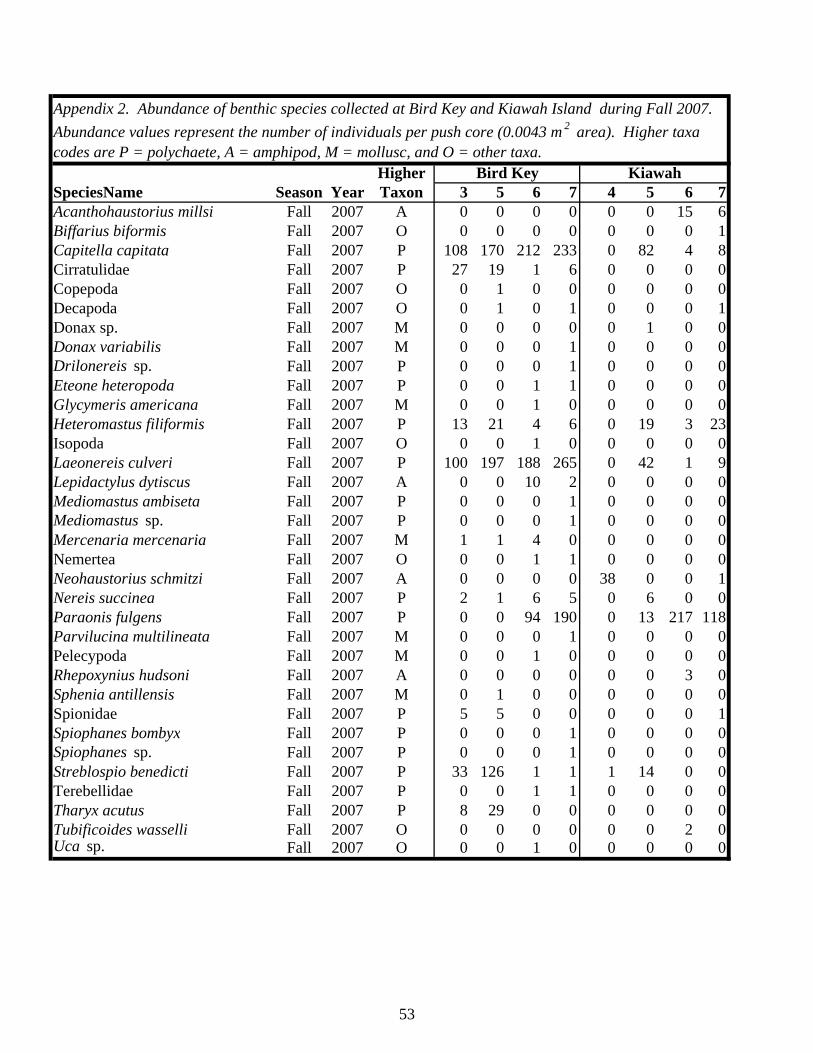
HigherSpeciesName Season Year Taxon 3 5 6 7 4 5 6 7Acanthohaustorius millsi Fall 2007 A 0 0 0 0 0 0 15 6Biffarius biformis Fall 2007 O 0 0 0 0 0 0 0 1Capitella capitata Fall 2007 P 108 170 212 233 0 82 4 8Cirratulidae Fall 2007 P 27 19 1 6 0 0 0 0Copepoda Fall 2007 O 0 1 0 0 0 0 0 0Decapoda Fall 2007 O 0 1 0 1 0 0 0 1Donax sp. Fall 2007 M 0 0 0 0 0 1 0 0Donax variabilis Fall 2007 M 0 0 0 1 0 0 0 0Drilonereis sp. Fall 2007 P 0 0 0 1 0 0 0 0Eteone heteropoda Fall 2007 P 0 0 1 1 0 0 0 0Glycymeris americana Fall 2007 M 0 0 1 0 0 0 0 0Heteromastus filiformis Fall 2007 P 13 21 4 6 0 19 3 23Isopoda Fall 2007 O 0 0 1 0 0 0 0 0Laeonereis culveri Fall 2007 P 100 197 188 265 0 42 1 9Lepidactylus dytiscus Fall 2007 A 0 0 10 2 0 0 0 0Mediomastus ambiseta Fall 2007 P 0 0 0 1 0 0 0 0Mediomastus sp. Fall 2007 P 0 0 0 1 0 0 0 0Mercenaria mercenaria Fall 2007 M 1 1 4 0 0 0 0 0Nemertea Fall 2007 O 0 0 1 1 0 0 0 0Neohaustorius schmitzi Fall 2007 A 0 0 0 0 38 0 0 1Nereis succinea Fall 2007 P 2 1 6 5 0 6 0 0Paraonis fulgens Fall 2007 P 0 0 94 190 0 13 217 118Parvilucina multilineata Fall 2007 M 0 0 0 1 0 0 0 0Pelecypoda Fall 2007 M 0 0 1 0 0 0 0 0Rhepoxynius hudsoni Fall 2007 A 0 0 0 0 0 0 3 0Sphenia antillensis Fall 2007 M 0 1 0 0 0 0 0 0Spionidae Fall 2007 P 5 5 0 0 0 0 0 1Spiophanes bombyx Fall 2007 P 0 0 0 1 0 0 0 0Spiophanes sp. Fall 2007 P 0 0 0 1 0 0 0 0Streblospio benedicti Fall 2007 P 33 126 1 1 1 14 0 0Terebellidae Fall 2007 P 0 0 1 1 0 0 0 0Tharyx acutus Fall 2007 P 8 29 0 0 0 0 0 0Tubificoides wasselli Fall 2007 O 0 0 0 0 0 0 2 0Uca sp. Fall 2007 O 0 0 1 0 0 0 0 0
Appendix 2. Abundance of benthic species collected at Bird Key and Kiawah Island during Fall 2007.
Abundance values represent the number of individuals per push core (0.0043 m 2 area). Higher taxa codes are P = polychaete, A = amphipod, M = mollusc, and O = other taxa.
Bird Key Kiawah
53

HigherSpeciesName Season Year Taxon 6 7 8 9 7 8 9Acanthohaustorius millsi Spring 2008 A 0 0 0 0 0 0 8Acteocina canaliculata Spring 2008 M 0 0 0 0 0 0 1Arachnida Spring 2008 O 0 1 0 0 0 0 0Bhawania heteroseta Spring 2008 P 0 0 0 0 0 0 1Capitella capitata Spring 2008 P 54 0 86 131 1 8 0Capitellidae Spring 2008 P 0 0 0 2 0 0 0Carinomella lactea Spring 2008 O 0 0 0 0 0 0 2Cirratulidae Spring 2008 P 1 0 24 3 0 3 3Corbula contracta Spring 2008 M 0 0 0 1 0 0 0Eteone heteropoda Spring 2008 P 0 0 2 0 0 0 6Gastropoda Spring 2008 M 0 0 0 0 0 1 0Gemma gemma Spring 2008 M 0 0 0 0 0 0 1Glycera americana Spring 2008 P 0 0 0 0 0 3 2Glycymeris americana Spring 2008 M 0 0 2 0 0 0 0Haustoriidae Spring 2008 A 0 0 0 0 0 1 1Heteromastus filiformis Spring 2008 P 3 0 1 3 3 7 0Ilyanassa obsoleta Spring 2008 M 0 0 0 0 0 1 0Laeonereis culveri Spring 2008 P 7 0 53 117 1 4 15Leitoscoloplos fragilis Spring 2008 P 0 0 3 1 0 0 1Lepidactylus dytiscus Spring 2008 A 4 0 0 42 21 3 0Lumbrineridae Spring 2008 P 0 0 0 0 0 0 1Mediomastus ambiseta Spring 2008 P 0 0 12 0 0 0 177Mediomastus sp. Spring 2008 P 0 0 15 1 1 3 3Mercenaria mercenaria Spring 2008 M 4 0 2 2 0 0 0Monticellina sp. Spring 2008 P 0 0 0 0 0 0 13Nemertea Spring 2008 O 0 0 0 1 0 0 2Neohaustorius schmitzi Spring 2008 A 0 26 0 0 2 0 23Nereis succinea Spring 2008 P 1 0 6 1 0 1 0Oxyurostylis smithi Spring 2008 O 0 0 0 0 0 3 8Paraonis fulgens Spring 2008 P 297 1 1 379 44 156 123Polydora cornuta Spring 2008 P 0 0 3 2 0 0 0Protohaustorius deichmannae Spring 2008 A 0 0 0 0 0 1 0Sayella sp. Spring 2008 M 0 0 3 0 0 0 0Scolelepis sp. Spring 2008 P 0 0 0 0 0 2 0Scolelepis texana Spring 2008 P 0 0 0 0 0 0 1Scoletoma sp. Spring 2008 P 0 0 0 0 0 0 1Spionidae Spring 2008 P 0 0 0 0 0 1 0Spiophanes bombyx Spring 2008 P 0 0 0 1 0 6 7Stenothoe sp. Spring 2008 A 0 0 0 0 0 0 1
Appendix 2. Abundance of benthic species collected at Bird Key and Kiawah Island during Spring
2008. Abundance values represent the number of individuals per push core (0.0043 m 2 area). Higher taxa codes are P = polychaete, A = amphipod, M = mollusc, and O = other taxa.
Bird Key Kiawah
54

HigherSpeciesName Season Year Taxon 6 7 8 9 7 8 9Streblospio benedicti Spring 2008 P 0 0 67 2 3 18 28Tellina agilis Spring 2008 M 1 0 2 0 0 5 5Tellinidae Spring 2008 M 0 0 2 0 0 0 0Tharyx acutus Spring 2008 P 0 2 630 0 0 0 4Tubificidae Spring 2008 O 0 0 3 0 0 0 0Tubificoides brownae Spring 2008 O 0 0 0 0 0 0 12
Appendix 2. Abundance of benthic species collected at Bird Key and Kiawah Island during Spring
2008. Abundance values represent the number of individuals per push core (0.0043 m 2 area). Higher taxa codes are P = polychaete, A = amphipod, M = mollusc, and O = other taxa.
Bird Key Kiawah
55

HigherSpeciesName Season Year Taxon 8 9 10 11 8 9 10 11Acanthohaustorius intermedius Fall 2008 A 0 1 0 0 0 0 0 0Acanthohaustorius sp. Fall 2008 A 0 0 0 0 46 0 3 0Aligena elevata Fall 2008 M 0 0 0 0 0 0 1 0Capitella capitata Fall 2008 P 6 15 8 2 0 9 3 0Carinomella lactea Fall 2008 O 0 0 0 0 0 1 0 0Chiridotea coeca Fall 2008 O 0 0 0 0 1 0 0 3Cirratulidae Fall 2008 P 5 0 0 5 0 0 0 0Decapoda Fall 2008 O 0 0 0 1 1 0 0 0Donax variabilis Fall 2008 M 0 0 0 0 0 0 1 116Gemma gemma Fall 2008 M 0 0 0 0 0 1 0 0Glycymeris americana Fall 2008 M 0 0 0 1 0 0 0 0Goniadidae Fall 2008 P 0 0 0 1 0 0 0 0Haustoriidae Fall 2008 A 0 0 0 0 0 0 2 0Heteromastus filiformis Fall 2008 P 5 3 0 3 3 9 4 0Ilyanassa obsoleta Fall 2008 M 0 0 0 0 0 2 0 0Laeonereis culveri Fall 2008 P 6 91 34 6 1 2 3 1Leitoscoloplos fragilis Fall 2008 P 0 0 1 0 0 0 0 0Lepidactylus dytiscus Fall 2008 A 0 2 4 0 47 0 3 2Listriella clymenellae Fall 2008 A 1 0 0 0 0 0 0 0Mediomastus ambiseta Fall 2008 P 0 0 0 2 0 0 0 0Mediomastus sp. Fall 2008 P 0 0 0 0 0 16 0 0Mercenaria mercenaria Fall 2008 M 1 3 0 0 0 0 0 0Mulinia lateralis Fall 2008 M 0 0 0 0 1 0 0 0Nemertea Fall 2008 O 0 0 0 0 1 0 1 0Neohaustorius schmitzi Fall 2008 A 0 0 0 0 0 0 0 160Nereis succinea Fall 2008 P 1 3 0 0 0 1 0 0Oligochaeta Fall 2008 O 0 0 0 0 0 1 0 0Orbiniidae Fall 2008 P 0 2 1 0 0 0 0 0Paraonis fulgens Fall 2008 P 0 223 4 30 180 8 248 0Paraprionospio pinnata Fall 2008 P 0 0 0 0 0 1 0 0Pelecypoda Fall 2008 M 0 0 0 1 1 0 0 0Protohaustorius deichmannae Fall 2008 A 0 0 0 0 2 0 1 0Pseudohaustorius caroliniensis Fall 2008 A 1 0 0 0 0 0 0 0Scoletoma tenuis Fall 2008 P 0 0 0 0 0 0 2 0Streblospio benedicti Fall 2008 P 101 0 2 53 0 73 0 0Tharyx acutus Fall 2008 P 4 0 0 3 0 7 0 0Tubificoides brownae Fall 2008 O 0 0 0 0 0 14 0 0
Appendix 2. Abundance of benthic species collected at Bird Key and Kiawah Island during Fall 2008.
Abundance values represent the number of individuals per push core (0.0043 m 2 area). Higher taxa codes are P = polychaete, A = amphipod, M = mollusc, and O = other taxa.
Bird Key Kiawah
56

HigherSpeciesName Season Year Taxon 9 10 11 12 8 10 11 12Acanthohaustorius sp. Spring 2009 A 0 1 0 0 11 0 0 0Acteocina canaliculata Spring 2009 M 0 0 1 0 0 0 0 0Ampelisca sp. Spring 2009 A 0 0 1 0 0 0 0 0Capitella capitata Spring 2009 P 1 13 1 8 8 0 1 4Capitellidae Spring 2009 P 0 0 2 0 1 0 0 0Chiridotea coeca Spring 2009 O 0 0 0 0 1 0 0 0Cirratulidae Spring 2009 P 0 13 2 0 0 0 0 0Cochliolepis parasitica Spring 2009 M 1 0 0 0 0 0 0 0Copepoda Spring 2009 O 0 0 2 0 0 0 0 0Donax variabilis Spring 2009 M 0 0 0 0 0 0 13 0Eteone heteropoda Spring 2009 P 0 0 0 0 0 0 0 4Eteone lactea Spring 2009 P 0 0 1 0 0 0 0 0Gastropoda Spring 2009 M 0 0 1 0 0 0 0 0Gemma gemma Spring 2009 M 0 1 0 0 0 0 0 1Haustoriidae Spring 2009 A 0 2 0 0 5 0 2 0Haustorius canadensis Spring 2009 A 0 0 0 0 0 0 7 0Heteromastus filiformis Spring 2009 P 0 1 0 0 1 0 0 2Ilyanassa obsoleta Spring 2009 M 0 0 0 0 0 0 0 1Laeonereis culveri Spring 2009 P 0 59 1 0 0 0 0 0Leitoscoloplos fragilis Spring 2009 P 1 2 69 11 0 0 0 0Leitoscoloplos sp. Spring 2009 P 0 1 0 0 0 0 0 0Lepidactylus dytiscus Spring 2009 A 93 3 49 31 7 0 0 0Mediomastus ambiseta Spring 2009 P 0 2 2 0 0 0 0 0Mediomastus sp. Spring 2009 P 0 10 3 1 0 0 0 2Mercenaria mercenaria Spring 2009 M 0 0 1 0 0 0 0 0Nemertea Spring 2009 O 1 8 0 0 0 0 0 0Neohaustorius schmitzi Spring 2009 A 7 0 0 0 55 1 96 1Nephtys picta Spring 2009 P 0 0 0 0 1 0 0 0Nereis succinea Spring 2009 P 0 20 0 1 0 0 0 5Opheliidae Spring 2009 P 0 1 0 0 0 0 0 0Paraonis fulgens Spring 2009 P 122 69 56 4 89 2 0 1Pelecypoda Spring 2009 M 0 0 1 0 0 0 0 0Pinnixa sp. Spring 2009 O 0 1 0 0 0 0 0 1Polydora cornuta Spring 2009 P 0 16 0 0 0 0 0 1Protohaustorius deichmannae Spring 2009 A 0 1 0 0 0 0 3 0Protohaustorius wigleyi Spring 2009 A 2 0 0 0 0 0 0 0Pseudohaustorius caroliniensis Spring 2009 A 0 0 0 0 0 0 0 11Scoletoma tenuis Spring 2009 P 1 0 0 0 0 0 0 0Spiophanes bombyx Spring 2009 P 0 6 0 0 1 0 0 0
Appendix 2. Abundance of benthic species collected at Bird Key and Kiawah Island during Spring
2009. Abundance values represent the number of individuals per push core (0.0043 m 2 area). Higher taxa codes are P = polychaete, A = amphipod, M = mollusc, and O = other taxa.
Bird Key Kiawah
57
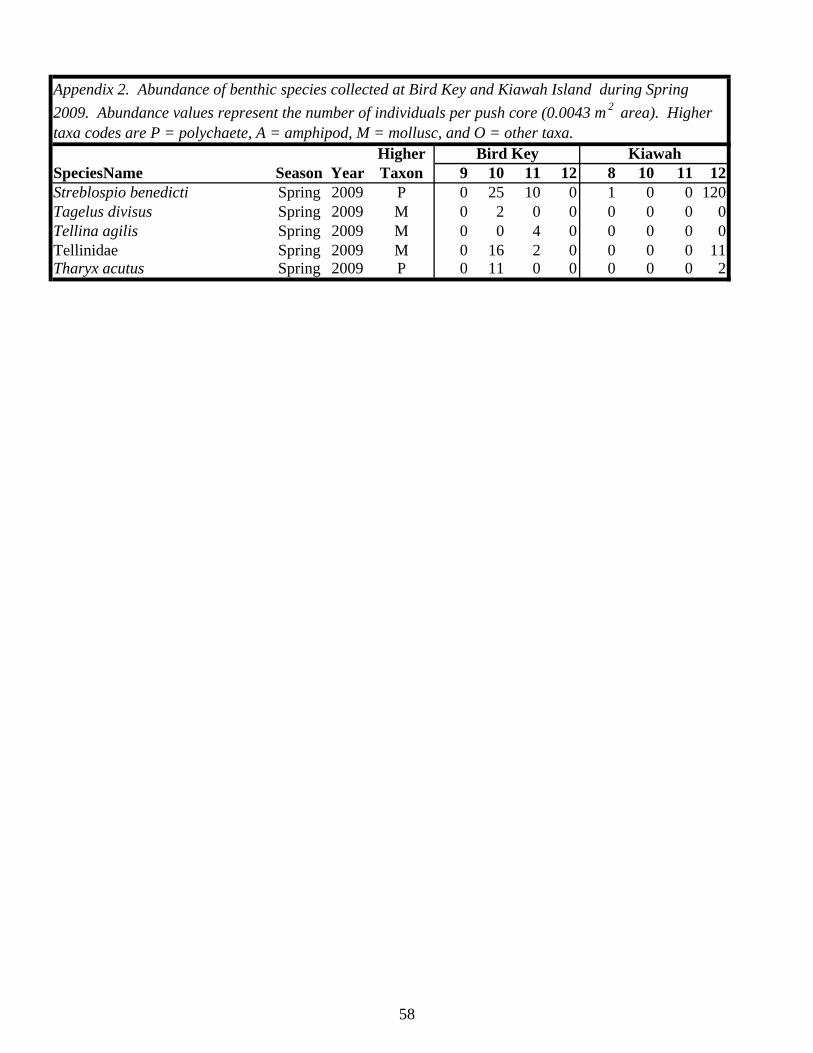
HigherSpeciesName Season Year Taxon 9 10 11 12 8 10 11 12Streblospio benedicti Spring 2009 P 0 25 10 0 1 0 0 120Tagelus divisus Spring 2009 M 0 2 0 0 0 0 0 0Tellina agilis Spring 2009 M 0 0 4 0 0 0 0 0Tellinidae Spring 2009 M 0 16 2 0 0 0 0 11Tharyx acutus Spring 2009 P 0 11 0 0 0 0 0 2
Appendix 2. Abundance of benthic species collected at Bird Key and Kiawah Island during Spring
2009. Abundance values represent the number of individuals per push core (0.0043 m 2 area). Higher taxa codes are P = polychaete, A = amphipod, M = mollusc, and O = other taxa.
Bird Key Kiawah
58

HigherSpeciesName Season Year Taxon 9 10 11 12 11 12 13 14Acanthohaustorius intermedius Fall 2009 A 0 0 0 0 0 2 0 0Acanthohaustorius sp. Fall 2009 A 0 0 0 0 0 1 18 0Ampelisca verrilli Fall 2009 A 0 0 0 0 0 0 1 0Anadara transversa Fall 2009 M 0 0 0 0 0 1 0 0Aricidea sp. Fall 2009 P 0 9 0 0 0 0 0 0Biffarius biformis Fall 2009 O 0 2 0 0 0 0 0 0Capitella capitata Fall 2009 P 0 5 20 0 0 1 69 0Capitellidae Fall 2009 P 0 0 0 0 0 0 1 0Carinomella lactea Fall 2009 O 0 1 0 0 0 0 0 0Chiridotea coeca Fall 2009 O 0 0 0 0 0 0 0 1Copepoda Fall 2009 O 0 0 0 0 0 0 0 2Cumacea Fall 2009 O 0 0 0 0 0 0 0 1Cyclaspis varians Fall 2009 O 0 0 0 0 0 0 1 0Decapoda Fall 2009 O 0 0 0 0 0 0 0 1Donax variabilis Fall 2009 M 0 0 0 41 0 0 0 112Drilonereis sp. Fall 2009 P 0 0 0 0 0 1 0 0Gemma gemma Fall 2009 M 0 0 2 0 0 0 0 0Glycera americana Fall 2009 P 0 1 0 0 0 0 0 0Glycinde solitaria Fall 2009 P 0 3 0 0 0 0 1 0Goniadidae Fall 2009 P 0 1 0 0 0 0 0 0Haustoriidae Fall 2009 A 0 0 1 0 0 0 0 0Haustorius canadensis Fall 2009 A 3 0 0 0 0 0 0 0Heteromastus filiformis Fall 2009 P 0 0 3 0 0 3 0 0Ilyanassa obsoleta Fall 2009 M 0 0 0 0 0 3 6 0Laeonereis culveri Fall 2009 P 0 5 1 0 0 20 78 2Leitoscoloplos fragilis Fall 2009 P 0 0 0 0 1 1 1 1Lepidactylus dytiscus Fall 2009 A 0 0 0 0 0 0 8 0Lumbrineris sp. Fall 2009 P 0 0 0 0 0 0 1 0Mediomastus sp. Fall 2009 P 0 21 0 0 0 1 6 0Mercenaria mercenaria Fall 2009 M 0 0 1 0 0 0 0 0Metharpinia floridana Fall 2009 A 0 0 0 0 0 1 0 0Microprotopus raneyi Fall 2009 A 0 0 0 0 0 0 0 1Mulinia lateralis Fall 2009 M 0 2 0 0 0 3 11 5Nemertea Fall 2009 O 0 2 0 0 0 0 0 0Neohaustorius schmitzi Fall 2009 A 31 0 0 63 13 1 0 15Nereididae Fall 2009 P 0 1 0 0 0 0 0 0Parahaustorius sp. Fall 2009 A 0 0 12 9 0 0 0 7Paraonis fulgens Fall 2009 P 0 8 1 3 0 102 113 10Pelecypoda Fall 2009 M 0 1 0 0 0 2 0 0
Appendix 2. Abundance of benthic species collected at Bird Key and Kiawah Island during Fall 2009.
Abundance values represent the number of individuals per push core (0.0043 m 2 area). Higher taxa codes are P = polychaete, A = amphipod, M = mollusc, and O = other taxa.
Bird Key Kiawah
59

HigherSpeciesName Season Year Taxon 9 10 11 12 11 12 13 14Pinnixa sp. Fall 2009 O 0 2 0 0 0 0 3 0Platyhelminthes Fall 2009 O 0 2 0 0 0 0 0 0Scolelepis sp. Fall 2009 P 0 3 0 0 0 0 0 0Scoletoma tenuis Fall 2009 P 0 0 0 0 0 2 0 0Scoloplos sp. Fall 2009 P 0 1 0 0 0 0 0 0Spionidae Fall 2009 P 0 1 0 0 0 0 0 0Streblospio benedicti Fall 2009 P 0 31 26 0 0 14 3 0Tellinidae Fall 2009 M 0 8 0 0 0 1 14 0Tharyx acutus Fall 2009 P 0 47 0 0 0 0 0 0Tiron triocellatus Fall 2009 A 0 0 0 0 0 1 0 0Uca sp. Fall 2009 O 0 0 7 0 0 0 0 0
Appendix 2. Abundance of benthic species collected at Bird Key and Kiawah Island during Fall 2009.
Abundance values represent the number of individuals per push core (0.0043 m 2 area). Higher taxa codes are P = polychaete, A = amphipod, M = mollusc, and O = other taxa.
Bird Key Kiawah
60
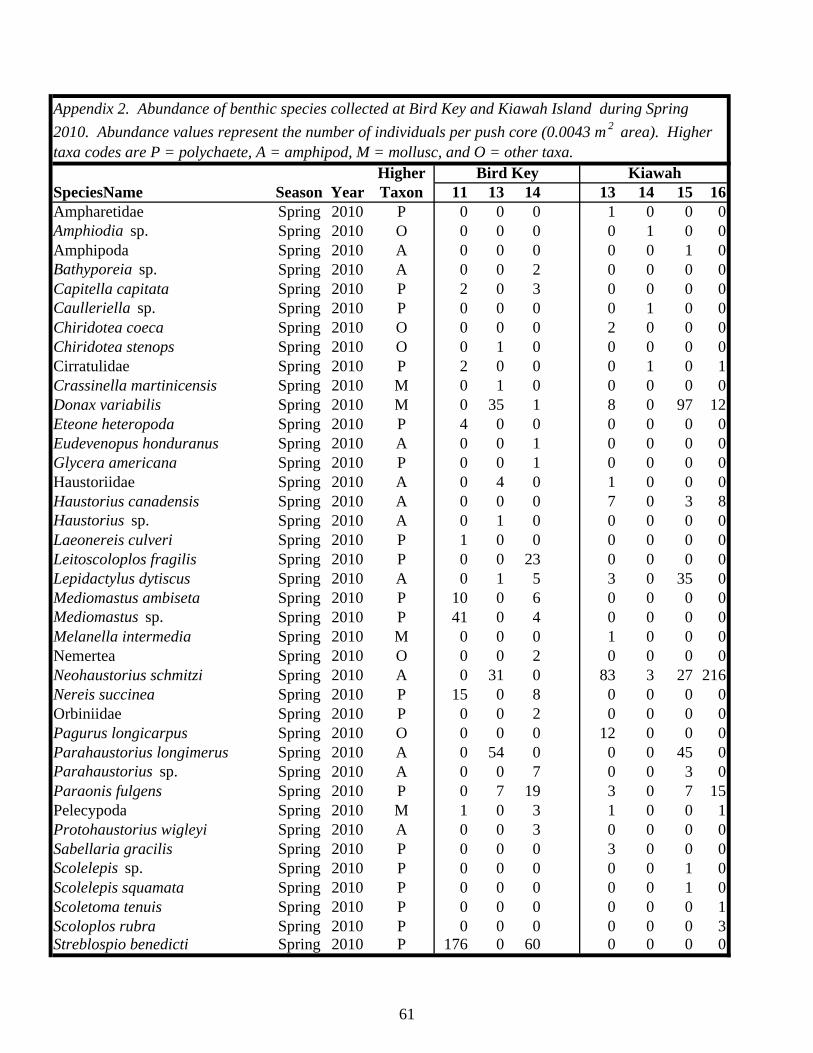
HigherSpeciesName Season Year Taxon 11 13 14 13 14 15 16Ampharetidae Spring 2010 P 0 0 0 1 0 0 0Amphiodia sp. Spring 2010 O 0 0 0 0 1 0 0Amphipoda Spring 2010 A 0 0 0 0 0 1 0Bathyporeia sp. Spring 2010 A 0 0 2 0 0 0 0Capitella capitata Spring 2010 P 2 0 3 0 0 0 0Caulleriella sp. Spring 2010 P 0 0 0 0 1 0 0Chiridotea coeca Spring 2010 O 0 0 0 2 0 0 0Chiridotea stenops Spring 2010 O 0 1 0 0 0 0 0Cirratulidae Spring 2010 P 2 0 0 0 1 0 1Crassinella martinicensis Spring 2010 M 0 1 0 0 0 0 0Donax variabilis Spring 2010 M 0 35 1 8 0 97 12Eteone heteropoda Spring 2010 P 4 0 0 0 0 0 0Eudevenopus honduranus Spring 2010 A 0 0 1 0 0 0 0Glycera americana Spring 2010 P 0 0 1 0 0 0 0Haustoriidae Spring 2010 A 0 4 0 1 0 0 0Haustorius canadensis Spring 2010 A 0 0 0 7 0 3 8Haustorius sp. Spring 2010 A 0 1 0 0 0 0 0Laeonereis culveri Spring 2010 P 1 0 0 0 0 0 0Leitoscoloplos fragilis Spring 2010 P 0 0 23 0 0 0 0Lepidactylus dytiscus Spring 2010 A 0 1 5 3 0 35 0Mediomastus ambiseta Spring 2010 P 10 0 6 0 0 0 0Mediomastus sp. Spring 2010 P 41 0 4 0 0 0 0Melanella intermedia Spring 2010 M 0 0 0 1 0 0 0Nemertea Spring 2010 O 0 0 2 0 0 0 0Neohaustorius schmitzi Spring 2010 A 0 31 0 83 3 27 216Nereis succinea Spring 2010 P 15 0 8 0 0 0 0Orbiniidae Spring 2010 P 0 0 2 0 0 0 0Pagurus longicarpus Spring 2010 O 0 0 0 12 0 0 0Parahaustorius longimerus Spring 2010 A 0 54 0 0 0 45 0Parahaustorius sp. Spring 2010 A 0 0 7 0 0 3 0Paraonis fulgens Spring 2010 P 0 7 19 3 0 7 15Pelecypoda Spring 2010 M 1 0 3 1 0 0 1Protohaustorius wigleyi Spring 2010 A 0 0 3 0 0 0 0Sabellaria gracilis Spring 2010 P 0 0 0 3 0 0 0Scolelepis sp. Spring 2010 P 0 0 0 0 0 1 0Scolelepis squamata Spring 2010 P 0 0 0 0 0 1 0Scoletoma tenuis Spring 2010 P 0 0 0 0 0 0 1Scoloplos rubra Spring 2010 P 0 0 0 0 0 0 3Streblospio benedicti Spring 2010 P 176 0 60 0 0 0 0
Appendix 2. Abundance of benthic species collected at Bird Key and Kiawah Island during Spring
2010. Abundance values represent the number of individuals per push core (0.0043 m 2 area). Higher taxa codes are P = polychaete, A = amphipod, M = mollusc, and O = other taxa.
Bird Key Kiawah
61
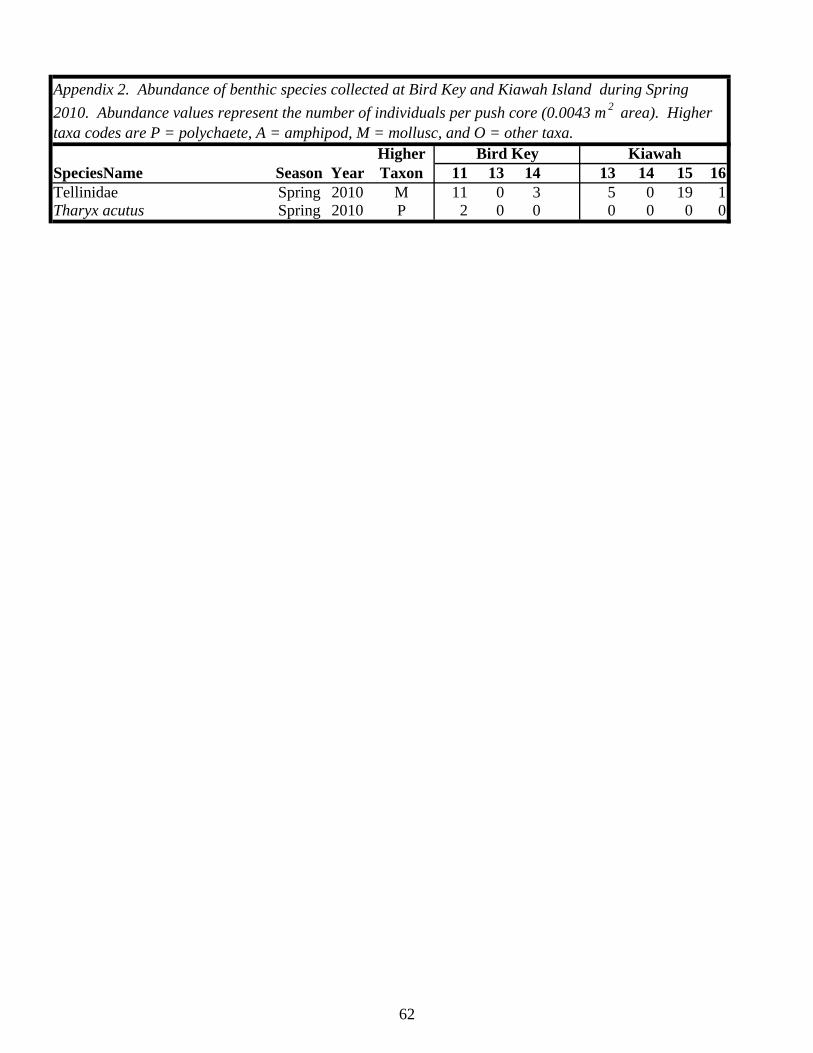
HigherSpeciesName Season Year Taxon 11 13 14 13 14 15 16Tellinidae Spring 2010 M 11 0 3 5 0 19 1Tharyx acutus Spring 2010 P 2 0 0 0 0 0 0
Appendix 2. Abundance of benthic species collected at Bird Key and Kiawah Island during Spring
2010. Abundance values represent the number of individuals per push core (0.0043 m 2 area). Higher taxa codes are P = polychaete, A = amphipod, M = mollusc, and O = other taxa.
Bird Key Kiawah
62

HigherSpeciesName Season Year Taxon 13 14 15 16 15 16 17 18Acanthohaustorius sp. Fall 2010 A 12 4 112 0 2 8 8 0Amastigos caperatus Fall 2010 P 0 0 0 0 0 0 0 1Amphipoda Fall 2010 A 0 0 0 1 0 0 0 0Capitellidae Fall 2010 P 0 0 0 0 0 0 0 2Cirratulidae Fall 2010 P 0 0 0 0 0 0 0 1Cumacea Fall 2010 O 0 0 0 1 0 0 0 0Decapoda Fall 2010 O 0 0 0 0 0 0 0 1Donax variabilis Fall 2010 M 0 0 5 97 130 91 3 1Eteone heteropoda Fall 2010 P 0 0 0 0 0 0 0 6Gemma gemma Fall 2010 M 0 6 0 0 0 0 0 0Haustoriidae Fall 2010 A 0 0 1 0 1 0 0 1Heteromastus filiformis Fall 2010 P 0 1 0 0 0 0 0 1Laeonereis culveri Fall 2010 P 0 1 0 0 1 2 42 87Leitoscoloplos fragilis Fall 2010 P 1 1 0 0 0 0 10 2Leitoscoloplos sp. Fall 2010 P 0 0 1 0 0 0 0 0Lepidactylus dytiscus Fall 2010 A 0 0 5 12 0 10 41 0Mediomastus ambiseta Fall 2010 P 0 0 0 0 0 0 0 2Mediomastus sp. Fall 2010 P 0 0 0 0 0 0 0 6Mercenaria mercenaria Fall 2010 M 0 1 0 0 0 0 0 0Nemertea Fall 2010 O 0 0 2 1 0 0 0 1Neohaustorius schmitzi Fall 2010 A 127 1 3 178 15 146 1 3Nereididae Fall 2010 P 0 0 0 0 1 0 0 0Nereis succinea Fall 2010 P 0 2 0 0 0 0 2 5Ogyrides alphaerostris Fall 2010 O 0 0 2 0 0 0 1 0Parahaustorius longimerus Fall 2010 A 0 0 5 0 6 0 0 0Paraonis fulgens Fall 2010 P 54 4 21 9 8 4 95 212Pelecypoda Fall 2010 M 0 0 0 1 0 0 2 3Protohaustorius bousfieldi Fall 2010 A 0 0 0 0 2 0 0 0Protohaustorius deichmannae Fall 2010 A 0 0 0 1 0 0 0 0Protohaustorius sp. Fall 2010 A 0 0 15 0 0 0 0 0Scolelepis bousfieldi Fall 2010 P 0 0 0 0 2 0 0 0Scolelepis sp. Fall 2010 P 0 0 0 0 0 0 0 1Scoletoma tenuis Fall 2010 P 0 0 0 0 0 0 0 2Scoloplos sp. Fall 2010 P 0 0 0 0 0 0 1 1Spionidae Fall 2010 P 0 0 0 0 1 0 0 0Streblospio benedicti Fall 2010 P 0 10 1 0 0 0 0 58Tellinidae Fall 2010 M 2 5 3 14 0 22 0 2Tubificidae Fall 2010 O 0 1 0 0 0 0 0 0
Appendix 2. Abundance of benthic species collected at Bird Key and Kiawah Island during Fall 2010.
Abundance values represent the number of individuals per push core (0.0043 m 2 area). Higher taxa codes are P = polychaete, A = amphipod, M = mollusc, and O = other taxa.
Bird Key Kiawah
63

HigherSpeciesName Season Year Taxon 15 16 17 17 18 20Aglaophamus verrilli Spring 2011 P 0 1 0 0 0 0Amastigos caperatus Spring 2011 P 0 1 0 0 0 0Capitella capitata Spring 2011 P 0 0 0 3 27 0Capitellidae Spring 2011 P 1 0 0 4 0 0Cirriformi a sp. Spring 2011 P 0 1 0 0 0 0Donax variabilis Spring 2011 M 0 0 0 0 0 7Edotia montosa Spring 2011 O 0 1 0 0 0 0Eteone heteropoda Spring 2011 P 0 4 2 0 0 0Gammarus mucronatus Spring 2011 A 1 0 0 0 0 0Glycera americana Spring 2011 P 0 2 0 0 0 0Haustorius canadensis Spring 2011 A 0 0 0 0 0 1Heteromastus filiformis Spring 2011 P 0 2 0 6 8 0Laeonereis culveri Spring 2011 P 0 0 0 26 9 0Lepidactylus dytiscus Spring 2011 A 1 1 14 2 38 7Mediomastus sp. Spring 2011 P 0 2 1 4 7 0Mulinia lateralis Spring 2011 M 0 2 0 0 0 0Nemertea Spring 2011 O 1 3 0 3 0 1Neohaustorius schmitzi Spring 2011 A 11 1 239 5 74 57Nereis succinea Spring 2011 P 0 0 0 4 0 0Oxyurostylis smithi Spring 2011 O 0 0 1 0 0 0Parahaustoriu s sp. Spring 2011 A 0 0 1 0 0 7Paraonis fulgens Spring 2011 P 3 141 53 2 11 2Pettiboneia sp. Spring 2011 P 0 2 0 0 0 0Polydora cornuta Spring 2011 P 0 0 0 2 1 0Polydora socialis Spring 2011 P 0 0 0 1 0 0Protohaustorius wigleyi Spring 2011 A 0 0 0 0 0 11Spiophanes bombyx Spring 2011 P 0 2 0 0 0 0Streblospio benedicti Spring 2011 P 0 4 2 17 7 0Synchelidium americanum Spring 2011 A 0 0 0 0 0 1Tellinidae Spring 2011 M 0 1 0 0 0 0
Appendix 2. Abundance of benthic species collected at Bird Key and Kiawah Island during Spring
2011. Abundance values represent the number of individuals per push core (0.0043 m 2 area). Higher taxa codes are P = polychaete, A = amphipod, M = mollusc, and O = other taxa.
Bird Key Kiawah
64