final report port fairy east beach coastal erosion ... · port fairy east beach coastal erosion...
TRANSCRIPT

Final Report
Port Fairy East BeachCoastal Erosion Engineering and Feasibility Study
March 2007

G:\ADMIN\B16206.G.MJA\R.B16206.001.03.DOC 3/4/07 13:04
PORT FAIRY
EAST BEACH Coastal Erosion
Engineering & Feasibility
Study
Prepared For: Moyne Shire Council
Prepared By: WBM Pty Ltd (Member of the BMT group of companies)
Offices
Brisbane Denver
Karratha Melbourne
Morwell Newcastle
Perth Sydney
Vancouver

G:\ADMIN\B16206.G.MJA\R.B16206.001.03.DOC 3/4/07 11:04
DOCUMENT CONTROL SHEET
Document :
Project Manager :
R.B16206.001.03.doc
Dean Patterson
WBM Pty Ltd Brisbane Office: WBM Pty Ltd Level 11, 490 Upper Edward Street SPRING HILL QLD 4004 Australia PO Box 203 Spring Hill QLD 4004 Telephone (07) 3831 6744 Facsimile (07) 3832 3627 www.wbmpl.com.au ABN 54 010 830 421 002
Client :
Client Contact:
Client Reference
Moyne Shire Council
Greg Anders
MS 596 Title : PORT FAIRY - EAST BEACH - Coastal Erosion Engineering & Feasibility Study
Author : Dean Patterson
Synopsis : Report outlining the status of erosion and coastal management of East Beach and consideration of options and feasibility of engineering works to overcome the existing erosion problems.
REVISION/CHECKING HISTORY
REVISION NUMBER
DATE OF ISSUE CHECKED BY ISSUED BY
0
1
2
3
Working draft only
25/1/2007
13/2/2007
31/3/2007
C L Witt
C L Witt
C L Witt
D C Patterson
D C Patterson
D C Patterson
D C Patterson
DISTRIBUTION
DESTINATION REVISION
0 1 2 3
Moyne Council
WBM File
WBM Library
- Pdf + 2 copies
1
1
Pdf + 2 copies
1
Pdf + 2 copies
1

CONTENTS I
G:\ADMIN\B16206.G.MJA\R.B16206.001.03.DOC 3/4/07 11:04
CONTENTS
Contents i List of Figures iii List of Tables iii
1 INTRODUCTION 1-1
1.1 Background 1-1 1.2 Development History 1-2
1.2.1 Geological Framework 1-2 1.2.2 Port Development 1-3 1.2.3 Sand Accumulation at the Mouth of the Moyne River 1-4 1.2.4 On-going Effects 1-5 1.2.5 Wind Blown Sand Losses 1-6
1.3 Coastal Management Requirements 1-6
2 COASTAL PROCESSES & CAUSES OF EROSION 2-1
2.1 General Considerations 2-1 2.2 Understanding of Coastal Processes at East Beach 2-2
2.2.1 Sand Transport Mechanisms 2-2 2.2.2 Sand Transport Processes and Beach Dynamics 2-2 2.2.3 East Beach Erosion 2-3
2.3 Research Investigations of East Beach 2-4 2.3.1 Previous Investigations 2-4 2.3.2 Uncertainty of Present and Future Trends 2-8 2.3.3 Modelling of Coastal Processes 2-10
2.4 Consideration of Climate Change Scenarios 2-13
3 COASTLINE MANAGEMENT CONSIDERATIONS 3-1
3.1 Beach Erosion 3-1 3.2 Generic Option Considerations 3-1 3.3 Decision Matrix 3-3 3.4 Options for East Beach 3-4
3.4.1 General Considerations 3-4 3.4.1.1 Undeveloped Areas 3-4

CONTENTS II
G:\ADMIN\B16206.G.MJA\R.B16206.001.03.DOC 3/4/07 11:04
3.4.1.2 Areas With Existing Development Under Long Term Erosion Threat 3-6 3.4.1.3 Areas With Existing Development under Immediate or Short Term Erosion Threat 3-6
3.4.2 Structural Protection Options 3-10 3.4.2.1 Seawalls 3-10 3.4.2.2 Groynes and Artificial Headlands 3-11 3.4.2.3 Offshore Breakwaters and Submerged Reefs 3-12
3.4.3 Beach Nourishment Options 3-14 3.4.3.1 Nourishment Alone 3-15 3.4.3.2 Nourishment with Control Structures 3-16 3.4.3.3 Nourishment with Terminal Protection (Seawalls) 3-16
3.5 Material Sources and Costing Considerations 3-17 3.5.1 Coastal Structures 3-17 3.5.2 Beach Nourishment 3-18
3.5.2.1 Offshore Marine Sand Sources 3-19 3.5.2.2 Griffiths Island Area 3-20 3.5.2.3 Land-based Sand Sources 3-23
4 EAST BEACH RESTORATION AND MANAGEMENT 4-1
4.1 Strategy and Objectives 4-1 4.2 Option Feasibility Assessment 4-2 4.3 Seawall Upgrade 4-4
4.3.1 Required Works 4-4 4.3.2 Engineering Feasibility 4-5 4.3.3 Works Program and Cost Estimate 4-5
4.4 Beach Restoration 4-7 4.4.1 Overview 4-7 4.4.2 Removal of Existing Timber Groynes 4-7 4.4.3 Beach Nourishment Design Requirements 4-8 4.4.4 Beach Nourishment Feasibility 4-9 4.4.5 Dune Rehabilitation and Management 4-9 4.4.6 Impacts of Climate Change and Sea Level Rise 4-10
4.5 Beach Nourishment Works Program 4-10 4.5.1 Beach Restoration 4-10 4.5.2 Ongoing Sand Bypassing From Lighthouse Beach 4-11 4.5.3 Training Wall Structure 4-12 4.5.4 Associated Works at Griffiths Island 4-12 4.5.5 Investigation and Review Program 4-13

LIST OF FIGURES III
G:\ADMIN\B16206.G.MJA\R.B16206.001.03.DOC 3/4/07 11:04
4.6 Recommended Planning and Regulatory Controls 4-14 4.6.1 East Beach Management and Beach Access 4-14 4.6.2 Activities in Undeveloped Dune Areas 4-15
4.7 Works and Investigation Program and Cost Estimate 4-15
5 REFERENCES 5-1
LIST OF FIGURES
Figure 1-1 East Beach 1-1 Figure 2-1 Original Shoreline and Sand Deposition Areas at Griffiths Island 2-6 Figure 2-2 Moyne River & East Beach Approx 1904 2-6 Figure 2-3 East Beach Approx 1920 2-6 Figure 2-4 Erosion into East Beach Main Dune Approx 1930 2-7 Figure 2-5 Commencement of Rock Seawall Construction at Surf Club (1965) 2-7 Figure 2-6 Rock Seawall Extended Past Connolly Street (2006) 2-7 Figure 2-7 Wave Characteristics in Deep Water South of Port Fairy 2-11 Figure 2-8 Numerical Model Extent, Bathymetry and Computational Grid Mesh 2-11 Figure 2-9 Typical Wave Propagation Patterns - Left: SW Waves; Right:
SE Waves 2-12 Figure 2-10 Modelled Sand Transport Pattern – SW Waves 2-12 Figure 3-1 Typical Survey Cross-Sections along East Beach 3-7 Figure 3-2 Typical Groyne Behaviour 3-11 Figure 3-3 Typical Breakwater Behaviour 3-13 Figure 3-4 Typical Beach Nourishment Profile 3-14 Figure 3-5 Lighthouse Beach 3-21 Figure 3-6 SW Passage and Puddney Ground Sand Deposits 3-21 Figure 4-1 Section of Seawall of Sub-Standard Construction 4-2 Figure 4-2 Northern End of Seawall of Sub-Standard Construction 4-2 Figure 4-3 Typical Seawall Design Section 4-4 Figure 4-4 Conceptual Seawall End Configuration 4-5 Figure 4-5 Distribution of Sand Across the Nearshore Profile
(Conceptual Only) 4-8 Figure 4-6 Conceptual Design Placement of Sand 4-11 Figure 4-7 Work Program and Cost Estimate 4-16
LIST OF TABLES
Table 3-1 Matrix of Beach System Management Options 3-3

LIST OF TABLES IV
G:\ADMIN\B16206.G.MJA\R.B16206.001.03.DOC 3/4/07 11:04
Table 4-1 Summary of Seawall Structural Status and Upgrade Works Required 4-6
Table 4-2 Summary of recommended restoration and management actions for East Beach 4-17

INTRODUCTION 1-1
G:\ADMIN\B16206.G.MJA\R.B16206.001.03.DOC 3/4/07 11:04
1 INTRODUCTION
1.1 Background
East Beach at Port Fairy is located at the southern end of Port Fairy Bay (Figure 1-1). It faces southeast and thus is directly exposed to southeast winds prevailing during summer months, while receiving some protection from heavy southwest winds during winter. The beach is backed by a substantial dune over 8 metres in height. The beach is bound to the south by the training walls of the Moyne River entrance and sweeps in a smooth curve to Reef Point at its north-eastern end.
East Beach
Port Fairy
GriffithsIsland
Moyne River
SW Passage
Lighthouse Beach
N
~ 1 kmLydia Place
Surf Club
Connolly St
Manifold StRitchie St
Battery La.
Rogers Pl.
End of Seawall
East Beach
Port Fairy
GriffithsIsland
Moyne River
SW Passage
Lighthouse Beach
N
~ 1 kmLydia Place
Surf Club
Connolly St
Manifold StRitchie St
Battery La.
Rogers Pl.
End of Seawall
Figure 1-1 East Beach
East Beach is a popular sandy beach used for surfing, swimming, walking and jogging. Because of the shelter offered by the Griffiths Island headland and adjacent river breakwaters, wave conditions are generally mild at the southern end, which is popular and safe for swimming. The northern end is more exposed to the prevailing winds and waves and is frequented by more active swimmers and surfboard riders. Surf club facilities are provided at the central part of the beach, at Hughes Avenue, together with carparking and recreational park areas on the foreshore. At present the beach is particularly narrow in the area from about Lydia Place to Connolly Street.
Most of the East Beach dune is in private ownership as residential land. While a road easement is proclaimed along the seaward crest of the dune (Beach Road), the road has been built only in one section (Beach Street) immediately north from the surf club. It appears that much of the road easement has been lost through erosion. In an attempt to protect the residential development and
INTRODUCTION 1-2
G:\ADMIN\B16206.G.MJA\R.B16206.001.03.DOC 3/4/07 11:04
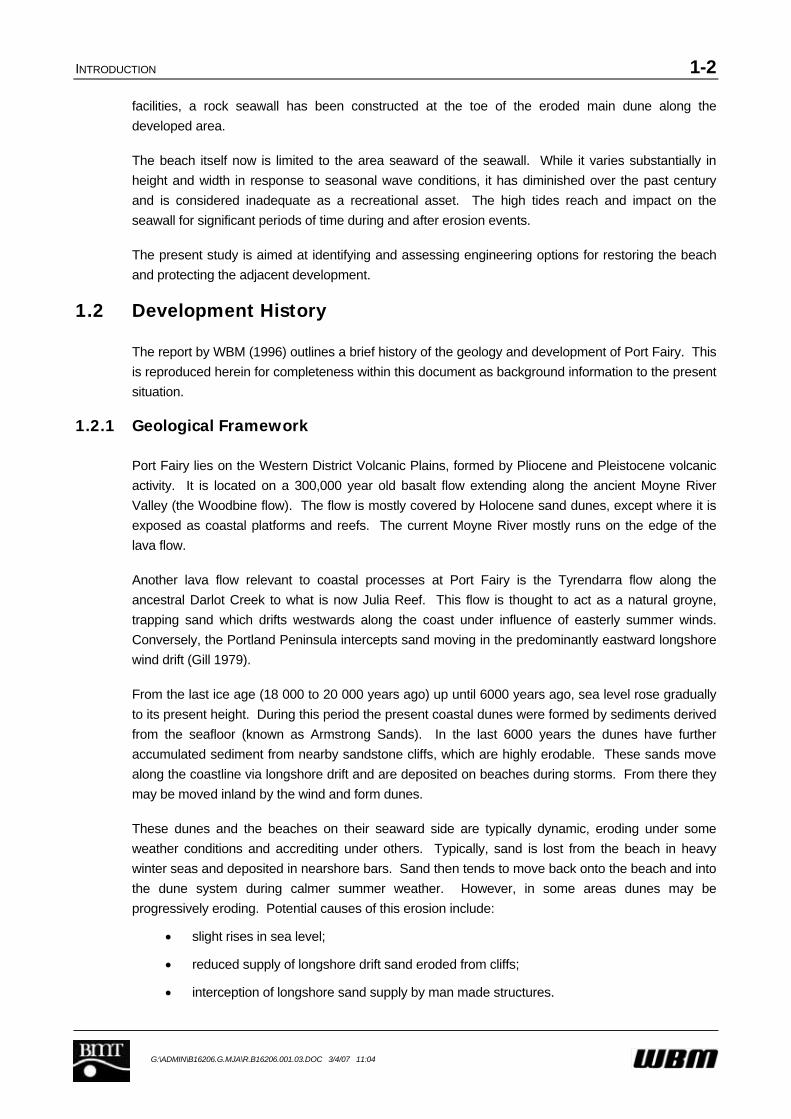
facilities, a rock seawall has been constructed at the toe of the eroded main dune along the developed area.
The beach itself now is limited to the area seaward of the seawall. While it varies substantially in height and width in response to seasonal wave conditions, it has diminished over the past century and is considered inadequate as a recreational asset. The high tides reach and impact on the seawall for significant periods of time during and after erosion events.
The present study is aimed at identifying and assessing engineering options for restoring the beach and protecting the adjacent development.
1.2 Development History
The report by WBM (1996) outlines a brief history of the geology and development of Port Fairy. This is reproduced herein for completeness within this document as background information to the present situation.
1.2.1 Geological Framework
Port Fairy lies on the Western District Volcanic Plains, formed by Pliocene and Pleistocene volcanic activity. It is located on a 300,000 year old basalt flow extending along the ancient Moyne River Valley (the Woodbine flow). The flow is mostly covered by Holocene sand dunes, except where it is exposed as coastal platforms and reefs. The current Moyne River mostly runs on the edge of the lava flow.
Another lava flow relevant to coastal processes at Port Fairy is the Tyrendarra flow along the ancestral Darlot Creek to what is now Julia Reef. This flow is thought to act as a natural groyne, trapping sand which drifts westwards along the coast under influence of easterly summer winds. Conversely, the Portland Peninsula intercepts sand moving in the predominantly eastward longshore wind drift (Gill 1979).
From the last ice age (18 000 to 20 000 years ago) up until 6000 years ago, sea level rose gradually to its present height. During this period the present coastal dunes were formed by sediments derived from the seafloor (known as Armstrong Sands). In the last 6000 years the dunes have further accumulated sediment from nearby sandstone cliffs, which are highly erodable. These sands move along the coastline via longshore drift and are deposited on beaches during storms. From there they may be moved inland by the wind and form dunes.
These dunes and the beaches on their seaward side are typically dynamic, eroding under some weather conditions and accrediting under others. Typically, sand is lost from the beach in heavy winter seas and deposited in nearshore bars. Sand then tends to move back onto the beach and into the dune system during calmer summer weather. However, in some areas dunes may be progressively eroding. Potential causes of this erosion include:
• slight rises in sea level;
• reduced supply of longshore drift sand eroded from cliffs;
• interception of longshore sand supply by man made structures.

INTRODUCTION 1-3
G:\ADMIN\B16206.G.MJA\R.B16206.001.03.DOC 3/4/07 11:04
1.2.2 Port Development
In order to place the current problem at East Beach into context and to identify possible causes of the beach erosion, it is necessary to briefly summarise the history of events that may be influencing coastal processes in the area. Chief among these events is the development and maintenance of the Port of Port Fairy. While there is extensive historical information relating to the harbour itself, there is very little documented information describing East Beach and changes that may have occurred there.
Port Fairy served as a whaling port from the early 1800’s and by the 1850’s was second only to Sydney as a trading port, transporting produce from local properties. In 1855 the lighthouse was erected at Griffiths Island. In these early times, all cargo had to be lightered to the larger vessels in small boats due to a lack of harbour facilities.
In 1854, John Barrow proposed that training walls be constructed to allow safe passage into the Moyne River. Barrow’s design was modified by W.H. Steel and construction commenced in 1870. The initial works consisted of:
• training walls along the river banks and extending into the bay;
• removing rock reefs to smooth river flow;
• dredging a channel through the sandbar at the mouth of the river and to the wharves upstream on the West bank.
In 1879 the design of the entrance works was modified on the advice of Sir John Coode. Coode’s recommended changes consisted of:
• widening and deepening the channel and swing basin;
• changing the line of the walls at Goat Island so that currents from the Back Passage met the main river arm more smoothly.
After visiting again in 1886, Coode recommended a further series of modifications which included closing the Southwest Passage to reduce wave-induced currents and assist the navigation of unpowered boats into the river. It seems that these changes were not made until some time after 1912, when E.M. De Burgh reviewed the harbour works. Advice from Mr Bill Digby (pers. comm.) suggests that the passage was closed around 1916.
East Beach began eroding soon after the passage was closed and was particularly bad in the 1920’s and 1930’s. After World War II the passage was temporarily opened and East Beach began to accrete, only to erode again after the passage was closed.
The entrance to the Moyne River requires dredging throughout much of the year for navigable depths to be maintained. Typically, dredging occurs for six to eight months of each year (Max Dumnesy, pers. comm.). While no detailed information is available, it is likely that 30,000-50,000m³ of sand are dredged from the river each year.
Sources of the sand that builds up in the river reportedly include:
• small amounts of sand entering the river at the entrance;
• sand moving laterally under the training walls along Battery Hill and Griffith Island;

INTRODUCTION 1-4
G:\ADMIN\B16206.G.MJA\R.B16206.001.03.DOC 3/4/07 11:04
• sand infiltrating under the causeway blocking the Southwest Passage;
• windblown sand from Griffiths Island.
Sand dredged from the main river channel is thought to always have been placed on the southern end of East Beach (Max Dumnesy, pers. comm.). Up until approximately 1990, sand dredged from the river side of the Southwest Passage was placed in the area to the southeast of Martins Point, known as the “Puddney Ground”. Since then, dredged sand from the Southwest Passage has also been placed at the southern end of East Beach.
In recent years, little dredging has been undertaken in the Southwest Passage on the river side of the causeway. Substantial sand has accumulated in this area, indicating infiltration through (or around) the causeway.
1.2.3 Sand Accumulation at the Mouth of the Moyne River
East Beach has experienced considerable change over the longer term (past 100 years) in response to construction of the Moyne River entrance breakwaters and more recent blockage of the Southwest Channel. The breakwaters were completed at the beginning of the century to train and maintain the navigable entrance channel. Their effects are likely to have included:
• Re-distribution of pre-existing natural entrance bar sand with at least some of that sand moving onto East Beach.
• Effective blocking of any pre-existing transfer of sand across the entrance to East Beach.
• Some local longshore redistribution of the sand on East Beach, causing build-up of the beach and dune near the breakwater with potentially some net loss of sand from the beach further east.
It is well known that Griffiths and Rabbit Islands were originally separated. Accumulation (and some placement) of sand has joined the two islands, such that they have been mapped as one island since at least 1925. Sand has also accumulated in other areas near the mouth or the river. A preliminary analysis of sand accumulation in various areas is outlined below (from WBM 1996).
Beach Between the South Training Wall and the Lighthouse
Examination of a 1925 map and aerial photography from 1949 to 1992 shows that this beach has advanced substantially compared with its 1843 extent. Particularly noticeable since 1949 has been the burial of a breakwater which extended from the base of the beach to the south training wall. As an estimate of the advance of the beach, its growth along the training wall can be measured by scaling its location relative to known fixed points on the photos. The resulting growth distances measured from Martins Point are shown below:
Year Distance 1925 390m 1949 447m 1960 452m 1986 468m 1992 490m

INTRODUCTION 1-5
G:\ADMIN\B16206.G.MJA\R.B16206.001.03.DOC 3/4/07 11:04
The area of beach progression is approximately 100,000 m² which (assuming an average sand depth of 3 m) contains 300,000 m³ of sand.
Puddney Ground
This area southeast of Martins Point was enclosed between the training walls and the west coast of Griffiths Island when the river entrance works were constructed. Over the years sand has accumulated due to placement of dredged material and wind-blown sand deposition. The area of the Puddney Ground is approximately 50,000 m² which contains approximately 100,000 m³ of sand.
Sandy Cove
The area southwest of Martins Point where the Sandy Cove Reserve is situated was once a shallow inlet with two narrow channels connecting the river mouth with the southern ocean coast. In 1949 and 1960 aerial photographs this area appeared to be partially vegetated, while still subject to saltwater inundation. By 1986 the area had been filled and the sports oval established. A sealed road (Ocean Drive) had been constructed along the coast with associated earthworks probably preventing seawater inundation. The area of the former Sandy Cove is approximately 54,000 m² which contains approximately 108,000 m³ of sand.
Within the Southwest Passage
The small area within the Southwest Passage that has not been dredged in recent years is approximately 17,000 m², containing approximately 34,000 m³ of sand.
Other Areas
In addition to the defined areas described above, sand has also accumulated in other areas including:
• on top of Griffiths Island
• by extension of Battery Point
While the amount of sand in these and other areas may be significant, it is difficult to quantify.
Overview
It is likely that in the absence of the breakwaters, much of the accumulated sand referred to above would have supplied East Beach. This sand has been lost from the beach system over the last century. The total amount of sand lost approaches 500,000 m³.
1.2.4 On-going Effects
The ongoing effects of the breakwaters on East Beach are uncertain. It is likely that, after such a long period of readjustment since the breakwaters were built, the beach is currently in a new essentially stable alignment - subject to the ongoing effects of short term erosion and longer term longshore sand movements. However, the natural process of sand transfer past the headland and river mouth has been permanently altered. It appears that this substantially reduced the supply of sand to East Beach, leading to erosion. There is little doubt that artificial means are needed to maintain the sand supply.

INTRODUCTION 1-6
G:\ADMIN\B16206.G.MJA\R.B16206.001.03.DOC 3/4/07 11:04
In the past, much of the sand dredged from the river channel was placed in areas outside the active beach system, representing a net loss from East Beach additional to that trapped by the breakwaters. More recently, this sand has been placed on the southern end of the beach.
Consideration needs to be given to cost-effective means of ensuring that the trapped sand is returned to the beach system in a suitable manner, and that future losses of sand from the beach are minimised.
It has been suggested that the Southwest Passage should be re-opened to allow sand to move easterly through the Passage, into the river and eventually out the river mouth onto East Beach. Modelling of the southwest wind case (WBM 1996) indicates a potential for a strong current and associated sand transport through the Southwest Passage if it were open. That modelling does not include wave forcing that would tend to further enhance sand transport.
However, consideration of removal of the causeway would need to include assessment of a range of issues including the impacts on wave and current penetration, navigation and siltation/dredging requirements in the Moyne River.
1.2.5 Wind Blown Sand Losses
East Beach is part of the larger beach system of Port Fairy Bay that extends along some 7 kilometres to the east. Historically, there have been substantial losses of sand from this area in the form of wind erosion of the dune system. This occurred particularly around the turn of the century when cattle grazing led to loss of the protective vegetative cover and extensive dune instability.
More recently, the dunes have again been stabilised by planting of Marram grass to prevent further wind erosion. However, the sand previously blown inland remains out of the active beach system. In some areas, including East beach, some of that sand is perched on top of the former hind dune crest, and would only re-enter the beach system when the dune is eroded to that extent. Furthermore, where this sand is trapped behind the rock seawall, in places under existing houses, this sand is permanently lost from the beach.
1.3 Coastal Management Requirements
Along the developed East Beach area:
• Beach amenity, access and safety are significantly diminished after erosion;
• The natural character of the beach has been altered by protective structures (rock wall and groynes);
• Public facilities and private dwellings would be under threat should the rock seawall fail during severe wave attack; and
• Beach recovery following storm erosion is slow and natural redevelopment of a sustainable recreational beach in front of the seawall is unlikely.
When the beach is eroded, waves reach the rock seawall on high tide and the dune immediately north of the seawall forms an unstable high steep dune scarp. This is potentially dangerous, particularly for small children.

INTRODUCTION 1-7
G:\ADMIN\B16206.G.MJA\R.B16206.001.03.DOC 3/4/07 11:04
These issues are likely to be exacerbated in the event of future sea level rise.
In the undeveloped area to the north, coastal processes involving longshore sand movement and erosion and accretion of the beach associated with storms and subsequent beach recovery are able to occur naturally. The beach there is in good condition and the dune system is extensive. The dune areas that had previously been destabilised by wind and grazing of livestock has been planted with marram grass to prevent wind erosion. As noted by Rosengren (2005), foredunes with abundant native Spinifex grass as the primary coloniser have a broad, terraced form while those with Maram grass are more ridged. This has altered the shape and behaviour of this dune system in response to periodic storm erosion events, tending to result in a higher and narrower incipient dune and dune scarp.
It is clear that coastal management action needs to include engineering works to re-establish and maintain the beach and ongoing dune protection and rehabilitation to ensure protection of the adjacent residential development and facilities. This study has been undertaken by WBM in association with the East Beach Erosion Study Steering Committee to identify and assess feasible and effective solutions to achieve these objectives.

COASTAL PROCESSES & CAUSES OF EROSION 2-1
G:\ADMIN\B16206.G.MJA\R.B16206.001.03.DOC 3/4/07 11:04
2 COASTAL PROCESSES & CAUSES OF EROSION
2.1 General Considerations
A good understanding of the fundamental coastal processes affecting East Beach is needed in order to develop and assess engineering and management options such that solution strategies may be adopted with confidence of success. Only limited detailed study of the coastal processes and beach/dune dynamics has been undertaken to date. Nevertheless, considerable knowledge is available from both:
• Practical and theoretical knowledge of the principles of beach behaviour now established in the fields of coastal and ocean engineering and geomorphology;
• Scientific and engineering investigations undertaken specifically of East Beach; and
• Some limited modelling undertaken as part of the present study of the wave, current and sand transport processes occurring at East Beach.
A brief outline of this knowledge is presented in this Chapter.
The key issues affecting the most appropriate engineering and coastal management action are those of historical and future:
• supply of sand into the beach system;
• sand movements within and through the beach system; and
• possible progressive net loss of sand from the beach system.
The natural beach system includes not only the beach itself but also:
• the dune that acts as a reservoir of sand for the beach during major erosion events and subsequently rebuilds gradually as the sand is moved onshore by wave and wind action; and
• the offshore zone where sand movement is active to depths in excess of 15-20m.
While it is known that there has been a net loss of sand from East Beach in the past as a result of the river training works (WBM 1996), it remains uncertain whether or not there is an ongoing net loss either under the action of persistent longshore sand movement or to offshore. A comprehensive investigation over some years and involving substantial cost would be needed to gain a full understanding of that issue. Despite that uncertainty, it is considered that the present level of understanding is sufficient to identify the most suitable engineering and management options for restoring the beach, as set out in this report. Within that context, relevant uncertainties and their significance are identified and discussed.

COASTAL PROCESSES & CAUSES OF EROSION 2-2
G:\ADMIN\B16206.G.MJA\R.B16206.001.03.DOC 3/4/07 11:04
2.2 Understanding of Coastal Processes at East Beach
2.2.1 Sand Transport Mechanisms
In principle, sand is transported along East Beach and within Port Fairy Bay by the combined action of waves and currents there. The waves propagate into the Bay from the deep ocean and have three key effects on sand transport, namely:
• They break and generate so-called radiation stresses that drive currents, particularly within the wave breaker zone where longshore currents may result;
• Their orbital motion impacts on the seabed cause bed shear stresses that mobilise and put into suspension the seabed sand. Their asymmetry in shallower water causes a significant differential in the forcing on the bed sediments, stronger in the forward direction of wave travel; and
• They cause a small net current in the direction of wave travel (mass transport) or a bottom return current in the surfzone;
Currents provide the primary mechanism for the transport of the sand that has been mobilised and put into suspension by the wave/current action. The currents also impose a bed shear stress that may mobilise the seabed sand. Currents and waves together act in a complex non-linear way in generating bed shear stresses.
The currents in the Bay may be driven by several factors including:
• Tidal flows,
• Wind stress on the sea surface,
• Wave radiation stresses causing longshore surfzone and other currents,
• Wave breaking and setup causing a bottom return flow in the surfzone, and
• Differentials along the beach of wave setup at the beach, causing longshore currents.
Thus an embayment such as Port Fairy Bay may be subject to a complex combination of some or all of those factors from time to time, leading to complex sand transport behaviour. Comprehensive 2-dimensional modelling is required to investigate these processes.
2.2.2 Sand Transport Processes and Beach Dynamics
Generally, at a typical beach location, sand transport may be regarded in simple terms as involving longshore and cross-shore sand movement processes. These act concurrently and interact.
Cross-shore sand transport involves:
• Erosion of sand from the upper beach and dune area during large storm wave events, with the sand being taken offshore where it is commonly deposited as one or more shore-parallel sand bars located in the vicinity of the wave break area;
• Subsequent slow transport of the eroded sand back to the beach, often over many months or several years; and

COASTAL PROCESSES & CAUSES OF EROSION 2-3
G:\ADMIN\B16206.G.MJA\R.B16206.001.03.DOC 3/4/07 11:04
• Transport by the wind of the accreting beach sand back to the dune system where dune grasses act to trap it and build the dune back to its former condition.
Thus, on dynamically stable beaches, there is balance in the amount of sand that is taken offshore and is subsequently returned to the beach and dune. The wind plays an important role in the natural balance of sand movements and beach and dune stability. If the dune is poorly vegetated, the sand may be blown landward and lost from the active dune system.
Longshore sand transport results predominantly from waves breaking at an angle to the shore with an alongshore component of their radiation stress that drives an alongshore current and carries the sand along the coast. This sand transport is distributed across the surfzone and is greatest in the area near the wave break point where the wave height, longshore current and bed shear are greatest.
The beach may remain stable (without net recession or accretion) where the longshore sand transport is uniform along the coast. However, where there are differentials in the rates of longshore transport, including any interruption of the sand supply to an area, then the beach will erode or accrete in response.
Because longshore and cross-shore transport coexist, progressive net sand losses due to a longshore transport differential may not manifest as erosion of the upper beach until storm erosion occurs, and less sand is subsequently returned to the beach/dune than was previously there.
2.2.3 East Beach Erosion
At East Beach, the historical erosion is considered the result of a longshore transport differential in which:
• The former natural situation was one in which sand was supplied at the southern end and transported along the beach towards the northern end at an essentially uniform rate;
• The Moyne River training works cut off a significant part of the sand supply, while sand continued to be moved along the coastline to the north, causing a deficit of sand between that transported into the beach unit and that transported out;
• The deficit in sand transport was ‘made up’ by permanent erosion of the beach and dune at the southern part of the beach embayment, with recession back into the higher main dune and loss of the incipient foredune. Eventually, a rock seawall was constructed to protect the development there.
From the above, it may be concluded that the beach has suffered a net loss of sand in the past, equal to the quantity of sand trapped at Griffiths Island. The beach would now be essentially dynamically stable in its depleted state, with no further progressive beach loss, if balance has been restored between the rate of sand supply and the net longshore sand transport to the north. However, if there continues to be less sand transported in from the south than is transported out at the north, then the shoreline would be continuing to erode.
COASTAL PROCESSES & CAUSES OF EROSION 2-4
G:\ADMIN\B16206.G.MJA\R.B16206.001.03.DOC 3/4/07 11:04
2.3 Research Investigations of East Beach
2.3.1 Previous Investigations
The research and information available includes:
i. Reports:
• “Coastal Study of East Beach, Port Fairy” (June 1996), prepared for Council by WBM Pty Ltd.
• “Griffiths Street, Port Fairy - Geomorphology & Coastal Processes in Relation to a Proposed Subdivision” (July 2005), prepared by Neville Rosengren of Environmental GeoSurveys Pty Ltd.
• “Port Fairy Shoreline Stability Study” (July 2006), prepared by Dr Peter Riedel and Mr Gerry Byrne of Coastal Engineering Solutions.
ii. Historical and site information derived from:
• Library and historical society sources;
• Local resident and Steering Committee member Mr Neville Bartlett;
• Aerial photography from the Land Victoria Aerial Photography Register; and
• Modelling of waves, currents and sand transport patterns undertaken as part of this study by WBM.
The formation of East Beach is described by Rosengren (2005) in the following terms:
• East Beach is composed of fine to medium grained calcareous white and grey sand, with concentrations of whole and broken shell;
• The beach between the North Mole at the mouth of the Moyne River and the basalt rocks at Reef Point is sandy with no intermediate rock outcrops. There are some basalt reefs close inshore in the southwest and northeast;
• The beach and dunes are unconsolidated sand and have formed over the past 6000 years. The beach and dune sand has been derived predominantly from the Bridgewater Group calcarenite, a cemented rock of broken shell and quartz sand that originated as sand dunes blown shoreward during periods of lower sea level from material sourced from the Port Campbell Limestone and broken shell exposed on the seafloor. The Bridgewater Group calcarenite forms an intermittent cover over the Port Campbell Limestone and the volcanic rocks along the coastline east of Port Fairy;
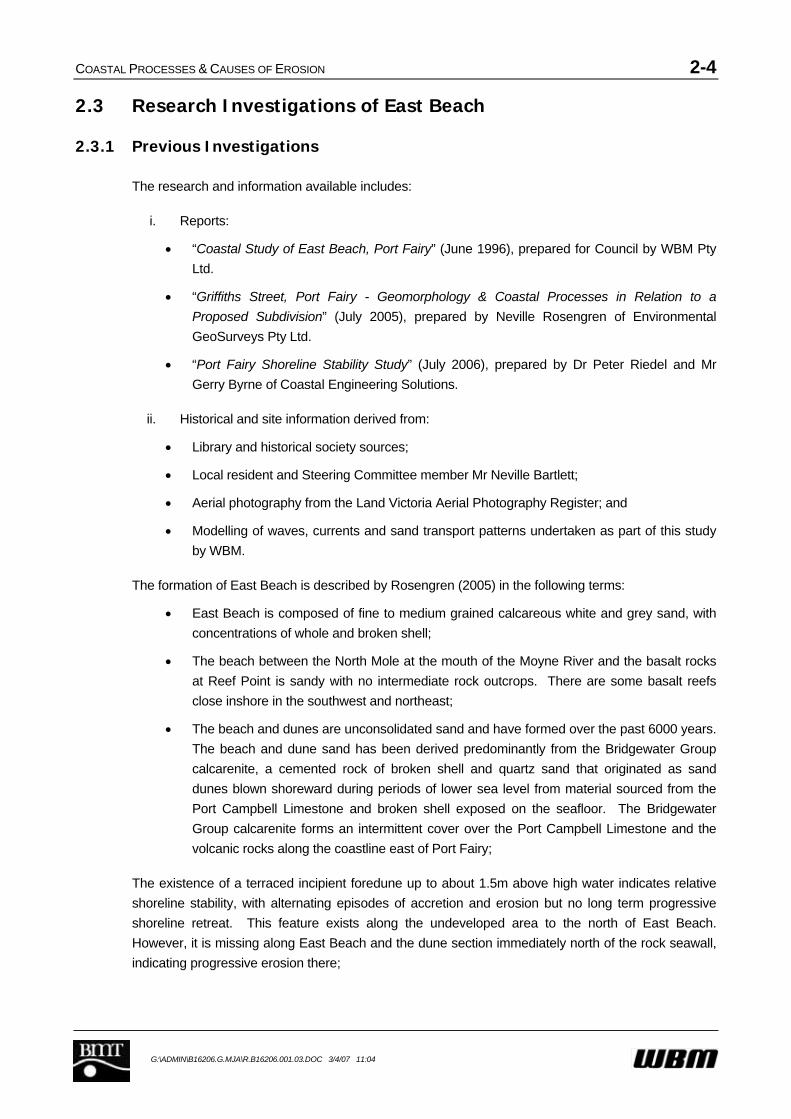
The existence of a terraced incipient foredune up to about 1.5m above high water indicates relative shoreline stability, with alternating episodes of accretion and erosion but no long term progressive shoreline retreat. This feature exists along the undeveloped area to the north of East Beach. However, it is missing along East Beach and the dune section immediately north of the rock seawall, indicating progressive erosion there;

COASTAL PROCESSES & CAUSES OF EROSION 2-5
G:\ADMIN\B16206.G.MJA\R.B16206.001.03.DOC 3/4/07 11:04
Analysis of historical maps, charts and photographs (Rosengren (2005) provides an indication of the longer term shoreline and dune changes since around the mid 1800s as follows:
• Comparison of recent data against the John Barrow (1854) chart suggests that “the outer dune ridge that enclosed the “Road to Warnambool” appears to have been lost, suggesting a shoreline recession of 20 to 40 metres. This value is not unusual in the context of sandy coastline change in Victoria and it appears that part of that loss has been recovered by the establishment of an incipient foredune”.
• Comparison of the H.J. Stanley (1870) map with the recent 1:25,000 map indicates very little shoreline recession in the north-eastern section of East Beach, but significant recession (scaled approximately at up to 40m) along East Beach further to the southwest towards the river mouth.
WBM (1996) assessed the broad coastal processes and analysed the historical changes around Griffiths Island and concluded:
• Works undertaken over the period 1870 to 1879 to train the river mouth and develop the river for better navigation acted to join the former separate Rabbit and Griffiths Islands and to trap sand that would otherwise have been transported to East Beach;
• Further work was undertaken some time after 1912 to close the SW Passage to block wave-induced currents and assist navigation of un-powered boats into the river;
• To date, a total quantity of about 500,000 cubic metres of sand has been trapped or deposited at and around Griffiths Island, most of which has expanded Lighthouse Beach (approx 300,000 cubic metres). The primary deposition areas are shown in Figure 2-1, also including SW Passage and the Puddney Ground;
• East Beach eroded over the decades following these works as a direct result of interruption of the supply of sand, at a rate directly proportional to the rate of sand accumulation at Griffiths Island;
• The natural process of sand transfer past or around the headland has been permanently altered;
• The present ongoing effects of the breakwaters on East Beach are uncertain. While the net loss of sand is a permanent feature, it is likely that, after such a long period of re-adjustment since the training walls were built, the beach has achieved a new essentially stable alignment – subject to the ongoing effects of short term erosion and longer term longshore sand movements;
• Sand trapped in and dredged from the river should all be placed on East Beach, a policy that has since been implemented.
These findings are supported and illustrated in the various figures and photographs presented herein.

COASTAL PROCESSES & CAUSES OF EROSION 2-6
G:\ADMIN\B16206.G.MJA\R.B16206.001.03.DOC 3/4/07 11:04
Sandy Cove Sandy Cove DepositionDeposition
Lighthouse Lighthouse Beach Beach
AccretionAccretion
Shoreline Shoreline ErosionErosion
Griffiths Griffiths IslandIsland
Rabbit Rabbit IslandIsland
SW PassageSW PassagePuddney Puddney GroundGroundSandy Cove Sandy Cove
DepositionDeposition
Lighthouse Lighthouse Beach Beach
AccretionAccretion
Shoreline Shoreline ErosionErosion
Griffiths Griffiths IslandIsland
Rabbit Rabbit IslandIsland
Griffiths Griffiths IslandIsland
Rabbit Rabbit IslandIsland
SW PassageSW PassagePuddney Puddney GroundGround
Figure 2-1 Original Shoreline and Sand Deposition Areas at Griffiths Island
Erosion to base of main duneErosion to base of main duneErosion to base of main duneErosion to base of main dune
Figure 2-2 Moyne River & East Beach Approx 1904
Incipient Incipient foreduneforedune remaining here, remaining here, but subsequently erodedbut subsequently erodedErosion into main dune hereErosion into main dune hereIncipient Incipient foreduneforedune remaining here, remaining here, but subsequently erodedbut subsequently erodedErosion into main dune hereErosion into main dune hereErosion into main dune hereErosion into main dune here
Figure 2-3 East Beach Approx 1920

COASTAL PROCESSES & CAUSES OF EROSION 2-7
G:\ADMIN\B16206.G.MJA\R.B16206.001.03.DOC 3/4/07 11:04
Erosion into main duneErosion into main duneErosion into main duneErosion into main dune
Figure 2-4 Erosion into East Beach Main Dune Approx 1930
Figure 2-5 Commencement of Rock Seawall Construction at Surf Club (1965)
Figure 2-6 Rock Seawall Extended Past Connolly Street (2006)
Coastal Engineering Solutions (CES) (2006) state that there is a net sand movement along the coast of the Portland Bay system, probably of about 20,000 m3/yr at its eastern end, based on their previous studies. They note that the river training works at the mouth of the Moyne River would have interfered with the natural flow of sand to East Beach, initially trapping most of that sand supply from the west and causing erosion of East Beach. However, CES surmises that “it is probable that the training walls are no longer permanently trapping any significant amount of sand or influencing the ongoing shape of the beach.” Further they state that “It would appear that over the 125 years since

COASTAL PROCESSES & CAUSES OF EROSION 2-8
G:\ADMIN\B16206.G.MJA\R.B16206.001.03.DOC 3/4/07 11:04
the Port Fairy entrance training walls were built, the foreshore has stabilised to a new alignment and these walls are no longer playing an active part in changes that are occurring.”
Of particular significance, the CES study finds that:
a) The northward net longshore transport of sand along the beach calculated at three locations is uniform at about 20,000 m3/yr, although the gross transport increases towards the north. This indicates:
(i) A continuing drift of sand through the embayment; and
(ii) no net loss of sand by longshore processes, an indicator of dynamic shoreline stability.
b) The conclusion drawn by CES from the aerial photo analysis is that there is no longer a significant progressive retreat of the shoreline/dune north of the existing constructed seawall; and
c) Storm erosion will cut less than 3 metres into the dune, with a provision of 5 metres considered to be conservative even following sea level rise.
Rosengren (2005) finds that “the impact of the engineering works has been to reduce the eastward drift of sand along the southern and central sectors of East Beach and resulted in the loss of the beach and foredune, especially along the section now fronted by the boulder wall.” It notes that “Beach changes at Port Fairy Bay as a consequence of building the moles are evident along the south-western part of the bay but are not as evident to the northeast.”
The conclusions reached are consistent with the previous WBM report (1996) in that:
• The major works undertaken in the 1870s to train the Moyne River entrance and subsequent closure of the South West Passage sometime after 1912 had a significant adverse effect on East Beach by trapping a substantial quantity of beach system sand at Griffiths Island (formerly Rabbit and Griffiths Islands) and preventing the natural flow of wave and wind induced currents and sand through that area to East Beach;
• The pathway for sand being supplied to East Beach is presently only around the northern side of the headland of Griffiths Island;
• The existence and rate of any sand supply from further west along the coastline are uncertain;
• There is substantial cross-shore movement of sand at East Beach, the sand being transferred from the beach to the offshore bar area during storms and subsequently being pushed slowly back to the beach by the swell.
2.3.2 Uncertainty of Present and Future Trends
There is uncertainty in relation to the present status of sand supply and possible ongoing net sand loss from East Beach. Rosengren (2005) indicates that the supply of sand to East Beach from the south has been permanently reduced, whereas CES (2006) suggests that, given the placement of the sand dredged from the river mouth onto the southern end of East Beach, the training walls no longer restrict sand supply to East Beach. That is, Rosengren suggests that shoreline recession has occurred and continues to occur along the southern and central section of East Beach (to just north of the end of the seawall), whereas CES concludes that the initial erosion has now ceased.

COASTAL PROCESSES & CAUSES OF EROSION 2-9
G:\ADMIN\B16206.G.MJA\R.B16206.001.03.DOC 3/4/07 11:04
Both reports agree that the northeastern section of East Beach towards the golf club area is essentially stable over the longer term under current management methods that ensure adequate dune vegetation cover.
The Rosengren (2005) assessment is based on interpretation of the dune morphology of the site and not on analysis or modelling of the contemporary coastal processes. In that sense, it can identify the past erosional loss of the incipient foredune terrace and part of the elevated dune terrace, a clear indicator of past shoreline recession. However, this does not provide a compelling basis for determining whether or not that recession is continuing at present.
In contrast, the CES methodology involving analysis of wave propagation and longshore sand transport rates is the conventional ‘process’ based approach to determining whether or not such recession remains active at present. The CES conclusion is that, while recession has occurred in the past, the supply and shoreline alignment have essentially stabilised to a new equilibrium and, with placement of the sand dredged from the river onto East Beach, there is no longer a net sand loss.
Nevertheless, there is evidence that the main dune scarp along the section of dune immediately north of the seawall has eroded further over the past year or so, in the form of the steep bare dune scarp face with slumping clumps of dune grass and exposure of old buried soil horizons in the dune face. As such, that provides morphological evidence supporting the Rosengren conclusion of at least some continuing shoreline recession in that:
• The main dune scarp is now further landward than at any other time over the historical record; and
• It would be expected that, if coastal recession has halted, an incipient foredune would form and be eroded at the base of the main dune scarp from time to time without erosion into the main scarp.
This scenario is made more complex by the fact that sea level has been rising at a rate of about 1.0-1.5 mm/yr over many decades and there would be some small tendency for shoreline recession associated with that rise. That is, even if there are no net losses of beach/dune system sand due to a longshore differential in longshore sand transport or by wind erosion, there is a small shoreline retreat due to sea level rise that has occurred to date. This may be sufficient to cause the minor ongoing dune scarp erosion that is in evidence.
The outcome of these considerations is a conclusion that both reports may be rationalised in that:
• There is little or no net loss of sand due to a longshore sand transport differential;
• The present rate of shoreline recession may be quite minor compared with past erosion, but cannot be quantified readily; and
• The shoreline recession that is occurring is due to one or more uncertain factors that could include past and present sea level rise, seawall end effects or some ongoing impacts of the Moyne River training works, but there is insufficient evidence to quantify or properly assess those factors comprehensively.

COASTAL PROCESSES & CAUSES OF EROSION 2-10
G:\ADMIN\B16206.G.MJA\R.B16206.001.03.DOC 3/4/07 11:04
2.3.3 Modelling of Coastal Processes
Coastal Engineering Solutions (CES) has undertaken an analysis of longshore sand movements, using conventional but comprehensive wave propagation and longshore sand transport rate calculation procedures, as part of investigations relating to a proposed development of land at the northern end of East Beach (CES, 2006). This indicated that there is an alongshore drift of sand through the East Beach embayment that is essentially equal at all locations at a rate of about 50,000 m3/yr. This suggests that, while substantial erosion occurred due to the training walls, the beach has now stabilised in that eroded state. This appears at odds with observations of continuing erosion beyond the northern end of the East Beach rock seawall.
As well, WBM has undertaken 2-dimensional modelling as part of the present study. This involved:
• comprehensive collation of bathymetric information from charts and other data sources;
• development of a detailed digital elevation model (DEM) of the immediate area and offshore areas;
• acquisition of detailed wave climate data for deep water to the south of the local area from the British Meteorological Office (BMO) global wave model and analysis of the predominant wave height, period and direction characteristics prevailing there (Figure 2-7);
• development of a 2-dimensional wave propagation model, based on the well-known and industry standard SWAN model software;
• development of a 2-dimensional hydrodynamic and sand transport model of the embayment and offshore areas based on the RMA10S software (Figure 2-8);
• testing of various scenario combinations of wave, wind and tides to assess the basic processes affecting sand transport at East Beach.
The model mesh, as shown in Figure 2-8, has been used in conjunction with the RMA10S hydrodynamic and morphological modeling module, providing for the dynamically combined effects of:
• Water levels;
• Tide and wind driven currents;
• Wave influences as imported from the SWAN wave modelling module;
• Sediment transport due to combined effects of waves and currents.
The SWAN wave propagation model is a phase-averaged, spectral wave model developed at Delft University of Technology. The model incorporates swell wave propagation, dissipation processes of bottom friction and breaking together with shoaling and refraction as affected by the shallower areas. SWAN has been used and validated successfully for many wave generation and propagation studies worldwide.
The data and modelling has confirmed the dominance of southwest waves in the region and the expected general processes of wave propagation, generation of currents and patterns of longshore sand transport, including (for example) that the wind contributes to the currents and sand transport (Figures 2-9 and 2-10). However, it shows that the processes are complex and difficult to model

COASTAL PROCESSES & CAUSES OF EROSION 2-11
G:\ADMIN\B16206.G.MJA\R.B16206.001.03.DOC 3/4/07 11:04
reliably and use of such modelling to quantify the coastal processes at East Beach would prove difficult.
Wave Direction Distribution
0
5
10
15
20
25
30
35
345-15 15-45 45-75 75-105 105-135 135-165 165-195 195-225 225-255 255-285 285-315 315-345
Wave DirectionPr
obab
ility
(%)
Wave Height Distribution
0
5
10
15
20
250.
0 - 0
.5
0.6
- 1.0
1.1
- 1.5
1.6
- 2.0
2.1
- 2.5
2.6
- 3.0
3.1
- 3.5
3.6
- 4.0
4.1
- 4.5
4.6
- 5.0
5.1
- 5.5
5.6
- 6.0
6.1
- 6.5
6.6
- 7.0
7.1
- 7.5
7.6
- 8.0
Wave Height (Hs m)
Prob
abili
ty (%
)
Wave Period Distribution
0
5
10
15
20
25
30
35
0 - 1
1 - 2
2 - 3
3 - 4
4 - 5
5 - 6
6 - 7
7 - 8
8 - 9
9 - 1
0
10 -
11
11 -
12
12 -
13
13 -
14
14 -
15
15 -
16
Wave Period (s)
Prob
abili
ty (%
)
Figure 2-7 Wave Characteristics in Deep Water South of Port Fairy
Figure 2-8 Numerical Model Extent, Bathymetry and Computational Grid Mesh

COASTAL PROCESSES & CAUSES OF EROSION 2-12
G:\ADMIN\B16206.G.MJA\R.B16206.001.03.DOC 3/4/07 11:04
Figure 2-9 Typical Wave Propagation Patterns - Left: SW Waves; Right: SE Waves
Figure 2-10 Modelled Sand Transport Pattern – SW Waves
It must be recognised that modelling of coastal processes remains an imperfect science and a high level of quantitative accuracy depends to a large degree on:
• Accurate representation of the area being modelled (bathymetry, seabed characteristics, computational grid mesh, etc)
• The accuracy and representativeness of the boundary conditions applied (wave conditions, winds, tides);
• Validation to ensure that all of the ‘physics’ of the processes important in any particular area are being properly simulated in the model.
Alternatively, coastal modelling undertaken at a less comprehensive level can provide an invaluable ‘tool’ for providing both qualitative insights and quantitative information about the processes taking place. Thus, the level of modelling and analysis undertaken to date is considered sufficient for the purposes of this study in view of the facts that:
• The wave, current and sand transport processes occurring in Port Fairy Bay are complex and as yet not well understood;

COASTAL PROCESSES & CAUSES OF EROSION 2-13
G:\ADMIN\B16206.G.MJA\R.B16206.001.03.DOC 3/4/07 11:04
• The nature, behaviour and rate of the sand supply to the Bay remain uncertain; and
• Only limited information is available on key boundary information such as the prevailing wave climate, including its short and long term variability, upon which comprehensive modelling depends.
The key indications from the modelling undertaken are:
• There is a net drift of sand towards the north along East Beach;
• The predominant pathway for sand supply into East Beach is (and most probably has always been) around the lighthouse headland, with the SW Passage supply probably being significant but secondary;
• Only a proportion of the sand supply passes directly to East Beach, with some of the sand diverted into Lighthouse Beach and the river;
• The sand movement to East Beach involves a two-stage process in which sand is initially deposited offshore from the southern end of the beach in shoals from which wave action slowly disperses it onshore.
2.4 Consideration of Climate Change Scenarios
Research on likely climate change in Victoria indicates that two fundamental impacts may affect the shoreline, namely:
• Changes to storm occurrences and storm winds together with their effects on storm surges, and
• Sea level rise.
With respect to the three main storm weather systems (cold front systems, Tasman lows, and east coast lows), only the cold fronts have significant effect along the Victorian coast west of Wilsons Promontory. Two different CSIRO regional climate models were used to examine changes in the weather events. In one model, the number of fronts increased while in the other a decrease was indicated. It may be adopted at this stage that no change in the frequency of events is likely.
Analysis of changes to wind speeds in such events suggests that a modest increase in the height of the peak winter storm surges is possible. This may slightly increase the extent of future storm erosion of the beach and dunes, but not at an extent that would influence the outcomes of this study.
Sea level has been rising at about 1.0-1.5 mm/year for many years. It is expected that this rate of rise will accelerate in the future due to the effects of climate change.
There are uncertainties as to the actual magnitude and rate of future sea level rise. This has lead to various scenarios being adopted by the Intergovernmental Panel on Climate Change (IPCC), based on the range of model results available and dependent upon the amount of future emissions assumed. The Institution of Engineers, Australia, National Committee on Coastal and Ocean Engineering recommends that these values be used for planning and design.
Table 2.1 presents the low, mid (best), and high estimates of global mean sea level rise from IPCC (2001) for the years 2040 and 2090, relative to 1990.

COASTAL PROCESSES & CAUSES OF EROSION 2-14
G:\ADMIN\B16206.G.MJA\R.B16206.001.03.DOC 3/4/07 11:04
Table 2.1: IPCC Estimates of Sea Level Rise (m)
Year Low Best Estimate High 2040 0.03 0.12 0.30
2090 0.09 0.48 0.88
Thus, planning for a sea level rise of the order of 0.3-0.5m appears appropriate in the context of the present understanding of these processes. For this study, this involves, as a minimum, recognition that the present situation at East Beach will become worse over time if no action is taken and:
• The existing rock seawall will become under greater storm wave attack; and
• Beach restoration action will need to cater for a progressively increasing sea level for longer term sustainability.

COASTLINE MANAGEMENT CONSIDERATIONS 3-1
G:\ADMIN\B16206.G.MJA\R.B16206.001.03.DOC 3/4/07 11:04
3 COASTLINE MANAGEMENT CONSIDERATIONS
3.1 Beach Erosion
The shoreline is subject to a threat of erosion associated with:
• short term storm events; and
• long term recession as a result of a deficit in the overall sediment budget and the influences of climate change (sea level rise).
Beach erosion hazard zones define the limit of potential erosion. The immediate hazard zone is the area likely to be threatened by erosion in the event of a major storm or series of storms in the near future. The 50 and 100 year hazard zones depict the area which may be threatened by erosion within those planning periods, taking into consideration any gradual long term recession and likely sea level rise impacts.
In principle, beach erosion is a natural process although it can and has been exacerbated in places by the influence of man. If erosion is allowed to occur naturally, the character and amenity of the beach is retained even where the shoreline may be receding. Beach erosion becomes a problem when it threatens development, either causing loss or damage of the property or prompting construction of protective works such as seawalls, as at East Beach. The essence of erosion problems is therefore not that beaches erode, but that development has occurred within the zone of natural beach movements.
Coastal issues requiring management action may be classified under the following headings:
• coastal land management and planning (eg, provision of access and recreational facilities, preservation of dune ecology, visual landscape management).
• coastal erosion (eg. beach loss, wind erosion of dunes, threat to adjacent development).
East Beach is substantially developed, with residential buildings, the surf club and a protective rock wall and has existing problems relating to beach erosion. Solutions to problems where the beach is inadequate and/or the property is threatened by erosion, such as at East Beach, generally involve engineering works and are almost invariably expensive. In this case, a key requirement is to restore the beach as a recreational asset.
The shoreline extending further to the north-east presently remains undeveloped, with no immediate or long term threat to infrastructure associated with erosion. Nevertheless, appropriate coastal management planning and development control measures are important for that area to ensure that erosion problems do not arise in the future.
3.2 Generic Option Considerations
A range of generic management options as described in Appendix A are available for consideration, which may be classified in terms of their consistency with natural coastal and environmental processes and the natural character and values of the coastline as follows:

COASTLINE MANAGEMENT CONSIDERATIONS 3-2
G:\ADMIN\B16206.G.MJA\R.B16206.001.03.DOC 3/4/07 11:04
“Soft” Options : Options which restore and/or preserve the natural character, behaviour and values of the coastal system. These will ensure the sustainable existence and natural character of the sandy beaches and dunes such that future erosion, both during short term storms and over the longer term, can be accommodated in a coastal buffer zone without threat to development requiring protective works.
Soft options may include works such as beach nourishment with sand or planning solutions that require development to be outside the zone of potential erosion (buffer zone), including:
• regulatory controls on building in undeveloped areas;
• removal of existing development from erosion prone land, and/or
• works aimed at restoration of the beach/dune system seaward of the development to provide an adequate buffer width to accommodate erosion.
“Hard” Options : Options that involve construction of works either to form a barrier to natural coastal erosion to protect development (seawalls) or to alter the natural processes to change the way in which the beach behaves (groynes and breakwaters).
Combinations of options or “hybrid” management approaches are often the most suitable where existing development lies within the erosion prone area. For example, works options such as terminal protection (seawalls) are sometimes combined with partial set-back of development, or may be augmented with ongoing artificial sand nourishment to offset associated deleterious environmental and recreational amenity impacts. In addition, most options need to be supplemented with relevant amendments to local planning controls.
Thus, engineering works options for East Beach may include ‘soft’ or ‘hard’ solutions, or a combination of both. The most common feasible works options for overcoming beach erosion problems include:
• beach nourishment with sand to restore the beach and dune system;
• seawalls to protect property;
• groynes to control the longshore movements of sand; and
• offshore breakwaters or submerged reefs to modify wave processes which erode the beach.
Such works options are generally expensive and typically cost in the range $2000 to $5000 per metre length of beach to construct for adequate protection. Ongoing maintenance requirements must be considered in both the design and financing. Experience indicates that careful design in full cognisance of the prevailing coastal and ocean processes and the short and longer term effects is essential for success and cost-effectiveness of such works.
For example, it is known that seawalls constructed on retreating shorelines may give protection to property, but will eventually cause loss of the adjacent beach. There is a need to ensure that the foundations of the seawall are sufficiently deep for stability to cater for the loss of the beach, typically requiring deeper foundations the more seaward the seawall is located. Similarly, beach nourishment must be designed and implemented to provide for the cross-shore and longshore movements of sand

COASTLINE MANAGEMENT CONSIDERATIONS 3-3
G:\ADMIN\B16206.G.MJA\R.B16206.001.03.DOC 3/4/07 11:04
affecting the area for long term effectiveness in providing property protection while maintaining the recreational amenity of sandy beach systems.
3.3 Decision Matrix
It is convenient to consider beach protection options in the broad terms of the matrix illustrated in Table 3-1. This matrix, in effect, represents a decision tool based on criteria relating to:
• ‘natural’ versus ‘altered’ character; and
• ‘non-works’ (planning) versus ‘works’ options.
Table 3-1 Matrix of Beach System Management Options
Preserve Natural Beach System Character
Accept Change to Natural Beach System Character
Non-Works Options (planning, management and regulation)
Development free buffer zones via planning or land use regulation; Resumptions of erosion prone development; Set-back of buildings; Building guidelines and controls; Land use guidelines and controls; Management including dune care activities.
Accept development on vulnerable erosion prone land, but prevent any protection works (allow loss of buildings and facilities as erosion occurs).
Works Options Beach nourishment with sand to restore the beach and dune system; Submerged reefs for shore protection and/or surfing.
Seawalls to protect property; Groynes to control the longshore movements of sand; Offshore breakwaters to modify beach shape and sand transport.
To be consistent with coastal management policy guidelines and the priorities generally adopted by the community in areas where the beach amenity is important, the options in the column headed ‘Preserve Natural Beach System Character’ would normally have highest ranking in any assessment criteria. Consideration may also be given to other low cost temporary works options and hybrid options that combine the beneficial characteristics and offset deleterious characteristics of specific individual options.
The likelihood of success (or the risk of failure) is a key consideration in the selection of possible solution options. The options adopted involving expenditure of public funds should preferably be tried and proven techniques for dealing with beach erosion problems. There are a number of other (generally lower cost) options that are commonly put forward, covering a wide range of operational modes and with various claims of success. Most of these options typically have limited theoretical backing, have limited potential for providing significant long term benefits and/or have generally not

COASTLINE MANAGEMENT CONSIDERATIONS 3-4
G:\ADMIN\B16206.G.MJA\R.B16206.001.03.DOC 3/4/07 11:04
been proven as an effective means of beach stabilisation. Such options would be ranked as low feasibility of success and would not be recommended for East Beach.
3.4 Options for East Beach
3.4.1 General Considerations
The need for and nature of solution options to deal with the coastal erosion problem at East Beach depends on the nature and level of the threat and consequences if it is left unchecked. The erosion problem to be addressed at East Beach is jointly one of threat to property and loss of the beach, to varying degrees along the beach length. The most appropriate management options may vary along the section of beach.
Clearly the residential development is located on the dune too close to the sea. It must be recognised that some options aimed primarily at protection of property located within the erosion prone area (eg seawall construction) may be detrimental to the beach, as evidenced by the present diminution of the area of usable beach, particularly at high tide. Further, some options that restore and/or maintain the beach (eg nourishment) provide a measure of protection to the property. Invariably, overcoming an existing problem of beach loss or degradation is very costly.
Photo 1: Development located on dune in erosion prone area
Considerations are set out below in the context of the nature of the erosion threat and the priority objective to be achieved.
3.4.1.1 Undeveloped Areas
In the presently undeveloped area immediately to the north of East Beach, the key objective is to prevent an erosion problem from occurring in the future. That is, allowing the natural beach

COASTLINE MANAGEMENT CONSIDERATIONS 3-5
G:\ADMIN\B16206.G.MJA\R.B16206.001.03.DOC 3/4/07 11:04
processes of erosion and accretion, including any progressive long term trend of shoreline retreat to occur.
Photo 2: Undeveloped Area North of existing East Beach development
The most appropriate coastal management strategy there is to prevent construction of development and facilities in the erosion prone area. The natural processes, including shoreline fluctuations, will thus be allowed to continue unimpeded and the natural amenity and character of the beach will be retained.
This may require a set-back control on future development, including the alignment of any seawall that may be required in the future should erosion potentially progress beyond the set-back distance.
To the extent that this is a natural receding coastline, the frontal dune system needs to continue to roll back with the shoreline. In that case, the set-back needs to be greater to provide for the future erosion.
To achieve this, the following coastline management strategies would need to be adopted:
• Ensure appropriate planning controls are in place to prevent infrastructure and residential development occurring in erosion prone areas which are presently undeveloped (assessed preferably over a 100 year planning time-frame and potentially influenced by the restoration works implemented for East Beach);
• Allow natural processes to occur with ongoing monitoring of coastline behaviour;
• Continue dune protection and enhancement works and controlled access to the shoreline as necessary to maintain the integrity of the dune system and prevent wind erosion.

COASTLINE MANAGEMENT CONSIDERATIONS 3-6
G:\ADMIN\B16206.G.MJA\R.B16206.001.03.DOC 3/4/07 11:04
3.4.1.2 Areas With Existing Development Under Long Term Erosion Threat
Should there be locations where present development is not under immediate erosion threat but may potentially come under threat over time, some forward planning is needed to prevent future problems. The degree of natural variability in the coastal processes and the level of uncertainty in predicting coastline behaviour over such long timeframes are such that the need for and nature of any future action will be dependent on factors that are unknown at present such as:
• realisation of the erosion threat and the likelihood of ongoing recession; and
• future opportunities and attitudes towards coastline management and options for dealing which such threat.
The potential future threat from erosion should, however, be recognised in present planning and appropriate strategies put in place that will not compromise future management decisions. It is therefore considered that in those areas where existing development may be threatened over the longer term, the following strategies be adopted:
• allow natural processes to occur with ongoing monitoring of coastline behaviour;
• set specific objectives and dates for review and update of the erosion hazard zone extent and management options on the basis of ongoing information;
• continue dune protection and enhancement works as necessary to maintain the integrity of the dune system and prevent wind erosion;
• ensure appropriate planning controls are in place to prevent additional development or construction of facilities occurring and limit the intensification of existing development in the likely erosion prone areas (assessed preferably over a 100 year planning time-frame and potentially influenced by the restoration works implemented for East Beach).
3.4.1.3 Areas With Existing Development under Immediate or Short Term Erosion Threat
The residential and road development along East Beach has been under direct threat from erosion. A seawall was constructed during the 1960s and subsequently to protect the development. Typical beach and dune cross-sections along East Beach are shown in Figure 3-1.
The erosion is thought to be largely the result of training wall and associated works at the Moyne River entrance in reducing the sand supply to East Beach. Whether or not there is an additional underlying natural long term erosion is not known. However, to the extent that there will be increasing sea level rise in the future, there will be an increased erosional trend at this beach.

COASTLINE MANAGEMENT CONSIDERATIONS 3-7
G:\ADMIN\B16206.G.MJA\R.B16206.001.03.DOC 3/4/07 11:04
Section 5 - Lydia Place
-2
0
2
4
6
8
10
0 10 20 30 40 50 60 70 80Distance (m)
Leve
l (m
AH
D)
Beach
Dune
Section 6 - Hughes Avenue
-2
0
2
4
6
8
10
0 10 20 30 40 50 60 70 80Distance (m)
Leve
l (m
AH
D)
seawall
eroded beach
dune
Section 9 - Hanley Court
-2 0 2 4 6 8
10
0 10 20 30 40 50 60 70 80 Distance (m)
Level (mAHD) dune seawall
eroded beach
Section 12 - Northern End of Seawall
-2
0
2
4
6
8
10
0 10 20 30 40 50 60 70 80Distance (m)
Leve
l (m
AH
D) dune
scarp
beach
Figure 3-1 Typical Survey Cross-Sections along East Beach
COASTLINE MANAGEMENT CONSIDERATIONS 3-8
G:\ADMIN\B16206.G.MJA\R.B16206.001.03.DOC 3/4/07 11:04
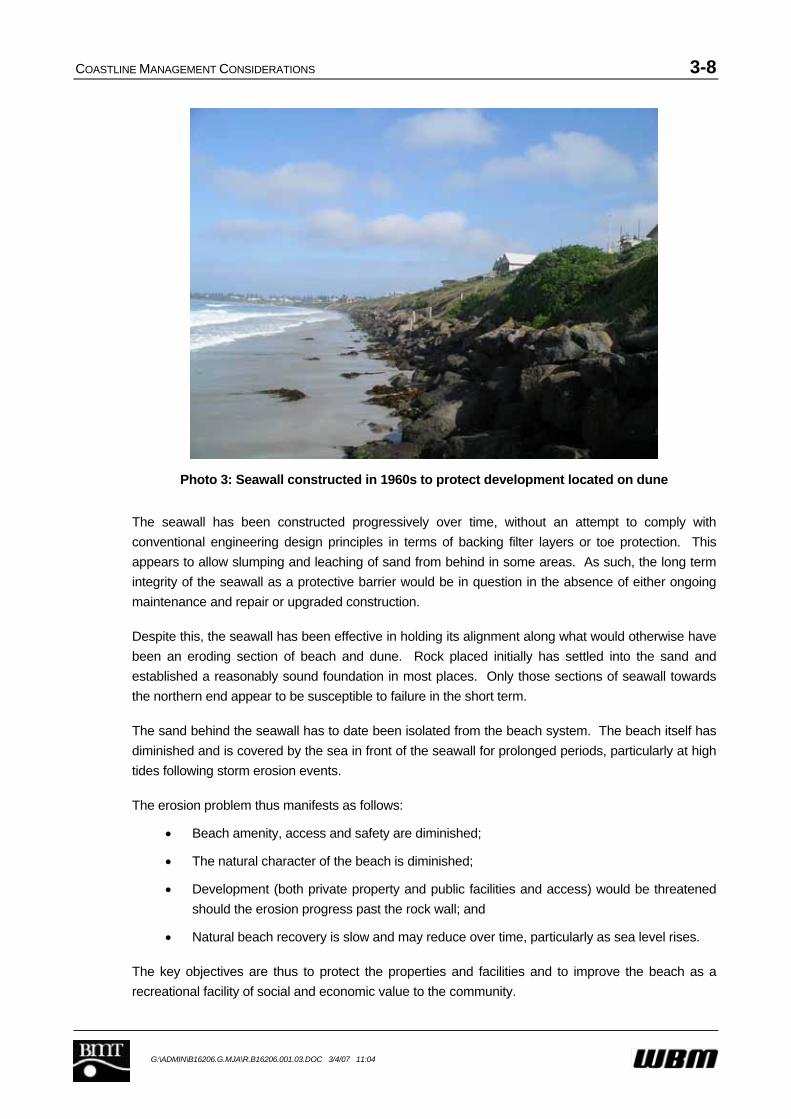
Photo 3: Seawall constructed in 1960s to protect development located on dune
The seawall has been constructed progressively over time, without an attempt to comply with conventional engineering design principles in terms of backing filter layers or toe protection. This appears to allow slumping and leaching of sand from behind in some areas. As such, the long term integrity of the seawall as a protective barrier would be in question in the absence of either ongoing maintenance and repair or upgraded construction.
Despite this, the seawall has been effective in holding its alignment along what would otherwise have been an eroding section of beach and dune. Rock placed initially has settled into the sand and established a reasonably sound foundation in most places. Only those sections of seawall towards the northern end appear to be susceptible to failure in the short term.
The sand behind the seawall has to date been isolated from the beach system. The beach itself has diminished and is covered by the sea in front of the seawall for prolonged periods, particularly at high tides following storm erosion events.
The erosion problem thus manifests as follows:
• Beach amenity, access and safety are diminished;
• The natural character of the beach is diminished;
• Development (both private property and public facilities and access) would be threatened should the erosion progress past the rock wall; and
• Natural beach recovery is slow and may reduce over time, particularly as sea level rises.
The key objectives are thus to protect the properties and facilities and to improve the beach as a recreational facility of social and economic value to the community.
COASTLINE MANAGEMENT CONSIDERATIONS 3-9
G:\ADMIN\B16206.G.MJA\R.B16206.001.03.DOC 3/4/07 11:04
There are two basic strategic approaches for dealing with the joint problems of erosion threat to the development and loss of the beach, namely:
• retreat from the erosion prone area and allow the natural erosion processes to occur; or
• hold the present coastal alignment by protection in one of many ways.
There are alternative approaches within these two categories, as discussed below.
Retreat Options
The intent of retreat options is to remove the development under threat and allow the beach and dune to behave in the natural manner, thus restoring and retaining the natural character and amenity of the beach as the shoreline recedes. The planned retreat option acknowledges that erosion is an ongoing phenomenon and seek to address the issue by removal of threatened facilities rather than trying to protect them.
At East Beach, the intensity and value of the development are such that its removal is not regarded as a feasible option.
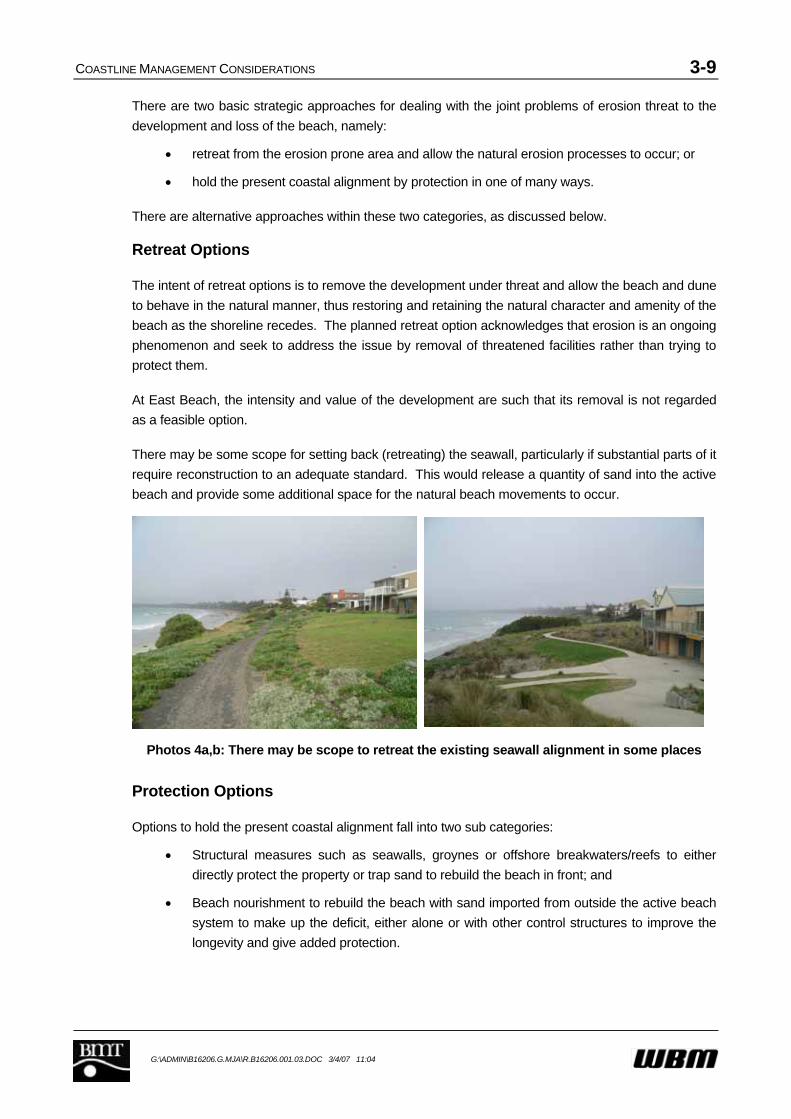
There may be some scope for setting back (retreating) the seawall, particularly if substantial parts of it require reconstruction to an adequate standard. This would release a quantity of sand into the active beach and provide some additional space for the natural beach movements to occur.
Photos 4a,b: There may be scope to retreat the existing seawall alignment in some places
Protection Options
Options to hold the present coastal alignment fall into two sub categories:
• Structural measures such as seawalls, groynes or offshore breakwaters/reefs to either directly protect the property or trap sand to rebuild the beach in front; and
• Beach nourishment to rebuild the beach with sand imported from outside the active beach system to make up the deficit, either alone or with other control structures to improve the longevity and give added protection.

COASTLINE MANAGEMENT CONSIDERATIONS 3-10
G:\ADMIN\B16206.G.MJA\R.B16206.001.03.DOC 3/4/07 11:04
3.4.2 Structural Protection Options
Structural options provide protection of property against ongoing erosion either directly through the construction of a seawall or by rebuilding of the beach through the construction of groynes or offshore breakwaters. They are options that could be considered in the event that sufficient beach nourishment sand is not available and/or retreat options are not viable. However, there are always some adverse impacts of such an approach where no additional sand is provided, as outlined below.
Such structures would typically be of flexible rubble mound design with rock being sourced and trucked to the site from local quarries. While they may be effective in protecting property or providing a localized wider beach, they are generally accompanied by associated costs related to adverse impacts on the adjacent beaches. This cost is typically made up of direct costs associated with lost income from the tourist industry and other intangible costs associated with the natural coastal amenity, beach access, loss of recreational beach area and degradation of ecological values.
3.4.2.1 Seawalls
Seawalls are robust structures constructed along the shoreline with the intent of providing terminal protection against ongoing recession. They are typically constructed of loosely placed rock to allow for some flexible movement and need to be designed to withstand severe wave attack. Seawalls should be continuous to prevent end effects and/or discontinuities that could threaten the overall integrity of the wall. They also have to be suitably founded for stability against scour at the toe of the structure, particularly on a receding shoreline.
While a properly designed and constructed seawall can protect the landward property from erosion, it effectively isolates the sand located behind the wall from the active beach system and leads to other adverse consequences. On a receding shoreline, the seawall becomes progressively further seaward on the beach profile over time. This leads to a gradual increase in the quantity of sand effectively lost from the beach system, with:
• lowering and eventual loss of the beach in front of the wall; and
• exacerbation of the erosion on the downdrift end of the wall where the losses are transferred and concentrated.
Scour and lowering of the beach in front of the wall ultimately exposes it to higher wave attack and can lead to slumping and the need for ongoing maintenance. Such maintenance is typically in the form of topping up of the wall with additional rock. However, where the seawall is not adequately designed or constructed, complete reconstruction may be needed.
Seawalls in isolation can thus be effective in protecting the property behind, but at a cost of the loss of the beach in front and exacerbated erosion on the downdrift side.

COASTLINE MANAGEMENT CONSIDERATIONS 3-11
G:\ADMIN\B16206.G.MJA\R.B16206.001.03.DOC 3/4/07 11:04
Photo 5: Seawall at East Beach has caused loss of usable beach
3.4.2.2 Groynes and Artificial Headlands
Groynes and artificial headlands are impermeable structures constructed at right angles to the shoreline and extend across the beach and the nearshore surf zone. Their function is to trap sand moving along the shoreline under longshore transport processes and build up the beach on the updrift side. They will function in this way only if there is a significant net longshore transport of sand, which is uncertain at East Beach. By necessity they starve the beach of sand supply on the downdrift side causing erosion there.
Updrift accretion
DowndrifterosionGroyne
Net Sand Transport
Updrift accretion
DowndrifterosionGroyne
Net Sand Transport
Figure 3-2 Typical Groyne Behaviour

COASTLINE MANAGEMENT CONSIDERATIONS 3-12
G:\ADMIN\B16206.G.MJA\R.B16206.001.03.DOC 3/4/07 11:04
Sand trapped on the updrift side provides a buffer of sand to accommodate short term storm erosion. The shoreline alignment will also change providing greater stability and reduced long term erosion immediately updrift of the structure. The extent of accretion and length of shoreline affected is dependent on the length of the structure as well as the characteristics of the longshore transport processes. The longer the groyne, the more sand it will trap over a longer distance with decreasing influence away from the structure.
However, there is a physical limit to the length of shoreline affected and therefore a number of structures may be needed if substantial benefit or protection is required over a long stretch of shoreline. In such a case, there is a balance between the length and spacing of groynes that needs to be optimised as part of a detailed design process.
An artificial headland is a substantial groyne type structure that has a greater width at its head than a conventional narrow groyne that alters the mechanisms of sand transport past the end of the structure and may allow a wider/longer beach to be retained on the updrift side. This could have the benefit of minimising the need for additional structures to provide protection for a long stretch of coastline. However, such headland type structures would be larger and more expensive to construct.
Groynes or artificial headlands can thus be used to rebuild a beach and stabilise the shoreline against ongoing recession on the updrift side. However, in the absence of other works such as beach nourishment, this comes at the cost of exacerbated erosion on the downdrift side to where the erosion trend is transferred. As well, significant considerations associated with groynes are:
• their visual intrusion to the vista of a long sweeping beach;
• interruption to direct access along the beach;
• public safety issues associated with unstable rock and wave overtopping; and
• ongoing condition monitoring and maintenance costs.
There are various design options with respect to the style and crest height of the structures that could be considered to minimise such adverse effects.
3.4.2.3 Offshore Breakwaters and Submerged Reefs
Offshore breakwaters and submerged reefs are robust structures constructed offshore from the beach and function by altering the height and direction of waves reaching the beach and/or the pattern of currents affecting sand transport such that the beach is built up in particular areas. They are typically constructed parallel to the shoreline, diffracting the approaching waves and creating a sheltered zone in which sand moving along the coast under longshore transport processes is trapped and accretes, forming a salient or tombolo (Figure 3.3). As for groynes, this trapping effect starves the downdrift beaches of sand, leading to erosion there.
Other breakwater forms may be oblique to the shoreline and may or may not be attached at their shoreward end. Nevertheless, their fundamental function is to cause a change in the wave/current field and an associated change in sand transport patterns, to the benefit of particular parts of the beach.

COASTLINE MANAGEMENT CONSIDERATIONS 3-13
G:\ADMIN\B16206.G.MJA\R.B16206.001.03.DOC 3/4/07 11:04
Breakwater
Wave deformation
Sand accumulation as a tombolo behind breakwater
Erosion
Erosion
Breakwater
Wave deformation
Sand accumulation as a tombolo behind breakwater
Erosion
Erosion
Figure 3-3 Typical Breakwater Behaviour
Offshore breakwaters are typically surface piercing structures, which are capable of withstanding and blocking wave attack. The build up of sand and reduced wave heights provide protection against storm erosion and the stabilising effect can reduce long term recession rates behind and updrift of the structures. The extent of influence is dependent on the length, spacing and distance offshore which would need to be considered in optimising the design of such structures. Construction of offshore breakwaters is also generally more difficult and expensive than shore connected structures.
Submerged artificial reefs are another form of offshore breakwater that could be considered. By their nature, submerged reefs allow the transmission of some wave energy and are therefore less effective in stabilising the beach unless they are of substantial size. Recently, there has been a popular trend toward combining this option with creation of artificial surfing breaks, with limited success. As for groynes, offshore breakwaters and submerged reefs could be used to rebuild parts of a beach and stabilise the shoreline against ongoing recession behind and on the updrift side, provided there is an adequate supply of sand.
However, breakwaters do not introduce any net gain in available sand within the active system and, in the absence of other works such as beach nourishment, the benefits they provide come at the cost of exacerbated erosion on the downdrift side, and sometimes on both sides. While such structures are typically expensive to construct, they offer the advantage of not interrupting access and the long sweeping vistas of the beach. Surface piercing structures will, however, interrupt views offshore. Submerged reefs do not have this impact but may be less effective in the level of protection (for similar sized structures). Surfing characteristics will also be affected by providing calmer conditions in the lee of the structures and potentially enhanced surfing waves in the vicinity of the structures (subject to careful research and design).
For the above reasons, one or more breakwaters located offshore from East Beach have been discounted as a beneficial option. Furthermore, various configuration options for a breakwater located off the lighthouse reef area and/or the river mouth have been considered and discounted on the grounds that:
• they would not provide any improvement to the sand supply; and
• they would alter the wave patterns in such a way that, while sand build up may be promoted in some areas, other parts of the beach would be eroded significantly.

COASTLINE MANAGEMENT CONSIDERATIONS 3-14
G:\ADMIN\B16206.G.MJA\R.B16206.001.03.DOC 3/4/07 11:04
3.4.3 Beach Nourishment Options
The primary intent of beach nourishment is to ensure existence of the recreational beach and provide protection to the development by rebuilding the beach with sand imported from outside the active beach system. This effectively replaces the deficit of sand that is causing the erosion. In this way a natural beach and its associated values will be returned and maintained while providing a buffer of sand to accommodate natural beach fluctuations and protect the property and facilities behind.
The quantity of sand required will be dependent on the design philosophy with respect to the level of initial and ongoing protection and the use of structures to enhance the longevity of the works. Sufficient sand should ideally be provided to be able to accommodate short term storm erosion and a period of long term recession associated longshore sediment transport differentials and sea level rise.
Provision should be made for the placed sand to extend across the full beach profile as illustrated in Figure 3-4, to nourish depleted nearshore areas as well as the upper beach, the total quantity of sand being determined accordingly. If the sand is placed only on the upper visible portion of the beach, redistribution will quickly occur to establish an equilibrium profile giving the impression that the sand is ‘lost’ and the project is a failure. In such a case, the sand is, in fact, not ‘lost’ but remains in the active system providing an overall net gain commensurate with the quantity placed after cross-shore distribution.
Erosion Scarp / Seawall
MS
Existing Beach
Figure 3-4 Typical Beach Nourishment Profile
Dune construction and stabilisation with suitable native dune vegetation to prevent sand loss due to wind erosion usually needs to form part of any substantial beach nourishment scheme aimed at restoring the beach and dune system. In that case, it would incorporate design provisions to prevent dune overtopping and oceanic inundation as well as to accommodate the effects of climate change including sea level rise. Where the aim the nourishment is to re-establish a beach in front of an existing seawall without provision of a dune, the need for stabilisation works such as establishment of native dune vegetation (eg. Spinifex grass) would depend on the potential for wind erosion resulting from the works.
While beach nourishment may affect the ecological values of nearshore rocky reefs, it needs to be recognised that the nourishment sand would be placed in the active zone where the natural

COASTLINE MANAGEMENT CONSIDERATIONS 3-15
G:\ADMIN\B16206.G.MJA\R.B16206.001.03.DOC 3/4/07 11:04
environment is one of substantial fluctuations and disturbances to which the ecological communities adapt naturally. Furthermore, the nourishment would effectively rebuild the beach and nearshore profile to where they once were. As such, while there may be some short term ecological impacts, in the longer term the environment will adapt and recolonise to behave as a natural beach system.
One of the inherent advantages of beach nourishment is that it maintains the natural character and recreational amenity of the beach while also providing property protection. As such, where the beach is severely depleted, it provides many intangible benefits to the general community, as well as a direct economic benefit to those businesses that rely on tourism and the presence of a usable beach.
However, identification and access to sources of suitable nourishment sand is usually a key issue, as is the cost, typically around $2,000-$5,000 per lineal metre of beach depending on the benefit gained, the sand source and method of placement. Transport of the sand to the beach is most cost-effectively achieved by dredging procedures. The use of trucks is typically slow and costly, with adverse impacts on the local community and road infrastructure.
There may be an ongoing cost to maintain this protection and amenity through future maintenance re-nourishment works in areas where the shoreline recession is progressive and/or future sea level rise will exacerbate the present problem. This needs to be assessed and provisions made in the initial design.
3.4.3.1 Nourishment Alone
Beach nourishment alone (ie. without accompanying control structures) is beneficial to the beach system, with no adverse erosion effects, as it introduces additional sand into the active beach system. The sand will gradually disperse to the adjacent beaches under the influence of the prevailing wave conditions. This will provide a net benefit to those adjacent beaches but will gradually reduce the volume of sand and the available buffer in the zone initially nourished.
Accordingly, the design of any nourishment program must be undertaken carefully, recognizing that re-nourishment may be required from time to time to provide ongoing protection, particularly in an area experiencing long term recession. The quantity and frequency of such re-nourishment will be dependent on the initial design philosophy with respect to ongoing protection as well as the prevailing conditions that will be subject to natural variability.
The long term success of beach nourishment as a coastal protection option is therefore dependent on the nature of the shoreline processes (ongoing recession or dynamically stable) and, potentially, ongoing availability of suitable sand and an ongoing commitment (including available funds) for re-nourishment should that be necessary. Where a dune is constructed or forms naturally as a result of the greater quantity of sand available, provision needs to be made for establishment and ongoing maintenance of the dune vegetation, where necessary including beach access walkways and control fencing.
Monitoring should be carried out following nourishment to determine its longer term trend of behaviour, allowing for short term fluctuations associated with storm erosion and subsequent natural beach accretion. This would provide essential information for any future decisions on coastal management at the site.
COASTLINE MANAGEMENT CONSIDERATIONS 3-16
G:\ADMIN\B16206.G.MJA\R.B16206.001.03.DOC 3/4/07 11:04
3.4.3.2 Nourishment with Control Structures
As discussed above, beach nourishment alone is subject to the gradual dispersion of sand to adjacent beaches and ongoing losses as part of long term recession trends. Such losses can be minimised with the use of control structures such as groynes or offshore breakwaters to help hold the sand where it is most needed. The structures will act to hold the sand and change the coastal alignment thereby stabilising the shoreline to a degree and potentially reducing long term recession rates.
While such structures will increase the longevity of the beach nourishment and the protection it provides in some parts of the beach, they can introduce adverse impacts to adjacent beaches, depending on the initial nourishment and re-nourishment strategy. Potential exacerbation of erosion on the downdrift (northern) side of control structures can be minimised by ensuring the initial nourishment essentially ‘fills’ them and re-nourishment essentially provides for the ongoing losses.
Due to the stabilizing effect of the structures, the ongoing overall losses in the nourishment area would be less. As such, the initial quantity of sand necessary would be less than beach nourishment alone to provide the same degree of initial protection. However, there would be the added cost and impacts of the structures.
On a beach with progressive sand loss and associated shoreline recession, erosion of the nourished beach with control structures will commence and be greatest at the updrift (southern) end of each compartment and immediately downdrift of the structures. The rate of long term recession will reduce northwards towards the control structures and be effectively zero immediately updrift (south) of the control structures. As such there will be variations in the rate of recession and associated erosion threat along the shoreline, to be considered in the design of the works. If the desired beach improvement is to be maintained along the whole beach length, re-nourishment would be required from time to time.
Even if the structures are fully nourished initially and ongoing re-nourishment is carried out to replace the eroded sand, some exacerbation of the erosion to the north would be likely due to the stabilising influences of the control structures locking up sand and transferring long term losses to the north. Consideration could be given to either accepting this erosion in undeveloped areas or carrying out other mitigation works such as other control structures and/or the placement of additional nourishment sand to compensate. The quantity and frequency of re-nourishment in this case would therefore be dependent on the need to minimise adverse impacts to the north.
3.4.3.3 Nourishment with Terminal Protection (Seawalls)
Appropriate planning, monitoring and management of a beach nourishment scheme would aim for timely re-nourishment to occur if and as needed to ensure that a suitable buffer is retained to accommodate storm erosion. However, there are often uncertainties associated with incomplete understanding of the likely future beach behaviour or feasibility of future re-nourishment such that there would be a risk that property behind could be threatened by erosion at some stage.
An option for dealing with this risk is to incorporate terminal protection in the form of a seawall together with the nourishment. This seawall would provide protection against further erosion until re-nourishment is carried out. It should be constructed as far landward as possible and would remain

COASTLINE MANAGEMENT CONSIDERATIONS 3-17
G:\ADMIN\B16206.G.MJA\R.B16206.001.03.DOC 3/4/07 11:04
buried for the majority of time and would only become exposed if timely re-nourishment is not carried out.
If the intent of the scheme includes a commitment to ongoing maintenance of a beach in front of the seawall to provide protection and amenity, then the design standard for the seawall could be relaxed in the knowledge that its function is to provide interim protection for a short duration when the beach sand is depleted during storms. In such a case, the wall would not need to be designed to withstand substantial scour in front, as would be the case for a seawall only scenario on a receding shoreline.
An alternative concept of beach nourishment with terminal protection is to rely primarily on the seawall for protection of the property and carry out minor beach nourishment on an opportunistic or as needed basis to maintain some beach amenity. Such an option would be primarily a seawall scenario and would require a well designed wall, as there could be extended periods with minimal or no sand in front of the wall.
Generally, frequent re-nourishment with small quantities of sand is unlikely to be practical or economically viable unless local dredges can be used to access marine sand deposits or regular trucking of sand to the beach is acceptable. At East Beach, the dredging activity to bypass the sand trapped in the river mouth acts to provide a regular small supply of sand.
An additional measure for East Beach could be reconstruction of the seawall along an alignment further landward than that presently existing. That would release some of the dune sand presently trapped behind the seawall as an effective source of some sand for the beach and would be beneficial in retreating the protective line. This would need to be carefully planned and designed to optimise the benefit while maintaining adequate protection of the development.
3.5 Material Sources and Costing Considerations
The implementation of coastal protection works is dependent on suitable material being able to be obtained and placed in a practical, economical and environmentally acceptable manner. General considerations associated with sourcing, cost and applicability of different material types are discussed below, including preliminary estimates in terms of unit costs for capital and ongoing maintenance works provided on the basis of available information.
Cost estimates for the various options are based on these unit rates for comparison purposes. Specific recommended works would be subject to detailed design, impact assessment and tendering processes that may influence the final cost. These are assessed in more detail in Chapter 4. There will also be on costs associated with the design, impact assessment and approval processes for the recommended options.
3.5.1 Coastal Structures
Coastal protection structures are typically of a flexible rubble mound construction type to allow for some movement and to absorb some of the wave energy. Rock is the dominant material used in such structures and is dependant on suitable local sources being available. Alternative construction materials such as concrete armour units and sand filled geotextile bags could also be considered for such structures but have limitations such as high cost and poor visual amenity of concrete units and short practical life due to decay, failure and vandalism of geotextile units.

COASTLINE MANAGEMENT CONSIDERATIONS 3-18
G:\ADMIN\B16206.G.MJA\R.B16206.001.03.DOC 3/4/07 11:04
Rock armour units would need to be obtained from local hard rock quarries. While the exact extent and limitations of the available resource is not known, it is evident that sufficient rock would be available. Should works involving a number of extensive structures be proposed, it may be possible to source the rock from a range of quarries but supply rates may be limited by quarrying operations. In such a case, the construction could possibly be spread over a longer time frame to meet supply limitations.
A significant constraint associated with rock armour is the need to truck the material to the site over local roads. For large projects, this can mean frequent truck movements over an extended time frame.
An indicative cost estimate for the supply and transport to site of rock, as advised by Council based on recent experience is $20 - $22 / T. Quarry run core and filter material may be somewhat cheaper, assumed at $15 - $20 / T
On this basis, together with design and administration costs, typical coastal structure costs including on-site placement at East Beach are estimated as follows:
• Seawall (toe level 0.0m AHD, crest +4.0m AHD) ~ $1,500 / m
• Groyne (toe level 2m below seabed, crest +3.0m AHD)
o 100m long ~ $0.75 million
o 200m long ~ $1.6 million
• Offshore rock breakwater (seabed depth of 4m; toe 2m below seabed; crest +2.5m AHD; 200m long) ~ $3.5 million
Rock structures by their nature are subject to movement and settlement over time. They are also subject to damage during storm events although they are designed to withstand major wave attack. A typical design criterion is for less than 5% damage during a 50 year storm. As such, ongoing maintenance will be required to ensure the structural stability is not compromised. This will necessitate maintaining access to the top of any seawall to allow ‘top up’ works to be carried out. Slumping of groyne and offshore breakwater structures after initial construction is not such an issue provided that the function and structural stability is retained.
An ongoing maintenance cost of 1% per year is typically adopted for rock structures subject to storm wave attack – about $15/m/yr for the seawall. This equates to an average annual seawall maintenance provision of about $15,000-25,000 for the more northern section exposed to the higher waves.
3.5.2 Beach Nourishment
The feasibility of beach nourishment is dependent on the practical and cost-effective availability of a suitable source of sand. Key considerations in this regard are as follows:
• the sand should be from outside the active beach system so that it provides a net gain rather than a redistribution within the system;
• sufficient quantities of sand should be available for both initial and ongoing nourishment;

COASTLINE MANAGEMENT CONSIDERATIONS 3-19
G:\ADMIN\B16206.G.MJA\R.B16206.001.03.DOC 3/4/07 11:04
• the sand should be of suitable quality (grain size and colour) to ideally match the existing beach sand;
• the sand should be able to be obtained and placed without adverse environmental impacts; and
• obtaining and placing the sand should be practical and economically viable.
Potential nourishment sand sources have been considered in terms of their location as discussed below.
3.5.2.1 Offshore Marine Sand Sources
There may be extensive deposits of suitable marine sand on the inner continental shelf that constitute a potentially valuable resource for beach nourishment purposes. At present their existence has not been established. Such deposits are accessible by present day dredging technology and can generally be exploited economically and potentially with less environmental impact than other extractive land uses onshore.
In considering the potential use of offshore marine sand for beach nourishment purposes, key factors include:
• the suitability of the site with respect to the nature of the material and the prevailing coastal processes;
• environmental considerations at both the source and the beach to be nourished;
• present government policies and regulatory requirements with respect to obtaining such sand; and
• the practicality and cost of dredging the sand
Sand from offshore areas is typically dredged with a trailing arm suction hopper dredge that also transports the material to the deposition site where it may be pumped ashore, discharged to the nearshore area and/or placed by bottom dumping on the offshore profile. Placement directly closer to the beach has a more immediate benefit, whereas placement further offshore depends on transport to the beach by the swell waves and may take some years to establish equilibrium.
Dredges commonly are capable of dredging to depths of around 25m and have a hopper capacity of about 3000 cubic metres. Larger international dredges with much greater hopper capacity are able to access sand in water depths greater than 25m and in some cases greater than 50m.
The water depth that the sand can be dredged from has a significant bearing on the cost of nourishment works. If for coastal process or environmental reasons the sand has to be obtained from water depths in excess of 20-25m, a large international dredge would be required. While such dredges are efficient and cost effective for moving large quantities of sand, the establishment and disestablishment costs are high.
If dredging can be carried out in water depths less than 20m (without impacting on coastal processes) there is an opportunity for local dredges to be used with a substantial establishment cost saving. Typical cost estimates for such local dredges are as follows:

COASTLINE MANAGEMENT CONSIDERATIONS 3-20
G:\ADMIN\B16206.G.MJA\R.B16206.001.03.DOC 3/4/07 11:04
• Establishment / Disestablishment ~ $1.0 million
• Operation ~ $8-10 / m3
Typical costs for a large international dredge would be as follows:
• Establishment / Disestablishment ~ $5 million
• Operation ~ $5 - $10 / m3
There is uncertainty as to the willingness of dredging companies to undertake a ‘one-off’ project in a remote location, even if it is of a reasonable size. This would be subject to commercial considerations and different responses have been obtained from different dredging companies.
On the basis that a suitable source of sand is available at a depth less than 20m, typical dredging costs to place the sand on East Beach are likely to be approximately as follows:
100,000 m3: $1.8 million 200,000 m3: $2.6 million 300,000 m3: $3.4 million
It is thus more cost-effective to source more sand once the dredge is established rather than seek to repeat the exercise on a regular basis.
3.5.2.2 Griffiths Island Area
Sand deposits in the Griffiths Island and South-west Passage area offer a relatively sheltered potential source of sand that could be sourced by dredging at significantly lower cost using the existing Port Board dredge than for offshore sources. These are shown in Figures 3.3 and 3.4 and include the following areas, with estimates of available quantities provided by Council:
• Lighthouse Beach (approx 150,000 m3);
• Puddney Ground (up to approx 17-25,000 m3);
• SW Passage south of causeway (30-45,000 m3);
• SW Passage north of causeway (approx 25,000 m3); and
• Channel between original Griffiths and Rabbit Islands (90,000 m3).

COASTLINE MANAGEMENT CONSIDERATIONS 3-21
G:\ADMIN\B16206.G.MJA\R.B16206.001.03.DOC 3/4/07 11:04
Lighthouse Lighthouse BeachBeach
East BeachEast Beach
Griffiths Griffiths IslandIsland
Figure 3-5 Lighthouse Beach
ReserveReserve
SW PassageSW Passage
Puddney Puddney GroundGround
ReserveReserve
SW PassageSW Passage
Puddney Puddney GroundGround
Figure 3-6 SW Passage and Puddney Ground Sand Deposits
The substantial benefits of these source areas are:
• They represent the accumulations of sand caused by the river training works that have led to the erosion of East Beach in the first place, and their use would restore the supply that would have occurred naturally had the works not been undertaken;
• They could be accessed by a small suction dredge capable of discharging directly to East Beach at relatively small cost, probably involving a booster pump to facilitate discharge to the central beach area.
Accessing the sand from SW Passage and Puddney Ground would be relatively straightforward. Dredging from Lighthouse Beach would probably involve a strategy in which the dredging commenced at the sheltered eastern end and worked progressively through the removal area either in the lee of the existing beach barrier or took advantage of calm periods to access the more exposed parts.
There are clearly environmental considerations and various approvals to be addressed in accessing sand from these sources and these will need to be investigated. DSE has indicated (on-site Steering

COASTLINE MANAGEMENT CONSIDERATIONS 3-22
G:\ADMIN\B16206.G.MJA\R.B16206.001.03.DOC 3/4/07 11:04
Committee held 15th December 2006) that there would be no significant issues with removal of the vegetation at Lighthouse Beach and the impact on the Short Tailed Shearwater population may be acceptable. This is a common migrating bird in Australia and there are parts of the island that are not yet colonised. There is no historical connection to the accreted area and they were not recorded in the area until the late 1890s. An off-season nest survey of the island would be needed, however a preliminary estimate of the number lost is about 10-12%.
There is a pair of Hooded Plovers nesting on the ocean side of the island. Other wader birds can adapt to use of the beach.
Further, a key consideration in accessing sand from Lighthouse Beach and SW Passage is that these areas will progressively accumulate sand from the supply past the headland and into the Passage, as it has in the past. That sand would otherwise have passed to East Beach, possibly via deposition in the river. As such, maintenance of the net gain of sand for East Beach achieved by the initial works would require an ongoing commitment to regular dredging of any accumulation there and placement of that sand on East Beach. On the basis that about 300,000 m3 of sand has accumulated there over about 100 years, the annual maintenance requirement is likely to be approximately 3,000 m3/year – to be confirmed by monitoring following the initial works.
This could be achieved by either annual dredging during calm periods or larger dredging (about 15,000 m3) every (say) five years as best suits the purpose. If this is not undertaken, then the net benefit for East Beach will be lost progressively.
Advice from Council is that the small dredge operated by the Port Board costs about $130/hr and delivers about 30-50 m3/hr. This corresponds to about $3-4/m3. The cost would be approximately doubled with a booster pump involved. Adopting the higher rate on the basis that the dredge would need to be re-located into several locations and some interference by wave action is expected, a cost of $8/m3 is reasonable for planning purposes, less than 80% of the cost of dredging from offshore sources and offering a most economical option, should it be permitted.
The likely maximum initial quantity of sand available from this area is about 300-330,000 m3, suitable for initial restoration of East Beach. Any longer term progressive supply into SW Passage from offshore or alongshore is likely to be minor, based on the small quantity accumulated over the past century. However this may potentially be higher if the causeway were removed, at present this is uncertain. For the present planning purposes, any further supply from SW Passage is discounted.
A further source of sand is thus likely to be needed in the future to cater for any ongoing maintenance requirements and the impacts of sea level rise on the beach. Survey monitoring of the initial nourishment works is needed to identify the quantity and timing of such needs.
At the abovementioned rate of $8/m3, the cost of dredging an initial quantity of 300-330,000 m3 of sand from the Griffiths Island area will be $2.4-$2.64million. The timeframe for the dredging will be dependent on the delivery rate of the dredge and the operating hours. Utilising the small dredge operated by the Port Board at an average of 40 m3/hr would take 7,500 hours to dredge 300,000 m3 of sand. This equates to three years of dredging (8 hrs/day). Increasing the daily operating hours would decrease the overall duration.

COASTLINE MANAGEMENT CONSIDERATIONS 3-23
G:\ADMIN\B16206.G.MJA\R.B16206.001.03.DOC 3/4/07 11:04
As an alternative, a dredge with a higher delivery rate of (say) 150 m3/hr could be used to complete the dredging over about 9 months at 8 hours/day. The unit-pumping rate for such a dredge is likely to be similar (ie about $8/m3). However, there would be establishment/disestablishment costs that could be of the order of $100,000 or more depending on the local availability of such equipment. Dredges with even higher delivery rates of (say) 600 m3/hr would further reduce the timeframe of the initial nourishment but most likely at a higher cost. Further investigation of the most cost/time effective option could be undertaken as part of the initial planning and would be subject to tendering processes.
3.5.2.3 Land-based Sand Sources
Possible terrestrial sources of sand for beach nourishment purposes need to be investigated. Considerations with respect to use of such sites include:
• identification of sand source(s);
• suitability of the sand;
• transport of the sand to the site;
• possible need to purchase the property involved;
• rezoning and approval for sand extraction;
• potential environmental impacts including associated habitat loss and acid sulfate soil considerations; and
• site rehabilitation.
An advantage of terrestrial sources for relatively small quantities is that the operation may be carried out at a low rate over a long period, for example by conventional equipment and trucks. A contract or day labour approach may be adopted. However, transportation of the sand may be an issue, particularly if large quantities are involved. Trucks would cause disruption and damage along access roads. Small suction dredges may be used if the transport distance is less than about 1.0-1.5 km.
Costs of such sources, if viable, are typically around $5-$15/m3, depending on the distance and method of transport.
EAST BEACH RESTORATION AND MANAGEMENT 4-1
G:\ADMIN\B16206.G.MJA\R.B16206.001.03.DOC 3/4/07 11:04
4 EAST BEACH RESTORATION AND MANAGEMENT
4.1 Strategy and Objectives
It is clear that the fundamental immediate needs for East Beach are:
• Protection of the development, and
• Restoration of the beach and associated dune system.
The cost of works to achieve this is relatively high within the normal Council provisions and determination of the best strategy and specific design objectives requires careful consideration of the key issues in order to identify the most feasible and cost-effective options.
The East Beach Erosion Study Steering Committee has provided policy direction on the objectives as follows:
• There is a demand to retain the rock seawall as protection for the residential and surf club development located on the dune behind it.
• There is a demand to preserve the existing dune area between the seawall and the properties as a public amenity, ecological habitat and buffer from the sea. Thus, re-aligning the seawall further landward is not a feasible option.
• There is demand for restoration of the whole beach as far north as the northern end of the seawall, although targeted improvement of some key sections (eg adjacent to the surf club) would have priority. This expectation requires a substantial increase in the sand volume seaward of the seawall alignment along about 2 km of the beach. Improvement of some sections of beach could be achieved by local site-specific design provisions involving potentially less need for additional sand, but would leave other parts with no improvement.
• The existing seawall appears robust in some sections but requires reconstruction to bring it up to an acceptable standard to withstand future wave attack along other parts. Superficial inspection of the seawall suggests that it is generally deficient with respect to provision of adequate filter layers, thus allowing progressive loss of sand from behind the structure. However, many years of repeated maintenance by ‘topping up’ the armour rock appears to have established a reasonably robust structure along all but the most northern section, north of around Manifold and Connolly Streets. While an upgrade to the construction at the northern end (Figures 4-1 and 4-2) and continued maintenance along the entire length are needed, the design/construction standard required will depend to an extent on the degree of beach restoration undertaken, itself providing some protection.

EAST BEACH RESTORATION AND MANAGEMENT 4-2
G:\ADMIN\B16206.G.MJA\R.B16206.001.03.DOC 3/4/07 11:04
Figure 4-1 Section of Seawall of Sub-Standard Construction
Figure 4-2 Northern End of Seawall of Sub-Standard Construction
Thus, some upgrade to the construction of the existing seawall along its present alignment is needed.
As well, the general considerations outlined in Chapter 3 clearly identify the need to introduce more sand to the beach in front of the seawall for beach restoration. This requires beach nourishment, with or without additional control structures.
These objectives and the available options are discussed below.
4.2 Option Feasibility Assessment
Two fundamental approaches may be considered, namely:

EAST BEACH RESTORATION AND MANAGEMENT 4-3
G:\ADMIN\B16206.G.MJA\R.B16206.001.03.DOC 3/4/07 11:04
• Do nothing: Continue forward as before with minor repairs to the seawall as needed and adopt a ‘wait-and-see’ approach with regard to the condition of East Beach; or
• Implement beach improvement works: Undertake significant engineering works and management action to restore the beach and upgrade the condition of the seawall.
Based on the present understanding of the processes and behaviour of East Beach, it is considered most improbable that any improvement in the condition of the beach will occur naturally, although there will continue to be normal fluctuations in the level of the beach from time to time associated with storm erosion and subsequent beach recovery. If anything, some further degradation could occur if the erosion process is continuing.
As such, the ‘do nothing’ option would have the following consequences:
1. The beach and parts of the dune would remain in poor condition such that:
For substantial periods of time, beach levels will be low and high tides and waves will impinge on the seawall, with no usable beach available for access and recreational use by the community. At such times, there is a safety risk particularly for young children of being swept against the rock seawall;
There are presently a number of unsightly hazards including the ineffective old timber groyne structures along the beach;
The aesthetic, recreational and environmental value of the beach will continue to be degraded, significantly reducing the economic and social values of the beach for the local and regional community.
2. The rock seawall would remain in poor condition such that:
It will continue to pose a safety risk because of unstable rocks and difficulty of access across it;
It will be structurally inadequate to withstand storm wave attack, particularly with regard to the unstable rock face slope in many parts, the general lack of proper graded filter layers and inadequate construction at its northern end. Houses located along the dune ridge behind the seawall would be at risk should the wall fail during major storm wave attack.
While it is not feasible to quantify these risk factors within the scope of this study, it is noted that:
• The value of the housing located along East Beach is approximately $87million;
• Port Fairy is a popular tourism focus and East Beach is widely used by the local and regional community for recreation. Many of the houses along East Beach are rented to people who holiday there because of the benefits offered by the beach and its amenity;
• There are essentially no records or documented monitoring data to quantify beach behaviour and assess requirements for future management action.
As such, it is strongly recommended that the option to implement beach improvement and seawall upgrade works, with associated appropriate management and maintenance action, be adopted for East Beach. Details of such action are outlined below.

EAST BEACH RESTORATION AND MANAGEMENT 4-4
G:\ADMIN\B16206.G.MJA\R.B16206.001.03.DOC 3/4/07 11:04
4.3 Seawall Upgrade
4.3.1 Required Works
In those northern sections where the seawall requires upgrading (eg. Figures 4-1 and 4-2), an objective should be to achieve a design standard similar to that illustrated in Figure 4-3, providing for:
• An adequate height of structure to about RL+4m (AHD);
• A flexible structure that may adapt its shape to the conditions;
• A toe foundation embedded soundly in the upper beach such that it will not be significantly undermined during severe wave attack;
• A backing filter layer (or layers) of either fine rock (gravel) and/or geotextile fabric over the sand, grading up to the larger armour rock in such way that neither the sand nor the finer rock may be lost through the structure during wave attack;
• Two layers of armour rock placed randomly with void spaces to minimise wave uprush and act to absorb the wave energy;
• A suitable design for the northern end to protect against ‘out-flanking’ by erosion behind the last section of rocks, most effectively involving a landward return of the alignment; and
• Rehabilitation of land behind the seawall as required for stability, access and control.
Use should be made of the existing rock as much as feasible, particularly where it is well bedded into the beach to act as a toe foundation, thus minimising the cost of rock supply;
SLOPE 1 : 1.5SLOPE 1 : 1.5ROCK ARMOURROCK ARMOUR(design size; 2 layers)(design size; 2 layers)
GEOTEXTILE GEOTEXTILE FILTER LAYERFILTER LAYER
INTERMEDIATE INTERMEDIATE ROCK FILTER ROCK FILTER LAYERLAYER
TOE TOE FOUNDATIONFOUNDATION
FILTER LAYERS FILTER LAYERS PREVENT SAND PREVENT SAND LOSS FROM LOSS FROM BEHINDBEHIND
Figure 4-3 Typical Seawall Design Section
In some parts of the more sheltered southern end of the beach where the seawall does not serve to protect valued development, there may be scope to remove the seawall altogether, thus allowing the beach and dune there to function naturally, restoring the natural sandy beach character there. In that area, the seawall presently exists as sparsely placed rocks with little tangible protective function.
The northern end of the seawall presently is in poor condition and requires complete reconstruction to a suitable design standard. As well, provision is needed to end the seawall at the northern end of the

EAST BEACH RESTORATION AND MANAGEMENT 4-5
G:\ADMIN\B16206.G.MJA\R.B16206.001.03.DOC 3/4/07 11:04
existing residential allotments. It is noted that, at the time of this reporting, decisions have yet to be reached about the status of proposed development of the dune land further north and whether or not any seawall protection might be permitted. It is necessarily adopted herein that no such works would be permitted. Accordingly, a landward ‘return’ to the seawall to tie it into the dune there is needed, as illustrated conceptually in Figure 4.4. It should be noted that the final detail of the end design will need to be adapted to the dune topography at the time and the return extended sufficiently far landward to avoid outflanking by wave erosion. The use of two layers of armour rock on the seawall face will minimise wave reflection related end effects to the north.
Existing northern residentia l a llotment
Property boundary
Property boundary
DuneEroded Dune
Beach
Ocean
Seawall crest at RL+4m
Seawall toeN ot to scale
Seawall face)(2 layers armour rock with
voids to absorb energy)
Landward seawall return extended to suit dune topography(cover with sand to reform dune profile)
Crest
Toe
I:\B16206_I_BRH Port Fairy DCP\PPT\COA_001_070330 Seawall End Configuration.ppt
Seawall
Figure 4-4 Conceptual Seawall End Configuration
4.3.2 Engineering Feasibility
Carrying out the structural works to achieve the above is feasible on the basis that there is adequate rock supply, both as reworking of existing rock and importing of additional material as needed. It is understood that there are quarries with good quality rock in reasonably close proximity that have been utilised on previous occasions. Plant and equipment can be operated from the beach but may be affected by downtime during the high tides while the beach levels are low. This may affect the cost and timing of the works.
4.3.3 Works Program and Cost Estimate
Assumptions adopted in preparing a works program and an indicative cost estimate for upgrading the existing seawall to a stable and safe standard of construction are as listed in Table 4.1.

EAST BEACH RESTORATION AND MANAGEMENT 4-6
G:\ADMIN\B16206.G.MJA\R.B16206.001.03.DOC 3/4/07 11:04
Table 4-1 Summary of Seawall Structural Status and Upgrade Works Required
Beach Section (Length)
Existing Seawall Status Action Needed Adopted Cost Base
($/m)
Priority
Moyne R to Battery Lane (300m)
Loose rock with little cohesive structural function
Remove rocks and restore dune function
$50/m Low
Battery Lane to Lydia Pl. (700m)
Inadequate design with no filter layer but generally sound - in relatively sheltered part of beach
Detailed status review. Regrade existing armour rock to a maximum slope of 1 in 1.5 and stabilise rocks where needed. Monitor and maintain as required.
$50/m Low
Lydia Pl. to Manifold St (900m)
Inadequate design with no filter layer but sound due to repeated topping up of rock over many years – exposed to moderate wave attack and subject to movement – some parts unsafe with steep slope or unstable rocks.
Detailed status review. Provide filter layer and regrade existing armour rock to a maximum slope of 1 in 1.5 and stabilise rocks where needed. Monitor and maintain as required.
$200/m (along ~50%)
Moderate
Manifold St. to Connolly St. (300m)
Inadequate design and construction with no filter layer and insufficient armour protection – exposed to high wave attack and subject to movement – some parts unsafe with steep slope or unstable rocks.
Reconstruct at 1 in 1.5 slope to establish: o a base filter layer
incorporating existing smaller rock and bedded toe rock as available;
o two layer armour protection incorporating existing and additional armour rock.
Monitor and maintain as required.
$500/m Moderate to High
Connolly St. north (200m)
Inadequate design and construction with no filter layer and insufficient armour protection – exposed to high wave attack and subject to movement – some parts unsafe with unstable rocks.
Reconstruct at 1 in 1.5 slope to establish: o a base filter layer
incorporating existing smaller rock and bedded toe rock as available;
o two layer armour protection incorporating existing and additional armour rock.
Monitor and maintain as required.
$1,000/m High
End of Seawall (20m)
Inadequate design and construction with no filter layer and insufficient armour protection – exposed to high wave attack and subject to movement – some parts unsafe with unstable rocks.
Construct at 1 in 1.5 slope to establish: o a base filter layer
incorporating existing smaller rock and bedded toe rock as available;
o two layer armour protection incorporating existing and additional armour rock.
Monitor and maintain as required.
$2,000/m High

EAST BEACH RESTORATION AND MANAGEMENT 4-7
G:\ADMIN\B16206.G.MJA\R.B16206.001.03.DOC 3/4/07 11:04
Based on the action requirements and priorities in Table 4.1, the work should commence at the northern end of the existing seawall extent where the highest priority is to bring the seawall up to a standard that would withstand severe wave attack, consistent with Figure 4-3. While consideration is given to the requirements further north, a properly constructed end design for the seawall should be implemented.
Following this, work may progress towards the south, establishing a filter layer and two armour layers at approximately a 1 in 1.5 slope until further inspection shows that the seawall is to an adequate basic standard that would require minimum ongoing maintenance. The work may extend over several years, depending on availability of Council funding for the work.
4.4 Beach Restoration
4.4.1 Overview
Restoration of the beach will require the importation of additional sand. Potential sources and quantities of the sand are discussed in Chapter 3 and specified below. It is recommended that the sand be placed along the beach between the northern Moyne River training wall and around the Surf Club area and allowed to disperse both alongshore and across-shore under the prevailing waves and currents. As such, the sand will be integrated into the normal active system and the beach will adopt its natural dynamic shape, subject to normal erosion and accretion cycles associated with storm erosion and subsequent beach recovery.
In the course of gradual assimilation of the new sand into the beach system, it is expected that:
• The placed sand will develop erosion scarp features from time to time. It is important that the community is advised of this and understands that it is part of the design process, and that the sand is not being ‘washed away’ as is commonly thought;
• The sand will distribute along the beach and provide benefit to the northern part of the beach over time, being the most cost-effective means of nourishing that area given its distance from the sand source with regard to feasible dredging capability;
• At times of significant beach accretion, a dune may form in front of the seawall. This may need to be managed to prevent loss by wind erosion, best achieved by vegetative cover; and
• The nourishment will eventually extend past the northern limit of the seawall and supply the beach system further north. Action to manage the dune system there will be needed to ensure adequate vegetative cover for foredune stability.
4.4.2 Removal of Existing Timber Groynes
As an adjunct to the beach restoration, it is considered that the existing timber groyne structures are providing no benefit to the beach and should be removed prior to the nourishment works. They are in poor condition. It is clear that sand build-up on the beach, when it occurs, is essentially equal on both sides of these groyne structures, clear evidence that they are not acting as groynes in terms of trapping sand on one side. Their performance confirms that the longshore sand movement close inshore is negligible and not compatible with the effective use of groynes at this beach.

EAST BEACH RESTORATION AND MANAGEMENT 4-8
G:\ADMIN\B16206.G.MJA\R.B16206.001.03.DOC 3/4/07 11:04
4.4.3 Beach Nourishment Design Requirements
As a first assessment, the likely minimum quantity of sand required to restore the 2 km length of beach would be about 300-330,000 cubic metres, as is available from the Griffiths Island area. This may be considered in the context that:
• the best estimate of the quantity of sand lost from the beach due to the river entrance works in the 1800s and early 1900s is approximately 500,000 cubic metres and some re-adjustment in the beach alignment towards a new equilibrium with the altered sand supply regime has most probably occurred subsequently; and
• that quantity represents 150 m3/m, a triangular fillet of sand 2 metres high at the beach grading to zero at a distance of 150 metres offshore.
While this provides an impression of the quantity involved, it must be recognised that the sand placed on the beach will be integrated into the natural processes of erosion from the beach during storms and subsequent gradual return to the beach by the swell waves. Thus, the sand will be distributed both alongshore and across the profile out to water depths of at least 6-8 metres (Figure 4-4) and the realistic initial benefit of a nourishment quantity of 300,000 m3 in terms of beach width will probably be around 20 metres.
Beach Nourishment
-6
-4
-2
0
2
4
6
8
0 100 200 300 400 500Distance (m)
Leve
l (m
AH
D)
Existing
Mean sea level
Nourishment
Beach Nourishment
-6
-4
-2
0
2
4
6
8
0 100 200 300 400 500Distance (m)
Leve
l (m
AH
D)
Existing
Mean sea level
Nourishment
Figure 4-5 Distribution of Sand Across the Nearshore Profile (Conceptual Only)
The degree to which such restoration would be long-lasting depends on the present situation with regard to present supply of sand past the river entrance and the extent to which the placed sand disperses to the north. The sand supply has not been studied in detail and there is uncertainty about it as discussed in Chapter 2, however, it is likely that a substantial supply direct to East Beach occurs naturally while that sand trapped in the river entrance is now dredged and placed onto the beach system.
On the basis that this supply matches any natural longshore transport along the beach, as suggested by CES, the nourishment would have a long period of beneficial effect (many decades), although dispersing gradually along the beach to the north. If the supply is significantly deficient, then the present prognosis for the beach is poor in any case, with progressive loss of sand. Potentially, a greater quantity of sand would thus be needed, either initially or over time.
EAST BEACH RESTORATION AND MANAGEMENT 4-9
G:\ADMIN\B16206.G.MJA\R.B16206.001.03.DOC 3/4/07 11:04
4.4.4 Beach Nourishment Feasibility
The major issues affecting the feasibility and cost of beach nourishment are:
• availability of suitable sand;
• the quantities needed and available;
• the source location(s) and constraints on obtaining it (eg environmental / logistics / ownership / cost);
• sand transportation methods (dredging / trucking); and
• cost effectiveness and cost-benefit.
Review of potential sand sources indicates the following feasible options:
• sand derived from SW Passage, Puddney Ground and Lighthouse Beach;
• offshore in deep water (>20m depth), however no investigation has been undertaken to confirm available suitable sand there;
• onshore dune sand along the northern section of coast towards Reef Point; and
• onshore or nearshore sand along the section of coast east of Reef Point.
Of these, sand derived from SW Passage, Puddney Ground and Lighthouse Beach would be by far the most suitable in terms of cost effectiveness and cost benefit. A significant benefit of this option is that it would reduce (or possibly negate) the sand flow into the river and the present associated dredging cost. Preliminary discussions with DSE officers indicate that this may be an acceptable option, subject to further detailed consideration and appropriate approvals. This option would supply the required initial quantity of sand, providing about 300,000–330,000m3.
However, there may be a future need for additional sand. A further offshore source exploited by dredging would probably offer the most cost-effective and beneficial way to obtain any such necessary additional sand. It will be essential to undertake a detailed investigation to identify and assess potential source areas. It is strongly recommended that this be undertaken as soon as practicable so that the feasibility of obtaining sand from an offshore source may be determined early in the works program. This may have some influence on the full extent of extraction needed from the Griffiths Island area.
Approvals to source the sand are likely to require comprehensive impact assessment.
4.4.5 Dune Rehabilitation and Management
At present, the dune system backing the beach is in poor condition in that extensive areas behind the seawall are infested with weeds that are smothering the native plant species and degrading the natural dune ecology. As well, to the extent that the dunes north of the seawall and at the southern end of the beach have foredune components that are vulnerable to wind erosion, these areas need to be monitored and managed to ensure adequate vegetative cover protected from excessive pedestrian interference. Following beach nourishment, particularly the second stage of nourishment involving an additional (approx) 200,000 m3 from offshore, this is likely to also apply along parts of the beach in front of the seawall.

EAST BEACH RESTORATION AND MANAGEMENT 4-10
G:\ADMIN\B16206.G.MJA\R.B16206.001.03.DOC 3/4/07 11:04
Accordingly, it is recommended that:
• the existing dune vegetation be assessed and action taken to remove and control weeds and to establish and maintain suitable native plants; and
• incipient foredunes along the beach unit be managed to establish and maintain suitable native coloniser vegetation (eg Spinifex) to prevent wind erosion problems as the nourishment works contribute to increased sand along the upper beach.
4.4.6 Impacts of Climate Change and Sea Level Rise
Over time (future decades), East Beach will experience the effects of climate change and sea level rise (refer Section 2.4). The condition at East Beach will tend to become worse, primarily due to sea level rise. If no beach restoration is undertaken, the beach will become progressively more depleted in that the tide will extend higher and cover the upper beach more frequently and for longer duration. As a result, the beach will offer less recreational amenity and the existing rock seawall will become under greater storm wave attack and threat of failure.
Action in the form of nourishment will overcome both of those issues, but will need either an increased initial quantity of sand or repeated re-nourishment to cater for the progressively increasing sea level for long-term sustainability. There remains considerable uncertainty about the rates and impacts of future accelerated sea level rise. As such, the preferred most cost-effective option at this stage is to maximise the initial nourishment quantity to the extent feasible, within cost constraints, and then monitor the future needs. In that way, the immediate benefits for the beach and protection of the seawall are maximised and a longer life of the works undertaken achieved.
4.5 Beach Nourishment Works Program
4.5.1 Beach Restoration
To overcome the erosion problem at East Beach, two specific actions are needed:
• to restore the beach to a more “natural” height and width, the sand previously lost must be replaced. The volume of sand required is indicated by the amount trapped in the vicinity of the mouth of the river and is considered to involve a minimum of 300,000 m3 and preferably up to 500,000 m3, given the uncertainties involved and provision for future sea level rise.
• to maintain the beach in its improved state the “natural” rate of supply of sand must be maintained and impacts of sea level rise overcome. It is unknown whether or not an ongoing net loss of sand still occurs along East Beach or if the natural supply past the headland is sufficient to make up any deficiency relative to the movement of sand out towards the northeast.
In the short term, Lighthouse Beach and parts of SW Passage and the Puddney Ground have been identified as a suitable source of about 300,000 m3 of sand. This offers good quality sand that should be placed on the most eroded stretch of East Beach. This placement could be achieved using the existing dredging equipment, but at additional cost related to an increased pumping distance to the sand placement site. The pumping distance would be approximately 1.2km to place it as far north as the surf club, compared with the existing distance of 100-200 m to the southern end of the beach.
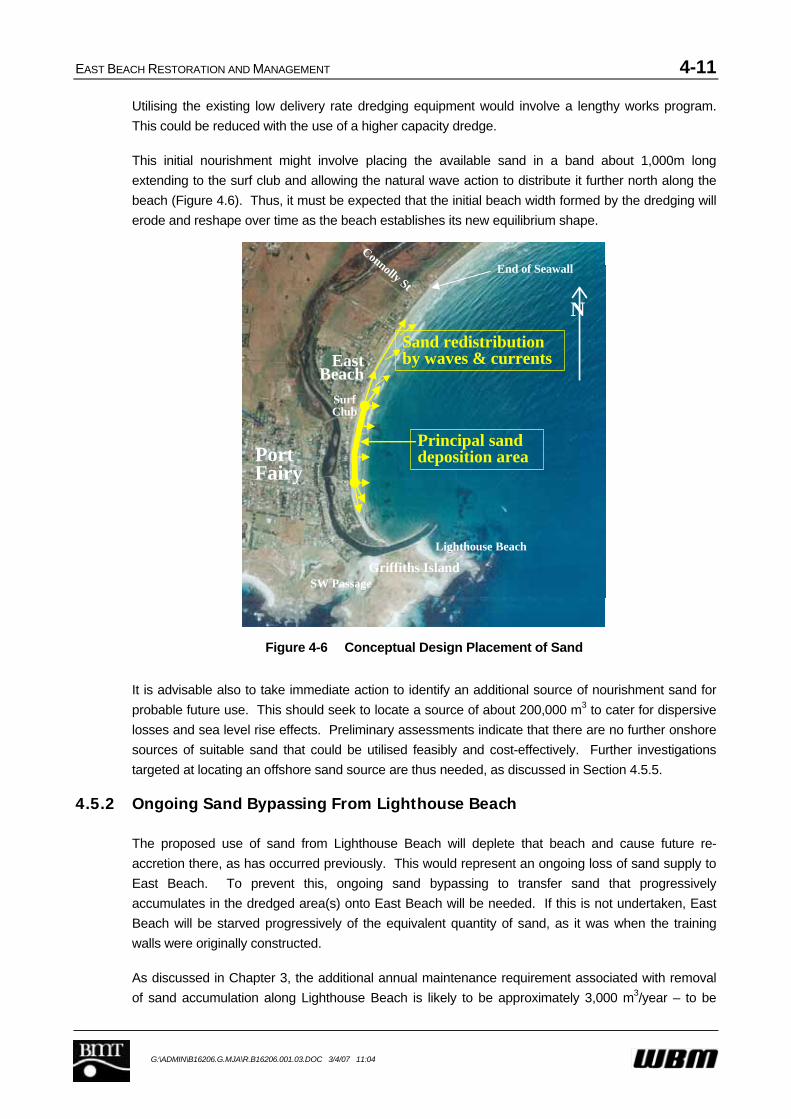
EAST BEACH RESTORATION AND MANAGEMENT 4-11
G:\ADMIN\B16206.G.MJA\R.B16206.001.03.DOC 3/4/07 11:04
Utilising the existing low delivery rate dredging equipment would involve a lengthy works program. This could be reduced with the use of a higher capacity dredge.
This initial nourishment might involve placing the available sand in a band about 1,000m long extending to the surf club and allowing the natural wave action to distribute it further north along the beach (Figure 4.6). Thus, it must be expected that the initial beach width formed by the dredging will erode and reshape over time as the beach establishes its new equilibrium shape.
East Beach
Port Fairy
Griffiths IslandSW Passage
Lighthouse Beach
N
Surf Club
Connolly StEnd of Seawall
Principal sand deposition area
Sand redistribution by waves & currentsEast
Beach
Port Fairy
Griffiths IslandSW Passage
Lighthouse Beach
N
Surf Club
Connolly StEnd of Seawall
Principal sand deposition area
Sand redistribution by waves & currents
Figure 4-6 Conceptual Design Placement of Sand
It is advisable also to take immediate action to identify an additional source of nourishment sand for probable future use. This should seek to locate a source of about 200,000 m3 to cater for dispersive losses and sea level rise effects. Preliminary assessments indicate that there are no further onshore sources of suitable sand that could be utilised feasibly and cost-effectively. Further investigations targeted at locating an offshore sand source are thus needed, as discussed in Section 4.5.5.
4.5.2 Ongoing Sand Bypassing From Lighthouse Beach
The proposed use of sand from Lighthouse Beach will deplete that beach and cause future re-accretion there, as has occurred previously. This would represent an ongoing loss of sand supply to East Beach. To prevent this, ongoing sand bypassing to transfer sand that progressively accumulates in the dredged area(s) onto East Beach will be needed. If this is not undertaken, East Beach will be starved progressively of the equivalent quantity of sand, as it was when the training walls were originally constructed.
As discussed in Chapter 3, the additional annual maintenance requirement associated with removal of sand accumulation along Lighthouse Beach is likely to be approximately 3,000 m3/year – to be

EAST BEACH RESTORATION AND MANAGEMENT 4-12
G:\ADMIN\B16206.G.MJA\R.B16206.001.03.DOC 3/4/07 11:04
confirmed by monitoring following the initial works. If this is not undertaken, then the net benefit for East Beach will be lost progressively.
This is likely to be most cost-effectively undertaken achieved by dredging about 15,000-25,000 m3 every (say) 5-8 years, additional to the present sand dredging commitment of the Port Board, as confirmed by monitoring of the deposition rate. The sand could be placed along the southern part of East Beach without the need for booster pumping. The cost of such dredging would most likely represent an incremental increase in the ongoing commitment of about $30,000/yr. This would be additional to the cost of the present river maintenance dredging undertaken by the Port Board.
4.5.3 Training Wall Structure
At present, the southern training wall contains voids in its rock structure that allow through-flow of wave and current action, carrying a significant quantity of sand into the river channel. Some sand most probably also enters the river through the channel entrance. Sand deposited in the river channel is dredged and placed on East Beach to maintain channel depths and supply sand to the beach.
To improve the condition of the river channel and contain within Lighthouse Beach the sand that would otherwise pass through the training wall, works to seal the voids in the wall could be undertaken. This would involve:
• Inspection and assessment of the wall once the dredging of Lighthouse Beach is complete to determine the full scope and nature of work needed;
• Potentially, removal and replacement of sections of the outer (southern) face rock armour to provide for an impervious inner filter layer that would prevent sand flow and two layers of rock armour. Existing rock would be re-used.
This could be needed along about 100-200m of the wall at a potential approximate cost of $1,000/m, representing about $100,000-200,000 (adopt $150,000) depending on the assessed extent of work required.
4.5.4 Associated Works at Griffiths Island
A number of works as follows need to be undertaken in association with the sand dredging at Griffiths Island:
• Removal of the SW Passage causeway to facilitate through-flow of sand supply there, with installation of a temporary crossing while monitoring of the causeway removal is undertaken. This should provide for dog/fox access control;
• Re-establishment of the Wannon Water sewage outfall pipeline presently located on the causeway;
• Re-establishment of a permanent crossing over SW Passage, suitably designed based the results of monitoring.
Cost estimates for these works have been provided through Council and are included in the works program (Table 4.2).

EAST BEACH RESTORATION AND MANAGEMENT 4-13
G:\ADMIN\B16206.G.MJA\R.B16206.001.03.DOC 3/4/07 11:04
4.5.5 Investigation and Review Program
There is a need for further investigations and monitoring in order to:
• locate an offshore source of up to 200,000 m3 sand for direct beach nourishment;
• gain more basic knowledge of the beach processes at East Beach, and
• monitor the response to the proposed restoration works to assess their performance and guide future action.
A program of ongoing investigation and beach monitoring as discussed below should be implemented by Council to facilitate full restoration of East Beach and to monitor beach behaviour and response to works as a basis for future action planning. Some of the beach monitoring work to add to the available knowledge of how the beach behaves can be implemented immediately at low cost, while location of the sand source and more comprehensive monitoring surveys require allocation of significant Council funds.
The proposed investigation and monitoring components are listed below:
Offshore Sand Source
The offshore sand source for beach nourishment must be outside the zone of active sand movements of the beach. That is, it must be beyond the regions of:
• natural sand supply to the beach that occurs naturally at present, and
• normal cross-shore transfers of sand that occur during storm erosion events and subsequent beach recovery.
Any sand taken from within those areas would represent extraction from the beach system and sand supply that presently exists and would represent no net sand gain as is required.
It is known that (for example) storm erosion exchange of sand at the Gold Coast occurs out to a depth of 15m. Recent research involving analysis of long term survey data (Patterson 2007) shows that natural onshore supply of sand can occur from depths as great as 18-20m along the northern Gold Coast under a prevailing wave climate approximately equivalent to that at Port Fairy. Thus, the required offshore sand source must be located at water depths greater than at least 15 metres and preferably greater than 20m. However, from a practical and economic dredging perspective, sand sources at depths greater than about 30m may be difficult to obtain. Hence, the investigation should target seabed areas at depths between 15m and 30m.
No information is presently available about offshore sand deposits. It is known also that sand exists on the seafloor across the outer parts of Port Fairy Bay. Further, DSE has undertaken a program of offshore seabed side-scan sonar surveys to identify the nature of the seafloor and its faunal habitats. This has been undertaken in conjunction with Parks Victoria and Deakin University. This data would provide an initial source of information that could inform further investigations, including seismic and coring work, to verify the nature and thickness of any substantial sand deposits that exist offshore.
An investigation program of this nature is likely to extend over around 6 months and cost (order of) $100,000.
EAST BEACH RESTORATION AND MANAGEMENT 4-14
G:\ADMIN\B16206.G.MJA\R.B16206.001.03.DOC 3/4/07 11:04
Low Cost Beach Monitoring
It is feasible to undertake simple but effective beach monitoring without significant expense. This may involve input from Council staff, surfclub members or volunteer residents, with minimal technical knowledge or expertise. Typically, it could include:
• Volunteer daily observations of waves, currents and sand transport at East Beach using established observation techniques for reasonable accuracy (Patterson & Blair 1983).
• Regular (say monthly) survey of selected beach cross-sections using simple techniques.
• Visual inspections of the rock seawall following each substantial storm erosion event to monitor the integrity/stability of the rock wall.
Comprehensive Monitoring Surveys
Comprehensive monitoring needs to be undertaken by appropriately qualified and experienced specialists, with a view to quantifying the processes taking place and the overall response of the beach system to the nourishment works, providing accurate and defensible data for consideration and assessment in any future action. This would involve:
• Detailed beach and offshore level surveys, initially six (6) monthly and subsequently less regularly, along the whole East Beach unit to quantify both the cross-shore sand movements (offshore dispersion of the nourishment and storm erosion) and the performance of the beach nourishment works in terms of:
o retention of the nourishment sand quantity, and
o any need for further maintenance nourishment action.
• Detailed beach and nearshore level surveys, initially six (6) monthly and subsequently less regularly, along the Lighthouse Beach and river entrance area to quantify ongoing trapping of sand there in order to:
o monitor the rate and pattern of sand accumulation, and
o determine the most effective re-dredging program as part of ongoing bypassing of the sand from that source area.
4.6 Recommended Planning and Regulatory Controls
4.6.1 East Beach Management and Beach Access
Apart from the need for restoration of the beach and upgrade of the seawall as discussed in detail in this report, the present management practices undertaken by Council along the developed part of East Beach appear generally suitable. Key aspects that require continuing attention include the following:
(i) No sand is to be removed from the beach system (onshore and offshore);
(ii) No sand is to be removed and the dune vegetation protected to prevent wind erosion along the dune system;
EAST BEACH RESTORATION AND MANAGEMENT 4-15
G:\ADMIN\B16206.G.MJA\R.B16206.001.03.DOC 3/4/07 11:04
(iii) Should new building be undertaken on the dune beyond the set-back, consideration should be given to excavating sand from the development site and returning it to the beach system, with building fill being imported as needed from outside the beach/dune system;
(iv) Ongoing visual inspection and maintenance of the rock seawall as needed should be undertaken to ensure safety and structural stability;
(v) Controlled public paths and/or stairs should be provided at suitably spaced locations to ensure convenient and safe access to and from the beach;
(vi) Protection, maintenance and enhancement of the dune system with native vegetation plantings and weed control.
4.6.2 Activities in Undeveloped Dune Areas
It is recommended that Council develop guidelines to regulate works and activities within potential erosion hazard zones. This may involve integration with relevant regional and state planning provisions. The dune system should be managed in accordance with the methods and procedures recommended by DSE. Such management may include planting and protection of native dune vegetation, clearing of weed species and provision of controlled access across the dunes.
General regulations to protect the natural dune system could include:
(i) No structures may be erected or interference caused within the erosion prone dune, beach or nearshore areas. Such structures and interference includes buildings, roads, carparks, facilities, services, seawalls or other equivalent works as well as direct removal of sand or damage to dune vegetation causing wind erosion;
(ii) No sand is to be removed from the beach system (onshore and offshore);
(iii) No sand is to be removed and the dune vegetation protected to prevent wind erosion along the dune system;
(iv) No subdivision of land to provide additional building lots which lie wholly or partially within the erosion prone dune will be permitted unless it can be shown that the buildings provided for in the subdivision can be located wholly outside the erosion prone zone.
(v) Should new development be approved on the dune, consideration should be given to excavating sand from the development site and returning it to the beach system, with building fill being imported as needed from outside the beach/dune system.
4.7 Works and Investigation Program and Cost Estimate
A summary of the recommended coastal engineering and management actions for East Beach is set out in Table 4.2, including a summary of likely costs. An indicative program of works and investigations is set out in Figure 4-7.

EAST BEACH RESTORATION AND MANAGEMENT 4-16
G:\ADMIN\B16206.G.MJA\R.B16206.001.03.DOC 3/4/07 11:04
ACTIVITY
Investigations & MonitoringPlanning & approvals
Low cost beach monitoringIdentify offshore sand source
Detailed surveys - East BeachDetailed survey - Lighthouse Bch/SW Passage
Seawall UpgradeReview, planning & approvalsReconstruct Connolly St north
Repair Manifold to Connolly StUpgrade remainder as needed
Associated Works at Griffiths IslandRemove SW Passage causway
Temporary crossing and sewage outfallPermanent causeway crossing
Beach Nourishment from Griffiths IslandPlanning & approvals
Dredging - SW Passage sourceDredging - Puddney Ground source
Dredging - Lighthouse Beach sourceDredging - Channel between Griffiths/Rabbit Is
Ongoing sand bypassing from Lighthouse Beach
Final Beach Nourishment - Offshore SourcePlanning & approvals
Dredging - Offshore source
Dune Rehabilitation and ManagementInitial weed removal and rehabilitation
Ongoing dune management
2011 / 122007 / 08 2008 / 09 2009 / 10 2010 / 11
Figure 4-7 Work Program and Cost Estimate
The actual costs of implementing the works may vary somewhat from those depending on the adopted scope, circumstances and timing of the works and activities undertaken. In particular, the cost of dredging from offshore to nourish the beach will depend on the location and quantity of sand involved.
It should be noted that non-action, or works inconsistent with the long term aims for beach management, may be inefficient and involve greater cost in the long run. As an example, continued maintenance of the rock wall without sand nourishment will not restore the beach and may involve considerably greater annual expense on seawall maintenance than would be needed with the beach restored.

EAST BEACH RESTORATION AND MANAGEMENT 4-17
G:\ADMIN\B16206.G.MJA\R.B16206.001.03.DOC 3/4/07 11:04
Table 4-2 Summary of recommended restoration and management actions for East Beach
Priority (some occur concurrently) Stage 1 2 3 4 5 6 7
The Problem
Unstable sections of rock wall a public risk of falling rocks getting to the beach and being on the beach.
Poor standard to end of rock wall with extensive ‘end
effect’
Over the past century 500,000m3 of sand has
accumulated in and around Griffith Island starving East
beach of sand.
Weed infested and poorly vegetated dune structure.
Lack of records of beach volume, shape and
conditions.
Aging wooden structures (1960’s) with missing sections and gaps that do not restrict
sand movement.
The causeway blocks water and sand flows, the sand build up.
The structure provides easy access for dogs and foxes into the Griffith
Island Shearwater colony. Wannon Water ocean outfall pipe also crosses the passage at this
point.
Top up for the 500,000m3 of sand to be replacement that
can not be removed from Griffith Island Area.
After monitoring the effects of removing the causeway a
permanent accessway needs to be constructed.
Ongoing maintenance of sand removal from Lighthouse Beach.
Sand leakage through training wall into river
channel
Such a multi faceted project requires close
management to ensure satisfactory
completion.
Do Nothing
Public risk continues and erosion continues behind
the rock wall towards private property $87M in rated
value. ‘End effect’ will continue to erode dune north of rock
wall.
East Beach continues to be starved of sand; erosion
continues with reduced beach area and the rock wall must deflect the storms to protect
the private property.
Continued weed growth smothering and over
growing struggling native plants.
A collection of anecdotal observations lacking
quantified data.
Public risk from rusting and broken wooden structures in the middle of the beach area.
Continued silting of Moyne River and sand accumulation in the
Passage.
High Shearwater mortality due to dogs and foxes.
Treated sewerage effluent discharged to the sea just off Griffith
Island.
Sand volumes will not provide enough protection to
withstand storm events or cater for sea level rise.
The temporary crossing will have a finite life and need of
replacement.
Lighthouse Beach would again fill with sand at the expense
of the benefit provided by the works for East
Beach.
Sand would flow through into the river
channel
Responsible use of public funds must have milestones of
achievement.
Proposed Action East Beach Rock Wall Repairs
East Beach Renourishment 300,000m3 from Griffith Island
Area
East Beach dune rehabilitation East Beach monitoring East Beach Groynes removed
SW Passage causeway removal with temporary crossing installed
include fox/dog control gates
East Beach Renourishment 200,000m3 from
offshore
SW Passage causeway permanent crossing install
Bypass sand from Lighthouse Beach to
East Beach.
Seal leakage voids in training wall.
Project Management
The Outcome
Reduced public risk with continued property
protection until beach and foredune returns.
Reduced ‘end effect’ due to the rock wall.
SW Passage, Puddney Ground, Lighthouse
Beach, and Inter Island channel dredged onto East
Beach. Providing sufficient sand to cover the rock wall and form
an incipient dune.
New sand vegetated with native species to provide
habitat and stability to newly formed incipient
dune.
Records of beach before and during accretion in correlation to the works
being undertaken.
Reduced public risk from the dilapidated structures.
Water flows through and out the Moyne River carrying sand from the west, whilst productively scouring
the river, reducing siltation. Enable effective management of
Shearwater colony. Wannon Water outfall pipe lifted out
off causeway fixed on to new access way.
Provide sufficient sand to form a foredune capable of withstanding storm events.
An aesthetic structure to suit the purpose and to alleviate
issues raised during the monitoring of the temporary
structure.
Ongoing sustainability of the East Beach
rehabilitation program.
Minimisation of sand deposition in the river
channel.
Scheduled tasks completed on
schedule and on budget to the
satisfaction of the community, council, DSE and the funding
agency.
Cost Estimates (based on
2007 costing, future years need to allow CPI increases)
Rock wall upgrade and end design
$O.5M
Dredge 300,000m3 of sand $ 2.5M
Rehabilitation planting and weed control program
$0.2M
5 year Monitoring program $0.25M
Remove Groynes $0.1M
Causeway removal $50k
Temporary Access construction $160k
Sewer Pipe attached to bridge $170k
Investigation of off shore sources (2008)
$0.1M
Dredge 200,000m3 of offshore sand (2011)
$2.1M
Permanent Accessway construction
$0.35M
Sand bypassing ($30k) additional to Port Board dredging
cost ($80k).
Seal training wall $0.15M
5 year Project Management
$0.35M
Timing 2007/08 2007/08 - 2011/12 2007/08 - 2011/12 2007/08 - 2011/12 2007/08 June-Nov 2008 2008-2011 2011/12 2011/12 ongoing 2007/08 - 2011/12
Funding Sources DSE Coastal risk mitigation
Grants $500k
DSE Coastal risk mitigation Grants
$500k/year
DSE Coastal risk mitigation Grants
$40k/year
DSE Coastal risk mitigation Grants
$50k/year
DSE Coastal risk mitigation Grants $100k
DSE Coastal risk mitigation Grants
$290k
DSE Coastal risk mitigation Grants $2.2M
DSE Coastal risk mitigation Grants $350k
DSE Coastal risk mitigation Grants
$180k
DSE Coastal risk mitigation Grants
$70k/year
2007/08 1.26M 500k 500k 40k 50k 100k 70k 2008/09 1.14M 500k 40k 50k 380k 100k 70k 2009/10 660k 500k 40k 50k 70k 2010/11 2.76M 500k 40k 50k 2.1M 70k 2011/12 1.19M 500k 40k 50k 350k 180k 70k

REFERENCES 5-1
G:\ADMIN\B16206.G.MJA\R.B16206.001.03.DOC 3/4/07 11:04
5 REFERENCES
Barrow. J. (1853). “Survey of Port Fairy, Belfast”. Vic. Parl. Papers, v3.
Coastal Engineering Solutions (2006). “Port Fairy Shoreline Stability Study”. Report prepared for Marcson Pty Ltd, July 2006.
Environmental Protection Authority (1996). “Extreme events and the impact of climate change on Victoria’s coastline.” Report to EPA and Melbourne Water, June 1996.
Gill, E.D. (1985). “Coastal Processes and the Sanding of Warrnambool Harbour”. WIAE Press, Warrnambool.
Gill, E.D. and Gill, K.E. (1973). “The Geology of Port Fairy, Western Victoria, Australia”. The Victorian Naturalist, v90 pp251-255.
Malcolm D. and McInnes K. (2002). “The effect of climate change on storm surges along the eastern Victorian coastline.” Paper in ‘Coast to Coast’ 2002.
McInnes K.L., Macadam I., Hubbert G.D., Abbs D.J. and Bathols J. (2005). “Climate Change in Eastern Victoria – Stage 2 Report: The effect of climate change on storm surges.” Report for the Gippsland Coastal Board, June 2005.
Patterson D.C. (2007). “Sand Transport and Shoreline Evolution, Northern Gold Coast, Australia”. Journal of Coastal Research, Special Issue 50, ICS2007, Gold Coast (in prep).
Patterson, D.C. and Blair, R. “Visually Determined Wave Parameters.” 6th Australian Conference on Coastal and Ocean Engineering, Gold Coast, 1983.
Rosengren N. (2005). “Griffiths Street, Port Fairy - Geomorphology & Coastal Processes in Relation to a Proposed Subdivision”. Report prepared for Paul Crowe, Licensed surveyor by Environmental GeoSurveys Pty Ltd, July 2005.
Royal Commission on Victorian Outer Ports (1925). Fourth Progress Report: Port Fairy Harbour. Vic. Parl. Papers, v2, No. 46.
Scenic Spectrums (1996). “Moyne Shire Coastal Study: Draft Report”. Report prepared for Moyne Shire Council.
Scurfield, G. and Scurfield, J.M. (1992). “Coode’s Plans for Harbours: Victoria”. The Globe, No. 36.
Sherwood, J.S. (1992). “Coastal Processes of East Beach, Port Fairy” - Some Observations. Informal report.
WBM (1996). “Coastal Study of East Beach, Port Fairy”. Report prepared for Moyne Council, September 1996.
Whetton P.H., Suppiah R., McInnes K.L., Hennessy K.J. and Jones R.N. (2002). “Climate Change in Victoria – High resolution regional assessment of climate change impacts.” Report for the Dept of Natural Resources and Environment by the Climate Impact Group, CSIRO Atmospheric Research, May 2002.