khader 2011
TRANSCRIPT

8/12/2019 Khader 2011
http://slidepdf.com/reader/full/khader-2011 1/4
THE APPLICATION OF PSIM & MATLAB/ SIMULINK INPOWER ELECTRONICS COURSES
Sameer Khader
Palestine Polytechnic UniversityHebron, [email protected]
Alan Hadad and Akram A. Abu-aisheh
University of HartfordHartofrd, CT, [email protected]
Abstract— This paper presents a comparison analysis
between two engineering software platforms,
Matlab/Simulink & PSIM, which are used as major
educational tools in the teaching of power electronics and
electrical drive courses, in additional to conducted
research in these fields. The comparison analysis is based
on studying the design simplicity of the module, time
consumed in building of the module, accuracy,
functionality, simulation time, and the acceptability of
obtained results. Various power electronic simulation
circuits are illustrated and the results are processed and
displayed.
The simulation results states that Matlab/Simulink is a
suitable platform for control and regulation of the
simulation processes, in additional to its dominant role in
conducting research tasks. Conversely, PSIM is
dedicated to power electronic circuits and machine
simulation tasks with fast and robust algorithms and
suitable for educational purposes. It is recommended that
both packages be used in teaching power electronics
courses.
Keywords: Matlab, Simulink, PSIM, Powersys,Computer simulation.
I. INTRODUCTION
Several software packages and platforms are used inthe building of simulation models for educational
purposes describing power electronics circuits [1 & 2].The major issue when designing a software package isto achieve simplicity in design and processing of thesimulated electronic circuits, while maintaining a highlevel of accuracy and user friendly graphic interface.These software packages include Matlab, PSIM,Simplorer, Pspice, Multisim, PLECS, etc.
In the past decade, power electronics circuits foundwidespread applications in Energy Conversion Systems,Industrial Automation, Mechatronics, renewable energysystems, and Transport sector [4-7] due to rapiddevelopment of switching devices and controltechniques. Therefore intensive progress in building anddeveloping various software platforms [8-10] with acertain degree of simplicity, user friendliness andaccuracy that can be used for educational and research
purposes is essential.
Furthermore, teaching power electronics coursesrequires introducing additional tools in the education
process when explaining and analyzing circuit behaviors [11&12]. Class surveys and studentinterviews indicate that applying software packages insuch courses resulted in better teaching outcomes andincreased students professionalism in terms ofimplementing their class assignments, projects, and
research tasks.
II. MODELLING
This paper describes modeling of various powerelectronics circuits by using Matlab/Simulink and PSIMwith respect to output quantities, switch parameters andsignal behavior for the following circuits:
- Single-Phase uncontrolled rectifier;- Three-Phase controlled rectifier;
Other circuits such as Chopper circuits, Inverters, ACvoltage controllers will be the subject of future workand will not be discussed further in the present work.
II. SINGLE – PHASE UNCONTROLLED RECTIFIER
The circuit configurations for both simulation platforms are displayed in Fig.1 and Fig.2 for single- phase uncontrolled rectifier energizing resistive-inductive load with data: source voltage of Vs=110V;frequency of 50 Hz, load resistance and inductance
respectively R L=10Ω, L=100mH), while simulationresults in the form of main circuit waveforms areillustrated in fig. 3 for both simulation tools .
powergui
Continuous
main & device waveforms
Vout1
v+
-
Vout
v+
-
Tr1
1 2
Selector1
Selector
RL Load
Pd1
Output waveforms
Multimeter
3
Iout
i+
-
D4
m
a
k
D3
D2
m
a
k
D1
m
a
k
AC
Figure 1: Simulink circuit of single-phase rectifier
978-1-61284-643-9/11/$26.00 ©2011 IEEE
2011 IEEE Global Engineering Education Conference (EDUCON) – "Learning Environments and Ecosystems in Engineering Education"
April 4 - 6, 2010, Amman, Jordan
Page 118

8/12/2019 Khader 2011
http://slidepdf.com/reader/full/khader-2011 2/4
Figure 2: PSIM circuit of single-phase rectifier.
As illustrated in Fig.3, output voltage, current anddevice current to some extent have similar behaviors for
both simulation tools under the same circumstances asshown in Fig.4 for the whole control range of the loadimpedance presented by the loading angle θ (0≤ θ
≤90°).Therefore, looking for the differences between both
systems requires determining the main circuit parameters as follows:
The output voltage can be expressed in Fourier seriesas follows:
).sin(.)(1
∞
=
=
ν
ω ν ω t Vmvt Vo (1)
Where Vm ν is the magnitude of ν-ti harmonic of the
output voltage, and ω is the angular frequency.
The average and root mean square Vav and Vrms
respectively of (1) can be expressed as :
[ ]
+
+
=
=
θ π
ϑ π
ω ω π
ω ω π
0
2
0
)(.)sin(.1
)().sin(.1
t d t VmVrms
t d t VmVav
(2)
where Vm is the magnitude of supply voltage.
Additional statistical parameters such as the median,mean value and standard deviation [13] can be
proposed in order to observe how the output voltage behaves as the load character changes in terms ofvarying the circuit inductance L, which in turn causes
the impedance angle to change.The median of the output voltage is:
)(arg)( minmin ∈
−=
V Vout
out out Vout V V V Median (3)
where Voutmin and Vout are minimum and other greaterthan values of rms voltages respectively.
The mean value of the rms output voltage among thecontrol range is:
=
N
Vrms N
Vmeanν
ν )(1 (4)
where N is the maximum number of simulation points.
0 0.01 0.02 0.03 0.04 0.05 0.06 0.07 0.08 0.09 0.1-500
0
500
V i n p - V o u t , V
Input/Output voltage
0 0.01 0.02 0.03 0.04 0.05 0.06 0.07 0.08 0.09 0.10
5
10
I o u t , A
Load current
0 0.01 0.02 0.03 0.04 0.05 0.06 0.07 0.08 0.09 0.10
5
10
Time, S
I D 2 - I D 4 ,
A
Diodes current
a) Simulink platform
b) PSIM platform
Figure 3: Main circuit waveforms of single-phase rectifier.
The standard deviation of σ the output rms voltage is:
( )
N
V V N
n
meannrms
2
)( −
=σ (5)
Taking into account the illustrated figures andobtained analytical results for both simulation
platforms, comparison analysis with results are presented in table 1, where it is clearly shown thatSimulink has advanced features in simulationfunctionality and data tracking, while PSIM hasadvanced features in building the module, data
extraction and graphical presentation.
0 10 20 30 40 50 60 70 80 90
30
35
40
45
50
55
60
65
70
Thita, dg
V o u t , V
Output voltage of single-phase rectifier
Simulink
PSIM
Figure 4: Rectified output voltage vs. load angle θ .
978-1-61284-643-9/11/$26.00 ©2011 IEEE
2011 IEEE Global Engineering Education Conference (EDUCON) – "Learning Environments and Ecosystems in Engineering Education"
April 4 - 6, 2010, Amman, Jordan
Page 119
8/12/2019 Khader 2011
http://slidepdf.com/reader/full/khader-2011 3/4
TABLE 1: COMPARISON A NALYSIS FOR SINGLE-PHASE R ECTIFIER .
Parameter Simulink PSIM
Building the model Complicated Simple
Simulation time for20 cycles )
Large time Negligible time
Graph display
Needs additional
interference, butwith large features
Simple anddirectely
displayed withless features.
Functionality Multifunctional Less functional
Data flow andextraction
Complicated Simple
Research capabilityAdvancedcapabilities
Less capabilities
Median of thevoltage
66.52 V 69.69V
Mean value of thevoltage
63.86 V 67.46V
Stnadard deviation 12.31V 6.442V
The analytical results states that PSIM has standarddeviation of σ=6.422 which indicates that the obtainedresults are clustered around the mean value.
While Simulink results have better Gaussiandistribution σ=12.31 as θ varies form 0 to 90°, whichmeans better control range. These conclusions are stillvalid for three-phase uncontrolled rectifiers.
The occurred transient behaviors during thesimulation processes depends on the load character andcircuit components that are frequently observed in morecomplicated power electronic circuits such as Three-
phase rectifiers, Inverters, and DC Choppers. The firstof these circuits will be discussed in the next section.
II.2: Three-phase controlled rectifier
Figure 5 illustrates a Three-phase controlled rectifierwith 6 silicon controlled switches Silicon ControlledRectifiers (SCRs) connected in such a way to formthree-phase full bridge rectifier. Close loop control isapplied in order to regulate the circuit performances bycontrolling the SCR firing instants.
Comparison analysis between both circuits isconducted in form of building of the controlcharacteristic ( normalizing performance) presenting
Synchronization Voltages
DCmotor equivalent circuit
PI Curent Regulator208 V rms L-L
3-phase Source
iB
i+
-
iA
i+
-
Vd
v+-
Vca
v+-
Vc
Vbc
v+-
Vb
Vab
v+-
Va
Thyristor Converter
g
A
B
C
+
-
Synchronized6-Pulse Generator
alpha_deg
AB
BC
CA
Block
pulses
Scope
u
u
1s
Id_Refence
Id
i+
-
5
100
90
0
iA& iB
Id & Id_ref
Vd
Figure 5: Simulink circuit of Three-phase rectifier.
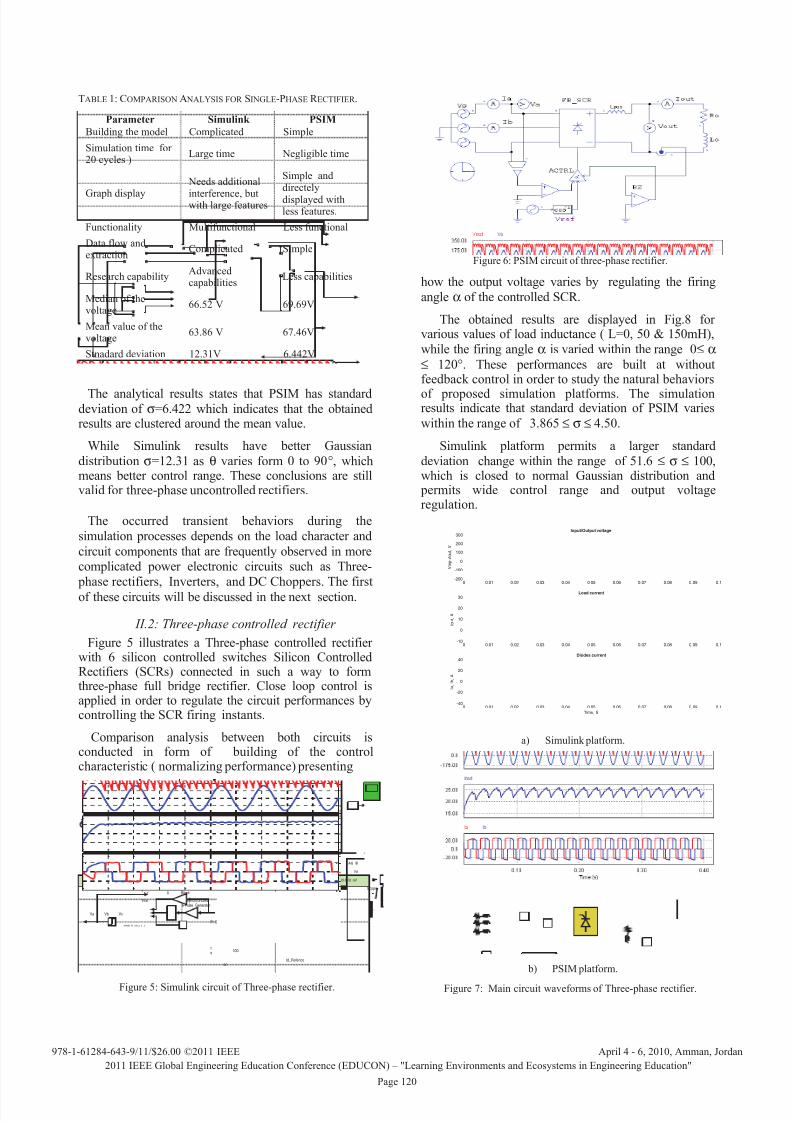
Figure 6: PSIM circuit of three-phase rectifier.
how the output voltage varies by regulating the firingangle α of the controlled SCR.
The obtained results are displayed in Fig.8 forvarious values of load inductance ( L=0, 50 & 150mH),while the firing angle α is varied within the range 0≤ α
≤ 120°. These performances are built at withoutfeedback control in order to study the natural behaviors
of proposed simulation platforms. The simulationresults indicate that standard deviation of PSIM varieswithin the range of 3.865 ≤ σ ≤ 4.50.
Simulink platform permits a larger standarddeviation change within the range of 51.6 ≤ σ ≤ 100,which is closed to normal Gaussian distribution and
permits wide control range and output voltageregulation.
0 0.01 0.02 0.03 0.04 0.05 0.06 0.07 0.08 0.09 0.1-200
-100
0
100
200
300
V i n p - V o u t , V
Input/Output voltage
0 0.01 0.02 0.03 0.04 0.05 0.06 0.07 0.08 0.09 0.1-10
0
10
20
30
I o u t , A
Load current
0 0.01 0.02 0.03 0.04 0.05 0.06 0.07 0.08 0.09 0.1-40
-20
0
20
40
Time, S
I a ,
I b ,
A
Diodes current
a) Simulink platform.
b) PSIM platform.
Figure 7: Main circuit waveforms of Three-phase rectifier.
978-1-61284-643-9/11/$26.00 ©2011 IEEE
2011 IEEE Global Engineering Education Conference (EDUCON) – "Learning Environments and Ecosystems in Engineering Education"
April 4 - 6, 2010, Amman, Jordan
Page 120

8/12/2019 Khader 2011
http://slidepdf.com/reader/full/khader-2011 4/4
0 20 40 60 80 100 1200
50
100
150
200
250
Firing angle, dg
V r m s ,
V
Output voltage vs firing angle at Simulink & PSIM
L=0, PSIM
L=100mH, PSIM
L=150mH, PSIM
L=0; Simulink
L=100mH, Simulink
L=150mH, Simulink
Figure 8: Output voltage vs. impedance angle at both simulation platforms.
III. CO-SIMULATION PRINCIPLES
The previous sections indicated that each of thestudied platforms has its advantages and disadvantages.Therefore, a co-simulation platform capable ofdeveloping new functionalities for coupling PSIM
software and Matlab/Simulink combines theseadvantages, will be designed for control and regulationsimulations and for friendly graphic user interfaces.
PSIM is dedicated to power circuits and machinesimulations with a fast and robust algorithm. The Sim-Coupler Module is an add-on module to the basic PSIMsoftware. It provides interface between PSIM andMatlab/ Simulink for co-simulation. With the Sim-Coupler Module, part of a circuit can be implementedand simulated in PSIM, and the rest of the system inSimulink is shown in Fig.9.
Figure 9: Principle circuit of Sim-Coupler module.
Another practical example that found widespreadapplication in power electronics courses is the use ofPLECS circuit simulator, which combines powerelectronics circuits built in Simulink platform as shownin Fig.10.
Figure 10: Combined circuit with Simulink and PLECS simulator.
PLECS circuit simulator [10] realizes such purposeswhen simulating power electronic circuits in Simulink
platform, in addition to its existing research features.
IV. CONCLUSION
The following conclusion may be derived when using
Simulink and PSIM platforms in teaching powerelectronics courses :- Both software platforms have their strengths and
weaknesses when being used as simulation tools in power electronics courses.
- With respect to the educational point of view, PSIMhas the simplest approach on which to build and onwhich to extract the results rather than Matlab/Simulink.
- With respect to the research point of view, Simulinkhas advanced tools with rich system functionality andsimulation capability. The Simulink platform permitsdetailed study of the circuit behaviors and transient
processes.- It is recommended that both these two platforms be
used in the teaching process, in order to give studentsthe ability to use both simulation tools in building onand implementing their learning and research tasks.
- Applying Co-simulation tools by using Sim-Couplerenhances the course efficiency and outcomes.
V. ACKNOWLEDGMENT
First author would like to thank the Open Society Institute (OSI), andUSAID-AMEDEAST for fully sponsoring the visit to University ofHartford according to Palestinian Faculty Development Project(PFDP).
VI. R EFERENCES
[1] Randall Shafer, “ Fundamentals of Power Electronics withMatlab”, Charles River Media, 1st ed., 2007.
[2] Armata J.M, Besrest B., Pauly R.,“PSIM/MATLAB co-simulation for electrical architectures global models”, AES 2005
[3] Bülent Ertan H., “A Report on the Evaluation of PSIM andSome Other Possibilities for Power Electronics CircuitSimulation”, 2007.
[4] Dmitry B., Raul R. Sam Y., " Simulation of Thyristor OperatedInduction Generator by Simulink, Psim and Plecs", Proceedingsof the 2008 International Conference on Electrical Machines.
[5] Derec A., “Induction Motor Speed Control by Stator VoltageControl”, IEEE Transactions on Power Apparatus and Systems,vol. PAS-87, pp. 585-590, February 1968.
[6] Abolfazl J., Mohammad R., Sohrab Kh., “Fuzzy Control of aThree-Phase Thyristorized Induction Motor”, Transaction onEngineering, Computing and Technology, vol.VI, pp.274-277,December 2004.
[7] Gurkan Z ,Isic C.i, Muammer E. and Cuneyt B., "PerformanceOptimization of Induction Motors During Voltage-ControlledSoft Starting”, IEEE Trans. on Energy Conversion, vol.19, pp.278-288, June 2004.
[8] Matlab/Simulink User's Guide , 2008R, www.mathwork.com
[9] PSIM, User;'s Guide, 2009, www.powersim.com
[10] PLECS user's guide, 2009: www.plexim.com
[11] Rashid M., "Power Electronics: Circuits, Devices andApplications", Prentice-Hall, 2004
[12] Daniel W. Hart, 2010 " Power Electronics", Mc Graw Hill, pp.196-230.
[13] Oliver S., Carol G.,"Statistical Methods for Spatial DataAnalysis ", Chapman & Hall/ CRC Press Company, 2009.
PG2
PG1 Output
HB
u1
s1...s4
u2
i1
i2
PLECSCircuit
Combin.Logic
10
978-1-61284-643-9/11/$26.00 ©2011 IEEE
2011 IEEE Global Engineering Education Conference (EDUCON) – "Learning Environments and Ecosystems in Engineering Education"
April 4 - 6, 2010, Amman, Jordan
Page 121