key report samples: star assessments - orcsd.org · this booklet presents report samples generated...
TRANSCRIPT

Key report samples: Star Assessments™

Star Assessments are highly rated for screening by the Center on Response to Intervention, and for progress monitoring by the National Center for Intensive Intervention.
Key report samples: Star Assessments™
©Copyright 2016 by Renaissance Learning, Inc. All rights reserved. Printed in the United States of America. All logos, designs, and brand names for Renaissance Learning’s products and services, including but not limited to Accelerated Math, Accelerated Reader, MathFacts in a Flash, Renaissance Home Connect, Renaissance, Renaissance Place, Star Assessments, Star Early Literacy, Star Math, and Star Reading, are trademarks of Renaissance Learning, Inc., and its subsidiaries, registered, common law, or pending registration in the United States and other countries. All other product and company names should be considered the property of their respective companies and organizations.
This publication is protected by U.S. and international copyright laws. It is unlawful to duplicate or reproduce any copyrighted material without authorization from the copyright holder. For more information, contact:
RENAISSANCE LEARNINGP.O. Box 8036Wisconsin Rapids, WI 54495-8036(800) [email protected]
How Star Assessment technology and reports give educators the information advantage
Star Assessments have become the leading computer-adaptive tests in the country because they make periodic assessment easy and cost-effective to administer, giving teachers more time to do what they do best—teach!
Now, teachers can take advantage of Star Assessments' expanded skills-based testing for greater depth of assessment to assist them in their instructional planning. Star Assessments also add new tools, new content, and new reports, so teachers can get a broader range of data with which to drive their daily instruction and practice.
This booklet presents report samples generated by the Star Assessments. Many of the current reports will be familiar to our Star Assessment customers. The newer reports will demonstrate the expanded scope of information now available to all educators who implement Star Assessments. Reviewing them here will help teachers and administrators learn how to get answers to key questions that help improve instruction.
ContentsScreening Report ................................................................................................................................................................6
Diagnostic Report ..............................................................................................................................................................8
Instructional Planning Report ....................................................................................................................................... 10
Progress Monitoring Report .......................................................................................................................................... 12
Growth Report.................................................................................................................................................................. 14
Growth Proficiency Chart .............................................................................................................................................. 15
State Performance Report ............................................................................................................................................ 18
State Standards Report ................................................................................................................................................. 20
Parent Report ................................................................................................................................................................... 22
Dashboard views ............................................................................................................................................................. 24
Star Custom Dashboard views ..................................................................................................................................... 26
Star Spanish Dashboard views .................................................................................................................................... 28
Renaissance Place Assessment Proficiency / Customizable Progress Reports .............................................. 30
Learnalytics is the data engine inside every Renaissance solution. It’s how our team of researchers, scientists, psychometricians and academic experts unlock, understand and act on our ever- growing database and advances in learning science to glean new insights and refine and improve our solutions. Learnalytics accelerates learning by enabling shorter assessments and more precise fine-tuning of learning progressions so educators can provide the right instruction at the right time.

6 ©Copyright 2016 Renaissance Learning, Inc. All rights reserved.
This report is also available in the following Renaissance products:
Screening ReportDistrict Benchmark
Printed Friday, September 26, 2014 1:53:42 PM
1 of 3
School: Lake View High School
Grade: 10
Reporting Period: 09/2/2014 - 09/26/2014 (Fall Screening)
STA
R R
eadi
ng S
cale
d Sc
ore
Students
1300
1200
1100
1000
900
800
700
600
500
400
300
200
100
0
BenchmarkScaled Score
At / Above 968 SS
Below 968 SSBelow 844 SSBelow 637 SS
At / Above BenchmarkCategory Total
Category Total
On WatchInterventionUrgent Intervention
At / Above 40 PR
Below 40 PRBelow 25 PRBelow 10 PR
Percentile Rank Number PercentAt / Above Benchmark
Categories / Levels
Below Benchmark
Students Tested
Students
Key questions to ask based on this and other information: Are you satisfied with the number of students at the highest level of performance? Next, consider the level or score that indicates proficiency. Which students just above proficiency are you “worried about” and what support within or beyond core instruction is warranted? What support is needed for students just below? Do all students represented by your lowest level need urgent intervention?
99
622
10
19
47%47%
31%11%11%53%

©Copyright 2016 Renaissance Learning, Inc. All rights reserved. 7
Screening ReportThe Center on Response to Intervention at American's Research Institution has highly rated Star Assessments as a screening tool. Educators are able to screen an entire class in minutes and receive actionable data immediately. The data can be viewed by class or by grade in order to help educators plan and prioritize student need. Working with numerous experts in the field of Response to Intervention (RTI), this report is designed to show what percentage of students are exceeding the benchmark and which students may need additional help and intervention. The benchmark on the Screening Report can be changed by the administrator in order to view the data through different lenses: state, district, and school.
The Screening Report is designed to be run for a grade in order to give educators access to grade level performance. The colors are determined by default PR’s in order to graphically show how students are performing in relationship to grade-level peers across the country regarding the core curriculum being taught. The key questions presented at the bottom of the first page are designed to help start the data conversation in order to determine next steps for the grade, class, and each student.
Screening ReportDistrict Benchmark
Printed Friday, September 26, 2014 1:53:42 PM
2 of 3
School: Lake View High School
Grade: 10
Reporting Period: 09/2/2014 - 09/26/2014 (Fall Screening)
Urgent Intervention
Intervention
On Watch
Student
Student
Student
Class
Class
Class
Teacher
Teacher
Teacher
Test Date
Test Date
Test Date
SS
SS
SS
PR
PR
PR
ZPD
ZPD
ZPD
Est. ORFa
Est. ORFa
Est. ORFa
a Est. ORF: Estimated Oral Reading Fluency is only reported for tests taken in grades 1-4.
At / Above Benchmark
Student Class Teacher Test Date SS PR ZPDEst. ORFa
Austin, Juanita
Reyes, Christina
Gardner, Walter
Simpson, Carol
Gordon, Terry
Wheeler, Barry
Frisch, Dena
Mason, Paul
Berry, Douglas
O’Rourke, Sean
4th Hour English
4th Hour English
4th Hour English
4th Hour English
4th Hour English
4th Hour English
4th Hour English
4th Hour English
4th Hour English
4th Hour English
Hill, S.
Hill, S.
Hill, S.
Hill, S.
Hill, S.
Hill, S.
Hill, S.
Hill, S.
Hill, S.
Hill, S.
09/04/2014
09/10/2014
09/12/2014
09/12/2014
09/12/2014
09/09/2014
09/12/2014
09/17/2014
09/10/2014
09/25/2014
198
620
652
674
850
867
948
961
962
962
1
9
12
14
27
29
39
40
41
41
—
—
—
—
—
—
—
—
—
—
2-3
3.8-5.8
3.9-6
4-6.2
4.4-7.5
4.4-7.6
4.5-8.3
4.6-8.5
4.6-8.5
4.6-8.5
Rice, Evelyn
Chavez, Pauline
Rose, Raymond
Knight, Stephen
Daniels, Katherine
4th Hour English
4th Hour English
4th Hour English
4th Hour English
4th Hour English
Hill, S.
Hill, S.
Hill, S.
Hill, S.
Hill, S.
09/10/2014
09/11/2014
09/10/2014
09/10/2014
09/09/2014
988
1026
1070
1080
1123
44
46
49
50
53
—
—
—
—
—
4.6-8.7
4.6-9.2
4.7-9.7
4.7-9.8
4.7-10.3
Quickly see how a grade level and class of students are performing.
The second page of the Screening Report shows individual student
performance, organized by the benchmark and cut scores categories
within the software. This can be used to group students and to dig deeper into
student needs.

8 ©Copyright 2016 Renaissance Learning, Inc. All rights reserved.
This report is also available in the following Renaissance products:
1 of 2Student Diagnostic Report Enterprise Test
Printed Thursday, September 18, 2014 3:09:31 PM
School: East Elementary School Test Date: September 18, 2014 1:38 PM Test Time: 16 minutes 25 seconds
Report Options
Use Trend Score: Use trend score for student's suggested skills
Albertson, KathrynID: 10148 Class: Mr. DeMarco Class B
Teacher: C. DeMarcoGrade: 3
School Benchmark - Grade 3
û Urgent Intervention û Intervention û On Watch û At/Above Benchmark
STAR Math Scoresa
SS: 489 (Scaled Score) û Intervention Kathryn's Scaled Score is based on the difficulty of questions and the number of correct responses.
PR: 15 (Percentile Rank) Kathryn scored greater than 15% of students nationally in the same grade.
GE: 2.7 (Grade Equivalent) Kathryn's test performance is comparable to that of an average second grader after the seventh month of the school year.
Domain Scores
Domain scores, ranging from 0-100, estimate Kathryn's percent of mastery on skills in each domain at a third grade level.
Pre-Kindergarten–8Operations and Algebraic Thinking: 78Number and Operations in Base Ten: 42Measurement and Data: 35Geometry: 69Number and Operations — Fractions: 41
Algebra Readiness
Kathryn is not yet meeting grade level expectations for algebra readiness.
Math Recommendation
If you are using the Accelerated Math™ management software system with Kathryn, assign the Grade 3 library. This library should provide a good match for her abilities.
Accelerated Math™ Library: Grade 3

©Copyright 2016 Renaissance Learning, Inc. All rights reserved. 9
Diagnostic ReportThe Student Diagnostic Report helps you determine if your students are mastering state standards. The report helps you identify individual student’s strengths and weaknesses so you can plan appropriate personalized instruction to reach district goals.
The Student Diagnostic Report shows how long the student took to complete the test, and the student’s current level of performance.
The Domain and Skill area scores range from 0-100, indicating an
estimate of percentage of mastery.
2 of 2Student Diagnostic Report Enterprise Test
Printed Thursday, September 18, 2014 3:09:31 PM
School: East Elementary School Test Date: September 18, 2014 1:38 PM Test Time: 16 minutes 25 seconds
Albertson, KathrynID: 10148 Class: Mr. DeMarco Class B
Teacher: C. DeMarcoGrade: 3
Skill Area Scores, ranging from 0-100, estimate Kathryn’s percent of mastery of skills in each skill area. Use Core Progress learning progressions to find worked examples and example problems for skills in each skill area.
Skill Details
Pre-Kindergarten–8
Operations and Algebraic Thinking
Score
Domain Score: 78
84 Algebraic Thinking
Whole Numbers: Multiplication and Division 75
Number and Operations in Base Ten
Score
Domain Score: 42
Whole Numbers: Multiplication and Division 42
Measurement and Data
Score
Domain Score: 35
67 Data Representation and Analysis
41 Time
Perimeter, Circumference, and Area 22
Geometry
Score
Domain Score: 69
Fraction Concepts and Operations 88
Number and Operations — Fractions
Score
Domain Score: 41
Fraction Concepts and Operations 41

10 ©Copyright 2016 Renaissance Learning, Inc. All rights reserved.
This report is also available in the following Renaissance products:
1 of 4Instructional Planning Report for Tyler Hillard
Printed Thursday, September 18, 2014 12:45:34 PM
School: East Elementary SchoolClass: Mr. DeMarco Class B
Teacher: C. DeMarcoGrade: 3
Report OptionsUse Trend Score: Use trend score for student's suggested skills
STAR Reading Test ResultsCurrent SS (Scaled Score): 376 Test Date: 09/17/2014IRL: 3.2 ZPD: 2.7-3.8 Lexile® ZPD: 460L-630LLexile® Measure: 400L
Projected SS for 07/31/15: 416 Based on research, 50% of students at this student's level will achieve this much growth.
Tyler's Current Performance
Most Recent Test
Most Recent Test
School Benchmark
200 250 300 350 400 450 500 550
Projected
Projected
Scaled Score
û Urgent Intervention û Intervention û On Watch û At/Above Benchmark
Suggested SkillsTyler's STAR Reading scaled score(s) suggest these skills from Core Progress™ learning progressions would be challenging, but not too difficult for her. Combine this information with your own knowledge of the student and use your professional judgment when designing an instructional program. Use the Core Progress learning progressions to see how these skills fit within the larger context of the progresson.
Reading: Foundational Skills
Phonics and Word RecognitionGR
This score suggests Tyler should practice the following phonics and word-recognition skills.
»3 Decode increasingly difficult multisyllable words by identifying syllable patterns (e.g., transportation)
»3 Identify the meanings of grade-level appropriate affixes (e.g., dis-, non-, re-, un-, and -ful, -ly, -ness) and infer howthey affect the meanings of words
»3 Decode words with common Latin suffixes, such as the -or in elevator or -ment in government, and identify themeanings of the words
»3 Read grade-level irregularly spelled sight words automatically (e.g., certain, notice)
Fluency
This score suggests Tyler should work on the following to increase fluency and comprehension of texts at Tyler's reading level.
»3 Read on-level texts aloud at the estimated oral reading fluency (ORF) to meet grade-level benchmarks
»3 Read on-level texts aloud smoothly with expression (e.g., using appropriate expression to indicate punctuation, suchas periods, question marks, and exclamation points)
»3 Confirm or correct understanding of a word or a larger text by using context clues, including both words and textstructures, by using phonics, particularly understanding of word morphology, and by slowing reading pace and/orrereading
Reading: Literature
Key Ideas and Details
This score suggests Tyler should practice the following skills to improve comprehension of the key ideas and details of a literary text at Tyler's reading level.
»Designates a focus skill. Focus skills identify the most critical skills to learn at each grade level.

©Copyright 2016 Renaissance Learning, Inc. All rights reserved. 11
Instructional Planning ReportThe Star Instructional Planning Reports can be used to inform differentiated instruction on a class level, or for individual students. The skills shown on these reports are derived from the Core Progress learning progression, that outlines how students’ progress from naïve understanding to mastery within a domain. The reports help educators see how each student is doing and provides recommendations for skills the student should work on next. The Core Progress learning progression identifies the continuums of concepts, strategies, behaviors, and skills students develop as they progress through increasingly sophisticated levels of understanding to meet grade-level expectations. Use the Core Progress learning progression to help plan instruction, diagnose problems, and make assessment data actionable.
After administering a Star Assessment, teachers can identify skills students are ready to learn and access resources to guide instruction. The Skills and Resources link is accessible through the Record Book or the Reading and Math Dashboards.
The Instructional Planning Reports—for both student and class—help administrators better support teachers in making data-driven decisions that differentiate instruction.
In this Instructional Planning Report, we can view the foundational reading skills that the student is ready to learn. This information reinforces skills for small group instruction, and also builds teacher confidence in next steps for greater student achievement.
The Record Book allows educators to form instructional groups of students,
and view skill suggestions based on the group’s median scaled score. While the skills identified are not intended to
be taught as discrete skills, they can be used as a starting place for planning
differentiated instruction.
Wyllie, Noell
Graves, Carly
Heinrichs, Dustin
Chavez, Weston
Davis, Meghan
Heiberger, Amanda
Moncrief, Brianna
Brannen, Dillon
Casillas, Omero
Bennett, Myles
Nguyen, Micki
Timmons, Anna
Ramirez, Eric
Hillard, Tyler
Coffman, Joni
Stepler, Katie
12 ©Copyright 2016 Renaissance Learning, Inc. All rights reserved.
This report is also available in the following Renaissance products:
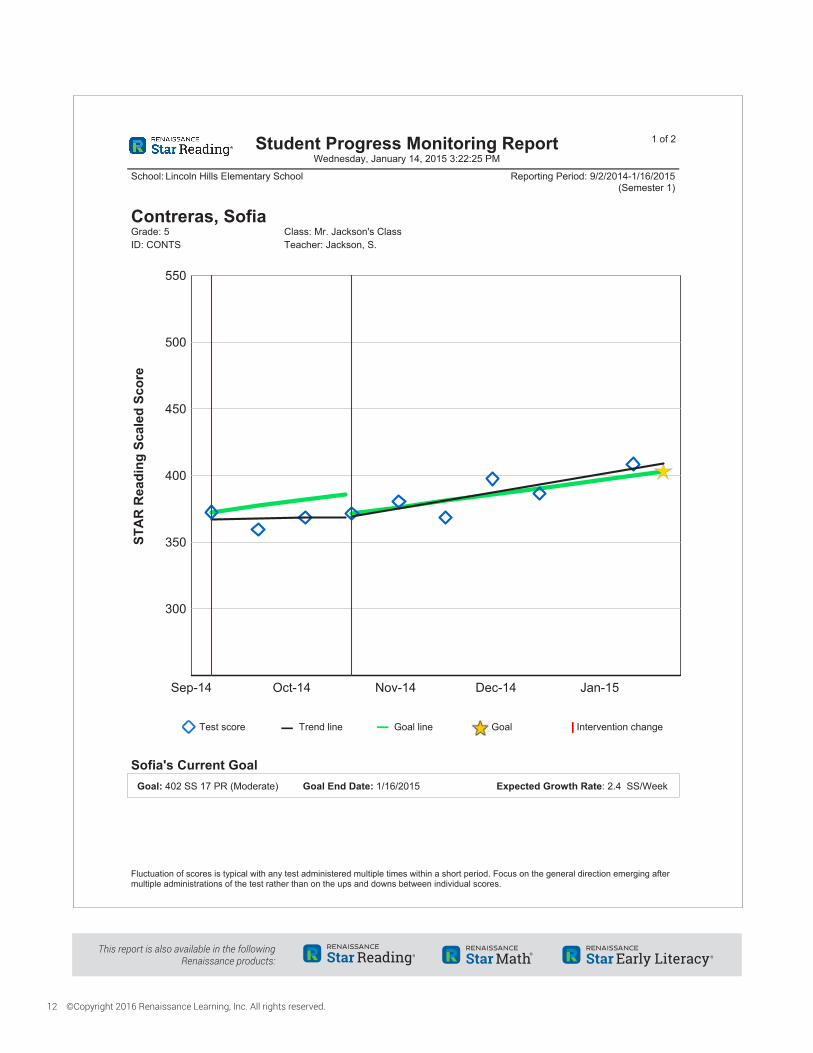
1 of 2Student Progress Monitoring Report Wednesday, January 14, 2015 3:22:25 PM
School: Lincoln Hills Elementary School Reporting Period: 9/2/2014-1/16/2015(Semester 1)
Class: Mr. Jackson's ClassTeacher: Jackson, S.ID:
Grade: 5CONTS
Contreras, Sofia
STA
R R
eadi
ng S
cale
d Sc
ore
300
350
400
450
500
550
Sep-14 Oct-14 Nov-14 Dec-14 Jan-15
GoalTrend line Goal line Intervention changeTest score
Sofia's Current GoalExpected Growth Rate: 2.4 SS/Week Goal: 402 SS 17 PR (Moderate) Goal End Date: 1/16/2015
Fluctuation of scores is typical with any test administered multiple times within a short period. Focus on the general direction emerging after multiple administrations of the test rather than on the ups and downs between individual scores.

©Copyright 2016 Renaissance Learning, Inc. All rights reserved. 13
Progress Monitoring ReportDistricts invest extensive resources in intervention for struggling students. The Student Progress Monitoring Report tracks and reports how students are responding. The Student Progress Monitoring Report uses a research-based growth model to develop appropriate and attainable goals for students in intervention. Star Assessments can be administered as often as weekly. Goals are established based on the intensity of the intervention and by using the educator’s professional judgment. Data teams are informed about growth rates at each test administration to determine next steps. After four administrations, the report generates a trend line projecting actual student growth. While the goal line shown on the report projects an intervention outcome, the trend line graphs the student’s actual progress toward the goal.
The report plots a student’s scores in relation to an individualized goal set by the teacher with the help of the Star Assessments' goal-setting tool. By using the Student Progress Monitoring Report to track progress, you’ll have actionable data to help you determine the need for and subsequent effectiveness of the intervention.
2 of 2Student Progress Monitoring Report Wednesday, January 14, 2015 3:22:25 PM
School: Lincoln Hills Elementary School Reporting Period: 9/2/2014-1/16/2015(Semester 1)
Class: Mr. Jackson's ClassTeacher: Jackson, S.ID:
Grade: 5CONTS
Contreras, Sofia
Sofia's Current GoalExpected Growth Rate: 2.4 SS/Week Goal: 402 SS 17 PR (Moderate) Goal End Date: 1/16/2015
Sofia's ProgressGrowth Ratea
Scaled Score/WeekScaledScore
TestDateProgram Program Begins
Tier 1 Classroom 09/08/2014 372 -09/08/201409/22/2014 359 -10/06/2014 368 0.3
Literacy circles - making inferences
10/20/2014 371 -10/20/201411/03/2014 380 -11/17/2014 368 -12/01/2014 397 3.312/15/2014 386 2.301/12/2015 408 3.0
aThe student's trend line and growth rate appear on the report after taking four tests.
Page 1 of the Student Progress Monitoring Report graphs a student’s scores in relation to the goal, giving the teacher a picture of the student’s progress. In this case, Sofia was not making enough progress, so her teacher adjusted Sofia’s intervention.
As shown on Page 2 of the report, the Growth Rate is automatically
calculated using all of the test scores available for the student.
Sofia has responded positively to the intervention and her Growth
Rate is now exceeding her Expected Growth Rate.

14 ©Copyright 2016 Renaissance Learning, Inc. All rights reserved.
Growth ReportPrinted Friday, January 30, 2015 9:43:21 AM
School: Oakwood Elementary School School Year: 09/2/2014 - 09/28/2014School Year: 01/01/2015 - 01/28/2015
Report Options Reporting Parameter Group: All Demographics [Default] Group By: Class Sort By: Last Name
Class: Miss Jones’ Class Growth Expectation: 40 SGP
Student Class Test date SS PR NCE IRL EORFaGradeTeacher SGP
a Estimated Oral Reading Fluency is only reported for tests taken in grades 1-4.g This student’s growth is below the growth target.c Student Growth Percentile Time-Adjusted Model.Historical data included.
1 of 3
Alexander, Shawn
Armstrong, Elaine
Corleon, Megan
Dixon, Kenneth
Farrens, Cathy
Gomez, Karen
Miss Jones’ Class
Miss Jones’ Class
Miss Jones’ Class
Miss Jones’ Class
Miss Jones’ Class
Miss Jones’ Class
Jones, Karen
Jones, Karen
Jones, Karen
Jones, Karen
Jones, Karen
Jones, Karen
4
4
4
4
4
4
4967
+18
140165+25
6566+1
149167+18
83107+24
6577
+12
09/15/1401/23/15Change
09/12/1401/09/15Change
09/10/1401/12/15Change
09/15/1401/12/15Change
09/12/1401/23/15Change
09/12/1401/23/15Change
210289+79
616742
+126
282286+4
676746+70
361464
+103
284335+51
39
+6
8388+5
129
-3
8989
0
2946
+17
1317+4
10.421.8
+11.4
70.174.7+4.6
25.321.8-3.5
75.875.8
0
38.347.9+9.6
26.329.9+3.6
1.52.4
+0.9
56.1
+1.1
2.32.4
+0.1
5.76.1
+0.4
3.13.9
+0.8
2.32.8
+0.5
50
74
20g
55
68
42
This report is also available in the following Renaissance products:

©Copyright 2016 Renaissance Learning, Inc. All rights reserved. 15
Growth ReportImagine using student growth information to determine where you are achieving accelerated results. Star Assessments are the first interim assessments to report the Student Growth Percentile (SGP) measurement. The SGP is a widely accepted growth measure that reveals relative growth data. Student Growth Percentiles accurately gauge growth by comparing student progress relative to students of similar achievement levels, and reports the results as a percentile. The Star Growth Report displays the SGP and can be run for a class, grade, or school. It helps you to determine if your students are meeting their individual growth expectations.
Student Growth Percentiles are based upon the best available information using a statistical model of growth and achievement. The way the model prioritizes data points is designed to make the best use of data across time. SGP uses test scores from at least two SGP windows, and a third SGP window when available. The Growth Report also displays Scaled Score, Percentile Rank, and other scores to help you make classroom decisions during the remainder of the school year. School administrators and teachers can also better identify best practices that are having a significant educational impact on student growth, and thereby help to close the student achievement gap.
SGP figures reveal that some student growth is well below or just above target, while some Scaled Scores have only slightly improved. Such detail will help educators focus their instructional efforts where needed most.
The last page of the Growth Report provides a summary of class
growth, including overall SGP target achievement and pre-test/post-test
changes in average scores for all students as a class.
School: Oakwood Elementary School
Class: Miss Jones’ Class Growth Expectation: 40 SGP
Growth ReportPrinted Friday, January 30, 2015 9:43:21 AM
School Year: 09/2/2014 - 09/28/2014 School Year: 01/01/2015 - 01/28/2015
g This student’s growth is below the growth target.
Student Class Test date SS PR NCE IRL EORFaGradeTeacher SGP
Class Test date SS PR NCE IRL EORFaGradeTeacher
SummaryAverage Scores
(19 Students)SGP
(19 of 19 Students)MedianOn Target
3 of 3
Palmer, Jeffery
Reyes, Julia
Statz, Madeline
Wilson, Erika
Yerby, Randall
Miss Jones’ Class
Miss Jones’ Class
Miss Jones’ Class
Miss Jones’ Class
Miss Jones’ Class
Jones, Karen
Jones, Karen
Jones, Karen
Jones, Karen
Jones, Karen
4
4
4
4
4
09/11/1401/22/15Change
09/08/1401/13/15Change
09/09/1401/20/15Change
09/10/1401/12/15Change
09/08/1401/14/15Change
473494+21
370507
+137
542534
-8
473472
-1
513551+38
5854-4
3157
+26
7263-9
5849-9
6765-2
54.252.1-2.1
39.653.7
+14.1
62.357
-5.3
54.249.5-4.7
59.358.1-1.2
3.94.1
+0.2
3.24.2
+1.0
4.54.4
-0.1
3.93.9
0
4.34.5
+0.2
109114+5
86117+31
125123
-2
109109
0
118127+9
33g
83
23g
22g
44
PretestPosttestChange
428.7475.6+46.8
45.547.0+1.5
46.447.7+1.2
3.63.9
+0.4
98.6109.2+10.6
4Jones, KarenMiss Jones’ Class 3347%
9 of 19

16 ©Copyright 2016 Renaissance Learning, Inc. All rights reserved.
Star Early Literacy E. Trevino, Teacher
Home > Reports
Growth Proficiency Chart
Manuals | Help | Log Out
Sca
led
Sco
re
Growth (SGP)
825
750
675
600
0 20 40 60 80 100
900
i
i
Grade
All Grades
Proficiency
Grade-specific values ViewDistrict benchmark
My Students
Lower GrowthLower Achievement
Higher GrowthLower Achievement
Lower GrowthHigher Achievement
Higher GrowthHigher Achievement
525
Grade: 1
R60424.117102.091916
©Copyright 2016 Renaissance Learning, Inc. All rights reserved. 17
Growth Proficiency ChartThe Growth Proficiency Chart plots proficiency data and Student Growth Percentile (SGP) for each student on an interactive display. The SGP, also found on the Growth Report, helps you determine if students are growing at an adequate rate, by comparing student progress relative to students of similar achievement levels, and reports the results as a percentile.
Displayed on an interactive, Web-based growth proficiency chart, the Student Growth Percentile measurement is viewable by district, school, grade, or class. Use the Growth Proficiency Chart to help ensure that you’re providing an environment in which all students are learning and growing.
The Growth Proficiency Chart plots achievement and growth at the district, school, grade, or class level, so you’ll know which students need additional attention.
This report is also available in the following Renaissance products:
18 ©Copyright 2016 Renaissance Learning, Inc. All rights reserved.
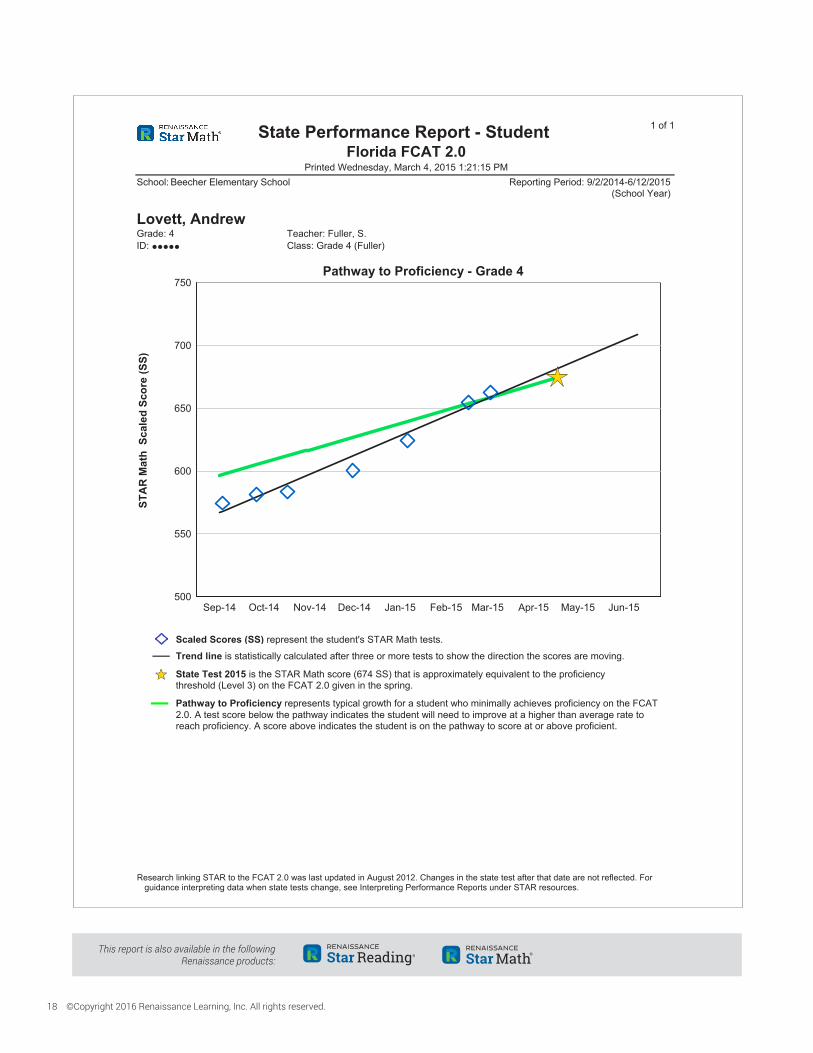
State Performance Report - Student Florida FCAT 2.0
Printed Wednesday, March 4, 2015 1:21:15 PM
1 of 1
School: Beecher Elementary School Reporting Period: 9/2/2014-6/12/2015(School Year)
Lovett, Andrew
ööööö Class: Grade 4 (Fuller)Teacher: Fuller, S.
ID:Grade: 4
Pathway to Proficiency - Grade 4
STA
R M
ath
Sca
led
Scor
e (S
S)
500
550
600
650
700
750
Sep-14 Oct-14 Nov-14 Dec-14 Jan-15 Feb-15 Mar-15 Apr-15 May-15 Jun-15
Scaled Scores (SS) represent the student's STAR Math tests.
Trend line is statistically calculated after three or more tests to show the direction the scores are moving.
State Test 2015 is the STAR Math score (674 SS) that is approximately equivalent to the proficiency threshold (Level 3) on the FCAT 2.0 given in the spring.
Pathway to Proficiency represents typical growth for a student who minimally achieves proficiency on the FCAT 2.0. A test score below the pathway indicates the student will need to improve at a higher than average rate to reach proficiency. A score above indicates the student is on the pathway to score at or above proficient.
Research linking STAR to the FCAT 2.0 was last updated in August 2012. Changes in the state test after that date are not reflected. For guidance interpreting data when state tests change, see Interpreting Performance Reports under STAR resources.
©Copyright 2016 Renaissance Learning, Inc. All rights reserved. 19
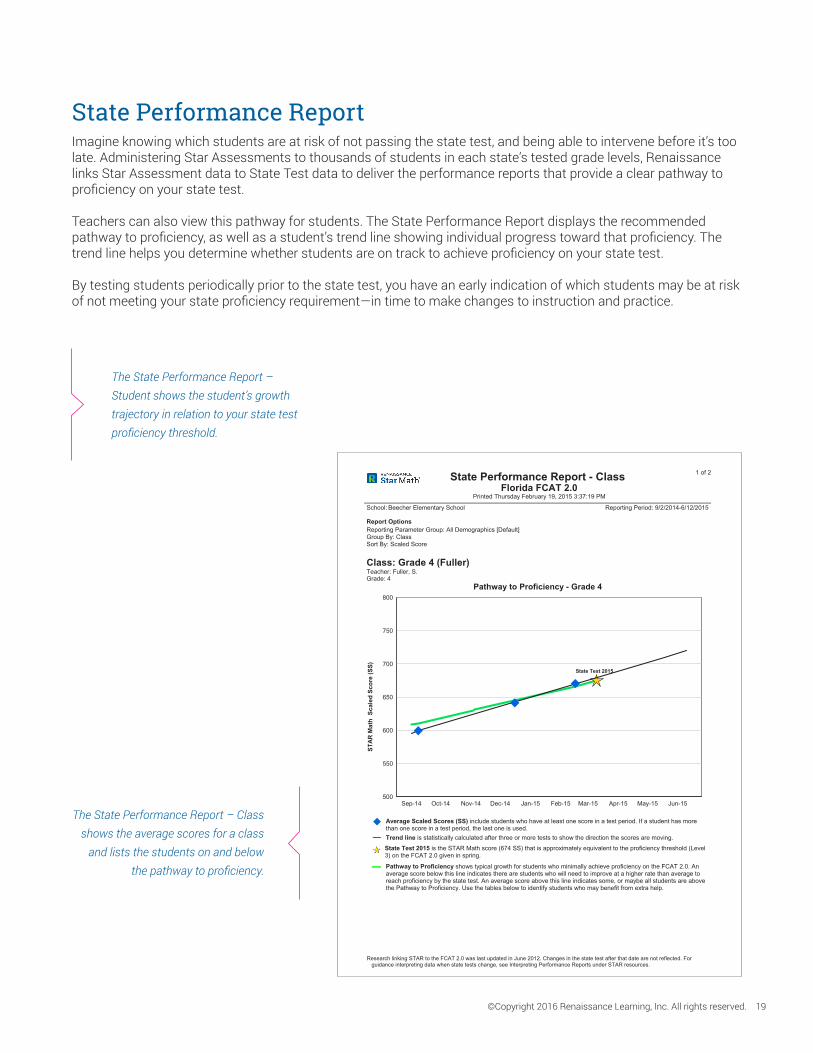
State Performance ReportImagine knowing which students are at risk of not passing the state test, and being able to intervene before it’s too late. Administering Star Assessments to thousands of students in each state’s tested grade levels, Renaissance links Star Assessment data to State Test data to deliver the performance reports that provide a clear pathway to proficiency on your state test.
Teachers can also view this pathway for students. The State Performance Report displays the recommended pathway to proficiency, as well as a student’s trend line showing individual progress toward that proficiency. The trend line helps you determine whether students are on track to achieve proficiency on your state test.
By testing students periodically prior to the state test, you have an early indication of which students may be at risk of not meeting your state proficiency requirement—in time to make changes to instruction and practice.
The State Performance Report – Student shows the student’s growth trajectory in relation to your state test proficiency threshold.
The State Performance Report – Class shows the average scores for a class
and lists the students on and below the pathway to proficiency.
State Performance Report - Class Florida FCAT 2.0
Printed Thursday February 19, 2015 3:37:19 PM
1 of 2
School: Beecher Elementary School Reporting Period: 9/2/2014-6/12/2015
Sort By: Scaled Score Group By: ClassReporting Parameter Group: All Demographics [Default]Report Options
Class: Grade 4 (Fuller)Teacher: Fuller, S.Grade: 4
Pathway to Proficiency - Grade 4
500
550
600
650
700
750
800
Sep-14 Oct-14 Nov-14 Dec-14 Jan-15 Feb-15 Mar-15 Apr-15 May-15 Jun-15
State Test 2015
STAR
Mat
h S
cale
d Sc
ore
(SS)
Average Scaled Scores (SS) include students who have at least one score in a test period. If a student has more than one score in a test period, the last one is used.Trend line is statistically calculated after three or more tests to show the direction the scores are moving.State Test 2015 is the STAR Math score (674 SS) that is approximately equivalent to the proficiency threshold (Level 3) on the FCAT 2.0 given in spring.
Pathway to Proficiency shows typical growth for students who minimally achieve proficiency on the FCAT 2.0. An average score below this line indicates there are students who will need to improve at a higher rate than average to reach proficiency by the state test. An average score above this line indicates some, or maybe all students are above the Pathway to Proficiency. Use the tables below to identify students who may benefit from extra help.
Research linking STAR to the FCAT 2.0 was last updated in June 2012. Changes in the state test after that date are not reflected. For guidance interpreting data when state tests change, see Interpreting Performance Reports under STAR resources.

20 ©Copyright 2016 Renaissance Learning, Inc. All rights reserved.
1 of 3State Standards Report - Student Printed Friday, September 5, 2014 2:12:15 PM
School: Pine Hill Middle School
Major, JasmineID: JMAJOR Class: 4th Hour EnglishGrade: 7 Teacher: Jones, K.
Estimated Mastery of Grade 7 English Language Arts
450
500
550
600
650
700
750
800
CC
RL.
CC
R.1
CC
RL.
CC
R.2
CC
RL.
CC
R.3
CC
RL.
CC
R.4
CC
RL.
CC
R.5
CC
RL.
CC
R.6
CC
RL.
CC
R.7
CC
RL.
CC
R.8
CC
RL.
CC
R.9
CC
RL.
CC
R.1
0
CC
RI.C
CR
.1
CC
RI.C
CR
.2
CC
RI.C
CR
.3
CC
RI.C
CR
.4
CC
RI.C
CR
.5
CC
RI.C
CR
.6
CC
RI.C
CR
.7
CC
RI.C
CR
.8
CC
RI.C
CR
.9
CC
RI.C
CR
.10
CC
L.C
CR
.4
CC
L.C
CR
.5
CC
L.C
CR
.6
Projected
Current
STAR
Rea
ding
Sca
led
Scor
e (S
S)
How STAR Reading Estimates Mastery of State StandardsSTAR Reading provides an estimate of the student's mastery of standards by aligning them to the same 1400-point difficulty scale used to report STAR scores. The Estimated Mastery Range identifies a band of scores where the student is just below or above mastery. Monitor students in this range to confirm their understanding of the standard.
Est. Mastery Levels for Standards in Grade 7 Est. Mastery Range Below Est. Mastery RangeAbove Est. Mastery Range
t
STAR Reading Test ResultsPercentile Rank: 24 Grade Equivalent: 5.3Current Scaled Score: 568
Test Date: 9/5/2014 Projected Scaled Score: 638 Date: 6/12/2015
Based on research, 50% of students at this student's level will achieve this much growth.
This report is also available in the following Renaissance products:

©Copyright 2016 Renaissance Learning, Inc. All rights reserved. 21
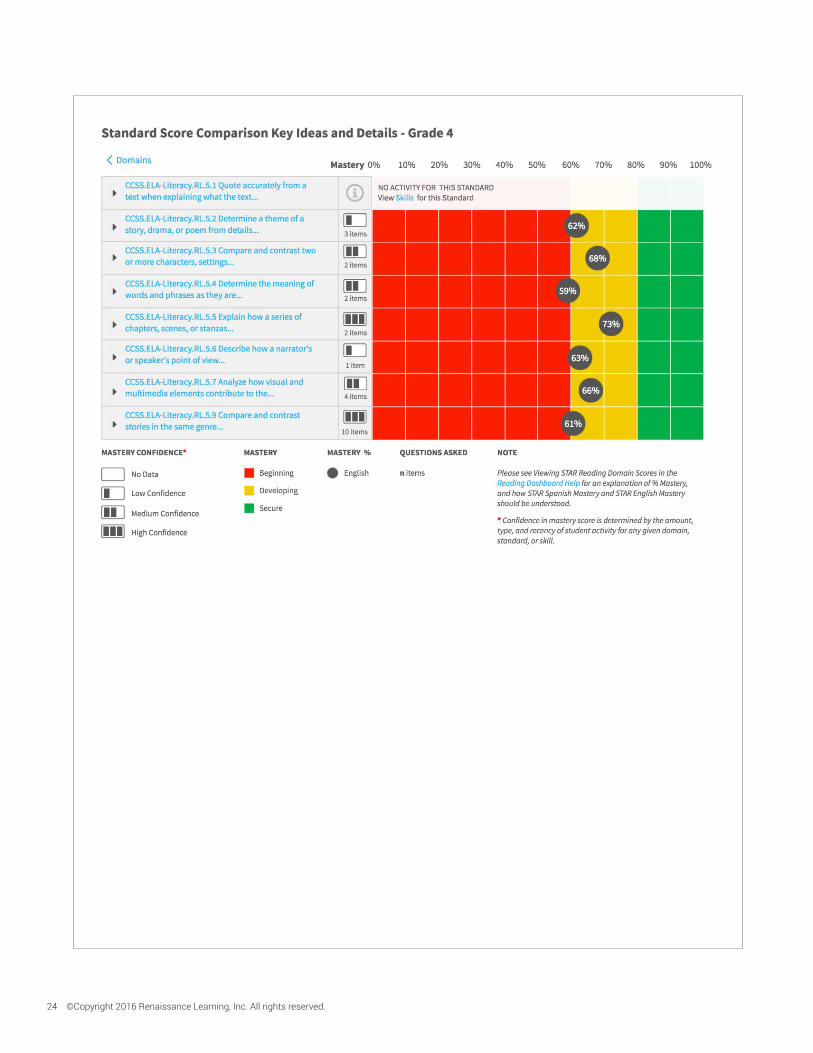
State Standards ReportThrough Renaissance’s alignment process, the State Standards Report informs educators of students’ mastery of state standards. The State Standards Report provides educators with a clear picture of standards mastery based on the current system of curriculum, opening meaningful dialogue between administrators and practitioners, to identify curriculum strengths and areas for improvement.
By estimating current student mastery of state standards, and projecting expected mastery levels by the end of the school year, the State Standards Report can help you identify grade-level standards that may be more difficult for students to master.
The State Standards Report allows instructional leaders to validate curriculum, while providing assistance to teachers in making critical decisions about instruction.
Use the State Standards Report – Student to measure an individual student’s performance on state standards. The graph presents an overall view of the student’s ability now and at a projected date.
Use the State Standards Report – District to see how groups of students are doing in comparison to their state standards. The report features graphs
that show a comparison between students’ current scores and their
projected scores for each standard.
1 of 10State Standards Report - District Common Core State Standards CCSS
Printed Friday, September 5, 2014 3:32:28 PMDistrict: Union School District Reporting Period: 8/4/2014 - 9/5/2014
Report OptionsReporting Parameter Group: All Demographics [Default]Group By: SchoolList By: TeacherSort By: Alphabetical
How STAR Reading Estimates Mastery of State Standards
Current - Shows progress on tests taken between 8/4/2014 - 9/5/2014
STAR Reading provides an estimate of the students' mastery of standards by aligning them to the same 1400-point difficulty scale used to report STAR scores. The Estimated Mastery Range identifies a band of scores where the student is just below or above mastery. The percentage of students who score in or above this range indicates overall progress toward standards mastery.
Projected - Shows likely progress by 6/12/2015. Based on research, 50% of students will achieve this much growth.
Grade: 7Grade 7 English Language Arts: NGA Center-CCSSO, College- and Career-Readiness Standards and K-12 English Language Arts, 2014, Grade 7 English Language Arts, Common Core State Standards, produced by NGA and CCSSO
Read closely to determine what the text says explicitly and to make logical inferences from it; cite specific textual evidence when writing or speaking to support conclusions drawn from the text.
CC RL.CCR.1
% of Students In or Above the Estimated Mastery RangeProjected (6/12/2015)CurrentSchool/Teacher
High Lake Middle School 87% 39 / 45 91% 41 / 45
Heath, B. 92% 22 / 24 92% 22 / 24
Reams, D. 81% 17 / 21 90% 19 / 21
Pine Hill Middle School 82% 31 / 38 92% 35 / 38
Jones, K. 73% 11 / 15 93% 14 / 15
Taylor, L. 87% 20 / 23 91% 21 / 23
Determine central ideas or themes of a text and analyze their development; summarize the key supporting details and ideas.CC RL.CCR.2
% of Students In or Above the Estimated Mastery RangeProjected (6/12/2015)CurrentSchool/Teacher
High Lake Middle School 80% 36 / 45 87% 39 / 45
Heath, B. 88% 21 / 24 92% 22 / 24
Reams, D. 71% 15 / 21 81% 17 / 21
Pine Hill Middle School 76% 29 / 38 84% 32 / 38
Jones, K. 67% 10 / 15 73% 11 / 15
Taylor, L. 83% 19 / 23 91% 21 / 23

22 ©Copyright 2016 Renaissance Learning, Inc. All rights reserved.
Parent Report for Lisa Carter
Printed Friday, September 12, 2014 2:12:15 PM
School: Oakwood Elementary School Test Date: September 12, 2014 8:53 AM Teacher: Mrs. C. Rowley Class: Mrs. Rowley’s Class
Dear Parent or Guardian of Lisa Carter:
Your child has just taken a STAR Early Literacy assessment on the computer. STAR Early Literacy measures your child's proficiency in up to nine areas that are important in reading development. This report summarizes your child's scores on the assessment. As with any assessment, many factors can affect your child's scores. It is important to understand that these scores provide only one picture of how your child is doing in school.
Scaled Score: 475
The Scaled Score is the overall score that your child received on the STAR Early Literacy assessment. It is calculated based on both the difficulty of the questions and the number of correct responses. Scaled Scores in STAR Early Literacy range from 300 to 900 and span the grades Pre-K through 3.
Lisa obtained a Scaled Score of 475. Scaled Scores relate to three developmental stages: Emergent Reader (300 - 674), Transitional Reader (675-774), and Probable Reader (775 - 900). A Scaled Score of 475 means that Lisa is at the Emergent Reader stage.
Date Tested
Scaled Score
Emergent Reader Trans. Reader
Probable Reader
300 400 500 600 700 800 90009/12/14 475 Initial Test Scaled
Score
Children at the early Emergent Reader stage are beginning to understand that printed text has meaning. They are learning that reading involves printed words and sentences, and that print flows from left to right and from the top to the bottom of thepage. They are also beginning to identify colors, shapes, numbers, and letters.
At this stage, Lisa knows that spoken speech can be represented by letters and that letters have specific shapes. She is likelyto be able to identify the letters and to see the differences between them. Also, Lisa is beginning to recognize rhyming sounds.
The most important thing you can do to encourage your child's growth in emergent reading skills is to read storybooks aloud to Lisa at home. If your child asks for the same book again and again, go right on reading it. Also, talk with Lisa about what you've read. Through listening to and talking about stories, Lisa will learn to relate spoken words with printed words on the page.
If you have any questions about your child’s scores or these recommendations, please contact me at your convenience.
Teacher Signature: ______________________________________________________ Date: _____________________
Parent Signature: _______________________________________________________ Date: _____________________
Comments:
This report is also available in the following Renaissance products:

©Copyright 2016 Renaissance Learning, Inc. All rights reserved. 23
Parent ReportStar Early Literacy, Star Reading and Star Math includes a Parent Report to keep parents informed of their child's achievement and progress in areas of early literacy, reading, and math.
The Parent Report is generated in an easy-to-read letter format with sections for a teacher's signature and additional comments about the student's performance.
This report, available in English or Spanish, provides a summary of
the student's overall assessment performance and is calculated based on the difficulty of the questions and
the number of correct responses.
Informe para los Padres de Lisa Carter
Impreso: Friday, September 12, 2014 2:12:15 PM
Escuela: Oakwood Elementary School Fecha de la prueba: September 12, 2014 8:53 AM Maestro(a): Mrs. C. Rowley Clase: Mrs. Rowley’s Class
Estimados padres o tutores de Lisa Carter:
Lisa acaba de presentar una evaluación computarizada llamada STAR Early Literacy. Esta prueba mide la habilidad de los estudiantes en nueve importantes áreas en el desarrollo de la habilidad lectora. En este informe le presentamos un resumen de la puntuación que Lisa obtuvo en dicha prueba. Como en cualquier evaluación, hay muchos factores que pueden influir en las puntuaciones de un estudiante. Es importante entender que estos resultados sólo muestran un aspecto del progreso de Lisa en la escuela.
Puntuación Graduada (SS, por Scaled Score): 475
La Puntuación Graduada indica la cantidad total de puntos que Lisa obtuvo en la prueba STAR Early Literacy. Se calcula teniendo en cuenta tanto la dificultad de las preguntas así como el número de respuestas correctas. El rango de las Puntuaciones Graduadas de la prueba STAR Early Literacy va desde 300 hasta 900.
Lisa obtuvo 475 puntos en la Puntuación Graduada. Las Puntuaciones Graduadas se refieren a tres etapas del desarrollo: Lector Emergente (300 - 674), Lector en Transición (675 - 774) y Probable Lector (775 - 900). Una Puntuación Graduada de 475 indica que Lisa se encuentra en la etapa de inicial de Lector Emergente.
Fecha de la prueba
Puntuación graduada
Lector Emergente Lector en Transición
Probable Lector
300 400 500 600 700 800 90009/12/14 475 Puntuación Graduada
en la Prueba Incial
Los niños en el inicio de la etapa Lector Emergente empiezan a entender que los textos impresos significan algo; aprenden que la lectura está formada por palabras y oraciones impresas, y que el texto impreso en una página se lee de izquierda a derecha y de arriba hacia abajo. También comienzan a identificar colores, formas, números y letras.
En esta etapa, Lisa sabe que el discurso oral puede ser representado con letras y que las letras tienen una forma específica. Es posible que identifique las letras y entienda la diferencia entre ellas. De igual forma, Lisa ya empieza a reconocer sonidosque rimen.
Lo más importante que usted puede hacer en casa para favorecer el desarrollo de las habilidades de lectura de Lisa es leerle cuentos en voz alta. Si una y otra vez le pide que lea el mismo libro, hágalo y converse con Lisa acerca de lo que han leído, pues al escuchar cuentos y hablar sobre ellos, Lisa aprenderá a relacionar las palabras que escucha con las que aparecen impresas en la página.
Si tiene alguna pregunta sobre las puntuaciones que obtuvo Lisa o sobre estas recomendaciones, por favor comuníquese conmigo cuando guste.
Firma del (de la) maestro(a): ________________________________________________ Fecha: ____________________
Firma del padre o de la madre: ______________________________________________ Fecha: ____________________
Comentarios:
24 ©Copyright 2016 Renaissance Learning, Inc. All rights reserved.

©Copyright 2016 Renaissance Learning, Inc. All rights reserved. 25
Dashboard viewsRenaissance products automates the tracking and reporting of student data from a wide variety of sources, and converts that data into a unified measure of mastery-helping educators make timely and informed decisions about all students’ learning.
Monitor Student Mastery - View students mastery of domains, standards, skills and subskills
View the status of assignments and assessment and what
action needed
View student scores and achievement by lesson,
assignment, skill or item type
Please Note: The new Dashboard views on the following pages look similar. This is intended in order to provide a consistent view of data across applications.

26 ©Copyright 2016 Renaissance Learning, Inc. All rights reserved.
STAR Custom - Monitor Student Mastery

©Copyright 2016 Renaissance Learning, Inc. All rights reserved. 27
Star Custom® Dashboard viewsStar Custom data is calculated in the student’s overall level of mastery. The newly redesigned Star Custom allows educators to choose from pre-made, fixed form tests that target specific reading and math skills. Once students have tested, use the Star Custom Dashboards to gain deeper insight on the skills students know and which skills they still need to work on.
The Monitor Student Mastery dashboard shows a comprehensive view of mastery at the domain, standard, skill, and subskill level.
STAR Custom – Review Student Results
STAR Custom – Track Student Work
Track Student Work gives teachers and easy way to see
assignment status (complete, in progress, etc.) and what action
they need to take.
The Review Students Results Dashboard provides teachers with
their students’ results on skills and assignments.

28 ©Copyright 2016 Renaissance Learning, Inc. All rights reserved.

©Copyright 2016 Renaissance Learning, Inc. All rights reserved. 29
The Monitor Student Mastery Dashboard allows you to view students’ mastery of domains, standards, skills, and subskills. Comparing the domain scores from both the English and Spanish versions of Star assessments will help teachers know if the student has knowledge in Spanish they he can’t yet express in English.
Quickly get an overview of students’ scores on
the Review Students’ Results page.
Star Spanish™ Dashboard viewsNew dashboards show data from Star assessments in both English and Spanish. If you have given both tests, you will see both English and Spanish mastery levels side by side.
30 ©Copyright 2016 Renaissance Learning, Inc. All rights reserved.
This report is also available in the following Renaissance products:

©Copyright 2016 Renaissance Learning, Inc. All rights reserved. 31
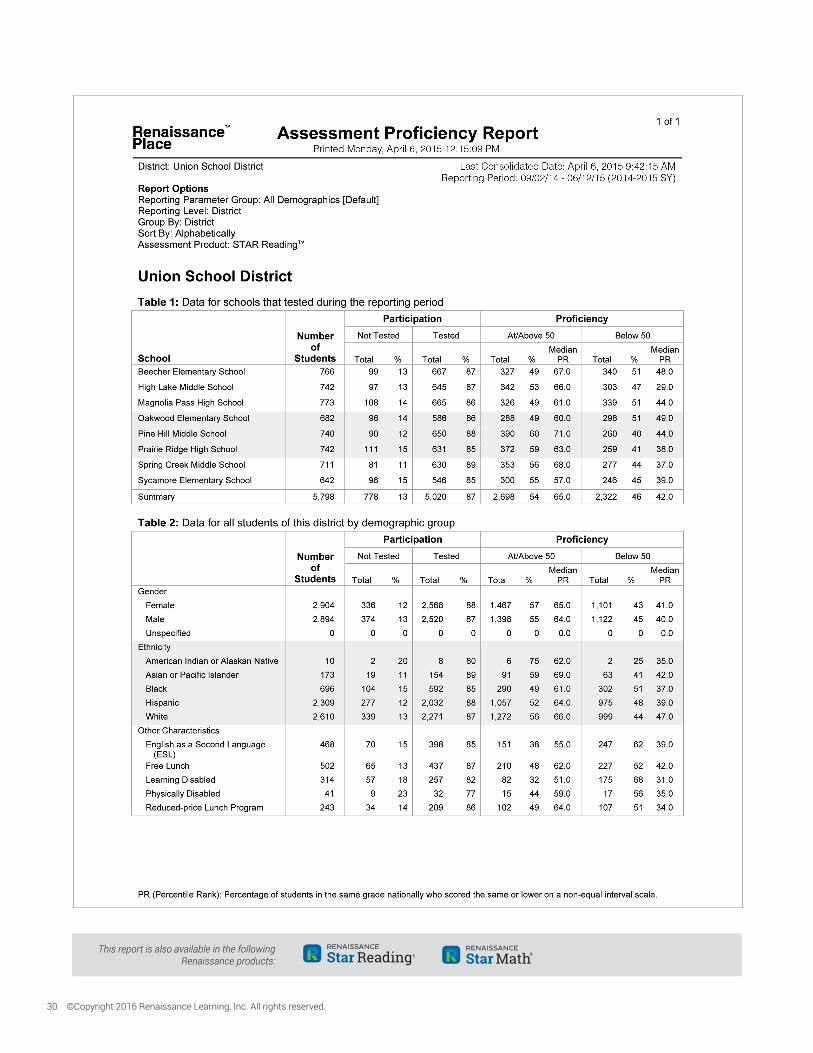
Renaissance Place™ Assessment Proficiency/Customizable Progress ReportsThe Renaissance Place hosted platform frees up technology resources, delivers automatic updates to powerful new product features, and gives districts and schools instant access to real-time data to improve student outcomes. This new generation of web-based technology supports Star Assessments, providing broader, deeper, better information for teachers, students, parents, and administrators. Renaissance Place enables new reporting, live chat support, and supports a broader range of classroom devices than ever before.
The Assessment Proficiency Report helps administrators monitor participation and proficiency across the district and by various demographic groups, using a 50th percentile proficiency benchmark as the report default.
The Customizable Progress Report shows district growth on 1–2 Renaissance assessments and offers a variety of customization options, providing data to monitor fidelity of implementation at different schools across the district.
This report shows the students in the district who have reached a proficiency benchmark in either Star Reading or Star Math.
This report, which is available in Star Reading, Star Math, and
Star Early Literacy, allows district administrators to monitor growth by school and/or grade to ensure
that growth is comparable across peer groups.
R53249.104978.092716Brooklyn | Dallas | Fremont | Hood River | London | Madison | Minneapolis | San Francisco | Sydney | Toronto | Vancouver | Wisconsin Rapids
About Renaissance® Renaissance is the leader in K-12 learning analytics—enabling teachers, curriculum creators, and educators to drive phenomenal student growth. Renaissance’s solutions help educators analyze, customize, and plan personalized learning paths for students, allowing time for what matters—creating energizing learning experiences in the classroom. Founded by parents, upheld by educators, and enriched by data scientists, Renaissance knows learning is a continual journey—from year to year and for a lifetime. Our data-driven, personalized solutions are currently used in over one-third of U.S. schools and more than 60 countries around the world. For more information, visit www.renaissance.com.