key performance indicators (kpis) & benchmarking kpis june 2018.pdf · kpi data from a single...
TRANSCRIPT

Key Performance Indicators (KPIs)
& Benchmarking
TASN Annual Conference
Presented by: Jean Ronnei, SNS, Senior Consultant
June 18, 2018

• Understand KPI & benchmarking
• KPIs
• Internal
• External
• Learn about KPI resources
• ICN, SNA, CGCS, other
• Discover top foundational KPIs
• Deep Dive
• Meals Per Labor Hour (MPLH)
Today’s Learning Goals
2

Affiliation / Disclosure
3
Jean Ronnei, SNS, Senior Consultant
ProTeam Foodservice Advisors
Corporate Partners:

What Are Key Performance
Indicators (KPIs)
▪ KPIs are measures that focus on
the most critical aspects of an
organization’s performance.
▪ These measures provide a rigorous,
numbers-oriented approach to
target specific areas of emphasis,
and assess results in an objective
manner.
4
Rushing, K. (2017). Essential KPIs for School Nutrition Success. Hattiesburg, MS:
Institute of Child Nutrition, Applied Research Division.
What is Benchmarking?
Benchmarking is defined as comparing
one’s performance with a similar
operation’s or unit’s performance to
assist users in identifying best practices,
and to identify areas to focus
improvement efforts on.
5

Collecting and analyzing
KPI data from a single
school or schools within a
district over time for
comparison to itself for
measuring school or
district performance.
Examples:
▪ Meals per Labor Hour (MPLH)
▪ Participation between like
schools
▪ Participation month to month,
YTD
▪ Sick time
▪ Worker’s Compensation
Internal Benchmarking
6

External Benchmarking
The SNA Operations Report is compiled every other year. This report
provides some industry KPI benchmark information.
National Data from 2016 SNA Operations Report
7

▪Council of the Great
City Schools(CGCS)
97 Foodservice KPIs
External Benchmarking
8
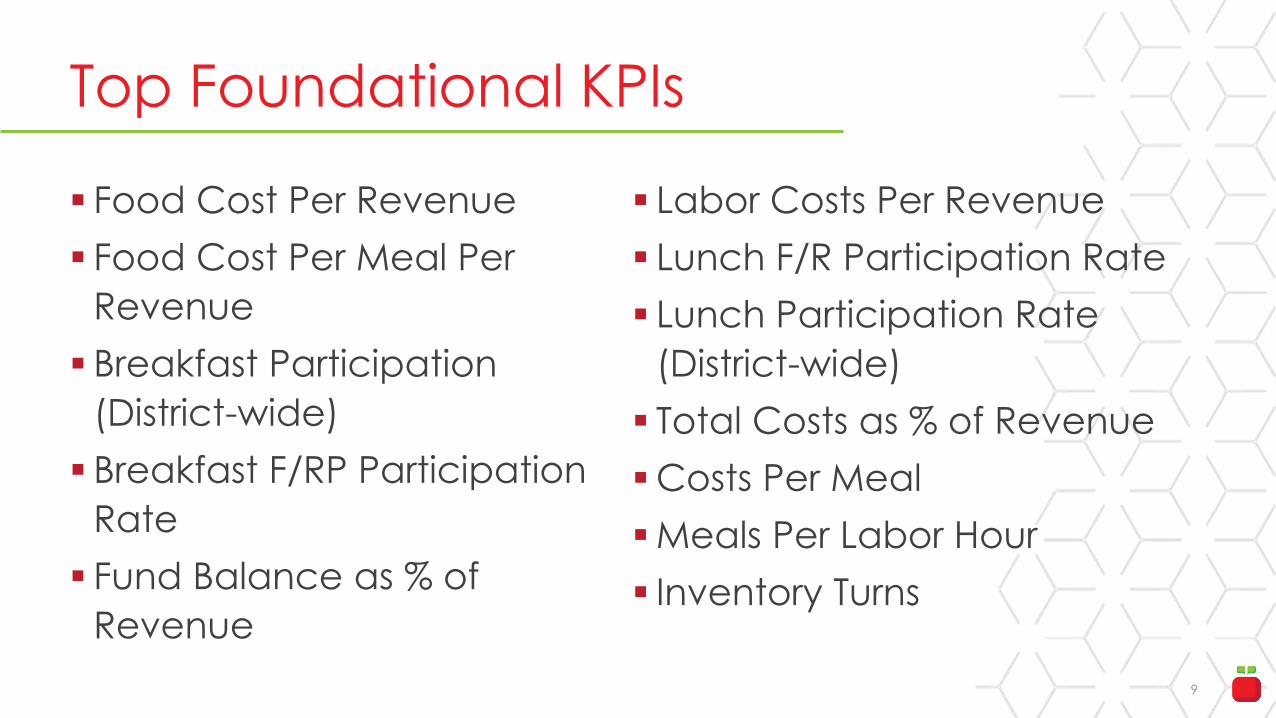
▪ Food Cost Per Revenue
▪ Food Cost Per Meal Per
Revenue
▪ Breakfast Participation
(District-wide)
▪ Breakfast F/RP Participation
Rate
▪ Fund Balance as % of
Revenue
▪ Labor Costs Per Revenue
▪ Lunch F/R Participation Rate
▪ Lunch Participation Rate
(District-wide)
▪ Total Costs as % of Revenue
▪Costs Per Meal
▪Meals Per Labor Hour
▪ Inventory Turns
Top Foundational KPIs
9

Saint Paul Public Schools
10

Food Cost Per Meal Per Revenue
11

Food Cost Per Meal
12

Breakfast Participation Rate
(District-wide)
13

▪ Financial success of the SN
program
▪Monitor the efficiency of
operations
▪Determines appropriate
staffing levels
▪Developing Labor budget
Deep Dive: MPLH
14

How to Calculate MPLH
15
MPLHs are calculated based on actual productive, paid
labor hours assigned to a site.
# of Meals or Meal Equivalents (MEQs)
÷ # of Planned Productive Labor Hours (PPLH)
Rushing, K. (2017). Essential KPIs for School Nutrition Success. Hattiesburg,
MS: Institute of Child Nutrition, Applied Research Division.
Meal Equivalents (MEQs)
16
▪ MEQ is the conversion of different meal services (i.e.,
breakfast, supper, and snacks) and non-program food
sales to the equivalent of one federally reimbursable
student lunch for comparison purposes.
▪ A federally reimbursable student lunch is the standard
unit of measurement.
▪ MEQs are used in many KPIs.
Rushing, K. (2017). Essential KPIs for School Nutrition Success. Hattiesburg,
MS: Institute of Child Nutrition, Applied Research Division

Calculating Meal Equivalents (MEQs)
Why Calculate
▪ In SN programs, a federally reimbursable student lunch
is the standard unit of measurement most often used to
gauge the effectiveness and efficiency of a program.
▪ Converting data for all food sales to meal equivalents
allows the SN professional to calculate KPIs, while
effectively benchmarking financial performance, both
internally and externally.
17

Meal Equivalent (MEQ) Values
18
(1) Lunch or Supper (student or adult) = 1 MEQ
(1) Breakfast = 0.67
(1) Snack = 0.33
Non-program food sales ÷ Free lunch reimbursement
rate + current USDA Food value
Rushing, K. (2017). Essential KPIs for School Nutrition Success. Hattiesburg, MS: Institute
of Child Nutrition, Applied Research Division

Description
The number of MEQs served per labor
hour represents the primary measure of
productivity & production efficiency for
SN programs.
How often to calculate
Weekly, monthly, annually
How to calculate
MPLH index is calculated on the actual
productive, paid labor hours assigned to a
site-level SN program.
▪ The MPLH can be determined for a
school site by dividing the total MEQs for
a given time period by the total # of
productive paid labor hours for the
same time period.
▪ Planned Productive Labor Hours (PPLH)
include the amount of labor planned for
the site. Paid hour for subs are included,
but not paid hours for sick, personal or
holiday leave.
A look at Productivity (MPLH)
19

Planned Productive Labor Hours
Institute of Child Nutrition (ICN) Definition
PPLHs include the amount of labor
planned by an SN program for
managers, kitchen staff, and cashiers.
Paid hours for substitutes are included,
but not paid hours for sick, personal, or
holiday leave.
20

Insert chart
PPLH Sample Calculation

Number of Meals or MEQs = 41,643
÷ Number of Paid Productive Labor Hours = 2,289
= 18.19 MPLH
PPLH or Actual MPLH
Sample Calculation

Industry Guideline for MPLH
▪ 14-18 MPLH
▪ If the MPLH for a site is inside this
range, adjustments are likely not
necessary
▪ If MPLH is 18 or above
▪ No adjustment is needed
▪ If MPLH is below 14
▪ Labor hours may need to be
adjusted

Case Study: Benchmarking MPLH
Eastern Carver County, MN
▪ Director aware that labor hours in similar
districts were lower
▪ Were ECCs high schools not as efficient?
▪ What might she learn from an on-site
observation
▪ Similar district comparison study

Enrollment, Attendance &
Variables
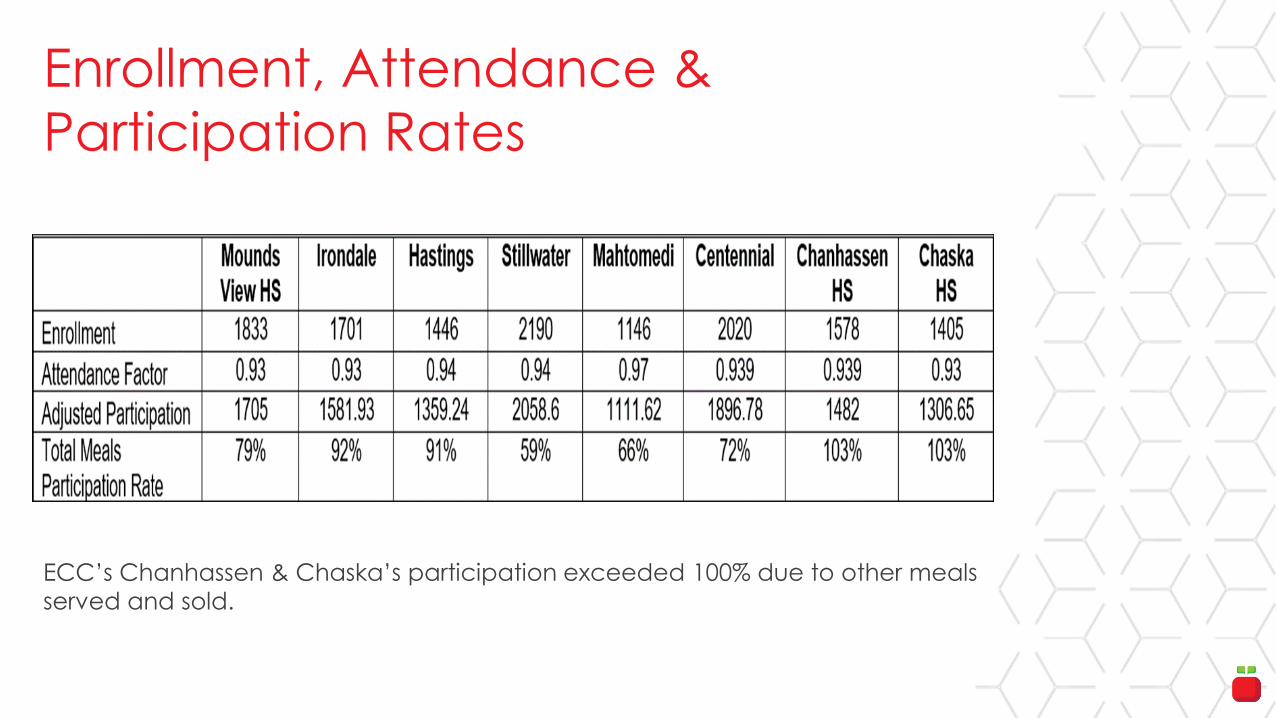
Enrollment, Attendance &
Participation Rates
ECC’s Chanhassen & Chaska’s participation exceeded 100% due to other meals
served and sold.

February 2017
Participation Data

ECC MPLH Study
28

ECC MPLH Study
29

▪Who mops kitchen
▪Who washes café tables
during meal service
▪Who washes café tables
after meal service
# Daily menu choices
# Cashier positions
# Entrees
# Lunch periods
Other Survey Data Collected

ECC MPLH Study Results
▪ Significant variance between all 8 high
schools
• 14.9 - 19.8 MPLH
• 8 to 19 regularly scheduled staff
• Daily labor hours 37.5 - 91.25
• 3 – 6 cashier positions
• Lunch entrée choices 5 - 10

MPLH – Who’s Responsible?
▪ Site Managers & Area Managers need
to know and understand expectations
▪ Plan for:
▪ Who reviews?
▪ How often?
▪ Increased meal counts may = more
Labor Hours

Tracking Data is Vital to Success
Compare data to find areas for improvement
Use your resources wisely
Use the data to instigate change and achieve results
Set internal goals
Use data to demonstrate accomplishments
Cultivate innovation and creativity
Resources & Thanks
Council of the Great City Schools: Managing for Results
https://www.cgcs.org/cms/lib/DC00001581/Centricity/Domain/4/Managing%20for%20Results%20-%202017.pdf
SNA Operations Report
http://docs.schoolnutrition.org/files/School%20Nutrition%20Operations%20Report%202014.pdf
Institute of Child Nutrition Study: Essential KPIs for School Nutrition Success
http://theicn.org/documentlibraryfiles/PDF/20170329015554.pdf
Thanks to Eastern Carver County Schools, MN
KPI software is available using Cool School Cafe Points.
34

Thank You!
Jean Ronnei, SNS
(844) 662-3767 x119
proteamadvisors.com