kevin healy, andrew parnell & andrew jackson accounting for the process of foraging in...
TRANSCRIPT
Kevin Healy, Andrew Parnell & Andrew Jackson
Accounting for the process of foraging in source-level variation in isotopic mixing models
Do Mixing models mimic ecological systems?
Sources of Uncertainty Model Behaviour
– Consumer sampling of food sources.
Newton 2010

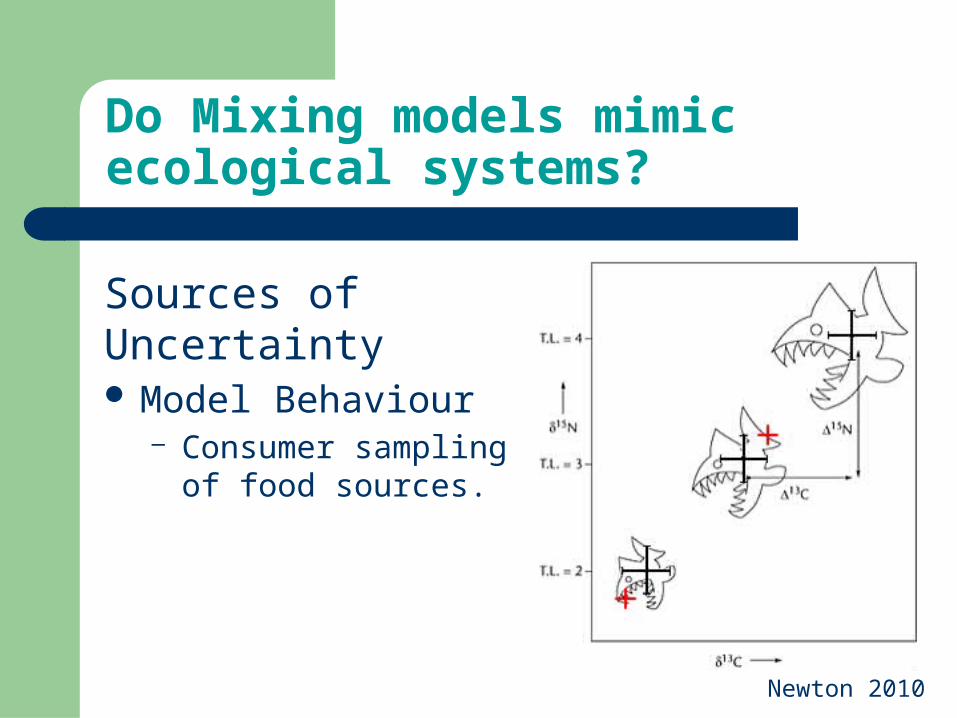
Do Mixing models mimic ecological systems?
Sources of Uncertainty Model Behaviour
– Consumer sampling of food sources.
Newton 2010

Standard Error Vs.
Standard Deviation
Mixing Models use single draw from source distribution
~ S.D
Consumers take numerous draws from source distribution ~ S.E
Standard Error Vs.
Standard Deviation
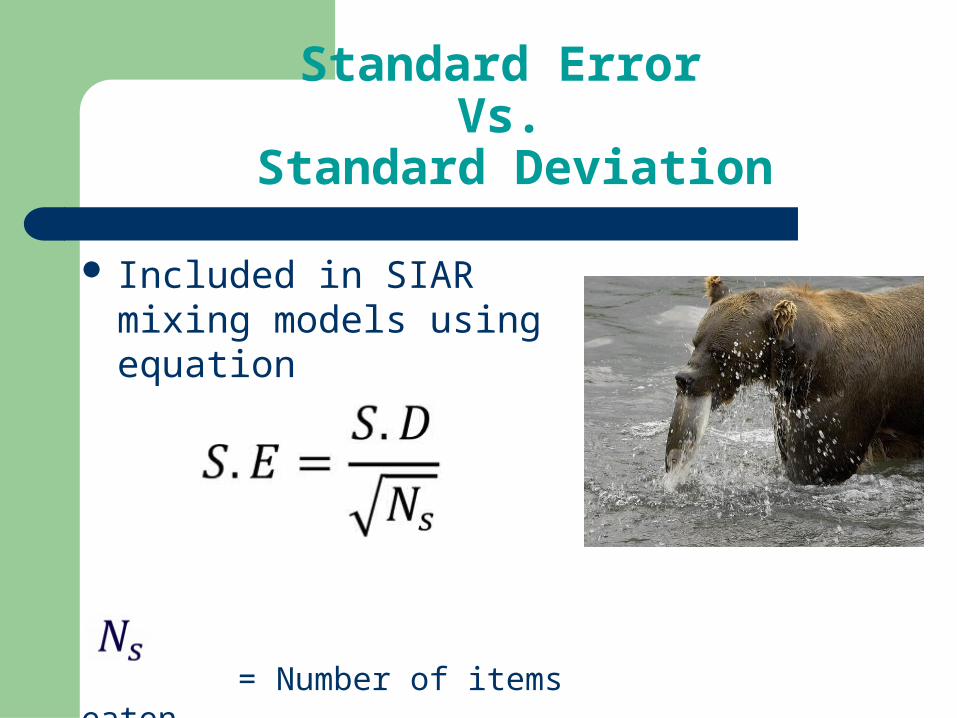
Included in SIAR mixing models using equation
= Number of items eaten

Standard Error Vs.
Standard Deviation
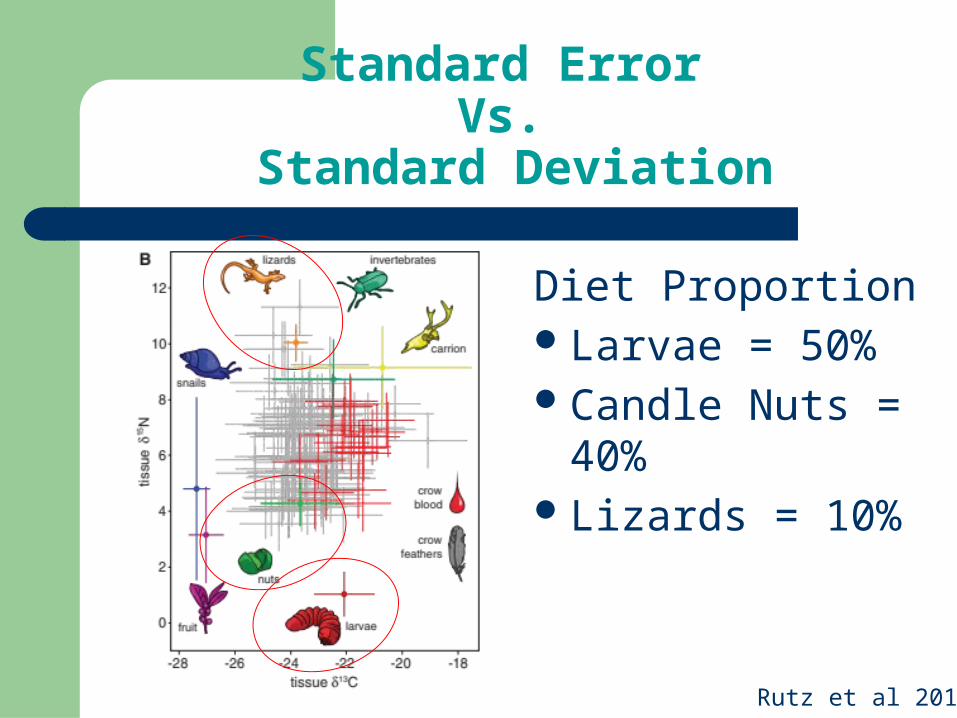
New Caledonian Crows
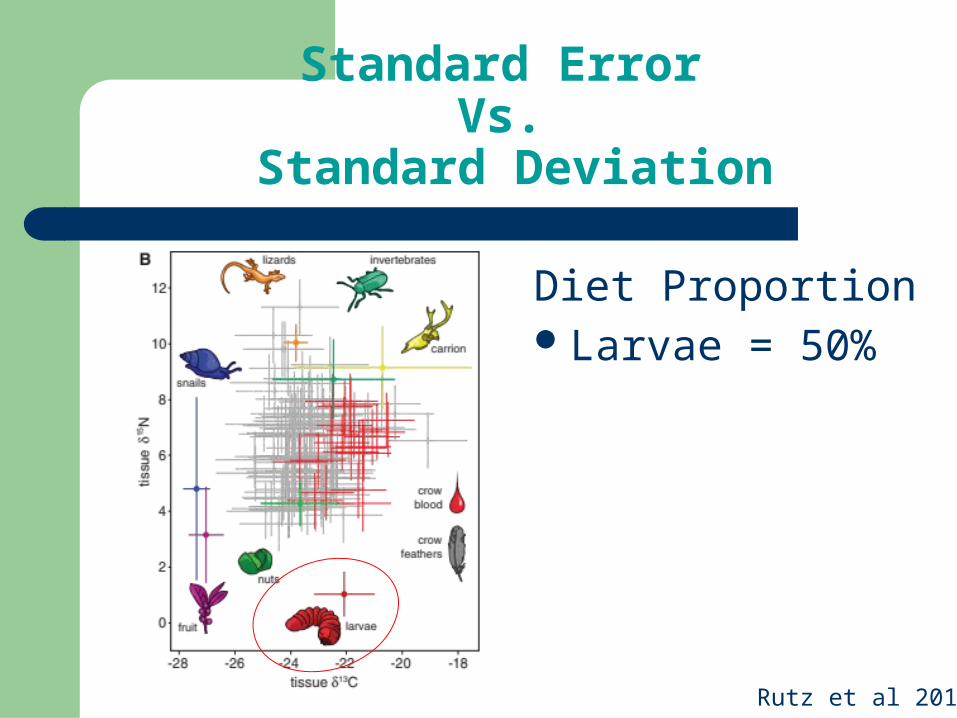
Rutz et al 2010
Ecological importance of tool use
Standard Error Vs.
Standard Deviation
Rutz et al 2010
Diet ProportionLarvae = 50%

Standard Error Vs.
Standard Deviation
Diet ProportionLarvae = 50%Candle Nuts = 40%
Rutz et al 2010
Standard Error Vs.
Standard Deviation
Rutz et al 2010
Diet ProportionLarvae = 50%Candle Nuts = 40%Lizards = 10%
Standard Error Vs.
Standard Deviation
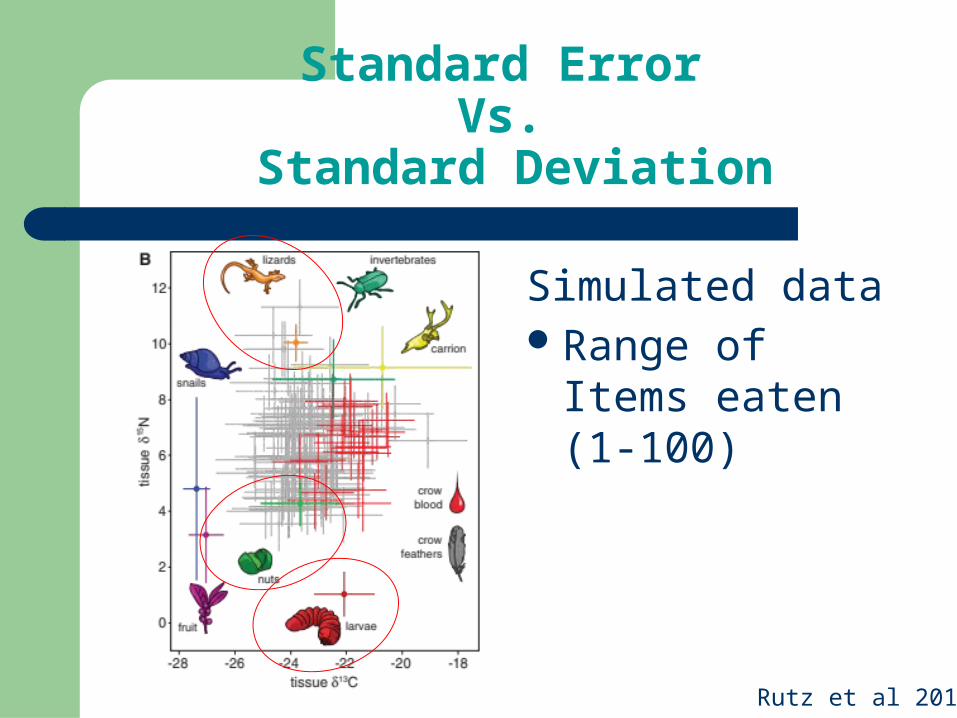
Simulated dataRange of Items
eaten (1-100)
Rutz et al 2010

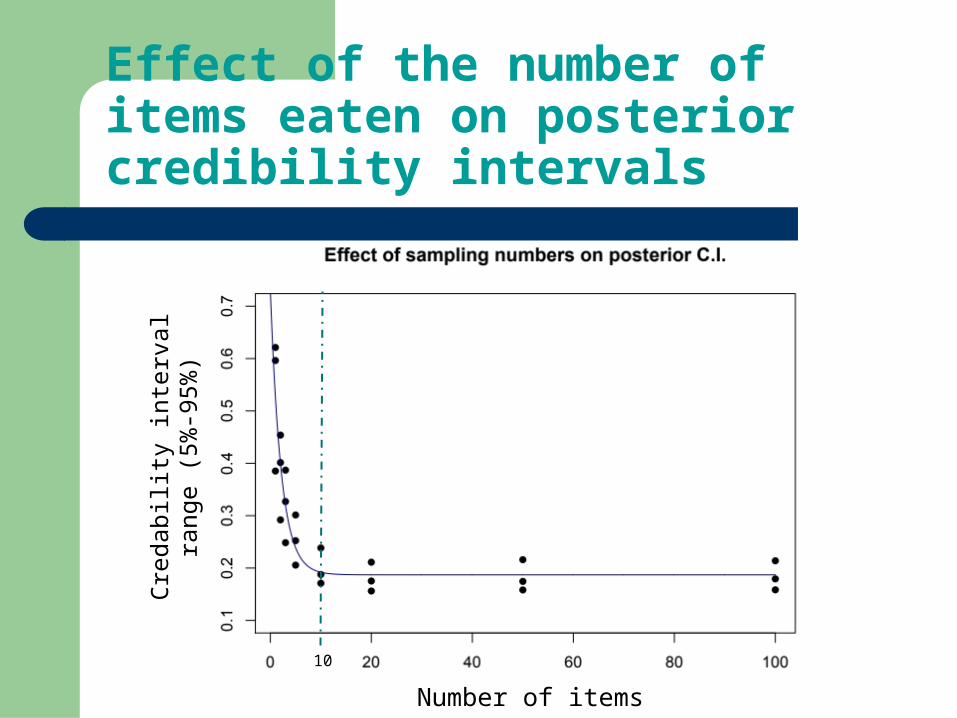
Effect of the number of items eaten on posterior credibility intervals
Larvae iNuts Lizards
1 2 i5 20 100 ii1 12 5 20 100 1 2 5 20 100
Number of items Eaten
Pro
port
ions
0
0. 2
0
.4
0.6
0
.8
1.0

Number of items Eaten
Cre
dabi
lity
inte
rval
ran
ge
(5%
-95%
)
Effect of the number of items eaten on posterior credibility intervals
Number of items Eaten
Cre
dabi
lity
inte
rval
ran
ge
(5%
-95%
)
Effect of the number of items eaten on posterior credibility intervals
i10

Estimating number of items eaten using metabolic theory
Estimating daily energy consumption
Metabolism ~ Mass

Estimating daily energy consumption
= Metabolic rate
= Normalising constant
M = Consumer mass
Estimating number of items eaten using metabolic theory
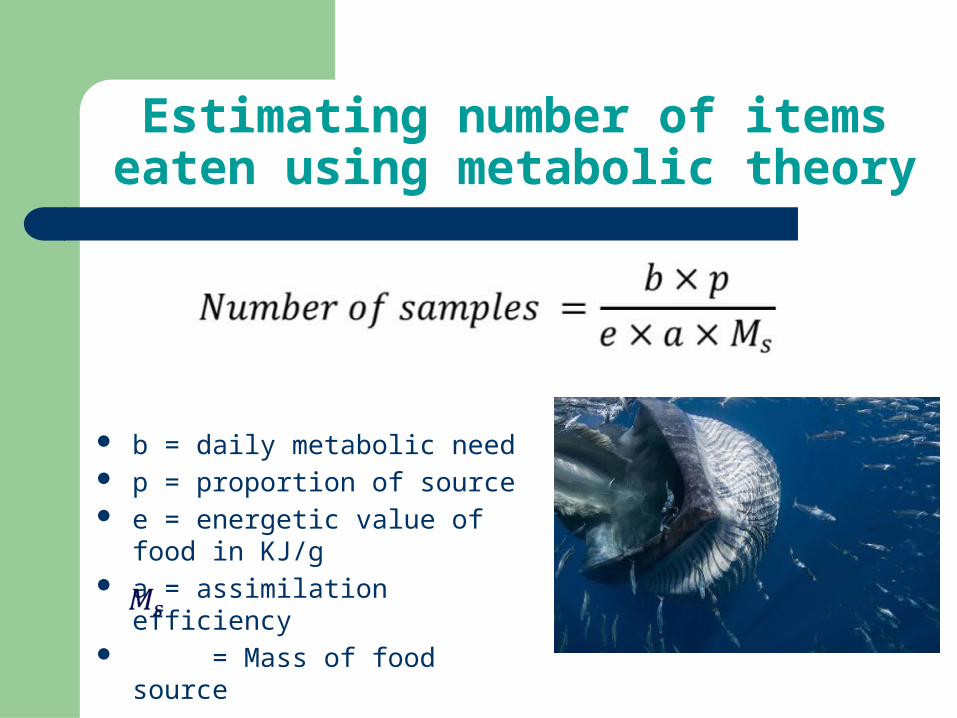
b = daily metabolic need p = proportion of source e = energetic value of food in KJ/g a = assimilation efficiency = Mass of food source
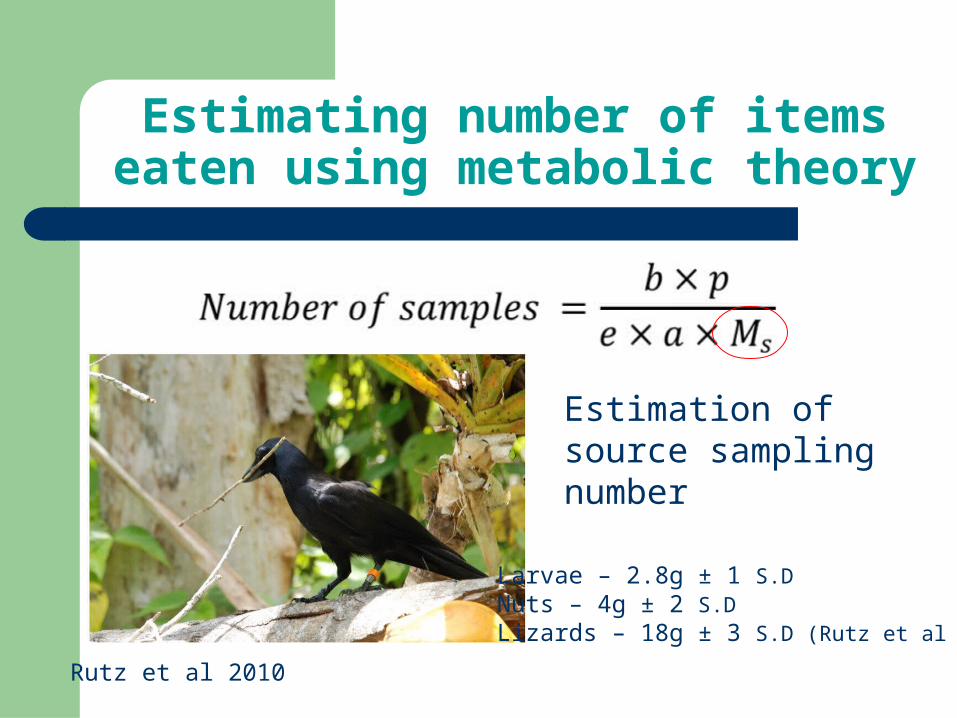
Estimating number of items eaten using metabolic theory

Estimation of source sampling number
Crow - 300g ±1 S.D
= 6.07 (White et al 2011)
Rutz et al 2010
Estimating number of items eaten using metabolic theory
Estimation of source sampling number
Rutz et al 2010
Larvae – 2.8g ± 1 S.DNuts – 4g ± 2 S.DLizards – 18g ± 3 S.D (Rutz et al 2007)
Estimating number of items eaten using metabolic theory
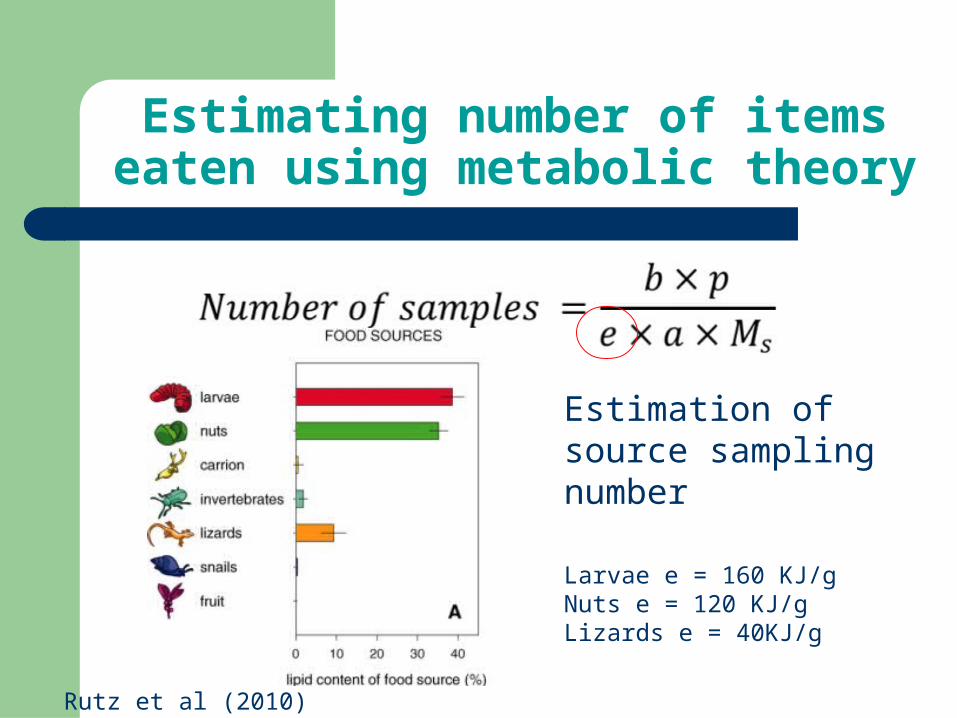
Estimating number of items eaten using metabolic theory
Rutz et al (2010)
Estimation of source sampling number
Larvae e = 160 KJ/gNuts e = 120 KJ/gLizards e = 40KJ/g
Estimating number of items eaten using metabolic theory
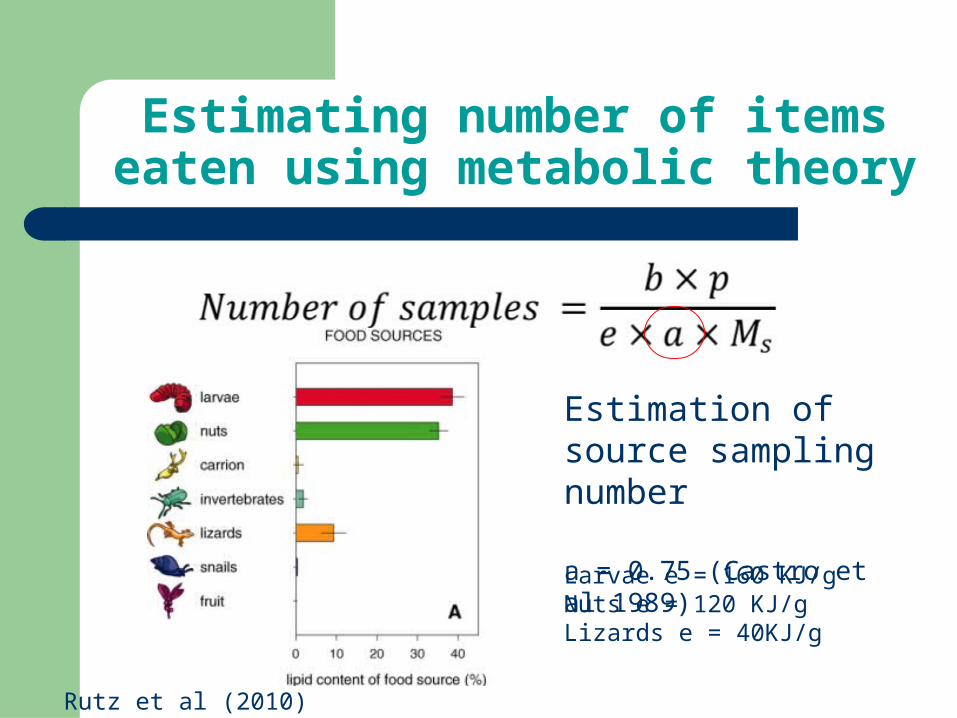
Rutz et al (2010)
Estimation of source sampling number
a = 0.75 (Castro et al 1989)
Larvae e = 160 KJ/gNuts e = 120 KJ/gLizards e = 40KJ/g
Estimating number of items eaten using metabolic theory
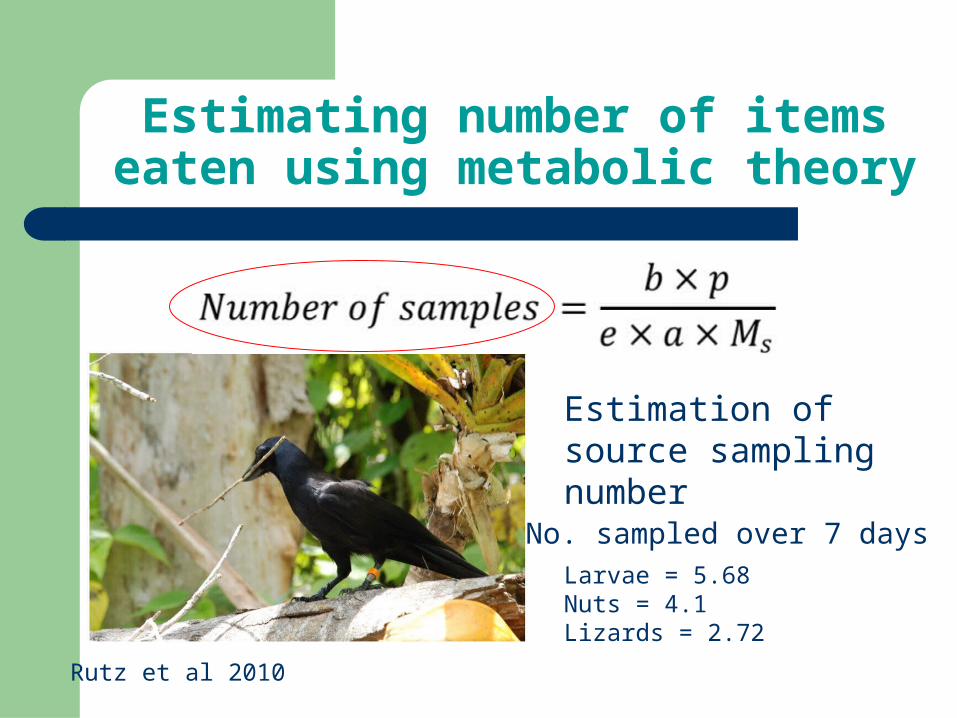
Estimation of source sampling number
Rutz et al 2010
Larvae = 5.68Nuts = 4.1Lizards = 2.72
No. sampled over 7 days
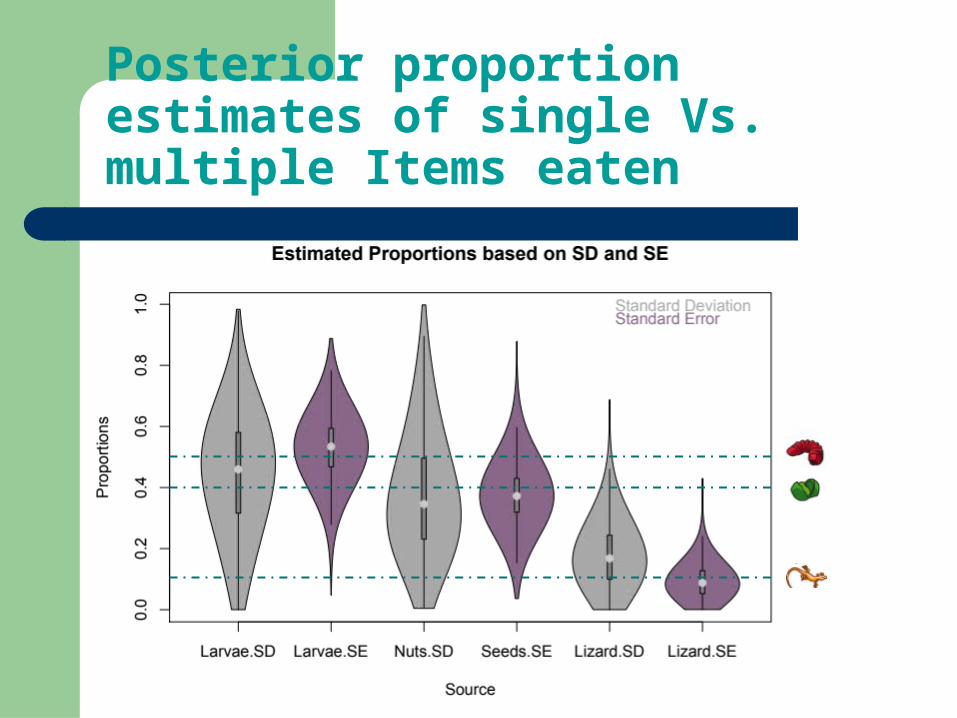
Posterior proportion estimates of single Vs. multiple Items eaten

Posterior proportion estimates of single Vs. multiple Items eaten

Acknowledgments
Andrew Jackson
This work was carried out as part of the Earth and Natural Sciences (ENS) Doctoral Studies Programme, funded by the Higher Education Authority (HEA) through the Programme for Research at Third Level Institutions, Cycle 5 (PRTLI-5), co-funded by the European Regional development Fund (ERDF).
Andrew Parnell
Mafalda VianaLuke McNallyAdam Kane