kenya: improving democracy in spite of political rhetoric
TRANSCRIPT

WWW.AFROBAROMETER.ORG
Improving democracy in spite of
political rhetoric
Findings from Afrobarometer Round 7 survey in Kenya

At a glance
• Democratic preferences: A majority of Kenyans prefer democratic, accountable governance in which:
– Leaders are elected in free and fair elections.
– Political parties compete in an open field.
– The president is accountable to the people and Parliament.
• Democracy improving: Compared to 2014, more Kenyans
consider their country a democracy and are satisfied with the
way it is working.
• Greater freedom: At least six in 10 Kenyans say that freedom of
association, of expression, and of the media have increased.
• Support for a presidential system: Seven of 10 Kenyans prefer a
presidential system of government.
• Greater fear of violence: Fear of political intimidation and
violence during election campaigns has increased significantly.
• Low trust: Trust in police, judiciary, and IEBC is low, while support for removal of IEBC commissioners is high.

What is Afrobarometer?
• A pan-African, non-partisan survey research project that
measures citizen attitudes on democracy and governance,
the economy, civil society, and other topics.
• Started in 12 African countries in 1999, expanded to 36
countries in Round 6 (2014/2015). Round 7 surveys are being
conducted in 2016/2017.
• Goal: To give the public a voice in policymaking by providing
high-quality public opinion data to policymakers, policy
advocates, civil society organizations, academics, news
media, donors and investors, and ordinary Africans.
• A national partner in each country conducts the survey.

Methodology
• Nationally representative sample of adult citizens
All respondents are randomly selected.
Sample is distributed across regions/states/provinces and urban/rural
areas in proportion to their share in the national population.
Every adult citizen has an equal chance of being selected.
• Face-to-face interviews in the language of the respondent’s
choice.
• Standard questionnaire allows comparisons across countries and
over time.
• Sample size in Kenya of 1,599 adult citizens yields a margin of error of +/-3% at a 95% confidence level.
• Fieldwork for Round 7 in Kenya was conducted in September-
October 2016.

Survey demographics
Gender %
Men 50
Women 50
Residence
Urban 36
Rural 64
EducationNo formal education 7
Primary 38
Secondary 36
Post-secondary 19
Religion
Christian 82
Muslim 10
Other 8
5

Findings

Support for democracy | Kenya | 2011-2016
Respondents were asked: Which of these three statements is closest to your own opinion?
Statement 1: Democracy is preferable to any other kind of government.
Statement 2: In some circumstances, a non-democratic government can be preferable.
Statement 3: For someone like me, it doesn’t matter what kind of government we have.
2011 2014 2016
Democracy preferable 73% 65% 67%
Sometimes non-democratic
government can be preferable10% 8% 12%
Doesn't matter 7% 10% 10%
Don't know 9% 17% 12%

Choose leaders through elections vs. other methods (%) | Kenya | 2016
Respondents were asked: Which of the following statements is closest to your view?
Statement 1: We should choose our leaders in this country through regular, open, and honest elections.
Statement 2: Since elections sometimes produce bad results, we should adopt other methods for choosing this
country’s leaders.
1
3
19
77
Agree with neither
Don't know
Adopt other methods for choosing this
country’s leaders.
Choose our leaders through regular,
open and honest elections.

Support for multipartism (%) | Kenya | 2016
Respondents were asked: Which of the following statements is closest to your view?
Statement 1: Political parties create division and confusion; it is therefore unnecessary to have many political parties in Kenya.
Statement 2: Many political parties are needed to make sure that Kenyans have real choices in who governs them.
2
4
31
64
Agree with neither
Don't know
Political parties divisive
Many parties needed

Government accountability vs. efficiency (%)| Kenya | 2016
Respondents were asked: Which of the following statements is closest to your view?
Statement 1: It is more important to have a government that can get things done, even if we have no influence over what it does.
Statement 2: It is more important for citizens to be able to hold government accountable, even if that means it makes decisions more slowly.
4
3
35
58
Don't know
Agree with neither
Government get things done even if
citizens have no influence
It is more important for citizens to be able
to hold government accountable, even if
that means it makes decisions more slowly.

President monitored by Parliament vs. free to act on own (%) | Kenya | 2016
Respondents were asked: Which of the following statements is closest to your view?
Statement 1: Parliament should ensure that the president explains to it on a regular basis how his government spends taxpayers’ money.
Statement 2: The president should be able to devote his full attention to developing the country rather than wasting time justifying his actions.
3
5
31
60
Agree with neither
Don't know
President free to act on his own
President monitored by parliament

Participation in demonstration (%) | Kenya
| 2016
Respondents were asked: Here is a list of actions that people sometimes take as citizens when they are dissatisfied with government performance. For each of these, please tell me whether you, personally, have done any of these things during the past year: Participated in a demonstration of protest march? If not, would you do this if you had the chance?
2
1
3
6
21
67
Don't Know
Yes, often
Yes, several times
Yes, once or twice
No, but would do if had the chance
No, would never do this

Frequency of discussing politics (%) | by gender
and education | Kenya | 2016
Respondents were asked: When you get together with your friends or family, would you say you discuss political matters frequently, occasionally, or never? (% who say “occasionally” or “frequently”)
30
54
74
80
54
73
64
No formal education
Primary
Secondary
Post-secondary
Female
Male
Total
Ed
uc
atio
nG
en
de
rTo
tal

Frequency of discussing politics (%) | Kenya
| 2011-2016
Respondents were asked: When you get together with your friends or family, would you say you discuss political matters frequently, occasionally, or never? (% who say “occasionally” or “frequently”)
3134 36
69 66 64
0
10
20
30
40
50
60
70
80
2011 2014 2016
Never Occasionally / frequently

Perceived extent of democracy (%) | Kenya
| 2005-2016
Respondents were asked: In your opinion, how much of a democracy is Kenya today? (% who say “a full democracy” or “a democracy with minor problems”)
50
44 4248
63
2005 2008 2011 2014 2016

Satisfaction with democracy (%) | Kenya
| 2005-2016
Respondents were asked: Overall, how satisfied are you with the way democracy works in Kenya? (% who say “fairly satisfied” or “very satisfied)
51
42
47 48
56
2005 2008 2011 2014 2016

Freedom of association (%) | Kenya | 2016
Respondents were asked: Which of the following statements is closest to your view?
Statement 1: Government should be able to ban any organization that goes against its policies.
Statement 2: We should be able to join any organization, whether or not the government approves of it.
3
4
46
47
Agree with neither
Don't know
We should be able to join any
organization, whether or not the
government approves of it.
Government should be able to ban any
organization that goes against its
policies

Freedom to join any political organization (%) | Kenya | 2016
Respondents were asked: Please tell me if there is more or less freedom now for each of the following things compared to a few years ago, or are things about the same: Your own freedom to join any political organization you want?
12 16
67
5
Somewhat /
much less
freedom
Same Somewhat /
much more
freedom
Don’t know

Freedom of expression (%) | Kenya | 2016
Respondents were asked: Please tell me if there is more or less freedom now for each of the following things compared to a few years ago, or are things about the same: Your own freedom to say what you think about politics?
21 15
60
4
Somewhat /
much less
freedom
Same Somewhat /
much more
freedom
Don’t know

Media freedom to report on and criticize government (%) | Kenya | 2016
Respondents were asked: Please tell me if there is more or less freedom now for each of the following things compared to a few years ago, or are things about the same: The media’s freedom to investigate and report on government mistakes or to criticize government actions or performance?
18 14
61
6
Somewhat / much
less freedom
Same Somewhat / much
more freedom
Don’t know

Preferred government system (%) | Kenya | 2016
Respondents were asked: There are many ways to govern a country. Would you disapprove or approve of the
following government systems for the republic of Kenya: A presidential system in which the president is head of
state and government? A parliamentary system in which a prime minister who is chosen from the largest party in
Parliament becomes head of government and leader of the legislature? A mixed system in which a president is
head of state and a prime minister is head of government?
27
33
70
50
47
19
9
9
3
13
10
7
Kenya governed by parliamentary
system
Kenya governed by mixed system
Kenya governed by presidential system
Approve / strongly approve Disapprove / strongly
Neither Approve Nor Disapprove Don’t know
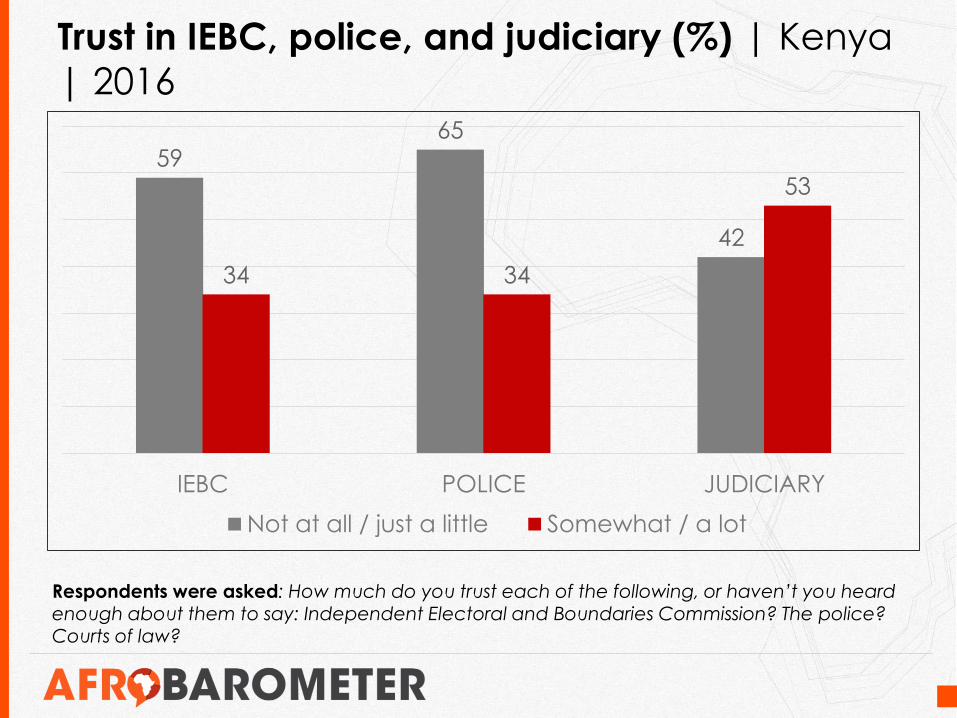
Trust in IEBC, police, and judiciary (%) | Kenya
| 2016
Respondents were asked: How much do you trust each of the following, or haven’t you heard enough about them to say: Independent Electoral and Boundaries Commission? The police? Courts of law?
5965
42
34 34
53
IEBC POLICE JUDICIARY
Not at all / just a little Somewhat / a lot

Removal of IEBC members necessary? (%) |
Kenya | 2016
Respondents were asked: For each of the following statements, please tell me whether you disagree or agree, or haven’t you heard enough to say: Removal of all commissioners of the Independent Electoral and Boundaries Commission or IEBC was necessary to build public confidence ahead of 2017 elections?
23
5
62
9
Disagree / strongly
disagree
Neither Agree Nor
Disagree
Agree / strongly
agree
Don’t Know

Fear of political intimidation or violence during campaigns (%) | Kenya | 2014-2016
Respondents were asked: During election campaigns in this country, how much do you personally fear becoming a victim of political intimidation or violence?
24
16
26
33
0
41
14
21 22
1
A lot Somewhat A little bit Not at all Don’t know
2014 2016

Conclusions

• Growing numbers of Kenyans see their country as a democracy
and are satisfied with the way the political system is working.
• Kenyans prefer their leaders to be democratically elected in a
free and fair manner.
• Freedoms of association, expression, and the media are seen as
increasing.
• Public trust in the police, judiciary, and IEBC is low.
• A majority of Kenyans express fear of becoming victims of political
intimidation or violence during election campaigns.

Thank you
Follow our releases
on #VoicesAfrica on
Twitter and
Facebook.
Do your own analysis of Afrobarometerdata – on any question, for any country and survey round. It’s easy and free at
www.afrobarometer.org/online-data-analysis.