kentucky shape journal
TRANSCRIPT

[Kentucky SHAPE JOURNAL] Volume 58, Issue Number 1
ISSN: 2333-7419 (Online Version) ISSN: 1071-2577 (Printed Copy)
www.kyshape.org/
2020 Fall
Kentucky SHAPE Journal
Kentucky SHAPE Journal Vol. 58 No. 1 - 2 -
Kentucky SHAPE Journal Volume 58, Issue 1, 2020 (Fall Issue)
ISSN: 2333-7419 (Online Version) ISSN: 1071-2577 (Printed Copy)
TABLE OF CONTENTS
(Peer Reviewed Articles)
Economic Impact of Paddling on the Kentucky River near Fort Boonesborough State Park .......9
(Maples, Bradley, & Hacker)
Transformational Leadership in Club Sports. ................................................................................22
(Hutchens, Stokowski, Lasater, & Dittmore)
Measuring the Levels of Athletic Identity and Identity Foreclosure of National Association of
Intercollegiate Athletics (NAIA) Student-Athletes .......................................................................38
(Washington)
Safety Concerns in Football: A Systemic Review on the Protocol of Return to Play after
Concussion .....................................................................................................................................53
(Smith, Chen, Gonzalez, & Braden)
(Peer Reviewed Case Study)
Tailgating at College Campuses: A Sobering Dilemma ................................................................69
(Chen, Salazar, & Henderson)

Kentucky SHAPE Journal Vol. 58 No. 1 - 3 -
2020 Kentucky SHAPE Board and Officers
President Robin Richardson
President-Elect Gavin Washington
Past-President Daniel Hill
Executive Director Jamie Sparks
Physical Education Linda Rucker
Physical Education-Elect Lindsey Prozanski
Health Jessica Napier
Health-Elect Mary Jo Geddes
General AJ Mortara
General- Elect Sarah Adkins
Dance Lydia Austin
Dance-Elect Candace Young
Sport and Leisure Chad Sweeney
Sport and Leisure- Elect Theo Bellamy
At Large West D.J. Riggs
At Large West Billie Stone
At Large East Jamie Neal
At Large East LaDonda Porter
Health.Moves.Minds Coordinator Angela Stark
Health.Moves.Minds Coordinator Catie Embry
Student Representative Lexi Turner
Necrology John Ferguson
Awards Chair Kim Demling
JCPS Liason Meme Ratliff
Journal Co-Chair Steve Chen
Journal Co-Chair Gina Gonzalez
Journal Co-Chair Stacy Forsythe
Exhibits Chair Billie Stone
Secretary/Treasurer Stephanie Bunge
Convention Manager Stephanie Bunge
Acknowledgement
As the Editors of the Kentucky SHAPE Journal, we would like to show our appreciation to the following
guest-reviewers for their assistance in reviewing this current issue.
Dr. Matthew Sabin, Eastern Kentucky University; Dr. Paula Upright, Western Kentucky University; Dr.
Craig Morehead, Indiana State University, Dr. Tricia Jordan, Western Kentucky University; Dr. Eric
Knackmuhs, Western Kentucky University; and Dr. Allie McCreary, Western Kentucky University.
Sincerely,
Gina Blunt Gonzalez, Kentucky SHAPE Journal Co-Editor
Dr. Stacey Forsythe, Kentucky SHAPE Journal Co-Editor
Steve Chen, Kentucky SHAPE Journal Managing Editor

Kentucky SHAPE Journal Vol. 58 No. 1 - 4 -
A Message from the Kentucky SHAPE President
Greetings Kentucky SHAPE friends,
Greetings from your 2020-2021 president. 2020 has been a year of change and challenges. 2020
has also made it abundantly clear how important our field is to quality and quantity of life. I have
never been prouder to be a part of such an amazing organization that is leading the state in the
navigation of a world pandemic. We have continued the work and provided support to
professionals in all areas of education and research as we have done since our inception in 1909.
During the annual convention in 2019, the membership voted to officially change our name to
Kentucky SHAPE to align with our parent/national organization SHAPE America, which was
formerly AAHPERD, (American Alliance of Health, Physical Education, Recreation, and
Dance). AAHPERD changed its name in December 2013, since then individual states across the
country have continued in this trend of renaming and rebranding.
One of our goals as a state association was to make sure that we included all aspects of our
history and honoring those that we serve. We wanted to make sure that we are treasuring our past
and continue to shape our future. I am proud to present our new logo and brand which
strategically includes our past yet shapes our future: The Red circle represents health, the Yellow
represents physical education, the blue represents recreation and the green represents dance. Our
tagline “teaching students to THRIVE for life” will help guide our future work and advance or
mission as we work to advocate for quality health, physical education, recreation, dance, and
exercise science.
Finally, I would like to give a special thank you to Dr. Steve Chen, Stacy Forsythe, and Dr. Gina
Blunt-Gonzalez for serving as our Journal co-editors, their time and commitment to this
publication is a valuable asset to all KAHPERD members and beyond. Also, thank you to our
writers for your professional contributions to this edition.
I am hopeful that we will soon be able to come together professionally to grow KYSHAPE. Best
wishes to all and stay well.
Respectfully Submitted
Robin A. Richardson 2020-2021 President
Kentucky SHAPE Journal Vol. 58 No. 1 - 5 -
Kentucky SHAPE Journal Submission Guideline
SUBMISSION OF A PAPER
The Kentucky SHAPE Journal (formerly KAHPERD Journal) is published twice yearly (spring
and fall) by the Kentucky SHAPE. The journal welcomes the submission of empirical research
papers, articles/commentaries, best practices/strategies, interviews, research abstracts (spring
issue only) and book reviews from academics and practitioners. Please read the information
below about the aims and scope of the journal, the format and style for submitted material, and
the submissions protocol. Your work will more likely to be published if you follow the
guidelines thoroughly.
Articles are accepted via an electronic attachment (must be in Microsoft Word format, doc or
docx) through e-mail to the editor before the deadline dates. Submissions should be sent to one
of the co-editors below based on the topic (nature) and discipline of the study:
For an article related to health and physical education, health promotion, exercise science
and exercise physiology, please email the submission to Gina Gonzalez:
For an article related to recreation and sport management/administration, sport sociology,
and sport coaching, please email the submission to Stacey Forsythe:
Deadlines:
Spring issue—March 1
Fall issue—September 1
Estimated publishing time: Spring issue—Mid May & Fall issue—Late November
AIMS AND SCOPE
The main mission is to bring together academics and practitioners to further the knowledge and
understanding of issues and topics related to health, physical education, sport administration and
marketing, exercise science, sport coaching, dance, and recreation, etc. We encourage
submissions relating to these topics from a variety of perspectives.
FORMAT AND STYLE
When preparing manuscripts for publication in the Kentucky SHAPE Journal, authors should
follow the guidelines set forth in the Publication Manual of the American Psychological
Association, Seventh Edition, 2019. Manuscripts should not be submitted for publication
elsewhere at the same time being reviewed by Kentucky SHAPE Journal. Authors are advised to
proof the typing, and check references for accuracy. Articles should include an abstract of
approximately 150 words including the rationale for the study, methods used, key findings and

Kentucky SHAPE Journal Vol. 58 No. 1 - 6 -
conclusions. Manuscripts should not exceed 20 double-spaced pages (not including references,
tables, and figures).
The manuscript must be typed double-spaced, including the abstracts and references; please
number each line. Tables, charts, pictures, diagrams, drawings and figures should be in black and
white, placed on separate pages at the end of the manuscript. They must be submitted photo-
ready and reproduced to fit into a standard print column of 3.5 inches. Only one copy of each
illustration is required, and captions and proper citations should be typed on the bottom of the
table and diagrams; please clearly mark where the tables/figures belong in the text. Jargon should
be reduced to a minimum, with technical language and acronyms clearly defined. The accuracy
of any citations is the responsibility of the author(s).
For more specific style questions, please consult a recent edition of the journal.
CONTENT
All submissions should be written primarily to inform senior practitioners and academics
involved in areas of health, physical education, recreation, and dance.
Research Manuscripts
Research articles should be well-grounded conceptually and theoretically, and be
methodologically sound. Qualitative and quantitative pieces of research are equally appropriate.
Formatting suggestion: Introduction, Literature Review, Methodology, Results, & Discussion,
Conclusion, and Implication.
Book Reviews
Reviews of books and/or reports are welcome (around 1000-2000 words). Information
concerning the book/report must be sent to the editor. Interviews (it would be nice to discuss
with the editor beforehand) and best practice/strategy papers of 1,500-3,000 words should be
objective and informative rather than promotional and should follow the following
format: Objective/Background/Discussion and Practical Implication.
Research Abstracts
Research abstracts (300 words or less) are welcome. The submitted abstracts should have been
presented (either an oral or a poster presentation) in the KAHPERD annual conference in the
previous year.
*The editors are keen to discuss and advise on proposed research projects, but this is no
guarantee of publication.
Case Studies
The purpose of using case studies in learning environments is to stimulate critical thinking.
Such thinking skills as problem-solving, decision-making, creative thinking, visualizing,
knowing how to learn, and reasoning should be stimulated as your case is discussed in learning
environments.
The guidelines found below provide authors guidance in writing case studies for publication in
the KAHPERD Journal:

Kentucky SHAPE Journal Vol. 58 No. 1 - 7 -
1. Use narrative form when writing your case(s). Consider telling a brief story about a
controversial or problematic issue or incident in the field of discipline selected from the list
of suggested subject areas, competencies, and educational levels. The story could, for
example, illustrate principles or theories, describe events, and/or address problems or
situations related to the topic(s) you choose. You may include data to be analyzed or
illustrated. Include a key character with a problem or dilemma to solve. Within the case, the
key character may or may not attempt to solve the issue within the case.
For Example:
Suggested Subject
Area Competencies Focus
Educational
Level
Alcohol sponsorship
and sales at collegiate
venues
Diversity, ethics,
decision making,
social responsibility
Sport Management Undergraduate,
Graduate, or
both
Class management Leadership, strategic
planning,
communication
PE Undergraduate,
Graduate, or
both
Design of fitness
programs
Scientific training,
First Aid training,
sport psychology
Exercise science Undergraduate,
Graduate, or
both
Tourism economic
impact study
Economy, analytic
skills, event planning
Recreation Undergraduate,
Graduate, or
both
Developing a weight
watching program
Nutrition, exercise
knowledge,
motivation….
Health, and health
promotion
Undergraduate,
Graduate, or
both
Preparing a dance gala Strategic planning,
event management,
dance performance
Dance Undergraduate,
Graduate, or
both
2. The case can be based on reality or fictional scenario. It can also evolve from one’s own or
others’ actual experience. It can be deeply personal and reflective, yet it should be written
objectively. The case is intended to simulate real life; therefore, the case does not have to be
unrealistically neat. Rather, the issue can be messy and complex.
3. Case authors should provide questions and solution ideas. Often, when writing and
discussing case(s), it is advised to allow readers to discuss analyses and compromise, make
their own interpretations, and draw their own inferences regarding solutions. Although
solutions may not always extensively included, case authors are encouraged to cover detailed
solutions that helps educators discuss the cases in a more informed and insightful way with
students.
4. To provide an optimal learning opportunity through the case(s), four elements should be
included in the case study submission:
a. Abstract and learning objectives: a summary of case and its purpose, learning
outcomes and applications (75-150 words)
i. Fill in the following boxes

Kentucky SHAPE Journal Vol. 58 No. 1 - 8 -
Suggested Subject
Area
Competencies Focus Educational Level
b. Introduction of case: presentation of issues, challenges, problems, and various
thoughts
c. Teaching notes: addressing discussion questions, guidelines for discussions, and pros
and cons of different solutions
d. References
SUBMISSIONS AND REVIEW PROTOCOL
Submission of a paper to the publication implies agreement of the author(s) that copyright rests
with Kentucky SHAPE Journal when the paper is published. Kentucky SHAPE Journal will not
accept any submissions that are under review with other publications. All manuscripts submitted
will be peer-reviewed by 2 to 3 professionals/experts. Authors will normally receive a decision
regarding publication within six to eight weeks. Rejected manuscripts will not be returned.

Kentucky SHAPE Journal Vol. 58 No. 1 - 9 -
(Peer Reviewed Article)
Economic Impact of Paddling on the Kentucky River near Fort
Boonesborough State Park
James N. Maples, Eastern Kentucky University
Michael J. Bradley, Arkansas Tech University
Natasha Hacker, Eastern Kentucky University
Abstract
The Kentucky River has long represented an important part of Kentucky history, and it now is
home to a growing paddling community. This study examined the economic impact of paddlers
visiting Pools 9 and 10, and their expenditures in Clark, Fayette, and Madison Counties.
Economic impact analysis incorporates visitor spending data (via survey) and traces these funds
as they move throughout the local economy. This includes monies that are redistributed in local
wages, collected as taxes, and spent to restock supplies. This study found visitor paddlers
generated an estimated $96,441 in local job wages in 2019. Results indicated paddlers have a
strong interest in the natural features of the region as well as interests in other kinds of outdoor
recreation (such as hiking) while visiting the area.
Keywords: Economic Analysis, Nature Tourism, Economic Development, Recreation, Kentucky
River, and Paddling
Introduction
Paddling represents a growing source of economic stimulus in the outdoor recreation industry
(HRWC, 2016; ICFM, 2012; Pollock, Chase, Ginger, & Kolodinsky, 2007). Paddling includes
many forms of human-powered watercraft use including canoes, kayaks, stand up paddleboards
(SUP), and whitewater rafts. The previously mentioned studies found visiting paddler
expenditures support local jobs and generate income for local businesses and employees. Recent
work found paddlers are generally well-educated with relatively high incomes and a notable
percentage are business owners (Maples, Sharp, Clark, Gerlaugh, & Gillespie, 2017 2017).
Paddlers found ways to engage with natural environments while minimizing paddling impacts on
the environment, making this a relatively sustainable and predictable form of economic impact
for local communities (Thomas & Thomas, 2000).
The Kentucky River offers great opportunities for kayaking, canoeing, SUP use, and a small
thriving paddling community (Ky.gov, nd). The Kentucky River was an important part of daily
survival in the Commonwealth’s early history (O’Dell, 2017; Johnson & Parrish, 1999). Today,
paddling is a common activity on the Kentucky River Pools 9 and 10, located near Fort
Boonesborough State Park (Enoch, nd). The area also now hosts an annual paddling festival,
which celebrates the region’s natural features. However, until now, no studies have examined the
economic impact of paddling in this area nor the implications of its future growth.

Kentucky SHAPE Journal Vol. 58 No. 1 - 10 -
Therefore, the researchers examined the economic impact of visitor paddlers visiting Pools 9 and
10 of the Kentucky River. The researchers found paddlers’ financial injections creates job
income within the study area and estimated this could increase to nearly a quarter million per
year by the end of the decade. The researchers also provided specific suggestions to the local
communities as they consider paddling as a long-term source of economic activity for Kentucky
River communities around Pools 9 and 10.
Literature Review
The Kentucky River forms in Beattyville, Kentucky from three separate branches: the North
Fork, Middle Fork, and South Fork. From Beattyville, it flows northwest through the Daniel
Boone National Forest, alongside Boonesborough and through the Kentucky River Palisades,
before meandering south of Lexington and north of Frankfort on its journey to the Ohio River at
Carrollton, Kentucky. The 260-mile river covers a great swath of the Cumberland Mountains and
Bluegrass Region and has a strong tie to the Commonwealth’s history along the way (Johnson
&Parrish, 1999). Today, eleven Kentucky cities and over 700,000 residents draw their drinking
water from the Kentucky River, making this river a vital part of region’s existence (Kentucky
River, 2020).
The study specifically examined the recreational activities in Pools 9 and 10 along the Kentucky
River in Clark and Madison Counties. Both pools include a mixture of historic sites and natural
features accessible to paddlers (Figure 1). This area includes popular paddling areas such as
Howard’s Creek, Boone Creek, Jouett Creek, Owsley Creek, Two Mile Creek, Four Mile Creek,
and the Red River (Enoch, nd). The area also includes Fort Boonesborough State Park, the Civil
War Fort Nature Trail, John Holder Walking Trail, and Lower Howard’s Creek Nature Preserve.
This area hosts a thriving paddling community and is home to The Explore Kentucky Initiative’s
Bluegrass River Run, an annual paddling festival. The area is included as part of the Blue Water
Trails system, which includes over 30 locations across the Commonwealth (Ky.gov, n.d.).

Kentucky SHAPE Journal Vol. 58 No. 1 - 11 -
Figure 1. Counties in the Kentucky River Watershed
Source: Bluegrass Greensource (https://bggreensource.org/working-together-improve-water-
quality-rivers-streams/)
Previous studies examined the economic impact of paddling and boating water trails over the last
decade. The 740 mile Northern Forest Canoe Trail generates an estimated $12 million annually
while supporting 280 jobs based on the expenditures of 90,000 paddlers (Pollock et al., 2007). In
2016, the Huron River and Huron River National Water Trail, with annual visitation of 122,981,
generated $53 million annually in Southeastern Michigan (HRWC, 2016). In 2012, the 480-mile
Pennsylvania Water Trail generated $731,000 in economic impact based on the expenditures of
3,530 paddlers (ICFM, 2012). Overall, research also promotes creating water trails as a useful
form of economic impact (Warren, 2015).
Further studies examined paddling in specific locations. Whisman and associates (1996) found
that paddling visitation on West Virginia’s Gaulley, New, and Cheat Rivers generated $22
million in job income in the region based on visitation of over 467,000 paddlers. A 2001 study of
the Wild and Scenic segments of the Chattooga River reported paddlers generated $2.7 million in
economic activity (Moore & Siderelis, 2003). A Vermont study by Michael Crane (2005) found
that each day of recreational water releases on the West River supported an estimated $148,000
for the regional economy. More recently, a 2016 Colorado study reported paddlers on the
Colorado River generated a record-setting $179 million based on an 8% increase in paddling
days compared to 2015 (CROA, 2016).
The purpose of this study was to estimate the economic impact of paddling of the Kentucky
River in Pools 9 and 10.This area includes Kentucky River, Lower Howard’s Creek, Boone
Creek, Jouett Creek, Owsley Creek, Two Mile Creek, Four Mile Creek, and Red River, each of

Kentucky SHAPE Journal Vol. 58 No. 1 - 12 -
which are included in the analysis. Given growth in the outdoor recreation sector, researchers
examined future increases in visitation in Pools 9 and 10. Additionally, researchers examined
visitor demographics, river use patterns, and other outdoor recreation patterns to provide a
clearer understanding of the paddlers in this region. The collected information should be able to
boost local jobs to improve the service quality of paddling business, lodging accommodation,
and food service. The community can also gain more recognition as an ideal recreational
attraction for paddlers and other visitors.
Method
This study explored the economic impact of paddling on the Kentucky River focusing in on
Pools 9 and 10. For this study, Clark, Fayette, and Madison counties in Kentucky have been
identified as the study area. The study area encapsulates the site of the activity or event being
studied and where related expenditures are most likely to occur. This study area specifically
encompasses the waterways in a 25-mile radius of Fort Boonesborough and nearby travel
corridors where persons are most likely to spend funds as result of paddling in the area.
There are no existing estimates of paddling use in this study area. For the present study,
visitation is estimated at 4,500 visits per year as of 2019. This visitation count was estimated
through parking lot counts, researcher observations, and triangulated with local canoe rental
ownership. This includes the option for one person to visit multiple times and assumes the
primary purpose is to paddle in the study area. Visitation estimates are based on conversations
with local paddling rental gear businesses, survey data, observations and car counts at parking
lots and slips, and conversations with local paddling experts. Approximately 80% of survey
respondents were nonlocals, therefore, for this study, the researchers estimated 3,600 paddlers to
be visitors (nonlocal paddlers) and thus included in the economic analysis.
Data Collection
The researchers collected data for this study via online and in-person surveys in 2019. It is
important to note this study is exploratory in nature. The researchers surveyed participants of two
major paddling events via email after the events took place. This was an effort to capture a
paddling special event user base. Additionally, researchers surveyed every paddler encountered
onsite from early spring to late fall in 2019. Due to the mixed methodology, the refusal rate
cannot be specific, and this study should be viewed as a convenience sample. The surveys
measured variables across the following categories: expenditures, river use patterns, other
recreation patterns, and demographics. Expenditure categories examine the respondents’
expenditures on their current trip to the study area. The survey measured data on trip spending in
lodging, food, travel, and retail purchases using established economic impact measures (White,
2017). These expenditure patterns are measured within the study area and outside the study area
but still in Kentucky, which is discussed further below. As part of estimating expenditures, the
survey included questions on group sizes. River use patterns examined what watercrafts (kayaks,
canoes, and stand up paddleboards or SUPs) the respondent used in the study area, which rivers
and creeks the respondent visited on their trip, and which physical locations the respondent
visited on their trip. The other recreation patterns measured used a list of common United States

Kentucky SHAPE Journal Vol. 58 No. 1 - 13 -
Forest Service activities and asked the respondent to indicate which (if any) activities the
respondent also engaged in while visiting the area to paddle. Finally, demographic variables
included sex, education, and annual personal income. The survey was delivered in parking lots,
river access points, and online. An online version of the survey was sent via emailed link to all
participants in the Bluegrass River Run (6-mile kayak/canoe event held each year May). In all,
196 persons participated in the survey. The researchers suggest treating this as a convenience
sample because no other studies or data collection efforts have yet estimated the population of
paddlers in this study area.
Analysis
The researchers cleaned the expenditures data to ensure a conservative economic impact
estimate. Data cleaning removes atypical (often disproportionately high) expenditures that may
overstate the overall pattern. First, 75 respondents were excluded because they completed less
than 10% of the survey (which includes answering no economic impact questions). Notably,
these cases were all from the online portion of the study. Next, three respondents (each
approximately staying 30 days) were excluded due to stays greater than three deviations above
the initial mean stay. Prior to the revision, the mean stay was 3.0 nights. After revisions, the
mean stay was 1.7 nights. One respondent, reporting expenditures for a group of eight, was
excluded as their group size could distort expenditure data.
Economic impact best practices for this type of study require focusing on the expenditures of
persons living outside the study area (Clark, Fayette, and Madison Counties). In the dataset,
attendees were sorted into locals (participants living in study area zip codes) and visitors
(participants living outside study area zip codes). Note that visitor expenditures are used to
estimate the economic impact described later in this report. Local expenditures, while important,
are not indicative of economic impact as their funds are already located within the local economy
and are redirected because of the activity being studied. Local expenditures are reported in this
analysis for informational purposes but are excluded from the economic impact estimates. In all,
34 respondents were excluded from economic impact modeling as they self-identified as
residents (see next paragraph for more details) based on their home zip code. No cases were
excluded for not including a zip code.
The researchers took the appropriate methods to create conservative mean expenditures for
visitors based on their self-reported expenditures. Prior to estimating means, all retail non-food
expenditures above $500 were recoded as missing as a precaution against overestimation. In this
study, two cases outside the study area were recoded as missing data as a result: one in
recreational retail ($1,200) and the other in general retail ($10,000). As retail expenditures may
also be used outside the area where they are purchased, only 1/5th of the value of these retail
non-food purchases (which included paddling purchases and general retail purchases) were
attributed to economic impact in the actual modeling. However, as paddling rentals are used
100% in the study area, these expenditures are modeled at the full value. Next, individual
respondent expenditures were adjusted for group size by dividing the respondent’s reported
expenditures by their reported group size (which includes the respondent). As a precautionary
effort to reduce overestimation, respondent expenditures reported higher than the third standard
deviation of their category mean were marked as missing data. This technique further addresses

Kentucky SHAPE Journal Vol. 58 No. 1 - 14 -
overestimating economic impact and provides reliable, conservative means for analysis
(Crompton, 2020). The result is separate expenditures stating average (or typical) expenditures
activity inside the study area and activity outside the study area but still in Kentucky. While both
are reported, only expenditures inside the study are modeled in the economic impact analysis.
Conservative visitation estimates and mean expenditures (having now accounted for group sizes
and points of influence) are built within the 2019 version of IMPLAN, an industry-leading
economic impact calculation system, to explore how visitor expenditures shape the study area
economy. IMPLAN uses input-output modeling to establish economic impact across three
measures: output, value added, and labor income. Local purchasing percentages are set at 100%
which is appropriate for this kind of study and commodities, such as gasoline, are modeled back
to their production sources for improved accuracy. The resulting analysis shows how visitor
paddler expenditures impact the study area economy at three stages (Crompton, 2010). Direct
effect is the economic result created by the money spent as a result of visitors being present in
the study area. This direct effect can generate further change in the local economy via indirect
and induced effects. Indirect effect is economic activity created when local businesses purchase
goods and services from other local industries as a result of the direct effect. Finally, induced
effect is the estimated expenditures by local households and employees because of the initial
direct impact. The economic impact measures in Table Five are also divided across three
categories. Labor income impact is measured by the estimated labor income created by the
economic activity in the region. Labor income impact is a conservative estimate of economic
impact and is the approach highlighted in this report. Value added indicates the true economic
wealth added to the local economy after subtracting the cost of inputs needed to conduct
everyday business. Value added includes expenditures in profit, employment compensation, and
taxes. Finally, output is value added plus total revenues and sales from economic activity
(Crompton, 2006).
Results
The analysis included all respondents (resident and visitors) in the study, including respondents
who may have been dropped as explained in the methodology section. In all, 51% of the sample
identified as being female. Although not included in the table, most of the sample identified as
being white. Most of the respondents held college degrees, with 33% holding a four-year degree
and 37% holding a graduate degree. Correspondingly, personal annual incomes are also most
concentrated in the $50-74K (28%) and greater than $99K (28%) categories. not summarized in
the table, the mean participant age in the sample was 48 (Table One).
Kentucky SHAPE Journal Vol. 58 No. 1 - 15 -
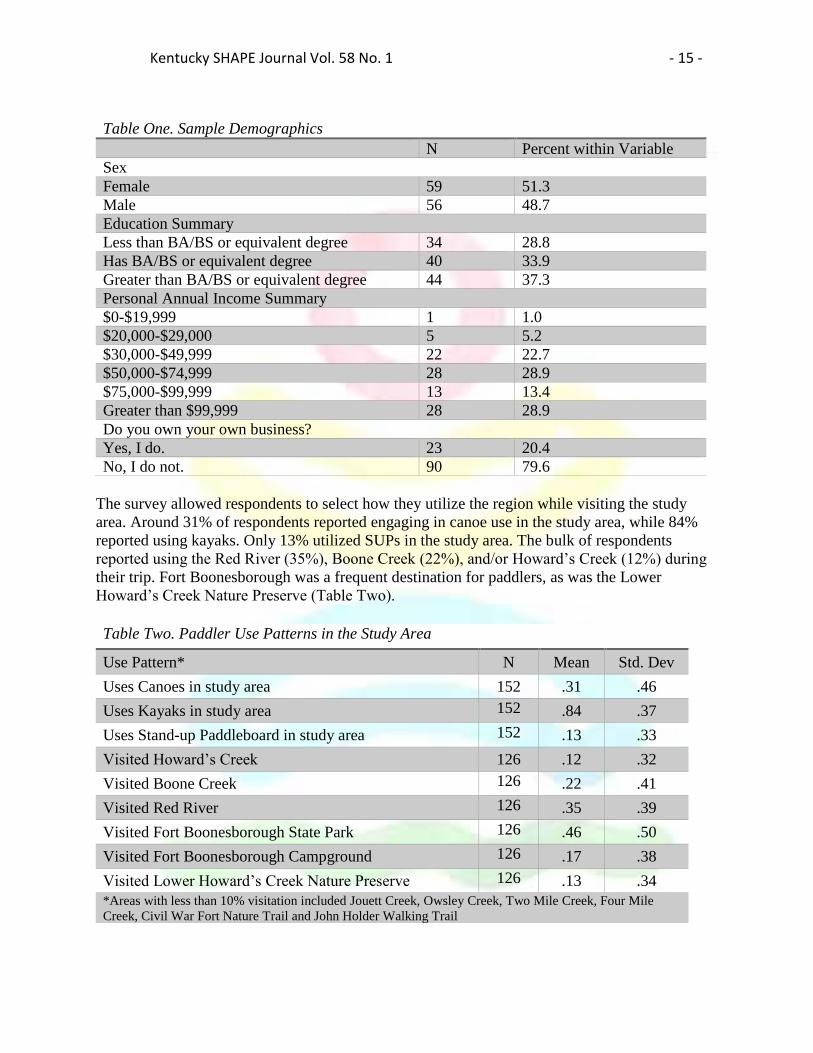
The survey allowed respondents to select how they utilize the region while visiting the study
area. Around 31% of respondents reported engaging in canoe use in the study area, while 84%
reported using kayaks. Only 13% utilized SUPs in the study area. The bulk of respondents
reported using the Red River (35%), Boone Creek (22%), and/or Howard’s Creek (12%) during
their trip. Fort Boonesborough was a frequent destination for paddlers, as was the Lower
Howard’s Creek Nature Preserve (Table Two).
Table One. Sample Demographics
N Percent within Variable
Sex
Female 59 51.3
Male 56 48.7
Education Summary
Less than BA/BS or equivalent degree 34 28.8
Has BA/BS or equivalent degree 40 33.9
Greater than BA/BS or equivalent degree 44 37.3
Personal Annual Income Summary
$0-$19,999 1 1.0
$20,000-$29,000 5 5.2
$30,000-$49,999 22 22.7
$50,000-$74,999 28 28.9
$75,000-$99,999 13 13.4
Greater than $99,999 28 28.9
Do you own your own business?
Yes, I do. 23 20.4
No, I do not. 90 79.6
Table Two. Paddler Use Patterns in the Study Area
Use Pattern* N Mean Std. Dev
Uses Canoes in study area 152 .31 .46
Uses Kayaks in study area 152 .84 .37
Uses Stand-up Paddleboard in study area 152 .13 .33
Visited Howard’s Creek 126 .12 .32
Visited Boone Creek 126 .22 .41
Visited Red River 126 .35 .39
Visited Fort Boonesborough State Park 126 .46 .50
Visited Fort Boonesborough Campground 126 .17 .38
Visited Lower Howard’s Creek Nature Preserve 126 .13 .34
*Areas with less than 10% visitation included Jouett Creek, Owsley Creek, Two Mile Creek, Four Mile
Creek, Civil War Fort Nature Trail and John Holder Walking Trail

Kentucky SHAPE Journal Vol. 58 No. 1 - 16 -
Table Three shows other activities in which paddlers engage in the study area during a typical
padding season. The most popular activity was hiking/walking, in which 59% of the sample
participated. Viewing natural features (35%), cookouts (30%), and camping (28% developed
site, 23% undeveloped site) were also popular. Several other types of outdoor recreation also had
frequent use, including backpacking, mountain biking, cycling, and climbing.
Table Four shows mean expenditures for visitors and residents because of visiting the study area
to engage in paddling. In all, visitors spent an estimated $46 per visit on local food, retail, and
gasoline expenditures. Visitors staying overnight add an estimated $12 when camping/RVing
and $84 when staying at a hotel, motel, or cabin. Visitor expenditures add an estimated $28 per
visit, with overnight visitors adding $9 in camping/RVing expenditures or $37 in hotel/motel
expenditures. Although not treated as true economic impact, residents do make important
expenditures in the study area as a result of paddling. In all, residents contribute an average of
$58 into the local economy because of their participation in paddling. Table Two includes
IMPLAN categories used when modelling visitor expenditures inside the study area.
Table Three. Other Activities Engaged in while Paddling in the Study Area
Activity* N Percent
Hikes/walk 126 59%
Viewing natural features 126 35%
Cookouts/eating outdoors 126 30%
Camping (developed site) 126 28%
Camping (primitive/undeveloped site) 126 23%
Relaxing on the lake 126 21%
Visiting historic sites 126 21%
Driving for pleasure 126 19%
Fishing 126 17%
Viewing wildlife 126 14%
Studying nature 126 13%
Backpacking 126 12%
Cycling 126 12%
Mountain biking 126 10%
Climbing 126 10%
*Activities engaged by less than 10% include gathering forest products, visiting local wineries, hunting, water
skiing, motorized trail activity, OHV/ATV use, horseback riding, and motorized trail activities
Table Four. Mean Expenditures by Category

Kentucky SHAPE Journal Vol. 58 No. 1 - 17 -
Table Five shows the economic impact of visitor paddlers visiting the study area to engage in
paddling. Based on the data collected, the research team estimated visitors (persons not living in
Clark, Fayette, or Madison Counties) annually spend an estimated $200,566 in the study area as
a result of participating in paddling. This estimate comes from visitor mean expenditures (see
Table Three) and visitor visitation figures (3,600 annual visits from persons living outside the
study area, 10% of which stayed in hotels/motels and 10% camped/used RVs). Focusing on labor
income (the most conservative measure of economic impact of the three listed), paddling in the
study area generated an estimated $96,441 in labor income for employees in the study area.
Labor income was largely located in full-service restaurants, general retail purchases, lodging,
and recreation gear purchases. Although not included in the table, visitor expenditures also
supported an estimated $6,773 in state/local taxes and another $4,700 in Federal taxes. Notably,
these returns effectively cost nothing beyond keeping the river accessible.
Table Five also shows projected growth in visitor paddling visitation through 2029. The growth
of outdoor recreation, which includes paddling, continues throughout the Commonwealth and
nation. Recent paddling events (such as the Bluegrass River Run) have increased attention on
this area, presenting the likelihood of increase in visitation to the area. For discussion sake, if
annual visitation could increase ten percent each year, labor income alone from the paddling
tourism could increase to nearly a quarter million by 2029. Again, this impact effectively costs
nothing, but could be fomented through increased visibility to the study area, advertising in the
paddling community, and ensuring the area remains open for paddling use.
Category (IMPLAN Study Area
Category)
Visitors
Inside Study
Area
Visitors
Outside Study area
but in Kentucky
Residents
Inside Study
Area
Lodging - Hotel/Motels/Cabins*
(499) $84.37 $37.75 NA
Lodging - Camping/RVs* (500) $12.36 $9.77 NA
Food - Full Service (501) $4.95 $6.20 $17.95
Food - Limited Service (502) $9.42 $.95 $5.46
Food – Groceries (400) $3.80 $8.44 $14.42
Food - Gas Stations (402) $1.92 $.74 $2.22
Gasoline (156) $12.58 $11.29 $14.78
Retail - Paddling Gear Purchases**
(404) $1.45 NA $1.35
Retail - Other Retail** (405) $1.92 NA $1.89
Paddling Gear Rentals (404) $10.00 NA NA
*Lodging –Motel expenditures applied to 10% of total participants in modelling. Camping expenditures
applied to 10% of total participants in modeling. Due to low n, differences in seasonal lodging costs, and
potential differences within lodging categories, lodging estimates are not adjusted for expenditures outside
three deviations in this study.
** As these purchases could be used elsewhere, only 1/5 of the value (.29 in paddling retail and .38 on other
retail) are modeled.

Kentucky SHAPE Journal Vol. 58 No. 1 - 18 -
Discussion, Conclusions, and Future Research
This study highlights several valuable discussion points regarding paddling activities in the study
area. First, this study demonstrated that paddling visitation to the area studied has a notable
economic impact on the region without presently requiring annual investments. As long as
paddlers continue to have safe access to the Kentucky River in this area, it is expected that this
community will continue to utilize this area of the river. To ensure this is the case, efforts should
be taken locally and at the state level to ensure that paddling locations on the Blue Water Trail
system be protected from activities which could limit access, discourage paddler use, or reduce
visitation.
Second, the findings of this study support further exploration of paddlers’ interests in natural
features and other forms of outdoor recreation and how these might be utilized to increase
paddling visitation. In Table Three, the bulk of the popular activities listed include some element
of interacting with natural features found in this region. Limiting development at these natural
features and promoting things like nature trails and conservation sites could help attract paddlers.
Likewise, other outdoor recreation forms (such as hiking) show potential value in finding multi-
use areas. Recent work has indicated that multi-use areas may find a way to bridge different
kinds of outdoor recreation communities while also supporting ongoing visitation (Sharp,
Bradley, & Maples, in press). As such, trails should be created that support things like mountain
biking or hiking activities. This would foster a multi-front outdoor recreation opportunity, which
could also create additional economic activity through non-paddling visitors.
Third, as the popularity of outdoor recreation increases across the nation, this region could see
future economic benefits by supporting paddling through maintaining access, advertising, and
small business programs (Winter, Selin, Cerveny, & Bricker, 2019). Maintaining access is key to
ongoing economic activity, as any particular aspect that either damages the Kentucky River,
makes paddling there less desirable (e.g. unsafe or unhealthy), or altogether stops paddling in the
area will curtail expenditures, job support, and taxes created by paddling visitors. By supporting
paddling access to the area, community organizations can also predictably advertise local
resources and natural features to the paddling community. Supporting ongoing annual paddling
festivals can help attract new visitors over time. Creating suitable parking areas can help
encourage paddling use while also directing their use to the desired areas. Unified local branding
can also help market paddling in this area. Local organizations should also consider programs
Table Five. Economic Impact Summary of Visitor Participation in Paddling in the Study Area
Impact Type Labor Income Value Added Output
Direct, 2019 $61,943 $90,254 $151,910
Indirect, 2019 $16,928 $29,546 $51,439
Induced, 2019 $17,569 $30,689 $52,801
Total Effect in 2019 $96,441 $150,489 $256,150
Total Effect in 2022 assuming 10% annual
visitation growth rate $130,496 $203,456 $343,477
Total Effect in 2029 assuming 10% annual
visitation growth rate $242,127 $377,280 $634,711

Kentucky SHAPE Journal Vol. 58 No. 1 - 19 -
that might encourage new businesses related to paddling to locate here and/or actively support
existing paddling businesses. This could include everything from tax opportunities to
media/advertising support.
Fourth, while not specifically examined in this study, local expenditures warrant consideration.
Resident expenditures on paddling are best described as redirected funds. This means that, while
the resident chose to spend funds on paddling, these funds are already located in the economy
and cannot be treated as new funds being introduced into the economy. However, residents
nonetheless remain an important part of the local economy. Recent work finds that outdoor
recreation users have strong ties to the areas where they choose to recreate (Rickly, 2017). These
attachments make them more inclined to relocate and live in these areas. When this occurs, they
purchase homes, pay taxes, and establish regular economic expenditure patterns in the area.
Moreover, outdoor recreation participants often have high rates of business ownership, meaning
that if they were to leave, they could take their businesses with them.
This study does have certain limitations common to economic impact studies. First, visitation
patterns and mean expenditures can vary from year to year due to issues like weather or
unexpected closures (such as the 2020 Covid-related state park closures). Second, this study
relies on respondents to represent their expenditure patterns. Users can forget expenditures and
inadvertently misstate expenditures in surveys. However, the methodological approach used in
this study limits overestimation. Third, expenditure and use patterns used in this study are not
necessarily representative of paddlers in other areas. Fourth, the researchers assume respondents’
primary purpose of their trip to the study area is to participate in paddling. This does not exclude
those engaging in other activities while there but posits that participating in paddling (in any
form) is the primary purpose for visiting the region.
This study supports the need for additional research on paddling in this region and beyond. This
includes generating estimates of economic impact at additional areas along the Kentucky River.
Marketing and economic development researchers could also create clear guidelines for growing
paddling areas in a sustainable fashion.

Kentucky SHAPE Journal Vol. 58 No. 1 - 20 -
References
Crane, M. (2005). The economic impacts of whitewater boating on the West River: Jamaica,
Vermont. https://www.americanwhitewater.org/content/Document/view/documentid/705
Colorado River Outfitters Association (CROA). (2016). Commercial river use in the State of
Colorado: 1988-2016.
https://www.americanwhitewater.org/content/Document/view/documentid/1705
Crompton, J.L. (2006), “Economic impact studies: instruments for political shenanigans?”,
Journal of Travel Research, Vol. 45 No. 1, pp. 67-82.
Crompton, J.L. (2010), Measuring the Economic Impact of Park and Recreation Services,
National Recreation and Park Association, Ashburn, VA.
Enoch, H. (n.d.). Kentucky River blue water trail guide: Clark County. Self-published.
Huron River Watershed Council (HRWC). (2016). A summary of the economic impact of the
Huron River. https://www.hrwc.org/wp-content/uploads/2017/10/Summary-Huron-River-
Economic-Impact-web.pdf
ICF Macro, INC (ICFM). (2012). Pennsylvania recreational water trails economic impact study:
A four-trail case study. https://pecpa.org/wp-content/uploads/Water-Trails-Economic-
Impact-Study.pdf
Kentucky river (n.d.) In Wikipedia. Retrieved August 18, 2020, from
https://en.wikipedia.org/wiki/Kentucky_River KY.gov. (ND). Blue water trails. https://fw.ky.gov/Education/Pages/Blue-Water-Trails.aspx
Maples, J. N., Sharp, R.L., Clark, B., Gerlaugh, K. & Gillespie, B. (2017). Climbing out of
poverty: The economic impact of rock climbing in Eastern Kentucky’s Red River Gorge.
Journal of Appalachian Studies 23(1): 53-71.
Moore, R. L. & Siderelis, C. (2003). Use and economic importance of the wild and scenic
Chattooga River.
https://www.americanwhitewater.org/content/Document/view/documentid/271
O’Dell, G. A. (2017). Springs and the settlement of pioneer Kentucky. In Brian D. Lee, Daniel. I
Carey, & Alice Jones (Eds). Water in Kentucky: Natural history, communities, and
conservation. Lexington, Kentucky: The University Press of Kentucky.
Pollock, N., Chase, L., Ginger, C. & Kolodinsky, J. (2007). The Northern Forest Canoe Trail:
Economic impacts and implications for sustainable community development. Burlington,
VT: University of Vermont Tourism Data Center.
https://www.uvm.edu/sites/default/files/Rubenstein-School-of-Environment-and-Natural-
Resources/NFCT_Final_Report.pdf
Power, T. M. (1996). Lost Landscapes and Failed Economies: The search for a value of place.
Island Press: Washington, D.C.
Rickly, J. M. (2017). I'm a Red River local: Rock climbing mobilities and community
hospitalities. Tourist Studies 17(1), 54-74.
Sharp, R. L., Bradley, M. J. & and Maples, J. N. (in press). Who has the right-of-way? Equity
and economics of off-highway vehicle use in Eastern Kentucky. Journal of Appalachian
Studies.
Thomas, G. & Thomas, J. (2000). Moving water paddling as critical outdoor education. Journal
of Outdoor and Environmental Education 5(47054).

Kentucky SHAPE Journal Vol. 58 No. 1 - 21 -
Whisman, S. A., Hollenhorst, S. J. & Jones, C. D. (1996). A summary of economic impacts of
commercial whitewater rafting in West Virginia.
https://www.americanwhitewater.org/content/Document/view/documentid/293
Warren, N. (2015). An economic argument for water trails. River Management Society.
https://rms.memberclicks.net/assets/Chapters/Midwest/economicargumentforwatertrails%
203.pdf
White, E. M. (2017). Spending patterns of outdoor recreation visitors to national forests.
https://www.fs.fed.us/pnw/pubs/pnw_gtr961.pdf
Winter, P. L., Selin, S., Cerveny, L., & Bricker, K. (2019). Outdoor recreation, nature-based
tourism, and sustainability. Sustainability 12 (81). Retrieved August 18, 2020 from: https://www.mdpi.com/2071-1050/12/1/81

Kentucky SHAPE Journal Vol. 58 No. 1 - 22 -
(Peer Reviewed Article)
Transformational Leadership in Club Sports
Shelby Hutchens, University of Arkansas
Sarah Stokowski, Clemson University
Kara Lasater, University of Arkansas
Steve Dittmore, University of Arkansas
Abstract
Increased spending in Campus Recreation and decreases in higher education funding have
created a need for Campus Recreation programs to promote their ability to develop students into
successful leaders, but little is known regarding how such student development is fostered
(Forrester, 2014; Mitchell et al., 2019). Club Sport programs are perceived to provide the
greatest benefits among all Campus Recreation offerings and contribute to the development of
leadership characteristics (Dugan et al., 2015). Transformational Leadership (TFL) is one of the
most acclaimed leadership theories associated with organizational success (Wang et al., 2011)
and the development of organization leaders (Gassman et al., 2014). The purpose of this study is
to determine whether Club Sports Presidents are perceived to exhibit Transformational
Leadership characteristics. Results indicated that most Club Sport members perceived Club
Sports Presidents to exhibit characteristics of Transformational Leadership. Findings suggest that
Club Sports programs have a unique and significant impact on the TFL skill development of
those who participate.
Introduction
Campus Recreation offers “services, programs, equipment, facilities, and staff that provide
recreation opportunities for the entire campus community” (NIRSA, 2018, para. 1). Further,
Campus Recreation offers numerous activities including intramural and club sports, cardio,
weight training, wellness programs, aquatics, and even First Aid and Cardiopulmonary
Resuscitation (CPR) classes (Forrester, 2014). More than 60% of students indicate that Campus
Recreation and its programs were important factors for choosing their ideal learning institution
and remaining enrolled at the institution (Forrester, 2014). Students who engage in Campus
Recreation programs exhibit better time management skills, interpersonal skills, and especially
leadership skills when compared to students involved in other campus programming (Forrester,
2014; Warner & Dixon, 2013).
Campus Recreation and its programs also extend the mission of higher education beyond the
classroom by developing leadership skills that contribute to the occupational success of its
participants (McDowell et al., 2016). Dugan et al. (2015) suggested that Club Sports programs
play a unique role in the development of leadership skills to an estimated two million student-
athletes nationwide (Lifschutz, 2012). However, the type of leadership fostered within Club
Sports has not yet been investigated (Peachey et al., 2015; Mitchell et al., 2019). To better

Kentucky SHAPE Journal Vol. 58 No. 1 - 23 -
understand the nature of Club Sport student leadership, this study investigated the leadership
characteristics of Club Sports Presidents.
Literature Review
Characteristics of Club Sports
A Club Sport is defined as a group of students that is voluntarily organized to further their
common interest in an activity through participation and competition (Lifschutz, 2012). Club
Sports can range from more traditional sports (e.g., lacrosse, soccer, rugby, volleyball) to more
niche sports (e.g., bass fishing, ultimate frisbee, quidditch, ballroom dance, rodeo). The
foundation of Club Sports programs is often clubs not governed by the National Collegiate
Athletic Association (NCAA) such as Bass Fishing, Ultimate Frisbee, and Rugby (Dugan et al.,
2015). Such niche clubs like these stand out due to their uniqueness and ability to attract specific
populations that otherwise might not associate with Campus Recreation programs (Dugan et al.,
2015).
Club Sports are unique from Intramural Sports and other Campus Recreation programs in that
they practice regularly, host games, and compete in national competitions (Lifschutz, 2012).
Intramural sports are more recreation-oriented, and intramural teams do not interact year-round
as Club Sports do (Lifschutz, 2012). Club Sports often serve as the competitive median between
intramural sports and varsity sports (Lifschutz, 2012). The recurrence of practice and year-round
involvement allows for relationships to be established among club sports members, thus filling
the need for the camaraderie of former high school athletes and increasing their sense of
belonging to the university (Reynolds, 2016). In addition to the emphasis on continuing sport
participation, Club Sports offer students a unique opportunity to develop skills beneficial to their
lives after college.
Each Club operates as a small business. They have their budget, plan travel, and fundraise to
support their travel and equipment expenses. The clubs elect a group of officers usually a
President, Vice-President, Treasurer, and Secretary every academic year. This group of officers
bears the burden for planning travel, meeting with national governing bodies of their sport,
fundraising, and maintaining a positive relationship with Campus Recreation administration
(Dugan et al., 2015; Flosdorf et al., 2016; Lifschutz, 2012).
Club Sport officers assume a significant amount of responsibility when they take their positions
within the club. Officers must balance academic and social responsibilities, and (often) part-time
jobs, and as a result are often at risk for high levels of stress (Bryant & Clement, 2015). Each
clubs’ officers interact on a weekly or even daily basis with Campus Recreation administration
and are the faces of each club. Club Sport officers receive credit when a club does well and takes
the blame when the club performs poorly. Thus, serving in a leadership role within club sports is
often a beneficial learning experience for club officers, allowing for students to develop
leadership skills within Campus Recreation (Dugan et al., 2015; Flosdorf et al., 2016).
Outcomes of Club Sport Participation

Kentucky SHAPE Journal Vol. 58 No. 1 - 24 -
Assessments of Club Sports have demonstrated that students who participate in Club Sports are
subjected to experiential learning, which enhances what is taught in the classroom and thereby
furthers the mission of higher education (Dugan et al., 2015; Flosdorf et al., 2016; Weaver et al.,
2014). The most commonly identified outcomes of Club Sport participation are leadership,
communication, conflict resolution, and time management (Lifschutz, 2012; Weaver et al.,
2017). Student leadership is often identified as the biggest area of growth within Club Sports
officers (Dugan et al., 2015; Hardin, 2015). However, we do not know what leadership skills are
developed through participation in club sports, but there is evidence to suggest that the volunteer
nature of the clubs may necessitate the use of Transformational Leadership (TFL) (Posner,
2015).
Transformational Leadership (TFL)
Every organization regardless of industry establishes goals that orient group members towards
certain tasks and responsibilities. It is the organization's leader’s responsibility to establish a
strategy for achieving such goals (Odumeru & Ogbonna, 2013). Different types of organizations
lend themselves to certain leadership strategies. Organizations with the ability to provide
extrinsic incentives (e.g., pay bonuses) usually find transactional leadership to be effective
(Odumeru & Ogbonna, 2013) while those that cannot (e.g., Club Sports) usually find TFL to be
beneficial (Posner, 2015).
The differences in the abilities of organizations to incentivize group members have a significant
impact on the reasons that individuals join. The lack of extrinsic incentives offered by
organizations like charities and Club Sports suggests that members join because the organization
satisfies an intrinsic need (e.g. competence, relatedness, purpose) (Smith et al., 2017). TFL
uniquely appeals to the intrinsic needs of group members through its emphasis on the importance
of a leader who encourages others, provides support and recognition, gets people to look beyond
self-interest, and inspires people to reach for the improbable (Bass, 1985). Transformational
leaders build trust-based relationships with their members, creating a unifying culture that allows
leaders to mobilize their organization in the direction they see fit (Bass, 1985). To further
delineate TFL, Bass (1985) identified seven competencies that characterize the specific
behaviors of transformational leaders.
The first component of TFL is Vision (Bass, 1985). Transformational leaders should
conceptualize and deliver a vision for the organization that is motivating to the members of the
club and delivers that message clearly and effectively (Bass, 1985). The second component is
Member Development. It emphasizes that leaders should attempt to help members better
themselves through organizational activities (Bass, 1985). The third component of TFL is
Supportive Leadership, which builds upon the focus on development by noting that leaders
should encourage development by exhibiting verbal and nonverbal support for group members
(Bass, 1985). The fourth component is Empowerment. Empowerment refers to the importance of
giving group members a say in the on-goings of the organization (Carless et al., 2000). Providing
subordinates with a voice demonstrates that the leader cares about their perspective and values
their input, which contributes to the establishment of trust between leader and follower (Carless

Kentucky SHAPE Journal Vol. 58 No. 1 - 25 -
et al., 2000). The fifth component is Innovative Thinking, which notes that effective leaders
often must use unconventional strategies to achieve their vision (Bass, 1985; Carless et al.,
2000). Such non-conventional strategies should be encouraged by group leaders, and mistakes
should be treated as a learning opportunity (Carless et al., 2000). The sixth component is
described as Leading by Example which provides subordinates with a model to follow, and by
acting in the way that a leader wants all club members to act can generate the outcomes the
leader strives for (Carless et al., 2000). Finally, the seventh component is described as
Charismatic Leadership – a unique ability of a leader to draw others to them and inspire the
heightened pursuit of organizational goals (Bass, 1985; Carless et al., 2000).
TFL is one of the most popular and empirically supported leadership theories in the current
organizational psychology literature (Wang et al., 2011). TFL has unique outcomes and has
proven to be more effective than other leadership styles in various settings (Peachey et al., 2015).
In business, it has been associated with direct and indirect effects on improving corporate social
responsibility (Robertson, 2018), team goal orientation (Chi & Huang, 2014), problem solving-
communication skills (Lehmann-Willenbrock et al., 2015), and organizational performance
(Boiral et al., 2015; Wang et al., 2011; Xenikou & Simosi, 2006). TFL has also been assessed in
Campus Recreation administration (Weese, 1995), but has not been rigorously studied within
Club Sports specifically.
Student leadership positions like those found in Club Sports often support the development of
TFL characteristics (Gassman et al., 2014; Posner, 2015; Smith et al., 2013; Wang et al., 2011).
Club Sports are known to contribute to the leadership development of club officers, but the
specific skills developed remained unstudied until now (Dugan et al., 2015; Flosdorf et al.,
2016). The purpose of this study is to determine if Club Sports Presidents exhibit
Transformational Leadership characteristics. The authors proposed two specific research
questions.
.
RQ1: To what degree is TFL exhibited by Club Sports Presidents?
RQ2: Does experience in a Club Sports leadership position mediate the degree of TFL exhibited?
Methodology
Sampling
A convenience sample was collected by retrieving all emails of Club Sport members from a
Southeastern Conference institution that was home to 27 clubs. A Club Sport member was
operationally defined as an individual who a) completed a Campus Recreation liability waiver
and b) paid dues to his or her club. There were a total of 475 Club Sport members that have
completed a waiver and paid dues (27 Presidents, 448 club members).
An electronic survey was sent out via email. Responses were collected during the spring
semester. Club members received reminder emails weekly for one month to encourage
participation.
Instrumentation

Kentucky SHAPE Journal Vol. 58 No. 1 - 26 -
The Global Transformational Leadership Survey (GTL) is a quick and effective seven-item, five-
point Likert scale peer assessment of the seven TFL characteristics as described by Carless et al.
(2000) (see Appendix A). It has been used in business, sport, and other fields while
demonstrating acceptable validity and reliability (Cronbach’s alpha (α) = .93) (Carless et al.,
2000; Overstreet et al., 2013). Factor loadings and confirmatory factor analysis of the GTL
indicate that each of the seven items strongly correlates with their associated TFL characteristic
(Overstreet et al., 2013). Club members utilized the GTL to evaluate the TFL characteristics of
their club’s president. This unique method of assessment grants us greater insight into more than
just how club presidents view themselves, as we would see with self-assessments and thus more
usefully assesses the degree to which each president exhibits TFL behaviors.
The GTL was be prefaced by a short survey of demographic information that includes each club
members age, gender, year classification, number of years in Club Sports, whether or not they
are an officer and if so which position and for how long, and what club each member primarily
belongs to. The independent variables in question here are simply the number of semesters that a
Club President has served in their role.
Data Collection & Analysis
GTL scores for each Club President were assessed via the peer-ratings of the GTL. Descriptive
statistics for the samples GTL score and each item were evaluated to determine the degree to
which club presidents exhibited TFL characteristics (Table 2). To determine whether the length
of leadership tenure impacts TFL development, the number of semesters Presidents served in
their role was added to the number of semesters they had held other positions within their club
(0-11+ semesters each). Each Club President was then placed in a “Longer Leadership Tenure”
(≥6 Semesters) and “Shorter Leadership Tenure” (≤5 Semesters) group via mean-split procedure.
An Independent Sample T-test was then used to compare GTL scores with Leadership Tenure
Length.
Results
The survey was sent to 475 members of a Club Sports program. There were 176 responses
including 27 Club Presidents and 149 club members (N=176, 37.05% response rate). See Table 1
for demographic characteristics. Twenty-seven 2017-2018 Club Presidents completed the 11-
item demographic survey. Of the 27 Club Presidents, 21 held leadership positions in their club
before becoming president, and 18 were involved in other organizations on campus. About 5.4%
of Club Presidents held leadership roles in organizations outside of Club Sports. Each President
had served as President for their club an average of 2.63 semesters. Club Presidents represented
21 different degree programs. Almost half (47.8%) of club members were involved in other
student organizations as well. There were on average 5.52 responses per club.
Table 1. Demographic Characteristics
Club Presidents
(n=27)
Club Members
(n=149)
Female 9 60
Kentucky SHAPE Journal Vol. 58 No. 1 - 27 -
Male 18 89
Average Age 20.96 (SD=.98) 20.78 (SD=5.70)
Freshman 0 38 (25.50%)
Sophomore 2 (7.41%) 41 (27.52%
Junior 12 (44.44%) 35 (23.49%)
Senior 12 (44.44%) 32 (21.48%)
Graduate Student 1 (3.70%) 3 (2.01%)
Semesters in Club
Sports 6.19 (SD=1.59) 3.42 (SD=1.96)
GTL Scores
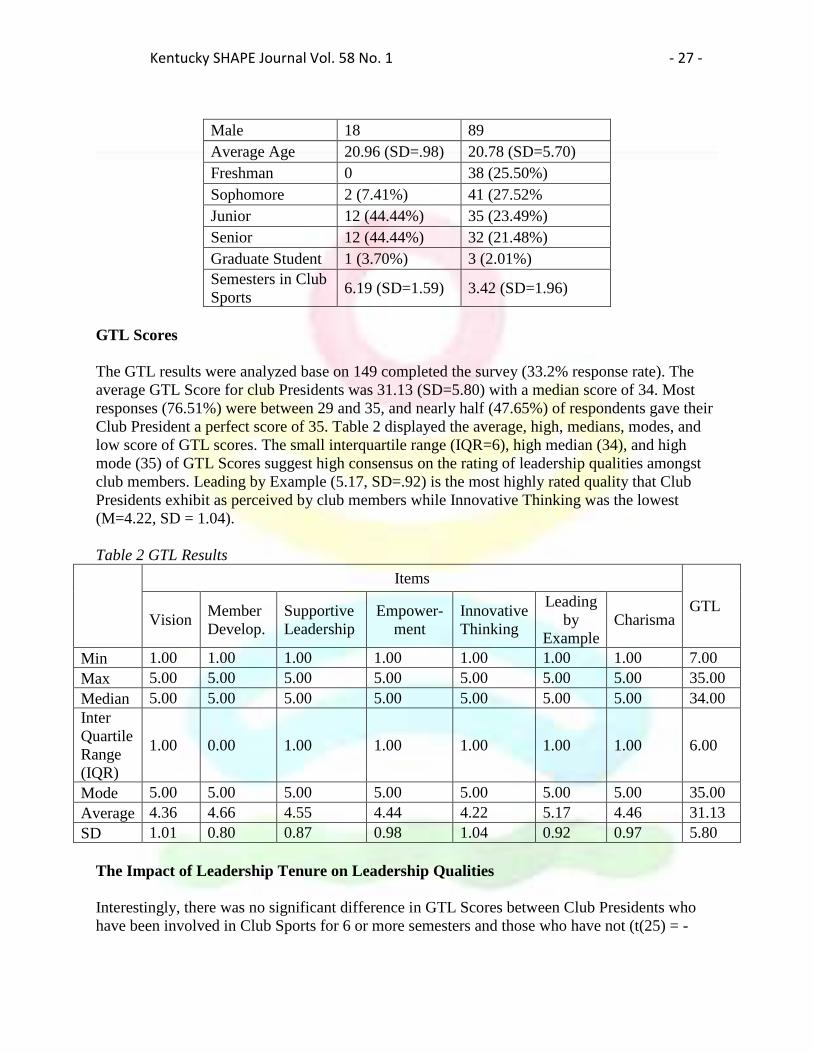
The GTL results were analyzed base on 149 completed the survey (33.2% response rate). The
average GTL Score for club Presidents was 31.13 (SD=5.80) with a median score of 34. Most
responses (76.51%) were between 29 and 35, and nearly half (47.65%) of respondents gave their
Club President a perfect score of 35. Table 2 displayed the average, high, medians, modes, and
low score of GTL scores. The small interquartile range (IQR=6), high median (34), and high
mode (35) of GTL Scores suggest high consensus on the rating of leadership qualities amongst
club members. Leading by Example (5.17, SD=.92) is the most highly rated quality that Club
Presidents exhibit as perceived by club members while Innovative Thinking was the lowest
(M=4.22, SD = 1.04).
Table 2 GTL Results
Items
GTL Vision
Member
Develop.
Supportive
Leadership
Empower-
ment
Innovative
Thinking
Leading
by
Example
Charisma
Min 1.00 1.00 1.00 1.00 1.00 1.00 1.00 7.00
Max 5.00 5.00 5.00 5.00 5.00 5.00 5.00 35.00
Median 5.00 5.00 5.00 5.00 5.00 5.00 5.00 34.00
Inter
Quartile
Range
(IQR)
1.00 0.00 1.00 1.00 1.00 1.00 1.00 6.00
Mode 5.00 5.00 5.00 5.00 5.00 5.00 5.00 35.00
Average 4.36 4.66 4.55 4.44 4.22 5.17 4.46 31.13
SD 1.01 0.80 0.87 0.98 1.04 0.92 0.97 5.80
The Impact of Leadership Tenure on Leadership Qualities
Interestingly, there was no significant difference in GTL Scores between Club Presidents who
have been involved in Club Sports for 6 or more semesters and those who have not (t(25) = -
Kentucky SHAPE Journal Vol. 58 No. 1 - 28 -
.586, p=.563). The Long Tenure (n=15) group had a lower average score (30.83, SD = 3.42) than
the Short Tenure (n=12) group (M=31.50, SD=2.30).
Discussion
The purpose of this research within the understudied world of Club Sports programs was to
determine the degree to which Club Sports Presidents exhibit TFL characteristics. The high
degree of consensus (Mdn = 34, Mode = 35, IQR = 6) amongst club members with regard to the
TFL characteristics of their Club Presidents demonstrates that Club Sports Presidents are
perceived to exude TFL behaviors and characteristics which supports the findings of Hardin
(2015), Weese (1995), Dugan et al. (2015), and Lower et al. (2013) among others. Like Hardin
(2015), the high degree of consensus exhibited by the mode (35) and small interquartile range (6)
amongst club members about the behaviors of their club presidents provides more evidence for
the notion that Campus Recreation promotes the development of student leadership, and more
specifically as Weese (1995) found, campus recreation may lend itself to the usage of TFL. More
specifically, these findings support the notion that Club Sports programs may have a unique
ability to create and develop leadership skills(Dugan et al., 2015) – thereby also providing
support for the notion that club sports may be unique in that way as many other campus
recreation programs do not emphasize holistic development like Club Sports programs do
(Lower et al., 2013). The high degree of consensus amongst club members also suggests that
most members feel that their intrinsic needs are being met, as TFL is designed to (Bass, 1985;
Posner, 2015). By meeting the intrinsic needs of their members, club presidents can increase
organizational commitment (Smith et al., 2017), group goal orientation (Chi & Huang, 2014),
and ultimately group performance (Boiral et al., 2015; Wang et al., 2011).
Contrary to the work of Gassman et al. (2014), there was no statistical difference identified
between those who had a long tenure of leadership and those who did not. There are two notable
explanations for this lack of significance. One possible explanation is that officers experience
burnout throughout their tenure as Club President. As Presidents matriculate while remaining in
a leadership role, they may place less emphasis on important TFL behaviors than they once did.
Another explanation could be that many club members join Club Sports because participation in
Club Sports satisfies the intrinsic needs of that member (Smith et al., 2017). Thus, the nature of
the organization itself and group membership may naturally require a high level of TFL
behaviors from Club Presidents (Dwyer et al., 2013; Odumeru & Ogbonna, 2013; Parker et al.,
2010; Rosch, 2014).
Members’ motivation and leadership development
Individuals join organizations of all types (i.e. non-profits, charities, corporations, educational
institutions, club sports) because they satisfy a motivational need for an individual (Salary,
2019). Generally, there are two types of motivational needs: intrinsic and extrinsic (Deci &
Ryan, 2000). Intrinsic needs motivate pursuits are challenging, interesting, or personally
rewarding to an individual. People engage with intrinsically motivated activities because they
enjoy them – not because of a promised reward. Extrinsic needs motivate instrumental behavior
that promises external rewards, such as payment for services performed (Deci et al., 2017; Deci
Kentucky SHAPE Journal Vol. 58 No. 1 - 29 -
& Ryan, 2000). Volunteer-membership based organizations inherently meet the intrinsic needs
of those who join (Smith et al., 2017). Alternatively, places of employment can provide external
incentives like payment for hours worked, and motivations for joining such organizations often
include a description of such extrinsic needs (Deci et al., 2017).
Club Sports specialize in meeting the intrinsic needs of college students including personal
enjoyment, affiliation, personal achievement, and fitness (Houselog, 2014; Smith, 2008). TFL
specializes in facilitating the satisfaction of such intrinsic needs (Bass, 1990). Thus, the sole
emphasis on intrinsic need fulfillment for those who join organizations including club presidents
and club members naturally facilitates high levels of TFL. TFL skills may be fostered by the
environment itself, hence the lack of difference between Club Presidents who have served in a
leadership role for a long period of time, and those who have not (Bass, 1990; Smith et al.,
2017).
Practical Implications and Conclusions
Budget allocations to Campus Recreation and its programs have decreased in recent years, which
has forced Campus Recreation professionals to seek ways to prove their value on campus
(Mitchell et al., 2019). This study provides Campus Recreation professionals with the type of
empirical support they need by illuminating the leadership practices and skills developed within
Club Sports programs. TFL and its associated behaviors are in high demand in the workplace,
which makes the experiential learning that occurs within Club Sports incredibly valuable to
students in their lives after college (Greenbank, 2015; Posner, 2015; Smith et al., 2013; Wang et
al., 2011). Such experiential learning and development are central to the mission of higher
education and by allocating funding to Campus Recreation and Club Sports programs,
institutions of higher education can provide greater opportunities for students to grow and apply
didactic lessons outside the classroom (Dugan et al., 2015).
Secondarily, this study like Reynolds (2016), provides more theoretical evidence that Club
Sports positively contributes to the retention of students. As noted earlier, TFL specializes in
meeting the intrinsic needs of group members. Intrinsic need fulfillment and organizational
commitment are positively correlated (Smith et al., 2017). Organizational commitment is
inversely correlated with intent to leave, and positively correlated with retention, thus, the
presence of TFL within Club Sports may be one of many reasons that students who participate in
Campus Recreation programs typically have a higher retention rate than the rest of the student
body (Forrester, 2014; Reynolds, 2016). Campus Recreation professionals should also consider
the potential of burnout with regard to the additional stress and responsibilities placed upon Club
Presidents (Bryant & Clement, 2015; Flosdorf et al., 2016). Student development workshops that
include an emphasis on time management, delegation, and mental health may also prove
beneficial in terms of club officer performance and wellbeing.
Limitations & Delimitations
This study, though reasonably robust in sample size, was limited to Club Sports teams at one
institution. The values that the Club Sports program promotes are likely to be the ones that show

Kentucky SHAPE Journal Vol. 58 No. 1 - 30 -
themselves in data such as TFL characteristics. By gathering data from more than one institution,
the data may be more generalizable, and more significant differences may be observed.
To reduce the bias that may occur during in-person evaluations as observed by Treischl and
Wolbring (2017), the GTL was delivered via email. Research on college students and surveys
suggests that emailed surveys have a lower response rate than in-person assessment. Future
studies may consider other surveying methods, though the response rate within this study was
not necessarily a limiting factor (37.05% response rate).
Finally, the GTL is a Likert Scale type instrument and is thereby subject to some limitations.
While mean scores are usually weak for Likert scales, the seven-item GTL creates a greater
possible dispersion that is statistically stronger than most Likert scale surveys (Carless et al.,
2000). The lack of a control group for comparison renders the mean scores less informative than
they would otherwise be. To counter this potential limitation, other measures of central tendency
were included to provide readers with a more holistic understanding of the perceptions regarding
TFL behaviors of Club Presidents. By including the median, mode, and IQR, the degree of
consensus amongst club members is more tangible, further supporting the claim that club
presidents were perceived to exhibit TFL characteristics.
Future Research
This study is only a starting point regarding the organizational psychology and leadership of
Club Sports programs but does begin to paint a picture of the type of leaders that Club Sports
programs develop. To better identify the unique nature of Club Sports leadership, future studies
should include a) multiple Club Sports programs from different universities and b) other
Registered Student Organizations (RSOs) and student groups. In light of the somewhat
surprising results of the second research question, future studies should compare the leadership
styles present in Club Sports with organizations on campus that offer extrinsic incentives for
membership. To address burnout and its impact on leadership change, longitudinal studies should
be implemented to track changes in TFL behaviors of Club Presidents over time, as stress and
burnout are common amongst student leaders (Bryant & Clement, 2015; Flosdorf et al., 2016).
Additionally, future research should integrate measures of other leadership theories to determine
if TFL is the most prevalent leadership style within Club Sports. Observational studies could be
insightful and illuminate exactly how Club Presidents exhibit TFL characteristics. Administering
self-assessments of TFL to Club Presidents in addition to the peer assessment could provide
researchers with an idea of the degree to which student leaders are cognizant of their leadership
behaviors. The findings of such a study may speak more to the nature of leadership within Club
Sports. The degree to which TFL predicts organizational commitment, group goal orientation,
and group performance within Club Sports should be more specifically investigated as well to
more solidly support the value of Campus Recreation in higher education.
Conclusions
This study provides empirical support for the value of Club Sports programs as Campus
Recreation professionals seek new ways to prove their value on college campuses nationwide.
Considering an estimated two million students participate in Club Sports nationally (Weaver et

Kentucky SHAPE Journal Vol. 58 No. 1 - 31 -
al., 2017), the present study assists in understanding the leadership skills that can potentially be
gained through Club Sport participation. In this study, a large majority of club sport members
perceived their Club President to exhibit TFL characteristics which are known to be extremely
beneficial and highly desirable in a variety of industries (Greenbank, 2015). Club Sports
programs may be a unique setting in which students can develop TFL leadership characteristics
that serve students long after graduation (Chan & Mak, 2014; Posner, 2015). Armed with the
empirical support provided by this study, Club Sports programs, and Campus Recreation
professionals can more confidently make the case that they do significantly contribute to the
mission of higher education through the provision of experiential learning and leadership
development opportunities for college students (Jackson, 2018; Smith et al., 2013; Wang et al.,
2011).

Kentucky SHAPE Journal Vol. 58 No. 1 - 32 -
References
Bass, B. M. (1985). Leadership and performance beyond expectations. New York: Free Press.
Bass, B. M. (1990). From transactional to transformational leadership: Learning to share the
vision. Organizational Dynamics, 18(3), 19-31.
Boiral, O., Talbot, D., & Paille, P. (2015). Leading by example: A model of organizational
citizenship behavior for the environment. Business Strategy and the Environment, 24,
532–550.
Bryant, L. A., & Clement, D., (2015). Coping strategies of female peer leaders participating in
college club sports. Recreational Sports Journal, 39(1), 16-26. doi:10.1123/rsj.2013-0032
Carless, S. A., Wearing, A. J., & Mann, L. (2000). A short measure of transformational
leadership. Journal of Business and Psychology, 14(3), 389-405.
doi:10.1023/A:1022991115523
Chan, S., & Mak, W. M. (2014). Transformational Leadership, pride in being a follower of the
leader, and organizational commitment. Leadership & Organization Development
Journal, 35(8), 674-690. doi:10.1108/LODJ-12-09-0076
Chi, N. W., & Huang, J. C. (2014). Mechanisms linking transformational leadership and team
performance: The mediating roles of team goal orientation and group affective tone.
Group & Organization Management, 39(3), 300-325.
Deci, E. L., Olafsen, A. H., & Ryan, R. M. (2017). Self-determination theory in work
organizations: The state of a science. Annual Review of Organizational Psychology and
Organizational Behavior, 4(1), 19-43. doi:10.1146/annurev-orgpsych-032516-113108
Deci, E. & Ryan, R. (2000). The "What" and "Why" of goal pursuits: Human needs and the self-
determination of behavior. Psychological Inquiry. 11. 227-268.
Dugan, J. P., Turman, N. T., Torrez, M. A., & School of Education, Loyola University Chicago.
(2015). When recreation is more than just sport: Advancing the leadership development
of students in intramurals and club sports. Recreational Sports Journal, 39(1), 37-48.
doi:10.1123/rsj.2015-0008
Dwyer, P. C., Bono, J. E., Snyder, M., Nov, O., & Berson, Y. (2013). Sources of volunteer
motivation: Transformational leadership and personal motives influence volunteer
outcomes: Sources of volunteer motivation. Nonprofit Management and Leadership,
24(2), 181-205. doi:10.1002/nml.21084
Flosdorf, M. L., Carr, B. H., Carr, J. W., & Pate, J. R. (2016). An exploration of the sport club
president's experience. Recreational Sports Journal, 40(2), 106-119.
Forrester, S. (2014). The benefits of Campus Recreation. Corvallis, OR: NIRSA.
Gassman, J., Reed, D., & Widner, A. (2014). Student association activities contribute to
leadership development of students in nonprofit management and leadership. The Journal
of Nonprofit Education and Leadership, 4(2) Retrieved from http://0-
search.proquest.com.library.uark.edu/docview/1730202527?accountid=8361
Hardin, S. E. (2015). Leadership Assessment in Campus Recreation and Athletics. New
Directions For Student Leadership, (147), 99-108.
Houselog, R. T, (2014). Understanding motivating factors for college students’ involvement in
club sports. Graduate Research Papers. 40.
Lehmann-Willenbrock, N., Meinecke, A. L., Rowold, J., & Kauffeld, S. (2015). How
transformational leadership works during team interactions: A behavioral process
analysis. The Leadership Quarterly, 26(6), 1017-1033. doi:10.1016/j.leaqua.2015.07.003

Kentucky SHAPE Journal Vol. 58 No. 1 - 33 -
Lifschutz, L. (2012). Club sports: Maximizing positive outcomes and minimizing risks.
Recreational Sports Journal, 36(2), 104-112.
Lower, L. M., Turner, B. A., & Petersen, J. C. (2013). A comparative analysis of perceived
benefits of participation between recreational sport programs. Recreational Sports
Journal, 37(1), 66-83.
McDowell, J., Deterding, R., Elmore, T., Morford, E., & Morris, E. (2016). Title IX and Campus
Recreation: Guidelines to increase gender equity in club and intramural sport programs.
Recreational Sports Journal, 40(2), 133-151. doi:10.1123/rsj.2016-0012
Mitchell, M., Leachman, M., & Saenz, M. (2019). State higher education funding cuts have
pushed costs to students, worsened inequality. Center on Budget and Policy Priorities,
Washington, DC.
NIRSA. (2018). What is Collegiate Recreation? [Infographic]. Retrieved December 12, 2017,
from https://nirsa.net/nirsa/#learn-more-2
Odumeru, J. A., & Ogbonna, I. G. (2013). Transformational vs. transactional leadership theories:
Evidence in literature. International review of management and business research, 2(2),
355.
Overstreet, R. E., Hanna, J. B., Byrd, T. A., Cegielski, C. G., & Hazen, B. T. (2013). Leadership
style and organizational innovativeness drive motor carriers toward sustained
performance. The International Journal of Logistics Management, 24(2), 247-270. doi:
10.1108/IJLM-12-2012-0141
Parker, S. K., Bindl, U. K., & Strauss, K. (2010). Making things happen: A model of proactive
motivation. Journal of Management, 36(4), 827–856.
https://doi.org/10.1177/0149206310363732
Posner, B. Z. (2015). An investigation into the leadership practices of volunteer leaders.
Leadership & Organization Development Journal, 36(7), 885-898. doi:10.1108/LODJ-
03-2014-0061
Reynolds, K. (2016). A Relationship Study Comparing Satisfaction, Participation, and
Commitment to Intramural and Club Sports with Students' Intention to Return to Campus
[Master’s thesis, Winthrop University]. Graduate Theses. 22.
Robertson, J. L. (2018). The nature, measurement and nomological network of environmentally
specific transformational leadership. Journal of Business Ethics, 151(4), 961-975.
doi:10.1007/s10551-017-3569-4
Rosch, D. M. (2014). Predicting student leadership in agricultural professional preparation
organizations. NACTA Journal, 58(1), 7-10. Retrieved from http://0-
search.proquest.com.library.uark.edu/docview/1508544507?accountid=8361
Salary, T. K. (2019). The role of transformational and transactional leaders on the intrinsic and
extrinsic motivation among employees in Atlanta: A phenomenological study. (Order No.
13809563). [Doctoral Dissertation, Northcentral University]. ProQuest Dissertations &
Theses Global.
Smith, M., Arthur, C., Hardy, J., Callow, N., & Williams, D. (2013). Transformational
Leadership and task cohesion in sport: The mediating role of intrateam communication.
Psychology of Sport and Exercise, 14(2), 249-257. doi:10.1016/j.psychsport2012.10.002
Treischl, E., & Wolbring, T. (2017). The causal effect of survey mode on students’ evaluations
of teaching: Empirical evidence from three field experiments. Research in Higher
Education, 58(8), 904-921. doi:10.1007/s11162-017-9452-4

Kentucky SHAPE Journal Vol. 58 No. 1 - 34 -
Wang, G., Oh, I. S., Courtright, S. H., & Colbert, A. E. (2011). Transformational leadership and
performance across criteria and levels: A meta-analytic review of 25 years of research.
Group & organization management, 36(2), 223-270.
Warner, S., & Dixon, M. A. (2013). Sports and community on campus: Constructing a sports
experience that matters. Journal of College Student Development, 54(3), 283-298.
doi:10.1353/csd.2013.0044
Weaver, A. G., Forte, D. J., & McFadden, C. W. (2017). Perceptions of higher education
administrators regarding the role of club sports in the recruitment and retention of male
students. Recreational Sports Journal, 41(1), 42-54
Weese, W.J. (1995). Leadership and organizational culture: An investigation of Big Ten and
Mid-American Conference campus recreation administrations. Journal of Sport
Management, 9, 119–134.
Xenikou, A., & Simosi, M. (2006). Organizational culture and transformational leadership as
predictors of business unit performance. Journal of Managerial Psychology, 21(6), 566-
579.

Kentucky SHAPE Journal Vol. 58 No. 1 - 35 -
Appendix A. Global Transformational Leadership Survey
1. Age _______
2. Gender _______
3. To which racial or ethnic group(s) do you most identify?
American Indian/Alaskan Native
Asian
Black, Non-Hispanic
Hispanic/Latino
White, Non-Hispanic
Native Hawaiian/Pacific Islander
Two or More Races
Other
4. Are you a first generation college student?
Yes No
5. Classification:
Freshman Sophomore Junior Senior Graduate Student
6. What Club Sport are you primarily a member of?
________________________________
7. How many SEMESTERS have you participated in Club Sports with this club?
0 1 2 3 4 5 6 7 8 9 10 11+
8. Are you an Officer for your Club?
Yes No
8a. If yes, what position do you currently hold?
Secretary Treasurer Vice-President President Other
9. How many SEMESTERS have you been a Club Sport Officer?
0 1 2 3 4 5 6 7 8 9 10 11+
10. Are you involved in any other student organization (RSO/Greek Life) on campus?
Yes No
10a. If yes, please state and describe the organizations you are a member of.
11. Do you or have you held any leadership roles in other organizations such as RSOs or Greek
Life on campus?
Yes No
11a. If yes, please state and describe the positions and organizations you have/do hold.
Please indicate to what extent you feel your 2017-2018 Club President exhibits the following
characteristics:
(1 = not at all like my club’s President, 5 = very much like my club’s President)
1. Communicates a clear and positive vision of the future
1 2 3 4 5
2. Treats club members as individuals, supports and encourages their development
1 2 3 4 5
3. Gives encouragement and recognition to club members
1 2 3 4 5

Kentucky SHAPE Journal Vol. 58 No. 1 - 36 -
4. Fosters trust, involvement and cooperation among club members
1 2 3 4 5
5. Encourages thinking about problems in new ways and questions assumptions
1 2 3 4 5
6. Is clear about his/her values and practices what he/she preaches
1 2 3 4 5
7. Instills pride and respect in others and inspires me by being highly competent
1 2 3 4 5

Kentucky SHAPE Journal Vol. 58 No. 1 - 37 -
Appendix B. Club President Survey
For 2017-2018 Club Presidents only:
1. Age: ___________
2. Gender: __________
3. To which racial or ethnic group(s) do you most identify?
American Indian/Alaskan Native
Asian
Black, Non-Hispanic
Hispanic/Latino
White, Non-Hispanic
Native Hawaiian/Pacific Islander
Two or More Races
Other
4. First generation college student?
Y/N
5. What is your major?
6. Club for which you serve as President: __________________
7. How many SEMESTERS (Fall & Spring only) have you participated in Club Sports?
0 1 2 3 4 5 6 7 8 9 10 11+
8. How many SEMESTERS (Fall & Spring only) have you been president of your club?
0 1 2 3 4 5 6 7 8 9 10 11+
9. Have you held other leadership positions within your club prior to becoming President?
Yes No
9a. If yes, how many SEMESTERS (Fall & Spring only) have you been a club sport officer
(other than President)?
0 1 2 3 4 5 6 7 8 9 10 11+
9b. Please state and describe your roles within these positions.
10. Are you involved in any other student organizations such as RSO’s or Greek Life on
campus?
Yes No
10a. If yes, please state those you are a member.
11. Do you or have you held any leadership roles in other organizations such as RSOs or Greek
Life on campus?
Yes No
11a. If yes, please describe the roles and organizations that you do or have held leadership
positions in.
Kentucky SHAPE Journal Vol. 58 No. 1 38
(Peer Reviewed Article)
Measuring the Levels of Athletic Identity and Identity Foreclosure of National
Association of Intercollegiate Athletics (NAIA) Student-Athletes
Gavin Washington, Kentucky State University ([email protected])
Abstract
During a person’s college years they are beginning to form identities and develop a sense of self.
One of the most salient identities that college student-athletes identify with is their athletic identity.
Numerous research studies have been conducted on the saliency of a student-athlete’s athletic
identity, however the vast majority of those research studies examined student-athletes participating
at the NCAA (National Collegiate Athletic Association) Division I level. This study was designed
to extend the previous investigation of athletic identity and identity foreclosure among college
students by focusing on athletes participating at the NAIA (National Association of Intercollegiate
Athletics) level.
By utilizing previously developed scales: Athletic Identity Measurement Scale (AIMS) and the
Extended Objective Measure of Ego-Identity Status (EOM-IS), this study assessed a sample of male
and female college student-athletes’ AIMS and EOM-IS levels in order to investigate their levels of
athletic identity and identity foreclosure. Further, this study looks to determine if there is a
significant variance in AIMS and EOM-IS levels based on selected independent variables: grade
classification, sport, scholarship and non-scholarship athletes, revenue generating and non-revenue
generating sports. Participants in this study were student-athletes at a NAIA institution.
Key Words: athletic identity, identity foreclosure, student-athletes, National Association of
Intercollegiate Athletics (NAIA), and student affairs.
Introduction
An individual’s transition from high school to college is a very important time in that person’s life.
The formation of one’s identity starts in childhood and progresses as that child grows through
adolescence into adulthood. Identity formation has been defined as the development of an
individual's distinct personality, which is regarded as a persisting entity in a stage of life by which a
person is recognized or known (Erikson, 1968). This process of formulating an identity is a
universal process and it defines individuals to others and themselves. Components of one’s identity
include a sense of continuity, a sense of uniqueness from others, and a sense of affiliation to a larger
group or society. While the identity development process occurs throughout life, research suggests
that substantial strides in one’s identity occur during the college years (Torres, Jones, & Renn,
2019). During college, students begin developing a stronger sense of who they are due to their
evolving identity. Progressive developmental trends in identity status are greater in the college
years than in adolescence (Waterman, 1993).

Kentucky SHAPE Journal Vol. 58 No. 1 39
Student-athletes are one of the subpopulations of college students that have garnered a lot of
attention in identity development. Empirical research has been conducted on the correlation
between college student identity formation and participation in intercollegiate athletics (Brewer &
Petitpas 2017). Griffith and Johnson (2002) have suggested that participation in athletics while in
college can provide a student with valuable life skills and psychological benefits that help facilitate
identity development. Competing in intercollegiate athletics can teach self-discipline, teamwork,
confidence, leadership, social, and interpersonal skills (Aries & Richards, 1999, Brewer, Van
Raatle, & Linder, 2012). Team members often shared common traits that made the overall college
experience less stressful; knowing that other athletes had experienced similar hardships and yet
succeeded (Weight & Huml, 2016). On the contrary, some view college athletics to be detrimental
to an individual’s identity development. The student-athletes' attention might be drawn away from
academics, as well as other social aspects of the college experience (Parham, 1993). Research
conducted by Parham (1993) suggested that intercollegiate athletic participation might be
negatively associated with such outcomes as involvement and satisfaction with the overall college
experience, career maturity, and clarity in educational and occupational plans, and principled moral
judgment (Pascarella et al., 1999). Whether positive or negative, research has suggested that
athletics play a very important role in the identity formation process.
Marcia (2009) theorized that individuals have four identity stages or statuses that they go through in
their process of identity development. Identity Diffusion, Identity Foreclosure, Identity Moratorium,
and Identity Achievement. The core idea surrounding his theory was that one’s sense of identity is
determined primarily by the choices and commitments made regarding personal and social traits.
Marcia suggested that a well-developed identity gives an individual a sense of one’s strengths,
weaknesses, and individual uniqueness. A person with a less well-developed identity does not have
a well-articulated sense of self (Marcia, 2009). When discussing the topic of identity formation, it
is important to also examine the concept of identity foreclosure. Markus and Nurius (1986) posited
that a person’s identity was formed over a lifespan, and that identity foreclosure typically occurs
during adolescence (Markus & Nurius, 1986).
The process of identity foreclosure happens when individuals prematurely make a firm commitment
to an occupation or ideology (Brewer & Petitpas, 2017). People who are foreclosed have not
allowed for exploration of their internal needs and values. Intercollegiate student-athletes are
primarily focused on their athletic pursuits, thus they often shut down any possibilities to explore
their other internal needs and values. Murphy and Petitpas (1996) noted that many authors have
suggested that the physical and psychological demands of collegiate athletics, coupled with the
restrictiveness of the athletic system, may isolate athletes from mainstream college activities,
restrict their opportunities for exploratory behavior, and promote identify foreclosure (Chartrand &
Lent, 1987; Nelson, 1983; Petitpas & Champagne, 1988). Overall, athletic identity is often one of most dominant identities and this level of identity
foreclosure increases with the level of sports participation.
Brewer and Petipas (2017) found that student athletes who participated the NCAA Division I level
have higher levels of identity foreclosure and higher levels of athletic identity than those that
participate at non NCAA Division I institutions. Huml (2018) examined whether athletic identity is
different for college athletes across the three NCAA divisions. The findings of Huml’s study

Kentucky SHAPE Journal Vol. 58 No. 1 40
demonstrated that there was a difference among the levels of athletic identity found in students
athletes based on their NCAA division affiliation; student athletes who participated at the NCAA
Division III level had lower athletic identity scores in comparison with student athletes who
participated at the NCAA Division I and II level (Huml, 2018).
The current body of literature that focuses specifically on athletic identity, as opposed to other
emerging identities formulated during adolescences, focuses mostly on elite athletes playing at
NCAA Division I institutions. Little empirical research has been conducted exploring the athletic
identity of student-athletes competing at institutions governed by the National Association of
Intercollegiate Athletics (NAIA). Due to the lack of research conducted on student-athletes at these
types of institutions, this research study attempted to fill an important void in the literature by
investigating this unique group of athletes. The purpose of the study is to explore if students
participating in athletics at NAIA level institutions display similarly high levels of athletic identity
as elite athletes of the NCAA.
This study investigated three primary questions: 1. How do the levels of athletic identity and
identity foreclosure for student-athletes at NCAA Division I institutions compare to similar to
student-athletes at NAIA institutions? 2. Is there a correlation between athletic identity and identity
foreclosure among athletes at a NAIA institution? 3. What are the differences in athletic identity
and identity foreclosure based on specific variables such as a NAIA student athlete’s year in school,
sport played, type of sport played and if they are on scholarship?
Method
Participants
The sample of participants for this research study is considered a targeted sample because of the
geographic location of the institution as well as the researchers’ relationship to the institutions that
allowed for access to the participants. All potential participants are student-athletes who participate
in intercollegiate athletics at a university. There were 153 male student-athletes and 140 female
student-athletes enrolled at the time of the study. This combines for a total of 293 student-athletes.
Of the 153 male athletes 34 participate in baseball, 23 in basketball, 11 in cross-country, 8 in golf,
21 in lacrosse, 32 in soccer, 14 in swimming, 10 in tennis. Of the 140 female athletes 16 participate
in basketball, 11 in cross-country, 5 in golf, 18 in lacrosse, 23 in soccer, 17 in softball, 16 in
swimming, 13 in tennis, and 21 in volleyball.
Research Site
The research site was a four-year, multi-denominational institution. They are a member of the
National Association of Intercollegiate Athletics (NAIA) Division II in basketball, Division I in all
other sports (NAIA, 2015). The school competes within an intercollegiate athletic conference
located in the midwest. In women's lacrosse, the university competes in the National Women's
Lacrosse League (NWLL) and the men are seeking acceptance into the Men's Collegiate Lacrosse
Association (MCLA).
Kentucky SHAPE Journal Vol. 58 No. 1 41
Participant Recruitment
Participants were recruited through the support of the institute’s Director of Athletics and approved
by the Internal Review Board. Student-athletes were sent an email requesting their participation in
a research study. The email came from the Director of Athletics and it contained a link taking the
participant first to an informed consent page, and if consent is given, to the proposed measurement
scales. Students had 4 weeks to complete the survey and reminder emails were sent out each week
by the Director of Athletics to complete the survey. If participants had questions regarding the
research study, they were provided the primary investigator’s contact information so that their
questions or concerns can be addressed accordingly.
Instrumentation
This research study utilized two instruments: The Athletic Identity Measurement Scale (AIMS) and
The Extended Objective Measure of Ego-Identity Status (EOM-EIS). Additional items were
included to obtain respondents’ demographic data in a single survey administration. AIMS is a 10-
item instrument that was designed to measure a person’s level of athletic identity. The EOM-EIS is
a 64-item instrument that was designed to measure the four areas of identity development, which
are moratorium, diffusion, foreclosure, and achievement.
Athletic Identity Measurement Scale
AIMS is a standardized, psychometrically sound measure that tests Athletic Identity (AI). Brewer,
Van Raatle, and Linder (1993) developed the AIMS as a measurement tool reflecting both the
strength and the exclusivity of athletic identity. Since the early development of the AIMS,
researchers have been examining its validity to improve the measurement tool (Brewer &
Cornelius, 2001; Hale et al., 1999; Martin, Eklund, & Mushett, 1997). The AIMS was originally
written as an 11-item Likert scale instrument, though preliminary analysis of the items led to one of
the questions being removed from the instrument, as it showed little variance across respondents
(Brewer et al., 1993). The 10-item scale encompasses social, cognitive, and affective elements of
athletic identity (see Table 1). The items evaluate the self-reported thoughts and feelings from
athletes’ daily experiences.
Table 1. Athletic Identity Measurement Scale
Item
1. I consider myself an athlete.
2. I have many goals related to sport.
3. Most of my friends are athletes.
4. Sport is the most important part of my life.
5. I spend more time thinking about sport than anything else.
6. I need to participate in sport to feel good about myself.
7. Other people see me mainly as an athlete.
8. I feel bad about myself when I do poorly in sport.
9. Sport is the only important thing in my life.
10. I would be very depressed if I were injured and could not compete in sport.
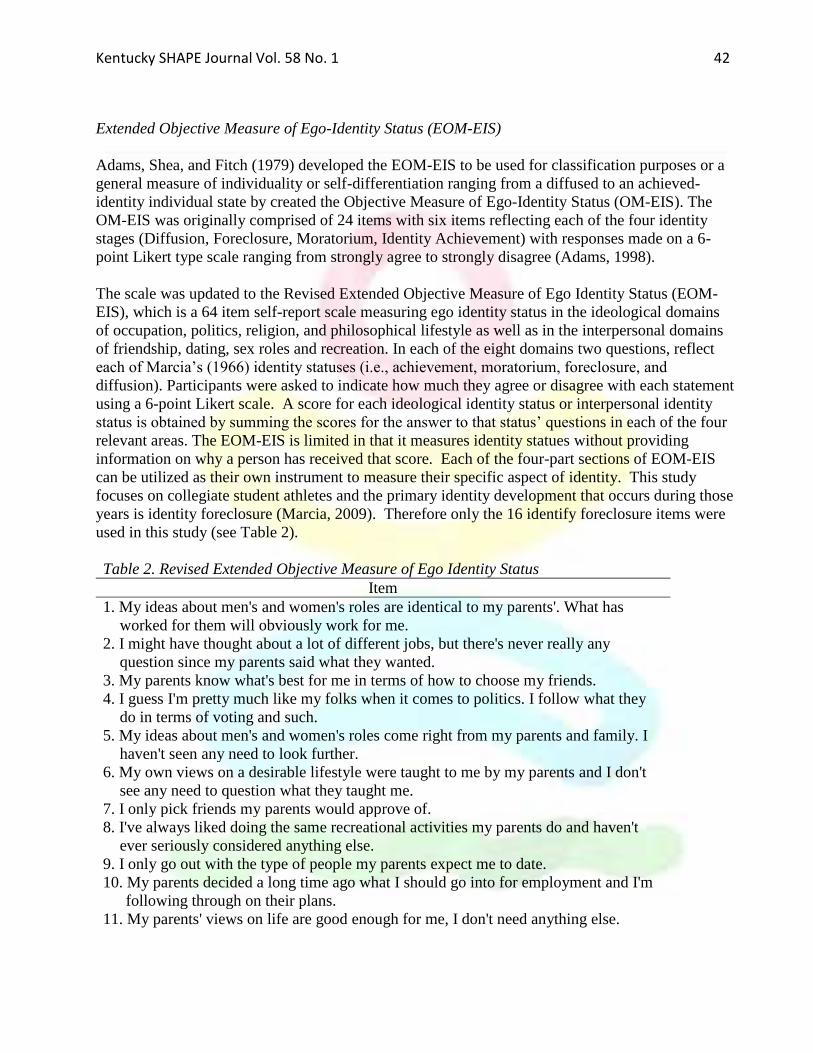
Kentucky SHAPE Journal Vol. 58 No. 1 42
Extended Objective Measure of Ego-Identity Status (EOM-EIS)
Adams, Shea, and Fitch (1979) developed the EOM-EIS to be used for classification purposes or a
general measure of individuality or self-differentiation ranging from a diffused to an achieved-
identity individual state by created the Objective Measure of Ego-Identity Status (OM-EIS). The
OM-EIS was originally comprised of 24 items with six items reflecting each of the four identity
stages (Diffusion, Foreclosure, Moratorium, Identity Achievement) with responses made on a 6-
point Likert type scale ranging from strongly agree to strongly disagree (Adams, 1998).
The scale was updated to the Revised Extended Objective Measure of Ego Identity Status (EOM-
EIS), which is a 64 item self-report scale measuring ego identity status in the ideological domains
of occupation, politics, religion, and philosophical lifestyle as well as in the interpersonal domains
of friendship, dating, sex roles and recreation. In each of the eight domains two questions, reflect
each of Marcia’s (1966) identity statuses (i.e., achievement, moratorium, foreclosure, and
diffusion). Participants were asked to indicate how much they agree or disagree with each statement
using a 6-point Likert scale. A score for each ideological identity status or interpersonal identity
status is obtained by summing the scores for the answer to that status’ questions in each of the four
relevant areas. The EOM-EIS is limited in that it measures identity statues without providing
information on why a person has received that score. Each of the four-part sections of EOM-EIS
can be utilized as their own instrument to measure their specific aspect of identity. This study
focuses on collegiate student athletes and the primary identity development that occurs during those
years is identity foreclosure (Marcia, 2009). Therefore only the 16 identify foreclosure items were
used in this study (see Table 2).
Table 2. Revised Extended Objective Measure of Ego Identity Status
Item
1. My ideas about men's and women's roles are identical to my parents'. What has
worked for them will obviously work for me.
2. I might have thought about a lot of different jobs, but there's never really any
question since my parents said what they wanted.
3. My parents know what's best for me in terms of how to choose my friends.
4. I guess I'm pretty much like my folks when it comes to politics. I follow what they
do in terms of voting and such.
5. My ideas about men's and women's roles come right from my parents and family. I
haven't seen any need to look further.
6. My own views on a desirable lifestyle were taught to me by my parents and I don't
see any need to question what they taught me.
7. I only pick friends my parents would approve of.
8. I've always liked doing the same recreational activities my parents do and haven't
ever seriously considered anything else.
9. I only go out with the type of people my parents expect me to date.
10. My parents decided a long time ago what I should go into for employment and I'm
following through on their plans.
11. My parents' views on life are good enough for me, I don't need anything else.

Kentucky SHAPE Journal Vol. 58 No. 1 43
12. I attend the same church my family has always attended. I've never really
questioned why.
13. I've never really questioned my religion. If it's right for my parents, it must be right
for me.
14. All my recreational preferences I got from my parents and I haven't really tried
anything else.
15. I date only people my parents would approve of.
16. My folks have always had their own political and moral beliefs about issues like
abortion and mercy killing and I've always gone along accepting what they have.
Demographic Data
Demographic data was collected from respondents (see Table 3). Students were asked to identify
their gender, race, ethnicity, date of birth, sport, year in school, and scholarship status. The items
used for race and ethnicity were chosen based on the US Department of Education's policy
guidelines for data collection (“Policy Questions”, 2008).
Table 3. Demographic Questions
Question Response Option
1. Gender Male
Female
2. Ethnicity Hispanic or Latino
Not Hispanic or Latino
3. Race (please select all that apply) White
Black or African American
Asian
American Indian or Alaskan Native
Native Hawaiian or Pacific Islander
4. Date of birth __/__/____
5. What is your current academic
classification?
Freshman
Sophomore
Junior
Senior
6. What sport do you participate in (select all
that apply)?
Baseball
Basketball
Cross Country
Golf
Lacrosse
Soccer
Swimming
Tennis
Softball
Volleyball
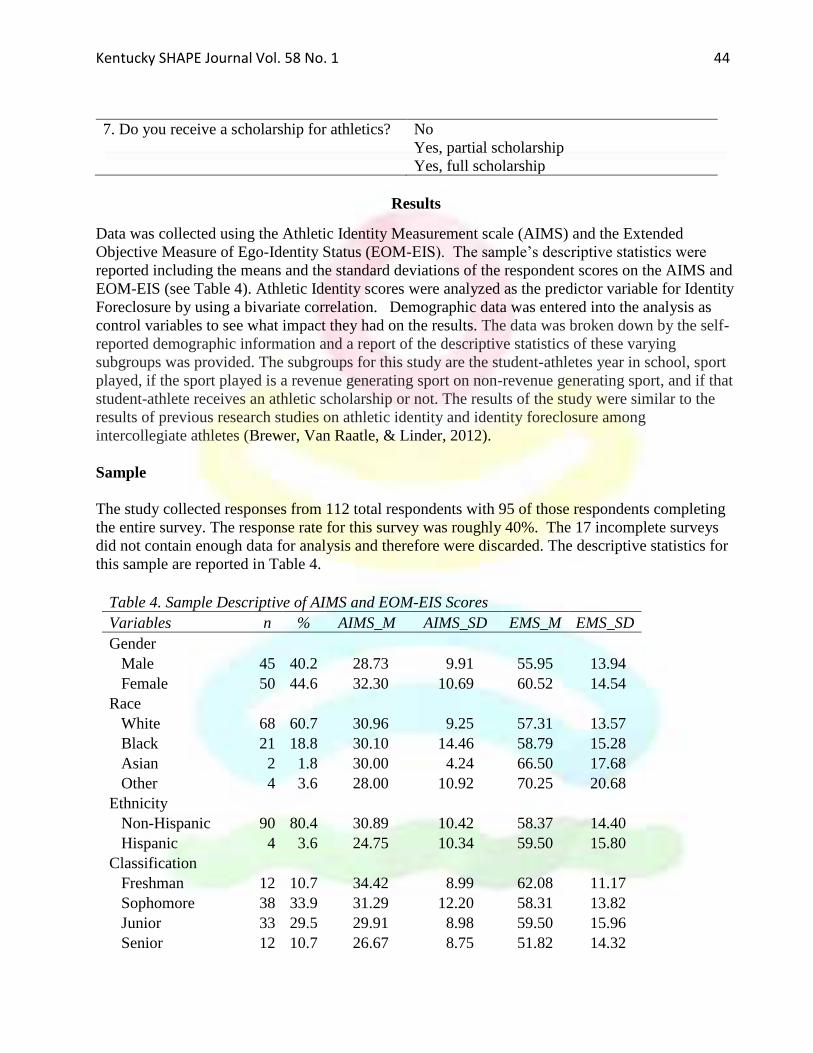
Kentucky SHAPE Journal Vol. 58 No. 1 44
7. Do you receive a scholarship for athletics? No
Yes, partial scholarship
Yes, full scholarship
Results
Data was collected using the Athletic Identity Measurement scale (AIMS) and the Extended
Objective Measure of Ego-Identity Status (EOM-EIS). The sample’s descriptive statistics were
reported including the means and the standard deviations of the respondent scores on the AIMS and
EOM-EIS (see Table 4). Athletic Identity scores were analyzed as the predictor variable for Identity
Foreclosure by using a bivariate correlation. Demographic data was entered into the analysis as
control variables to see what impact they had on the results. The data was broken down by the self-
reported demographic information and a report of the descriptive statistics of these varying
subgroups was provided. The subgroups for this study are the student-athletes year in school, sport
played, if the sport played is a revenue generating sport on non-revenue generating sport, and if that
student-athlete receives an athletic scholarship or not. The results of the study were similar to the
results of previous research studies on athletic identity and identity foreclosure among
intercollegiate athletes (Brewer, Van Raatle, & Linder, 2012).
Sample
The study collected responses from 112 total respondents with 95 of those respondents completing
the entire survey. The response rate for this survey was roughly 40%. The 17 incomplete surveys
did not contain enough data for analysis and therefore were discarded. The descriptive statistics for
this sample are reported in Table 4.
Table 4. Sample Descriptive of AIMS and EOM-EIS Scores Variables n % AIMS_M AIMS_SD EMS_M EMS_SD
Gender Male 45 40.2 28.73 9.91 55.95 13.94
Female 50 44.6 32.30 10.69 60.52 14.54
Race White 68 60.7 30.96 9.25 57.31 13.57
Black 21 18.8 30.10 14.46 58.79 15.28
Asian 2 1.8 30.00 4.24 66.50 17.68
Other 4 3.6 28.00 10.92 70.25 20.68
Ethnicity Non-Hispanic 90 80.4 30.89 10.42 58.37 14.40
Hispanic 4 3.6 24.75 10.34 59.50 15.80
Classification Freshman 12 10.7 34.42 8.99 62.08 11.17
Sophomore 38 33.9 31.29 12.20 58.31 13.82
Junior 33 29.5 29.91 8.98 59.50 15.96
Senior 12 10.7 26.67 8.75 51.82 14.32

Kentucky SHAPE Journal Vol. 58 No. 1 45
Sport Baseball 9 8.0 29.44 8.37 62.63 11.15
Basketball 13 11.6 24.92 11.36 55.92 10.47
Cross Country 9 8.0 26.88 7.18 51.50 18.88
Golf 3 2.7 33.33 10.69 58.33 3.22
Lacrosse 13 11.6 29.92 13.56 56.09 20.18
Soccer 9 8.0 36.67 9.01 61.50 14.29
Swimming 11 9.8 36.18 12.38 54.91 12.70
Tennis 2 1.8 25.50 2.12 46.00 4.24
Softball 12 10.7 28.50 8.62 63.08 15.08
Volleyball 12 10.7 33.33 8.15 64.17 13.72
Scholarship No 25 22.3 30.32 11.94 51.96 15.00
Yes 70 62.5 30.74 9.93 60.94 13.40
Note. N = 112
Preliminary Analysis
The first analysis that was conducted through SPSS was a bivariate correlation analysis to
determine if there was a relationship between the Athletic Identity Measurement Scale (AIMS)
scores and the Extended Objective Measure of Ego-Identity Status, (EOM-EIS) scores (Table 3).
The results of the analysis indicated there was a high positive relationship between AIMS scores
and EOM-EIS scores, r(87) = .52, p < .001. This correlation would suggest that as a respondent’s
AIMS score increased, their EOM-EIS score would likely increase as well, and vice a versa.
Secondary Analysis
Using the categories established in the primary analysis, the relationship between athletic identity
and class designation was examined. Given that a relationship was found to exist between AIMS
and EOM scores, analyses proceeded. A one-way ANOVA was conducted to address the research
question, What are the levels of Athletic Identity and Identity Foreclosure for our sample? The
results of the between groups one-way ANOVA examining AIMS scores by class designation
indicated there was no statistically significant difference in AIMS scores across the four class
designations, F(3, 90) = 1.21, p = .309 (Table 4).
The next secondary analysis that was conducted examined the relational impact of athletic identity
and sport. A one-way ANOVA was conducted and the results of the between groups one-way
ANOVA examining AIMS scores by sport designation indicated there was no statistically
significant difference in AIMS scores across the ten sport designations, F(9, 82) = 1.52, p = .156
(Table 4).
Following the analysis of the relational impact of athletic identity and sport, an analysis was
conducted on the relational impact of identity foreclosure and class designation examined. A one-
way ANOVA was conducted and the results of the between groups one-way ANOVA examining

Kentucky SHAPE Journal Vol. 58 No. 1 46
EOM-EIS scores by class designation indicated there was no statistically significant difference in
EOM-EIS scores across the four class designations, F(3, 85) = 1.10, p = .356. The Levene’s test
was not statistically significant (p = .925), indicating the assumption of homogeneity of variance
was not violated.
The final one-way ANOVA was conducted to examine the relational impact of identity foreclosure
and sport. The results of the between groups one-way ANOVA examining EOM-EIS scores by
sport designation indicated there was no statistically significant difference in EOM-EIS scores
across the ten sport designations, F(9, 77) = 0.96, p = .47. The Levene’s test was not statistically
significant (p = .120), indicating the assumption of homogeneity of variance was not violated.
During the process of analyzing the data, t-tests were conducted to determine if there was a
significant difference between the AIMS score compared to gender and the AIMS score compared
to scholarship status. The initial t-test of AIMS scores examined differences by gender. The results
as shown in Table 4 indicated that there was not a statistically significant difference in the scores of
males (M = 28.72, SD = 9.91) and the scores of females (M = 32.30, SD = 10.69), t(92) = -1.67, p =
.098. The Levene’s test was not statistically significant (p = .862) indicating the assumption of
homogeneity of variance was not violated. The second t-test of AIMS scores examined differences
by scholarship status. The results shown in Table 4 indicated that there was not a statistically
significant difference in the scores of students without scholarships (M = 30.32, SD = 11.94) and
the scores of students with scholarships (M = 30.74, SD = 9.93), t(92) = -.171, p = .864.
The initial t-test of EOM-EIS scores examined differences by gender. The results indicated that
there was not a statistically significant difference in the scores of males (M = 55.95, SD = 13.94)
and the scores of females (M = 60.52, SD = 14.53), t(87) = -1.51, p = .136. The Levene’s test was
not statistically significant (p = .899), indicating the assumption of homogeneity of variance was
not violated. The second t-test of EOM-EIS scores examined differences by scholarship status. The
results indicated that there was a statistically significant difference in the scores of students without
scholarships (M = 51.96, SD = 15.00) and the scores of students with scholarships (M = 60.94, SD =
13.40), t(87) = -2.75, p < .01). The Levene’s test was not statistically significant (p = .450)
indicating the assumption of homogeneity of variance was not violated.
Discussion and Conclusions
Since AIMS is a 10-item instrument that uses a 7-point Likert Scale, scores can range from 10-70.
The mean score for this sample was a 30.62, which indicated a moderate score on this instrument.
The student-athletes for this sample participate at the National Association of Intercollegiate
Athletics (NAIA) level. A student-athlete’s level of athletic identity increases as the level in which
they participate increase (Good et al., 2012). In accordance with the research conducted by Good et
al. (1993), student-athletes who compete at the NCAA Division I level display the highest levels of
athletic identity when compared to non NCAA Division I athletes.
The results from this study are in contradiction to the results reported by Brewer and Petipas’s
(2017) previous research on athletic identity and identity foreclosure. The scores for males and
females in this current study were very similar, with female scores being just slightly higher than

Kentucky SHAPE Journal Vol. 58 No. 1 47
the male scores. Although the scores for females were slightly higher than the scores for males,
they were found not to have a statistically significant difference among them. This means that no
conclusions can be made based on gender. The sports in which the female respondents for this
study participated in could be a factor. Most of the female respondents participated in Softball,
Volleyball, and Basketball, which are three of the winningest programs at the institution used for
this study. Mills and Christensen (2006) conducted research on the relationship between athletic
identity and the level of sport participation and they found that athletes who competed at NCAA
Division I institutions as well as athletes who achieved success in athletics displayed higher levels
of athletic identity. Therefore, it could be that the female student-athletes in this study were more
successful in terms of winning percentage than the female student-athletes in previous research
resulting in their higher levels of athletic identity.
Another reason for this sample having a moderate score on the AIMS could be due to the sample
coming from an institution that is a religiously affiliated institution of higher learning. Religious
identity is often one of the most salient identities (Holland et al., 2001). This would allow someone
to theorize that a student-athlete at a religious affiliated institution would identify with their
religious identity more than other aspects of their identity such as their athletic identity. The
students who participated in this study would also be exposed to the intersectionality of religion and
education through university sanctioned chapel services, prayer meetings, and bible study sessions,
which in return can lead to students having a higher religious identity. In accordance with the
research of Barber, Hunt, Stone, and Eccles (2005), students who participate in social activities
beyond their academic pursuits are more likely to work through issues of personal and social
identity. Due to the potential for competing identities, studying athletes at a non-religious NAIA
institution would be beneficial in future research on the topic.
To measure the levels of identity foreclosure for this sample, the Extended Objective Measure of
Ego Identity Status (EOM-EIS) was utilized. The mean score on the EOM-EIS was 58.41 and when
you break that down by gender, the mean score for females was 60.52 and the mean score for males
was 55.95. The mean EOM-EIS score for this sample was a 58.41, which is considered an above
moderate score indicating that the sample displays above moderate levels of identity foreclosure
(Klasen, 2016).
The research on identity foreclosure is consistent with the findings from this study; the student-
athletes tend to have moderate levels of foreclosure. The time and devotion that participating in
collegiate sports involves, limits the free time student-athletes must explore other aspects of their
identity (Huml 2018).
Brewer and Petipas (2017) found that there is a correlation between athletic identity and identity
foreclosure. However, the research focused on student-athletes competing at highly competitive
NCAA Division I institutions. Researchers such as Katherine Whipple (2009) have investigated the
relationship between athletic identity, identity foreclosure and career maturity at NCAA Division
III level. Whipple’s research study found that among the NCAA Division III athletes studied, only a
moderate relationship exists between the two independent variables identity foreclosure and athletic
identity, and the dependent variable career maturity. Although the relationships found Whipple’s
study were in alignment with previous research among NCAA Division I student-athletes, the
Kentucky SHAPE Journal Vol. 58 No. 1 48
relationships among Whipple’s sample of NCAA Division III student-athletes were much weaker.
The data suggested that NCAA Division III student-athletes may negotiate their identity hierarchies
differently than student-athletes competing at the NCAA Division I level. This points to the need
for more research studies to include NAIA student athletes when examining identity.
Studies have examined the mean differences for grade classification and both studies found that
regarding athletic identity, identity foreclosure and year in school, there are no significant
differences (Oregon, 2010, Whipple, 2009). These findings contradict prior research conducted by
Adler and Adler (1991), who found the athletic role in NCAA Division I collegiate student-athletes,
became stronger and more exclusive with age. The study noted that the majority of participants
entered college with high pre-existing levels of athletic identity. Additionally, the findings in this
research study supports that academic class does not affect your level of athletic identity or identity
foreclosure.
When examining the other selected variables of this research study (sport, revenue vs. non-revenue
generating, and scholarship vs. non-scholarship) a one-way ANOVA test found there to be no
statistically significant difference in AIMS and EOM-EIS scores across the selected variables.
These findings are not congruent with the research of Oregon (2010), Miller and Kerr (2003), and
Adler and Adler (1991). Oregon (2010) found there was statistical significance based on the type
of sport played and whether that sport was revenue generating or non-revenue generating. In terms
of scholarship versus non-scholarship student-athletes, a direct comparison cannot be made because
the participants in Oregon’s research study were NCAA Division I, student-athletes and almost all
received some form of athletic scholarship.
Implications
One of the main implications of this research study is that it supports a correlation between athletic
identity and identity foreclosure for student-athletes who compete at the NAIA level. Researchers
such as Brewer (1993) had suggested that there is a correlation between a person’s athletic identity
and their levels of identity foreclosure; however, most of the studies conducted by Brewer and his
colleagues examined student athletes at NCAA Division I institutions. It is not hard to believe that
student-athletes at the NCAA Division I level strongly identify with their athletic role, thus causing
them to not explore other facets of their identity. This research study is implying that the same can
be said among student-athletes who complete at the NAIA level. The knowledge of the athletic
identity levels of student-athletes could be very useful for NAIA institutions because they could
then use that information to better develop academic advising, career counseling and other student
service programs to meet the needs of their student-athletes.
Going beyond career counseling, a knowledge of athletic identity and identity foreclosure can be
useful to student affairs practitioners because they often rely on the psychology behind identity
development to develop academic advising, career counseling and retention programs (Torres,
Jones, & Renn 2009). If students are displaying high levels of athletic identity and high levels of
identity foreclosure that can be considered when students are choosing academic majors and
selecting potential vocations. This research study offers student affairs practitioners information on
the variables and factors that contribute to the levels of athletic identity and identity foreclosure of
Kentucky SHAPE Journal Vol. 58 No. 1 49
student-athletes by providing peer-reviewed research on the topic. This information can then be
utilized by student affairs practitioners to develop a baseline knowledge of the factors contributing
to high levels of athletic identity and identity foreclosure and then institutions of higher learning
can develop programs that are more equipped to meet the needs of their student-athletes.
Another important implication of this research study is that it expands the literature surrounding
athletic identity and identity foreclosure to include student-athletes who do not compete at the
NCAA Division I level. There are roughly 350 NCAA Division I, 300 NCAA Division II, 450
NCAA Division III, and 260 NAIA institutions in the United States (NCAA, 2020). However,
most of the athletic research is conducted on the 350 NCAA Division I institutions, leaving out over
1000 other institutions. Considering most student-athletes do not participate at the NCAA Division
I level, athletic research and the literature surrounding it should be more encompassing of non-
NCAA Division I institutions. This research study aids in that process by conducting a study on
student-athletes at a NAIA institution and broadening the literature in the field of athlete research,
specifically at NAIA institutions who are religiously affiliated.
Limitations
Although actions were taken to reduce potential limitations, this study’s results should be viewed in
the context of a targeted sample research design. Most notably, the sample consisted of current
male and female student-athletes at a select NAIA institution in the Mid-West region of the United
States. The sample for this research study was a targeted sample and therefore may cause
limitations in applying these findings to student-athletes who come from other parts of the country
as well as different levels of competition. This sample is less representative of the actual NAIA and
NCAA population of student-athletes in terms of racial, ethnic, and revenue to non-revenue
comparisons. Finally, this sample reflected a greater number of sophomores and juniors, with a
smaller portion of freshman and seniors being represented in this research study.
The collection procedures also created potential limitations. Respondents were sent an email with a
link to the survey that came from the research site’s Athletic Director. If students do not regularly
check their school email account, they may not have been aware of the survey. Due to the time
constraints of the academic calendar, the survey was sent out at the end of the spring semester and
students may have been overwhelmed with preparing for final examinations and not have been able
to respond to the survey. Another limitation to the timing of when the survey was distributed is that
most of the institution's athletic teams were out of season. This could limit the research study in
that student-athletes who are not in season may not feel obligated to participate in a research study
that was being emailed to them from their athletic director. Additionally, the timing of the study
may affect student responses. A student who completed this survey during their competitive season
may be more likely to have increased identification with the athletic role compared to students who
are out of season during that particular time.
Recommendations for Future Research
Despite the aforementioned limitations, this study has added to literature discussing athletic identity
and identity foreclosure among NAIA student-athletes. Because this study was conducted at a

Kentucky SHAPE Journal Vol. 58 No. 1 50
single institution, similar research studies should be conducted at wide variety of institutions in
order to increase the number of participants with different levels of playing experiences and
demographic backgrounds. Future research should consider doing in-depth qualitative studies
focusing on identity foreclosure among the college athlete (Miller & Kerr, 2003). Research
investigating athletic identity and identity foreclosure may benefit from longitudinal, qualitative
analyses that may better specify the relationships among athletic identity and identity foreclosure
among student-athletes. Researchers should also consider examining the reliability and validity of
AIMS and the EOM-EIS instrument to access if they truly measure what they are designed to
measure. Along those lines, researchers should also examine what are the additional ways in which
athletic identity and identity foreclosure can be measured. Additional research should consider a
larger sample size to potentially increase discovery of significant relationships between the
variables given in this study. Testing the validity and reliability of each of the EOM-EIS subscales
would give greater specificity to the research about identity by giving specific, stand-alone tools for
measurement.
Kentucky SHAPE Journal Vol. 58 No. 1 51
References
Adams, G. R., Shea, J., & Fitch, S. A. (1979). Toward the development of an objective assessment
of ego-identity status. Journal of Youth and Adolescence, 8(2), 223-237.
Adler, P. A., & Adler. P. (1987) Role Conflict and Identity Salience: College Athletics and
Academic Role. Social Science Journal, 27(4), 443-455.
Aries, E., & Richards, S. (1999). The Division III student athlete: Academic performance, campus
involvement, and growth. The Journal of College Student Development, 3, 211-217.
Barber, B. L., Stone, M. R., Hunt, J. E., & Eccles, J. S. (2005). Benefits of activity participation:
The roles of identity affirmation and peer group norm sharing. Organized activities as
contexts of development: Extracurricular activities, after-school and community programs,
185-210.
Brewer, B. W., & Cornelius, A. E. (2001). Norms and factorial invariance of the Athletic Identity
Measurement Scale (AIMS). Academic Athletic Journal, 16, 103-113.
Brewer, B. W., & Petitpas, A. J. (2017). Athletic identity foreclosure. Current opinion in
psychology, 16, 118-122. Brewer, B., Van Raalte, J., & Linder, D. (2012). Athletic Identity Measurement Scale. PsycTESTS
Dataset.
Brewer, B. W., Van Raalte, J. L., & Linder, D. E. (1993). Athletic identity: Hercules' muscles or
Achilles heel? International Journal of Sport Psychology, 24, 237-254. Chartrand, J. M., & Lent, R. W. (1987). Sports counseling: Enhancing the development of the
student-athlete. Journal of Counseling and Development, 66, 164-167. Colleges and University by Religious Affiliation (2019). Retrieved from
http://campusconrner.com/religious-affiliations.html Erikson, E. H. (1968). Identity: Youth and Crisis. New York: Norton. Good, A., Brewer, B., Petitpas, A., Van Raalte, J., & Mahar, M. (1993). Identity foreclosure,
athletic identity, and college sport participation. The Academic Athletic Journal, 8, 1-12. Griffith, K. A., & Johnson, K. A. (2002). Athletic identity and life roles of Division I and Division
III collegiate athletes. Journal of Undergraduate Research, 5, 225-231. Hale, B. D., James, B., & Stambulova, N. A. T. A. L. I. A. (1999). Determining the dimensionality
of athletic identity: a" Herculean" cross-cultural undertaking. International Journal of Sport
Psychology, 30(1), 83-100.
Holland, D., Lachicotte W., Skinner D., & Cain, C. (2001). Identity and agency in cultural worlds.
Cambridge, Massachusetts: Harvard University Press.
Huml, M. R. (2018). A factor structure examination of athletic identity related to NCAA divisional
differences. Journal of College Student Development, 59(3), 376-381.
Klasen, S. A. (2016). An examination of the athletic identity, identity foreclosure, and career
maturity of Division I collegiate student-athletes in nonrevenue-producing sports.
Lamont-Mills, A., & Christensen, S. A. (2006). Athletic identity and its relationship to sport
participation levels. Journal of Science and Medicine in Sport, 9(6), 472-478.
Marcia, J. (2009). Life Transitions and Stress in the Context of Psychosocial Development.
Handbook of Stressful Transitions Across the Lifespan, 19-34. Marcia, J. E. (1966). Development and validation of ego-identity status. Journal of Personality and
Social Psychology, 3, 551-558. Marcia, J. (1966). The ego identity status approach to ego identity. Ego Identity, 3-21.

Kentucky SHAPE Journal Vol. 58 No. 1 52
Markus, H., & Nurius, P. (1986). Possible selves. American psychologist, 41(9), 954.
Martin, J. J., Mushett, C. A., & Eklund, R. C. (1994). Factor structure of the athletic identity
measurement scale with adolescent swimmers with disabilities. Brazilian International
Journal of Adapted Physical Education Research, 1, 87-99.
Murphy, G. M., Petitpas, A. J., & Brewer, B. W. (1996). Identity foreclosure, athletic identity, and
career maturity in intercollegiate athletes. Sport Psychologist, 10, 239-246.
NAIA (2015). 2015-2016 NAIA football participating schools. Retrieved from
http://naia.org/ViewArticle.dbml?DB_OEM_ID=27900&ATCLID=205323224
NAIA Honors (2019). Retrieved from http://www.naiahonors.com/hall-of-fame
NCAA (2020). Our three divisions. Retrieved from http://www.ncaa.org/about/resources/media-
center/ncaa-101/our-three-divisions
Oregon, E. M., (2010). An Examination of Athletic Identity and Identity Foreclosure among Male
Collegiate Student-Athletes. Graduate Theses and Dissertations.
Parham, W. D. (1993). The Intercollegiate Athlete A 1990s Profile. The counseling
psychologist, 21(3), 411-429.
Pascarella, E.T., Truckenmiller, R., Nora, A., Terenzini, P.T., Edison, M. & Hagedom, L.S., (1999).
Cognitive impacts of intercollegiate athletic participation. The Journal of Higher Education,
70, 1-26.
Policy Questions on the Department of Education’s 2007 Guidance on Collecting, Maintaining and
Reporting Data by Race and Ethnicity. (Ed. October 2008). Retrieved from
http://www2.ed.gov/policy/rschstat/guid/raceethnicity/questions.html
Torres, V., Jones, S. R., & Renn, K. A. (2009). Identity development theories in student affairs:
Origins, current status, and new approaches. Journal of College Student
Development, 50(6), 577-596. Waterman, A. S. (1993). Developmental perspectives on identity formation: From adolescence to
adulthood. In J. E. Marcia, A. S. Waterman, D. R. Matteson, S. L. Archer, & J. L. Orlofsky
(Eds.), Ego identity: A handbook for psychosocial research (pp. 42-68). New York:
Springer-Verlag. Weight, E. A., & Huml, M. R. (2016). Education Through Athletics. Journal of Intercollegiate
Sport, 9(2), 352-378.
Whipple, K. R. (2009). Athletic identity, identity foreclosure, and career maturity: An investigation
of intercollegiate athletes. Graduate Theses and Dissertations. Paper 10492.
Who We Are (2019) Retrieved from.http://www.ncaa.org/about/who-we-are

Kentucky SHAPE Journal Vol. 58 No. 1 53
(Peer Reviewed Article)
Safety Concerns in Football: A Systemic Review on the Protocol of Return to
Play after Concussion
Alexis Smith, Morehead State University
Steve Shih-Chia Chen, Morehead State University
Gina Gonzalez, Morehead State University
Beau Braden, Bellarmine University Abstract
The purpose of this article was two-fold: (1) to address and highlight the standards of concussion
management protocol provided by the NATA, CDC and major sports governing bodies, and (2) to
examine how concussion protocols of different levels of athletic programs and organizations adhere
to the proposed guidelines and standards. According to the literature, an ideal concussion
management plan must cover elements such as: concussion education, responsibility and
information about student athletes’ self-reporting signs and symptoms, policy and rules on
restricting activities of athletes who are diagnosed with a concussion, requirements and procedures
for diagnosis of a concussion and clearance before returning to play (RTP), baseline testing for
athletes, return to learn guidelines, and a stepwise RTP progression. The results of our analysis
revealed that most of the programs had complied with the NATA concussion treatment protocol and
standards, particularly on the element of the stepwise progression RTP protocol. Implications and
practical suggestions are discussed to help improve existing protocols to better serve injured
athletes and protect all athletes from further exposure to sport related concussions (SRC).
Introduction
American football is one of the most popular and prominent sports in the United States (Sage,
Eitzen, & Beal, 2019). Boys begin playing football at a young age and many aspire to play at the
collegiate and professional levels. Football leagues for kids around the country remain popular with
variations such as flag football, youth football, interscholastic football, and/or pop warner leagues
(Kahler, 2016). Despite being the most popular high school sport in the country, the number of kids
participating in football at the community and youth level has seen a gradual decrease in recent
years (Sage et al., 2019). The discovery of chronic traumatic encephalopathy (CTE), a progressive
degenerative disease caused by suffering repeated concussions and traumatic brain injuries, has
resulted in serious concern about players’ safety in the sport of football (Reiter, 2015; Sage et al,
2019). Due to the high speed actions, size of the players, and full-contact nature of the sport,
football carries a substantial risk of injury. Undoubtedly, head injuries, specifically concussions,
have been a growing concern surrounding the game of football and have become an important
discussion in the sports world (Kluger, 2011, Gregory, 2014). The autopsy findings of Dr. Bennet
Omalu on deceased professional football players, had generated public attention about the impact of
concussions associated with playing football (Gregory, 2020; Reiter, 2015). Head injuries can have
long-lasting impacts on athletes for years down the road, ultimately affecting quality of life.
Concussion have been linked to early onset dementia, chronic traumatic encephalopathy (CTE),
personality changes, mood swings, and even suicides (Mayo Clinic, 2019; Taylor, 2015).

Kentucky SHAPE Journal Vol. 58 No. 1 54
Head Injuries in Football
It is estimated that 1.6 to 3.8 million concussions occur in sports and recreational activities annually
(Daneshvar, Nowinski, McKee, & Cantu, 2011). Between 2001 and 2009, emergency room visits
for brain injuries increased up to 62% (Daneshvar et al., 2011; Daytalys Center, 2009; Kerr, Simon,
Grooms, Roos, Cohen, & Dompier, 2007). Among females ages 10-19, the most common causes
for concussion-related head injuries were soccer, basketball and bicycling (Daneshvar et al., 2011).
Football was the most common cause of concussions for all male athletes for all ages (Gessel,
Fields, Collins, Dick, & Comstock, 2007; Datalys Center 2009). More than a half million
concussions in the U.S. were sustained by children who played tackle football (Datalys Center,
2009). It was estimated that concussions accounted for nearly 15% of sports related injuries in high
school athletics. Since 1997, at least 50 high school or younger football players in more than 20
states have died due to poor concussion management after experiencing serious head injuries on the
field (Kerr et al, 2007).
At the collegiate level, the rate of football-related head injuries might seem less severe;
nevertheless, the risk is still high and alarming (Inside Higher Ed, 2012). The overall injury rate in
the National Collegiate Athletic Association (NCAA) football was 8.1 injuries per 1,000 athlete
exposures, and concussions alone accounted for 7.4% of all injuries (NCAA, 2009). Players are
seven times more likely to get hurt during a game than in practice (NCAA, 2009). From 2004-2009,
there were no fatalities from direct catastrophic injuries; however, 11 deaths were caused by the
complication of sustaining repeated head trauma (Datalys Center, 2009).
Many sports carry the risk of concussions and other head injuries. However, football is potentially
the most dangerous sport when it comes to concussions, due to its highest rates of concussions and
brain injuries among collegiate sports (Datalys Center, 2009; Kerr et al, 2007). For these reasons,
the goals of this review are to: (1) discuss and highlight the standards of concussion management
protocol provided by the NATA, CDC and major sports governing bodies, and (2) examine how
concussion protocols for different levels of athletic programs and organizations (n = 10) adhere to
the proposed guidelines and standards.
The NATA Management of Sport Concussion Position Statement
To understand how to manage concussions, one must know the definition of concussions, pathology
of their occurrence, and procedures for treating the concussions (AANS, n.d.; Baugh, Kroshus,
Stamm, Daneshvar, Pepin, & Meehan, 2016; McCrory et al, 2012). Concussion, or mild traumatic
brain injury, is described as a traumatic brain injury (TBI) that is induced by a force that’s
transmitted to the head from a direct or an indirect impact, resulting in rapid acceleration and then
deceleration of the brain (Broglio et al, 2014; CDC, 2019). The sudden change in cerebral velocity
elicits neuronal shearing, which causes changes in ionic balance and metabolism (Broglio et al.,
2014). Signs of a concussion may include memory problems, confusion, dizziness, headache,
double vision, nausea or vomiting, sensitivity to light or noise and many other issues (AANS, n.d.;
Asken, Snyder, Clugston, Gaynor, Sullan, & Bauer, 2017; Ontario Neurotrauma Foundation, 2018).

Kentucky SHAPE Journal Vol. 58 No. 1 55
Athletic Trainers (ATs) are licensed medical professionals who receive both clinical and
comprehensive educational instruction in concussion management. ATs are usually the frontline
personnel who respond to identify and evaluate injured athletes (Broglio et al., 2014; Notebaert &
Guskiewicz, 2005). Therefore, ATs play a huge role in concussion management and the return to
play (RTP) process. It is recommended that ATs should be present at all levels of play and work
closely alongside a physician to develop and implement a concussion management protocol
(Broglio et al 2014; McCrory et al, 2012).
Most ATs rely on clinical examination or symptom checklists to evaluate athletes with concussion,
and decide whether to return an athlete to play (Notebaert & Guskiewicz, 2005). Additional
methods for making a return-to-play decision also include the use of the return-to-play guidelines.
The National Athletic Trainer’s Association’s (NATA’s) Management of Sport Concussion position
statement, which advocated using symptom and procedure checklists to determine student-athletes’
condition for return to play, was perceived as the best practice guidelines for managing sports
related concussions (Alla, Sullvian, McCrory, & Hale, 2011; Broglio et al., 2014; McCrory et al,
2012; Notebaert & Guskiewicz, 2005). During the early introductory stage of the Concussion
position statement, only 3% of certified athletic trainers surveyed used a multifaceted objective
assessment battery (Notebaret & Guskiewicz, 2005. A more recent study indicated that over 60% of
ATs working in small or mid-size athletic programs at the NCAA Division II and III level, adopted
multifaceted objective tests to track concussion symptoms at different stages (Buckley & Kelly,
2015). In addition, over 80% of schools reported using a graded exercise protocol before return to
play (Buckley & Kelly, 2015).
In addition to standard guidelines for testing and monitoring student-athletes’ baseline and
recovery, this statement also provided athletic trainers, healthcare professionals, and administrators
information, such as concussion education, basic strategies for injuries prevention, and proper
documentation for legal concerns (Alla et al., 2011). Following is a brief introduction and
description of each of the major components covered in the NATA’s concussion management
statement.
Concussion Education
Prior to each football season, the sports medicine staff, coaches, and the administrators should
review the current institutional concussion protocol and policies/procedures established under the
guidelines of NATA. In general, the protocol should cover injury definition, signs and symptoms,
and concussion management procedures (Broglio et al., 2014). ). Data has shown that athletes have
limited knowledge in regard to concussion symptoms and non-reporting of concussion symptom
rates were astonishingly high (Broglio et al 2014; Wallace, Covassin, Nogle, Gould, & Kovan,
2017).
Athletes who are not aware of the signs and symptoms of a concussion would likely continue to
play and aggravate brain injuries. As part of an effective education program, the concussion
protocol as well as prevention, recognition and referral, returning to play, physical and cognitive
restrictions, and consequences of improper concussion management, should be communicated and
made readily available to coaches, athletes, parents, administrators, and other appropriate healthcare

Kentucky SHAPE Journal Vol. 58 No. 1 56
professionals. When properly implemented, these educational programs have shown to be effective
(Alla et al., 2011: Broglio et al, 2014).
Baseline Testing, Evaluation, and Diagnosis
The NATA strongly recommends choosing a concussion-assessment model covering objective
baseline and post-injury testing (Broglio et al., 2014). When selecting a concussion management
protocol and evaluation, all members of the sports medicine team should be involved and obtain
approval from the athletic administrators (Broglio et al 2014). Most appropriate concussion
protocols and assessment tools should be easily utilized in both the clinical setting and on the field.
Once the testing protocol has been chosen, each athlete will be examined in an appropriate
environment that is designed to amplify test performance. Tests should be able to be easily
reproduced in the post-injury setting (Broglio et al., 2014; Ontario Neurotrauma Foundation, 2018).
Ideally, all athletes, especially adolescents whose brains are still developing, should go through an
annual pre-season baseline testing procedure. The purpose of baseline testing is to obtain a
representation of the athlete’s brain function at an uninjured state, with the intention of assisting the
clinician if a TBI is incurred. Baseline testing covers clinical history, medication, physical and
neurologic evaluations, measures of motor control, neurocognitive function, and pre-injured self-
reported symptoms (Erdal, 2012; Randolph, 2011). At minimum, athletes who are at a high risk of
concussion based on their sport, should be screened. Since baseline data from group testing has not
been available and well-identified, individual baseline testing becomes more critical and necessary.
If an athlete has a past concussion history or has a condition(s) such as attention-deficit
hyperactivity disorder (ADHD), the individual would be more susceptible to aggravate the
concussive impact (Broglio et al., 2014). To ensure baseline data is accurately obtained, athletes
should not undergo any baseline testing, if they are injured, ill, or physically and/or mentally
fatigued (Erdal, 2012).
Players suspected to have sustained a concussion during competition or practice, or are exhibiting
any concussion-like symptoms, should be removed from activity immediately. Once removed from
the activity, their mental status should be regularly monitored and checked (Broglio et al., 2014;
Ontario Neurotrauma Foundation, 2018). Most of the time, patients are sent home with post-injury
instructions, but if there is a significant decline in mental status, this could reflect severe trauma and
warrant transport to a medical facility. Diagnosis of a concussion would then be made through a
clinical evaluation by a trained medical professional. Additional assessments with several useful
tools are often used to assist the clinicians for monitoring the recovery progress. If a concussion
diagnosis is made, the participant should not be allowed to return to physical activity until they are
cleared by a physician (Broglio et al., 2014; Wallace et al., 2017).
Objective baseline and post-injury information collected during different stages are important
because they increase the sensitivity and utility of various tests (Broglio et al 2014; Randolph,
2011). Once a concussion diagnosis has been made, the patient should undergo daily check-ins to
monitor the course of recovery. The emphasis of post-injury management covers the cessation of
symptoms, restoration of motor control, and return of neurocognitive function to the pre-injury
levels (Broglio et al., 2014). It is essential to instruct the athletes and coaches about post-injury

Kentucky SHAPE Journal Vol. 58 No. 1 57
recovery protocol. During the acute phases of recovery, the athlete should avoid all physical activity
and limit cognitive activity, so that concussion symptoms are not worsened. However, evidence has
shown that support for active recovery is growing and deserves consideration (Leddy, Wilber, &
Willer, 2018).). Table 1 lists many assessment tools and their function for monitoring athletes’
recovery in post-injury management. These tools are used in a recovery protocol as well as the
pretesting and baseline testing. However, none of them can be used alone as a solo diagnostic tool
or a standard tool for determining the athletes’ concussion Some of these tools are often used for
post-injury testing to collect meaningful data for comparisons. When the patient reports zero
symptoms, then their objective assessments should be repeated and compared with their baseline
testing results (Asken et al., 2017; Broglio et al., 2014).
Table 1. Key elements of various diagnostic tests (Baugh et al., 2015; Broglio et al, 2014; Erdal,
2012; Mack et al., 2019; Randolph, 2011)
Test Function
Self-Report Symptom
Assessment
A test with great sensitivity that uses symptom checklists or scales to
assess symptom duration or severity.
Measurement of motor
control
Documenting changes in gait, postural control, and hand movement.
ImPACT A neuropsychological testing used for baseline testing.
Balance Error Scoring
System (BESS)
A sensitive and economical evaluation on overall postural control
(balance). The test is highly portable and can be administered with
minimum training.
Standardized
Assessment of
Concussion (SAC)
A five-minute screening test on mental status used at the sideline. It
assesses orientation, immediate memory, concentration, and delayed
recall. The test’s sensitivity declines after twenty-four hours. It should be used in combination with a motor-control evaluation and
symptom assessment.
Ocular test (Vestibular
ocular motion
screening, VOMS)
The VOMS is a screening tool developed to detect signs and
symptoms of a concussion. It examines the systems responsible for
integrating balance, vision, and movement.
Self-reporting of symptoms is a highly recommended procedure of concussion management,
because the collected data at the baseline and post injuries stage are the primary measures used to
proceed to the next stage of the recovery (Broglio et al., 2014). The decision-making process for
return to play should not start until the patient no longer reports concussion-related symptoms, has a
normal clinical examination, and achieves at or above pre-injury levels on neurocognitive function
and motor control (Asken et al., 2017; Broglio et al 2014). During the entire recovery process, the
ATs should closely communicate with the physician and ensure the athletes’ recovery is
progressing normally (Broglio et al., 2014).
Return To Play (RTP) and Other Considerations
Because everyone reacts to a concussion differently, there is no definite time that guarantees a full
recovery. Athletes should not progress to the RTP stage until they are symptom free and able to
perform at or above their pre-injury levels of functioning on all objective concussion assessments

Kentucky SHAPE Journal Vol. 58 No. 1 58
(Broglio et al., 2014). There should be a minimum of 24 hours between each of the seven
progression steps of the RTP protocol (see Table 2) (Broglio et al, 2014). At any stage of the RTP
protocol, if the participant complains of symptoms or shows a decline in their testing/assessment
performance, the participant should stop their tasks and activities immediately. Subsequent attempts
should be given at a minimum of twenty-four hours later (Asken et al., 2017; Broglio et al., 2014).
Table 2. Seven steps of the RTP protocol
Step 1 No activity
Step 2 Light exercise. No greater than 70% age predicted max heart rate
Step 3 Sport specific activities w/ no contact
Step 4 Non-contact training involving others and resistance training
Step 5 Unrestricted training
Step 6 Return to play
Cognitive rest is just as important as physical rest. Cognitive rest refers to limiting academic and
cognitive stressors (i.e., reading, writing, mathematics, and computer analytic work) in daily
activities (Broglio et al 2014). The goal of cognitive rest is to keep the brain from engaging in
stressful mental tasks that may aggravate concussive symptoms. Cognitive dysfunctions such as
slow processing speed and reaction time were documented on a number of concussed individuals
(Williamson, Norte, Broshek, Hart, & Resch, 2018). These dysfunctions hindered student-athletes’
performance in school and prolonged the recovery process (Williamson et al., 2018). Students
recovered from the concussion have reported difficulty with learning and dealing with anxiety in
school. Therefore, in addition to focus on RTP, research also continues to explore on the return to
learn (RTL) practices as well. The existing RTL protocol addresses academic accommodations such
as a temporary adjustment to an individual’s learning environment and education plans (Williamson
et al., 2018). In collegiate athletics, the ATs also monitor the RTL protocol of the patients. The
stepwise progression includes: (1) remain at home or in a residence hall, if the student-athlete can’t
tolerate light cognitive activity, (2) allow student-athletes to return to the classroom once they are
able to tolerate cognitive activity without exhibiting concussion symptoms, and (3) allow a gradual
increment of cognitive and learning activities as student-athletes return to the baseline level of their
cognitive function (NCAA Sports Science Institute, 2017).
General Contents of Studied Concussion Management Protocols
As the governing body of all high school state athletic federations, the National Federation of State
High School Federation (2015) had created an updated clear concussion management standards and
guidelines for member schools to utilize. These guidelines were set forth to be administered and
implemented by the member schools. Its stepwise RTP protocol specifically followed the
“Consensus Statement on Concussion in Sport” given by the Center for Disease Control and
Prevention (CDC, 2015).
In 2010 the NCAA put forth the “Inter-association Consensus: Diagnosis and Management of
Sport-Related Concussion Guidelines” to all affiliated institutions, and requested that each submited
its concussion safety protocol to the committee by May 1 of each year (Baugh et al 2016). The
protocol should include: (a) policies and procedures that meet the requirements of the constitution,
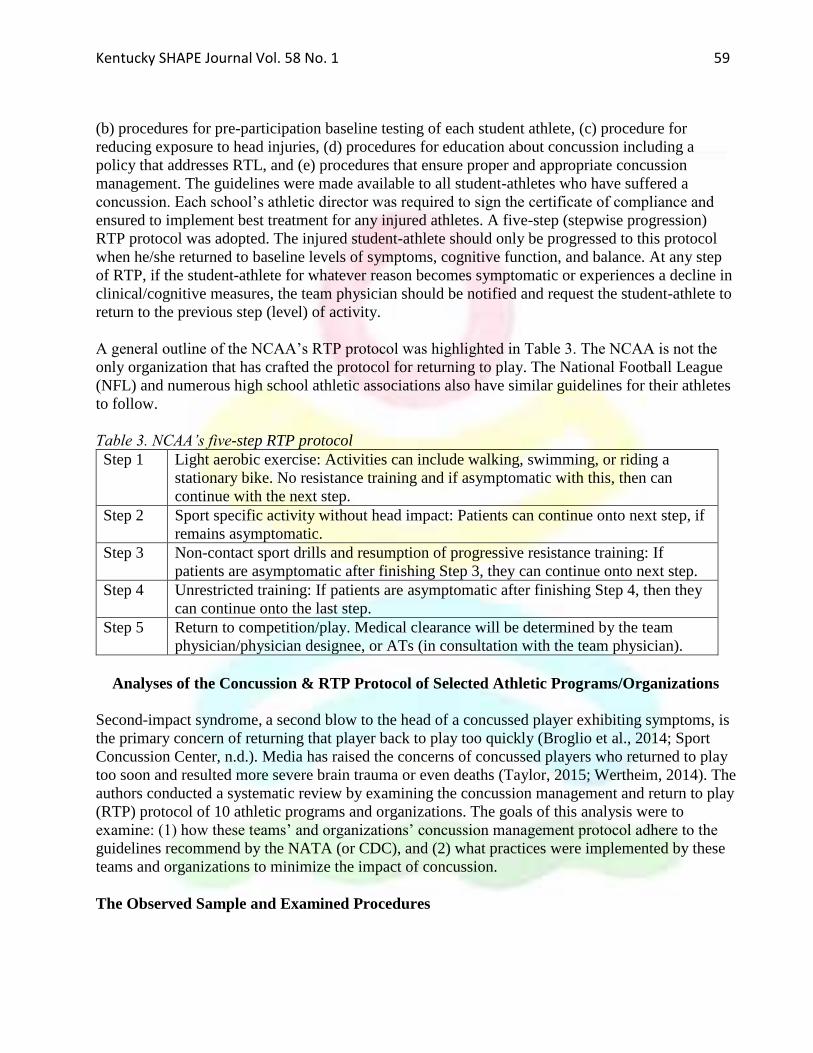
Kentucky SHAPE Journal Vol. 58 No. 1 59
(b) procedures for pre-participation baseline testing of each student athlete, (c) procedure for
reducing exposure to head injuries, (d) procedures for education about concussion including a
policy that addresses RTL, and (e) procedures that ensure proper and appropriate concussion
management. The guidelines were made available to all student-athletes who have suffered a
concussion. Each school’s athletic director was required to sign the certificate of compliance and
ensured to implement best treatment for any injured athletes. A five-step (stepwise progression)
RTP protocol was adopted. The injured student-athlete should only be progressed to this protocol
when he/she returned to baseline levels of symptoms, cognitive function, and balance. At any step
of RTP, if the student-athlete for whatever reason becomes symptomatic or experiences a decline in
clinical/cognitive measures, the team physician should be notified and request the student-athlete to
return to the previous step (level) of activity.
A general outline of the NCAA’s RTP protocol was highlighted in Table 3. The NCAA is not the
only organization that has crafted the protocol for returning to play. The National Football League
(NFL) and numerous high school athletic associations also have similar guidelines for their athletes
to follow.
Table 3. NCAA’s five-step RTP protocol
Step 1 Light aerobic exercise: Activities can include walking, swimming, or riding a
stationary bike. No resistance training and if asymptomatic with this, then can
continue with the next step.
Step 2 Sport specific activity without head impact: Patients can continue onto next step, if
remains asymptomatic.
Step 3 Non-contact sport drills and resumption of progressive resistance training: If
patients are asymptomatic after finishing Step 3, they can continue onto next step.
Step 4 Unrestricted training: If patients are asymptomatic after finishing Step 4, then they
can continue onto the last step.
Step 5 Return to competition/play. Medical clearance will be determined by the team
physician/physician designee, or ATs (in consultation with the team physician).
Analyses of the Concussion & RTP Protocol of Selected Athletic Programs/Organizations
Second-impact syndrome, a second blow to the head of a concussed player exhibiting symptoms, is
the primary concern of returning that player back to play too quickly (Broglio et al., 2014; Sport
Concussion Center, n.d.). Media has raised the concerns of concussed players who returned to play
too soon and resulted more severe brain trauma or even deaths (Taylor, 2015; Wertheim, 2014). The
authors conducted a systematic review by examining the concussion management and return to play
(RTP) protocol of 10 athletic programs and organizations. The goals of this analysis were to
examine: (1) how these teams’ and organizations’ concussion management protocol adhere to the
guidelines recommend by the NATA (or CDC), and (2) what practices were implemented by these
teams and organizations to minimize the impact of concussion.
The Observed Sample and Examined Procedures

Kentucky SHAPE Journal Vol. 58 No. 1 60
Ten organizations whose concussion management protocols under this systematic review included
four high school state federations, five NCAA affiliated members (three Division-I, one Division-II
and one Division-III institutions), and one professional league (NFL). These organizations were
chosen in a convenience fashion and were selected based on following: (1) their locations were
geographically close to the research team’s affiliated institution, (2) the authors had a unique tie or
relationship with the selected organization (i.e., having a fellow athletic trainers working there or
has worked with the organization before), (3) these organizations represented each level of play
(including high schools, major collegiate and small collegiate programs, and professional
organizations).
Each member of the research team was assigned to summarize the concussion management protocol
of selected organizations. All used Google.com with the following key words to locate the protocol
documents: (1) name of the organization, (2) athletics, (3) concussion management protocol, and
(4) return to play. When the summaries were completed, all authors would individually go over all
ten protocols and review each other’s summaries for accuracy based on the protocols posted online.
It was noted that each online protocol contained the most updated current information provided by
the institutions or organizations during the period of analysis. Each of the observed collegiate
institutions and high schools affiliated with the observed state federations had at least one athletic
trainer confirm the program’s maximum effort in concussion management protocol compliance.
A summary table covering the available contents in six specific areas of management protocol were
created based on a consensus agreement among all members of the research team (please refer to
Table 4). The detailed descriptions of all ten protocols were shown in Appendix A. Four high
school organizations in this study sample had adopted CDC’s recommendations as primary
guidelines. The following summary table (Table 4) displayed how each organization’s protocol
complied with the six content-areas of the gold standard set by the NATA.
Table 4. Illustration of various organizations’ compliance to the NATA position statement
Organization Concussion
Education
Responsibility to
Report
Signs/Symptoms
Physician
Clearance
Baseline
Testing
RTL
Considerations
Adoption
of a
Stepwise
RTP
Protocol
HS1
HS2
HS3
HS4
U1
U2
U3
U4

Kentucky SHAPE Journal Vol. 58 No. 1 61
U5
NFL
N/A
HS= High School; U = College/University; NFL = National Football League
*Note: All organizations have a stepwise progressive protocol for RTP; however, the strenuous
level and depth of the stepwise program may vary.
Discussion and Conclusions
There were both similarities and differences in all the concussion protocols among ten observed
organizations. All of them generally followed the guidelines set by the NATA, CDC, and their
primary governing bodies closely; however, some of the protocols were simpler and vaguer than the
others in certain sections. Differences in the RTP protocols were found with duration ranging from
four, five, or seven days long. Ideally, it was recommended all concussion protocols should include
all six listed elements: (1) concussion education, (2) responsibility for the diagnosed student
athletes to report their concussion signs and symptoms, (3) requirements for receiving clearance
from a physician before returning to play, (4) baseline testing for athletes in high risk sports, (5)
return to learn (RTL) guidelines, and (6) a stepwise RTP protocol (Baugh et al., 2016). In general,
most of the entities had adhered to the NATA concussion treatment protocol and standards.
Baseline Testing and Considerations for Return to Learn were two criteria requiring better
conformity. As for the Return to Play protocol, all organizations have their own stepwise
progressive measures; however, the strenuous level and depth of the program may vary. Eight of
the ten RTP protocols followed a five-step progression. University 1’s progression had an
additional step between light aerobic exercise and sport-specific activity to ensure that the
recovered athlete was truly ready to move on to more rigorous activity. In University 2’s four-step
progression protocol, after the non-contact practice phase, it allowed the player to engage in full
contact activity with no restrictions. However, it was hard to know if the individual was to return
for competitions. Research suggested it was safer for the player to engage in a full-contact practice
or simulation before they were released to full activity and competition (Broglio et al., 2014). In
addition, University 2 might need to expand the contents of concussion management protocol by
inserting more guidelines on RTL. Typically, three of the four high school protocols had relatively
less information addressing the specificities of baseline testing. Only High School Federation 4,
showed more contents in baseline testing in its protocol. The authors wondered if budget
limitations precluded most of the high schools from conducting thorough in-house baseline testing.
The NFHS may need to create amendments to address this topic in its existing 2017 guidelines for
management of concussion sports.
All reviewed collegiate concussion protocols met the recommendations in all six criteria from the
NATA and NCAA, except University 2. University 2’s online protocol was not very clear and had
no mention of doing any concussion education for all athletes and related personnel. It did not
address the responsibility of athletes to report any signs or symptoms. Nor did it discuss any RTL
criteria or considerations.
Studies has shown the difficulties in identifying how various athletic programs and organizations
adhere to the NATA standards and guidelines for managing concussions (Notebaret & Guskiewicz,

Kentucky SHAPE Journal Vol. 58 No. 1 62
2005; Buckley & Kelly, 2015). Due to the small size of the review sample and limited surveyed
information from the ATs, this review cannot be seen as a study of various organizations’
compliance level. Nevertheless, when institutions are willing to post and update their concussion
management protocol online and make the information available, this practice begins to show the
good faith and the transparency in dealing with the concussion issue and serving the student-
athletes with the best medical care.
Even with little research investigating in RTL progression, the NCAA deemed this topic as a
necessary component in a concussion management protocol for athletes recovering from a head
injury. The NCAA recommended a stepwise progression for RTL, as for RTP as well. The student’s
cognitive recovery and integration back into learning should be as important as (if not more
important than) safe integration into their sport participation
Youth sports and high school programs typically don’t have the resources for sophisticated baseline
testing and sideline support of medical personnel. However, it was encouraging to witness the
observed HS state federations all implemented a concussion management protocol following the
guidelines provided by the NATA and CDC. The individual schools also need to deal with
exceptional challenges in implementing these policies. Across the board, high school players are
not as strong and athletic as college players. Many young athletes are still developing physical and
mentally in their high school careers, so traumatic head injuries could be even more damaging.
Medical professionals, whether it is an athletic trainer or doctor, may not be easily available for
practices and competitions as in the collegiate and professional setting. In the authors’ opinions, the
rules and guidelines recommended by the NFHS and the state athletic associations should be as
stringent as those of colleges and universities, if not more so. They should be clear and concise
enough to be understood and followed by non-medical professionals, such as parents, coaches, and
administrators. However, additional consideration should be given to which aspects of concussion
management can be handled by the non-medical professionals. The practice is highly important
since there is a risk and liability issue when involving the non-medical professionals managing the
RTP protocols and baseline testing. The education program for understanding various aspects of
concussion must be effectively delivered to students and parents. It would be wise to look into some
economic baseline testing options (i.e., SCAT 5, which can be done by pen and paper) to ensure
safety of the athletes.
Conclusions
This systemic-review was an evaluation of a small size of sample’s (n = 10) concussion protocols at
four levels of competition (high school, small colleges, Division-I institutions, and the NFL).
Although the sample might not be the true representation of concussion protocols of all programs, it
was promising that schools and organizations had adopted the recommended guidelines and
standards set by the NATA, CDC, and their primary governing body. It was also apparent that some
protocols were updated annually. All institutions should ensure the concussion management
protocol is updated to provide the best medical care to their athletes. Every school and organization
should implement the standards and best practices set by the NATA and CDC. All concussion
management protocols should cover the six examined elements in the study as well. Failure to carry
out the standards or protocol procedures could result in a detrimental sport related concussion.

Kentucky SHAPE Journal Vol. 58 No. 1 63
References
AANS (n.d.). Concussion. https://www.aans.org/en/Patients/Neurosurgical-Conditions-and-
Treatments/Concussion
Alla, S., Sullivan, S. J., McCrory, P., & Hale, L. (2011). Spreading the word on sports concussion:
Citation analysis of summary and agreement, position and consensus statements on sports
concussion. British Journal of Sports Medicine, 45(2):132-135. doi:
10.1136/bjsm.2010.074088.
Asken, B. M., Snyder, A. R., Clugston, J. R., Gaynor, L. S., Sullan, M. J., & Bauer, R. M. (2017).
Concussion-like symptom reporting in non-concussed collegiate athletes. Archives of
Clinical Neuropsychology, 32(8), 963–971. https://doi.org/10.1093/arclin/acx018
Baugh, C. M., Kroshus, E., Stamm, J. M., Daneshvar, D. H., Pepin, M. J., & Meehan, W. P. (2016).
Clinical practices in collegiate concussion management. The American Journal of Sports
Medicine, 44(6), 1391–1399. https://doi.org/10.1177/0363546516635639
Broglio, S. P., Cantu, R. C., Gioia, G. A., Guskiewicz, K. M., Kutcher, J., Palm, M., & Mcleod, T.
C. V. (2014). National Athletic Trainers Association position statement: Management of
sport concussion. Journal of Athletic Training, 49(2), 245–265. doi: 10.4085/1062-6050-
49.1.07
Buckley, T. A., Burdette, G., & Kelly, K. (2015). Concussion-management practice patterns of
National Collegiate Athletic Association Division II and III athletic trainers: How the other
half lives. Journal of Athletic Training, 50(8), 879–888. doi: 10.4085/1062-6050-50.7.04
Center for Disease Control and Prevention. (2015). Managing Return to Activities: Information for
Healthcare Professionals. http://www.cdc.gov/headsup/providers/return_to_activities.html
Center for Disease Control and Prevention. (2019). Concussion information sheet.
http://www.cdc.gov/headsup/pdfs/youthsports/parent_athlete_info_sheet-a.pdf
Daneshvar, D. H., Nowinski, C. J., McKee, A. C., & Cantu, R. C. (2011, January). The
epidemiology of sport-related concussion. Clinical Sports Medicine, 30(1), 1–17.
doi: 10.1016/j.csm.2010.08.006. https://www.ncbi.nlm.nih.gov/pmc/articles/PMC2987636/
Datalys Center for Sports Injury and Prevention (2009). Football injuries: Data from 2004/05 to
2008/09 seasons. www.datalyscenter.org
Erdal, K. (2012). Neuropsychological testing for sports-related concussion: How athletes can
sandbag their baseline testing without detection. Clinical Neuropsychology, 27(5), 473–479.
DOI: https://doi.org/10.1093/arclin/acs050
Gessel, L. M., Fields, S. K., Collins, C. L., Dick, R. W., & Comstock, D. (2007). Concussions
among United States high school and collegiate athletes. Journal of Athletic Training, 42(4):
495–503.
Gregory, S. (2020, February 3). Is it unethical to watch football with my son? Time, 195(3), 26-27.
Guskiewicz, K. M., Bruce, S. L., Cantu, R. C., Ferrara, M. S., Kelly, J. P., McCrea, M., Putukian,
M., & Valovich McLeod, T. C. (2004). National Athletic Trainers' Association position
statement: Management of sport-related concussion. Journal of Athletic Training, 39(3),
280–297.
Inside Higher Ed (2012). Despite NCAA efforts, concussion rates hold steady.
http://www.insidehighered.com/quicktakes/2012/09/24/despite-ncaa-efforts-concussion-
rates-hold-steady

Kentucky SHAPE Journal Vol. 58 No. 1 64
Jim (2017, June 20). NFL head, neck and spine committee's concussion diagnosis and management
protocol. https://www.playsmartplaysafe.com/focus-on-safety/protecting-players/nfl-head-
neck-spine-committees-protocols-regarding-diagnosis-management-concussion/
Kahler, K. (2016, September 19). The town that doesn’t tackle. Sports Illustrated, 125(9), 7-8.
Kerr, Z. Y., Simon, J. E., Grooms, D. R., Roos, K. G., Cohen, R. P., & Dompier, T. P. (2009).
Epidemiology of football injuries in the National Collegiate Athletic Association, 2004-2005
to 2008-2009. https://journals.sagepub.com/doi/pdf/10.1177/2325967116664500
Kluger, J. (2011). Headbanger nation. Concussions are clobbering U.S. kids. Here’s why. Time,
177(4), 42-51.
Leddy, J. J., Wilber, C. G., & Willer, B. S. (2018). Active recovery from concussion. Current
Opinion in Neurology, 31(6):681-686. doi: 10.1097/WCO.0000000000000611.
Mayo Clinic (2019, March 16). Concussion. https://www.mayoclinic.org/diseases-
conditions/concussion/symptoms-causes/syc-20355594
Mack, C., Myers, E., Barnes, R., Solomon, G., & Sills, A. (2019) Engaging athletic trainers in
concussion detection: Overview of the National Football League ATC spotter program,
2011–2017. Journal of Athletic Training, 54(8), 852-857.
McCrory et al. (2012). Consensus statement on concussion in sport: the 4th International Conference
on concussion in sport. British Journal of Sports Medicine, 47(5), 250-258.
doi:10.1136/bjsports-2013-092313
Murphy, A. (2016, August 31). Football's Endgame: What would happen if America's pastime
just ... died? https://www.si.com/nfl/2016/08/31/future-of-football-nfl-safety-concussions
National Federation of State High School Federation (NFHS) (2017). Suggested guidelines for
management of concussion sports.
https://www.nfhs.org/media/1018446/suggested_guidelines__management_concussion_apri
l_2017.pdf
NCAA Sports Science Institute. (2017, September 21). Concussion diagnosis and management best
practices. http://www.ncaa.org/sport-science-institute/concussion-diagnosis-and-
management-best-practices
Notebaert. A. J., & Guskiewicz, K. M. (2005). Current trends in athletic training practice for
concussion assessment and management. Journal of Athletic Training, 40(4), 320-325.
Ohio High School Athletic Association. (2014). Implementation of NFHS playing rules changes
related to concussion and concussed athletes and return to play protocol.
https://concussion.jmc.kent.edu/docs/gahanna.pdf
Ontario Neurotrauma Foundation. (2018). Guideline for concussion/mild traumatic
brain injury and persistent symptoms. (3rd ed.).
https://braininjuryguidelines.org/concussion/fileadmin/user_upload/Concussion_guideline_3
rd_edition_final2019.pdf
Optim Sports Medicine (2017). Athletic trainer (AT) concussion management protocol. Retrieved
from http://www.gobaronsgo.com/d/2017-18/Optim_Concussion_Protocol.pdf
Randolph, C. (2011). Baseline neuropsychological testing in managing sport-related concussion:
Does it modify risk? Current Sports Medicine Reports, 10(1), 21-26. doi:
10.1249/JSR.0b013e318207831d
Reiter, B. (2015, December 28). Brain trust. Sports Illustrated, 123(25), 29-34.
Sage, G., Eitzen, D. S., & Beal, B. (2019). Sociology of North American Sport (11th ed.). Oxford
University Press.

Kentucky SHAPE Journal Vol. 58 No. 1 65
Sports Concussion Center (n.d.). What is a sport concussion? www.sportsoncussioncenterky.com
Taylor, T. (2015, December 14). Brain and brawn. Sports Illustrated, 123(23), 74-79.
Tennessee Secondary School Athletic Association. (2019) Tennessee Secondary School Athletic
Association concussion policy. https://cms-files.tssaa.org/documents/tssaa/Concussion-
Policy-updated-12.2019.pdf
Wallace, J., Covassin, T., Nogle, S., Gould, D., & Kovan, J. (2017). Knowledge of concussion and
reporting behaviors in high school athletes with or without access to an athletic trainer.
Journal of Athletic Training, 52(3): 228–235. doi: 10.4085/1062-6050-52.1.07
Wertheim, L. J. (2014, December 8). Bully market. Despite its concussion controversy and rash of
off-field ills, the NFL casts a shadow that other leagues seem afraid to step out of. Sports
Illustrated. https://vault.si.com/vault/2014/12/08/bully-market
Williamson, C. L., Norte, G. E., Broshek, D. K., Hart, J. M., & Resch, J. E. (2018). Return to learn
after sport-related concussion: A survey of secondary school and collegiate athletic trainers.
Journal of Athletic Training, 53(10), 990–1003. doi: 10.4085/1062-6050-234-17

Kentucky SHAPE Journal Vol. 58 No. 1 66
Appendix A. Major contents of concussion management protocol of various levels Organization Contents
(HS1) Educational rulebook updated in April of 2012 was intended to distribute all to athletes,
parents, or coaches. The information mimicked the concussion statements provided by the
NFHS. No student should return to play on the same day a concussion occurs and after medical
clearance by a professional. The concussed student-athlete should follow a step-by-step
protocol for delayed reentry in his or her sport to make sure symptoms do not reoccur. This
state protocol covers logistics of handling a suspected concussion and diagnosis of a
concussion. The protocol also discusses the role of coaches and officials. The final section of
the protocol revolves around the six-step RTP protocol.
(HS2) This five-page Concussion Policy was consistent with guidelines of the NFHS as well. It made
clear that the education for all individuals involved in athletics in Tennessee was a clear
priority. All coaches needed to complete online trainings before the start of their season. The
protocol gave 10 responsibilities for officials and five for coaches to look for concussion
symptoms and remove any athlete exhibiting those symptoms. A lot of details covered
additional duties of obtaining clearance from a medical official, filing appropriate paperwork,
and informing the proper authorities. Neither the coach nor the official has any role at all in
diagnosing a concussion. The state Concussion Return to Play form must be filled out by a
medical professional in order for a student athlete to be cleared to return to athletic activity. The
RTP protocol followed a six-step (6-day) stepwise progression. The medical personnel would
gave one of the five recommendations on RTP.
(HS3) This 4-page concussion document did not read as much like a rule book. It was presented as
information to be understood by athletes, parents, and others associated with sporting activities
(with a signature requirement). Much of the information was provided in a Q&A format. The
list of rules was similar to those of NFHS. It required written authorization by medical
professionals to clear athletes to play. Concussion management contents covered symptoms, the
roles and responsibilities, medical official’s responsibility for the diagnosis and granting the
RTP decision. Surprisingly, the gradual RTP protocols were not displayed specifically in details
and information was just merely suggestions. The final part of the protocol was to be signed by
the athletes and their parents related to liability concerns about the severity and risks of
concussions. This protocol was easier to navigate than the HS1 protocol. The Q& A format is
informative and extremely presentable. The question and answer portion of the document gives
answers that are not found in the HS1. The last page asks for signatures from parents and
student athletes. It also provided links to the CDC and NFHS sites.
(HS4) The organization partnered with Optim Sports Medicine to develop the concussion protocol.
The diagnoses were made by clinicians who received CDC’s Heads Up Training. ATs
contracted at each school are responsible for dispersing and collecting all concussion
paperwork and awareness forms for all athletes and their parent/guardians. The
neuropsychological testing, ImPACT, was used for baseline testing. Sports Concussion
Assessment Tool (SCAT 5) was used for supplemental testing. Baseline testing is repeated
every two years at a minimum. Concussion evaluations are completed by an Optim athletic
trainer or other qualified healthcare professional (MD or PA). A general concussion handout
was given to the parent or guardian as well as the concussion evaluation and RTP form. ATs
would communicate with the school staff in regards to academic modifications for injured
students.
An athlete can only be cleared to begin the RTP progression while taking medication if cleared
by a physician. The RTP protocol follows five-steps procedures.
(U1) Education was given to all student-athletes and coaches on concussions in their pre-
participation medical package and video sessions annually. All student-athletes required to sign
a statement of accepting the responsibility of reporting their injuries, illnesses, and any signs or
symptoms of a concussion. Initial baseline ImPACT testing and baseline symptom assessment
were given. Athletes that show any signs, symptoms, or behavior of a concussion were
removed from activity immediately. The initial concussion evaluation included a symptom
assessment, a physical and neurological exam, cognitive assessment, balance exam, and a

Kentucky SHAPE Journal Vol. 58 No. 1 67
clinical assessment for any cervical spine trauma or a skull fracture. Standard concussion
management protocol would apply. The ATs and team physician in consultation with the
athlete would notify the coordinator for Student Disability Services and ADA Compliance for
academic support throughout the recovery process. Routine testing included a daily checklist of
symptoms that will be documented on the Sway balance mobile app, retest on ImPACT, and
retest on the Sway app every two to three days until the patients were fully returned to activity.
The physical activity progression can begin when the athlete became asymptomatic and post-
concussion testing was within normal limits compared to their baseline testing. U1
implemented a six-step stepwise RTP progression.
(U2) Athletes would go through baseline ImPACT and BESS (balance) testing. Any athlete who is
suspected of sustaining a concussion will be removed from activity immediately and a sideline
evaluation will be done to get an acute baseline of the athlete. The student-athletes are
monitored by ATs. If the athlete shows any signs of deterioration, then they will immediately
be referred to the emergency room. Daily symptom checklists must be filled out by the athletes,
when that they come into the athletic training room. When the athlete has been asymptomatic
for 24 hours, they would take ImPACT post-injury test and BESS testing for baseline
comparisons. The athletes can be sent to the team physician for evaluation and clearance after
their scores return to the baseline. U2 follows a 5-step RTP progression. No education
components are specifically highlighted.
(U3) All student-athletes, coaches, ATs and athletic directors are provided with the NCAA
Concussion Fact Sheet and required to sign an acknowledgement annually during their pre-
participation exams (PPE). All student-athletes go through at least one pre-participation
baseline concussion assessment. The pre-participation assessment includes the following: brain
injury and concussion history performed as part of the history portion of the PPE, symptom
evaluation (symptom score), cognitive assessment (ImPACT testing), and balance assessment
(Sway). U3’s University Sports Medicine team physicians with training in diagnosis, treatment
and initial management of acute concussion will be present at all NCAA competitions and
practices. The initial concussion evaluation will include a symptom assessment, physical and
neurological exam, cognitive assessment, and a balance exam. The return to learn portion of
concussion management will be implemented with the support of a multidisciplinary team
(including: faculty athletics representative (FAR), academic counselor, course instructor(s),
college administrators, disability resource center, and coaches). The RTP (Five step) plan will
be individualized and be supervised by someone from the sports medicine team, but the final
clearance to return to full activity will be determined by the team physician or their qualified
designee.
(U4) U4’s “Mild Traumatic brain Injury (MTBI) Evaluation and Return to Play Procedures” was a
detailed, seven-page document that laid out the process athletic trainers should implement in
diagnosing and treating a concussion and the protocol they must follow to help an athlete return
to competition. Baseline testing included the Balance Error Scoring System (BESS) and Impact
Testing. The management protocol also introduced concussion symptoms, warning signs for
taking drastic measures and instructions for what to do (both 15 minutes and 24 hours
following the injury). A U4’s Head Injury Warning Form should be given to the athlete who
has suffered the concussion. A set of return to learn guidelines were listed on the Athletics
Academic Accommodations webpage. There is a very organized six-step Return to Play
“Progression” in which a certified athletic trainer must sign off on every step for an athlete to
progress to the next step.
(U5) U5’s protocol was a three-page document. The first page contained the “Post-Concussion Care
Take Home Instructions.” It provided typical symptoms of the concussion and
recommendations for dealing with daily tasks. The second page is dedicated to the return to
play protocol. The clearance for returning to competition being the responsibility of the team
physician, which in U5’s case is a neurologist, is an additional step to add safety for their
student-athletes. The RTP protocol contained four phases. The protocol seemed to focus more
on the wellbeing of the students.
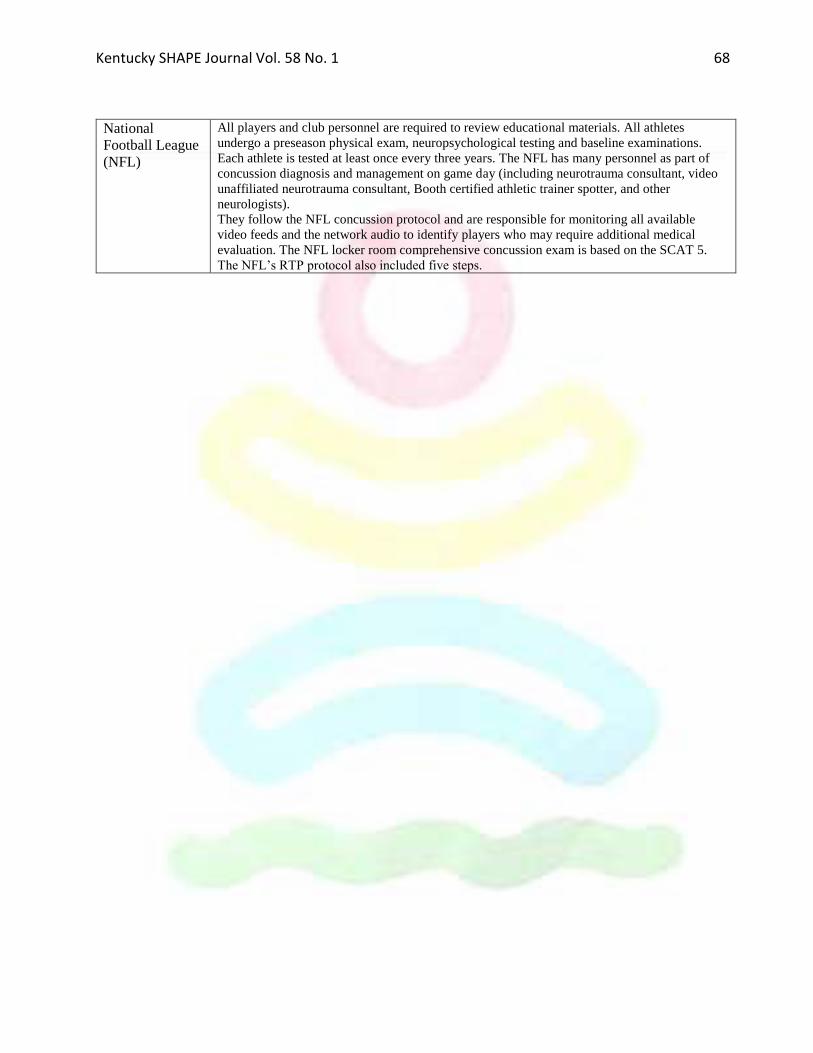
Kentucky SHAPE Journal Vol. 58 No. 1 68
National
Football League
(NFL)
All players and club personnel are required to review educational materials. All athletes
undergo a preseason physical exam, neuropsychological testing and baseline examinations.
Each athlete is tested at least once every three years. The NFL has many personnel as part of
concussion diagnosis and management on game day (including neurotrauma consultant, video
unaffiliated neurotrauma consultant, Booth certified athletic trainer spotter, and other
neurologists).
They follow the NFL concussion protocol and are responsible for monitoring all available
video feeds and the network audio to identify players who may require additional medical
evaluation. The NFL locker room comprehensive concussion exam is based on the SCAT 5.
The NFL’s RTP protocol also included five steps.

Kentucky SHAPE Journal Vol. 58 No. 1 69
(Peer Reviewed Case Study)
Role of the MCT-1 T1470A polymorphism (rs1049434) in the Uptake of Lactate
in Resistance Trained Females
Tailgating at College Campuses: A Sobering Dilemma
Steve Shih-Chia Chen, Morehead State University
William Salazar, N/A (Teaching abroad in Vietnam)
Kenneth Henderson, Morehead State University
Abstract
This case study addressed a regional public university’s challenges for offering on-campus social
activities to serve its student, an issue commonly faced by a “suitcase” school. Engaging students to
attend intercollegiate sports and pre-game tailgate parties is a common practice carried out by the
institutions. However, the potential risk of increasing excessive drinking and drunk driving cases by
students had become a serious concern of institutions’ administrators. Discussions and suggestions
are given on how to foster a safe and family-oriented social environment on campus, and effectively
minimize alcohol-induced problems.
Learning Objectives
Suggested Subject Area Competencies Focus Educational
Level
Tailgating Policies, Alcohol
consumption at collegiate
athletic events
Diversity, ethics,
decision making,
social responsibility
Sport Management Undergraduate,
Graduate, or
both
Introduction of the Case
Musky State University (MSU) is a National Collegiate Athletic Association (NCAA) Division-I
affiliated regional state institution located in Appalachia. The current enrollment was about 9,100.
Due to the success of MSU’s men’s basketball program, enrollment at this institution reached a
record high of 11,000 in 2013. The university has been named one of the Top-25 regional
colleges/universities by the U.S. News for four consecutive years and its educational programs and
student services have an excellent reputation within the institution’s service region. Despite the high
quality of its academic and student services programs, and despite the scenic environment in which
the university is located, MSU has one shortcoming consistently identified by the students—its
rural/remote location. It is referred to as a “suitcase” school that lacks a vibrant college-town life.
Kentucky SHAPE Journal Vol. 58 No. 1 70
In order to enrich students’ campus life experience, the Office of Student Life utilizes several
campaigns (e.g., Leave Your Suitcase Behind and Residential Honor’s College) and sponsors
numerous programs/activities to entice students to participate in weekend activities, such as
athletics. Intercollegiate sports are popular festivities on many campuses in America. In addition to
the actual competitions, pre-game tailgate parties have also become a vital social and celebratory
ritual practiced by both community fans and students.
The MSU football team competes in the NCAA Bowl Championship subdivision series and plays a
competitive schedule. However, at MSU, tailgating is not allowed on campus grounds. Students are
confused and upset by this unstated rule. They feel that MSU administrators have taken away a fun
and enjoyable activity that is celebrated on other campuses in the region and across the country.
The rationale for not allowing tailgate parties on the MSU campus before the football games is that
state law prohibits any alcohol consumption in public areas. If this is the rationale, students may ask
administrators, “why do all other regional public institutions in the state host tailgate parties on
campus?”
The President of MSU, Dr. Wayne Disney, cares about the students’ social lives. He even favors the
idea of hosting the tailgate parties on campus. However, President Disney insists that only non-
alcoholic beverages can be consumed at tailgate parties. He believes it is the institution’s ethical
responsibility to maintain a safe environment by minimizing the occurrence of alcohol-induced
accidents. In an effort to provide safe and non-alcoholic tailgating parties, President Disney has
asked the Vice President of Student Life and the Athletic Director to explore viable options and
strategies for ensuring that tailgating events on campus will serve the needs of both students and
community members.
You are to assume the role of the Athletic Director of MSU and answer the following questions
with regard to allowing tailgate parties on campus.
1. State the problem of this case clearly.
2. Determine the organizational leadership team’s objectives in this case.
3. What are the major issues in this case? How do they influence the problem(s)?
4. For the organization, identify alternative solutions to the issue. Consider the advantages and
disadvantages of each solution, and choose a solution based on the evidence.
5. How would you convince the fans and students to participate in tailgate parties without
consuming alcohol? How could the university prevent people from bringing alcohol to the tailgate
parties on campus?
6. Discuss the advantages and disadvantages for MSU hosting tailgating parties/events.
7. Some universities have implemented a policy that requires students to complete an alcohol
education program to participate in tailgate parties. Would you or would you not support the idea of
establishing educational programs to allow those who meet legal-drinking age? Give your reasons.
8. What are some challenges and concerns that come with hosting tailgating parties at MSU?
9. Is it ethical (and legal) for a higher education institution to market itself as a school that sanctions
tailgate parties? Give reasons to support your decision.

Kentucky SHAPE Journal Vol. 58 No. 1 71
Teaching Notes
The sales and consumption of alcohol beverage at the collegiate athletic events seem to be an
inevitable trend. Many more powerful collegiate athletics programs adopted the idea of selling
alcohol to enhance fans’ game experience and increasing concession revenue (Clouse, 2019; &
Taylor, 2019). These sales were considered to be a great way to turn up college fan attendance
(Reed, 2016). However, the death of Marco Lee Shemwell, a four-year-old boy who was killed by a
drunk college student after the football tailgating event, reminded us about the danger and problem
caused by the irresponsible and reckless drunk drivers and importance of minimizing the risk of
alcohol related incidents after tailgating events (Stunson, 2019; WDTV, 2019). It is vital for
campus and athletic administrators to develop effective policies to educate students and public and
monitor the safety of all patrons.
Discussion Questions and Solutions
1. State the problem of this case clearly.
Answer: Many MSU students choose to spend their weekends and other free days out of the rural
town where the university is located. As a result the university has acquired a reputation as a
“suitcase” university that lacks exciting campus activities. Administrators are considering
introducing tailgate parties to create a more social friendly and entertaining campus environment,
increase attendance of athletic events, and build a more vibrant campus community. They point to
many colleges and universities that promote their sport events as main sources of entertainment on
campus and a means for enhancing students’ social life and community engagement (William, n.d.).
Among all of the athletic events, tailgate parties before the football games seem to be the most
popular and highly anticipated. However, these parties seem to bring additional problems (i.e.,
excessive alcohol consumption, traffic accidents and violation of laws induced by drinking, loud
noise, and littering) along with the fun and entertainment they have provided. Pre-game tailgate
celebrations seem to be a common tradition for some Kentucky public institutions with a football
program. However, negative incidents, such as post-game fighting, had occurred due to excessive
drinking by the fans during the tailgate events (NBC News, 2012). Simply stated, the problem is
should MSU introduce tailgate parties at sport events in order to enhance campus life?
2. Determine the organizational leadership team’s objectives in this case.
Answer: The institution’s leadership team is eager to provide more friendly student-oriented events
to enhance the campus-life experience. The leadership team must create sensible and safe tailgating
policies. According to Maslow’s hierarchy of needs, students certainly are long for various types of
safe and enjoyable socal entertainments that can be offered on campus (McLeod, 2018). It is even
more challenging for the university administrators to uphold safety guidelines and policies to
regulate students’ on-campus recreational and social activities in the midst of the novel Coronavirus
(COVID) pandemic. Readers may refer to the following articles to learn about issues related to
challenges faced by suitcase schools and strategies for establishing a well-sounded tailgate policy:
*How to tailgate during the COVID-19 Pandemic? (Juarez, 2020; WATE, 2020)
*Off, Off, Off Campus by Moore (2013),

Kentucky SHAPE Journal Vol. 58 No. 1 72
*‘College Town’ Struggle to gel by Douglas (2013), and
*Perceptions of Students, Faculty, and Administrators About Pregame Tailgate Parties at a
Kentucky Regional University by Chen, Teater, and Whitaker (2012).
*Eagle Rally Zone tailgating: Morehead State 2011 Football Tailgating Policies (2010-2011).
3. What are the major issues in this case? How do they influence the problem(s)?
Answer: Students’ answers may focus on (but are not limited to) the following areas.
(a) Lack of student-involvement on campus activities (including the athletic events): When there is
nothing for students to do on campus, students leave campus often and gradually become
disassociated from the community. When students are less associated with the community and
generally dissatisfied with the campus experience, it decreases their school spirit and loyalty toward
the institution and increases the possibility of eventual transfer to another institution. (Reed Moore,
2013; Douglas, 2013; Rosier, 2013 for additional insights)
(b) Drinking issue related to tailgate events: Allowing tailgate parties prior to football games on
campus may promote fun entertainment and friendly social interaction among students and
community fans. However, people could drink excessively during the parties and cause problems
afterward, such as DUI and littering (Unknown, 2010). Tailgate parties may also cause an increase
in underage drinking by the students. Sensible policies for tailgating must be developed to ensure
the patrons’ safety and maintain a clean environment.
(c) Lack of attendance in athletic events: Some people refer to athletic programs as the front porch
of their institution. A lack of student fans attending the athletic events symbolizes low school spirit
and commitment within the campus community (Chen, Salazar, & Fitzgerald, 2009; Wells,
Southall, & Peng, 2000).
4. For the organization, identify alternative solutions to the issue. Consider the advantages and
disadvantages of each solution, and choose a solution based on the evidence.
Answer:
(a) Providing hospitality/treats to the fans: The University has traditionally offered food services to
treat the fans without serving alcohol beverages (James et al., 2001; Swanson, 2003; Tailgate
Station, 2007).
Pros—encourage more students to attend the games and enjoy the free food
Cons—those treats can be costly to the Athletic Department
(b) Increasing the patrol and monitoring of campus police: Campus police would increase the
number of staff and frequency of patrols for the confined party area (Eastern Michigan, University,
2008a; USA Today, 2009a). Officers can also try to be less restrictive while enforcing the rule of
“no alcohol consumption in public area.” They can give out warnings first, before issuing citations,
or allow people to drink if the alcoholic beverage is contained in a plastic cup or mug.
Pros—drinkers would feel the law enforcers are more sensible and try to behave properly since they
have been given respect.

Kentucky SHAPE Journal Vol. 58 No. 1 73
Cons—allowing people to get away with violation by using ‘tricks’ is a dishonest and unethical
practice; Furthermore, universities certainly should not be the agency to promote any possibility of
underage drinking.
(c) Implementing programs or strategies to help fans drink responsibly (Appalachian State
University, 2008; Eastern Michigan University, 2008b; New York Giants, 2008; University of
Massachusetts, 2008; University of West Georgia, n.d.; University of Wisconsin Stout, 2009; USA
Today, 2009b): There are professional agencies such as TEAM Coalition and others that help teams
and institutions educate their fans on drinking responsibly and execute effective tailgate policies
(TEAM Coalition, n.d.).
Pros—the university can implement a policy that allows fans to drink if they can show
documentation of having received an alcohol education course. Those who have gone through the
course may act and drink more responsibly during the tailgate parties.
Cons—No matter what, someone will always cross the line and act out of control.
5. How would you convince the fans and students to participate in tailgate parties without
consuming alcohol? How could the university prevent people from bringing alcohol to the tailgate
parties on campus?
Answer:
5.1 (a) Educate fans about the danger of alcohol abuse
(b) Provide more food and non-alcohol beverages for fans (Personal conversation with the
President of a regional state university in Kentucky)
(c) Create a variety of activities to entertain all attendees
5.2 Provide law enforcement monitoring
(a) Establish check-point gates
(b) Enforcing the state law (if applicable): “no alcohol consumption in public areas”
6. Discuss the advantages and disadvantages for MSU in hosting tailgating parties/events.
According to past literature, hosting tailgating parties may bring numerous advantages to the
hosting institution. Those advantages include: (Dixon, 2009; Dickinson, 2004; Drenten et al., 2009;
James et al., 2001; Laverie & Arnett, 2000)
(a) Generate more student support for the athletic programs;
(b) Promote school spirit;
(c) Provide a fun atmosphere for students and community fans;
(d) Increase game attendance; and
(e) Provide better food services
Disadvantages: (Glassman et al, 2007; McCarthy, 2009; Oster-Aaland & Neighbors, 2007; National
Football League, 2009; Woodyard & Hallan, 2010)
(a) Violating laws or university policies (i.e., increase of alcohol related traffic accidents, and
potential increase of violent acts, such as fights, vandalism, sexual assaults);
(b) Littering and environmental concerns;
(c) Congestion of traffic around the campus;
(d) Added financial burdens for hosting the tailgating events;
Kentucky SHAPE Journal Vol. 58 No. 1 74
(e) Decrease the sales of the university concession stands; &
(f) Negative school reputation.
Readers may refer to the following sources for additional information concerning this discussion:
●Seven reasons why UGA is the greatest school in the state by Adams (2006); and
●Tailgating: An American tradition by Allison (2005).
7. Some universities have implemented a policy that requires students to complete an alcohol
education program to participate in tailgate parties. Would you or would you not support the idea of
establishing educational programs to allow those who meet legal-drinking age? Give your reasons.
Answer:
7.1 Yes. Alcohol awareness educational programs can help students be aware of the dangers of
excessive drinking and can teach them to drink responsibly (EVERFI, 2011; University of Florida,
n.d.). This is a good way to differentiate those who can exercise self-control and hold tailgating
peers accountable for their behavior. TEAM Coalition is an example of the agencies that collaborate
with the institutions or professional teams conducting educational programs for fans or students.
7.2 No, a higher education institution should not send out a mixed message - preaching the negative
effects of alcohol consumption and allowing the chance for people to get drunk at the same time
(Personal conversation with the President of a regional state university in Kentucky).
8. What are some challenges and concerns that come with hosting tailgating parties at MSU?
In general, the following challenges are considered to be universal issues among small and regional
colleges and universities.
(a) Budget constraints (Chen et al., 2012);
(b) Increase in alcohol induced incidents (Glassman et al., 2007);
(c) Lack of tailgating locations (Chen et al., 2012; Armes, 2007; Personal conversation with the
Director of Athletics of a regional state university in Kentucky);
(d) Lack of security manpower to maintain a safe environment (Armes, 2005; Oster-Aaland &
Neighbors, 2007).
9. Is it ethical (and legal) for a higher education institution to market itself as a school that sanctions
tailgate parties? Give reasons to support your decision.
A distinction must be made between ethical and legal. Although it might be legal for a university to
sanction tailgate parties the question remains whether endorsement of this type of activity is ethical.
It is safe to argue that promoting alcohol consumption at a higher education institution could easily
violate its educational mission (Bormann & Stone, 2001). Tailgate parties may result in more drunk
driving related incidents (Oster-Aaland & Neighbors, 2007). How do the university president and
its administrators justify their position, if parents, legislators, or community members criticize the
decision? On the positive side, this promotion may help the school recruit new students providing
the university establishes a controlled fun/safe environment for all students to enjoy athletic events.
Therefore, it is not necessary to ban tailgate parties because of the actions of certain students who

Kentucky SHAPE Journal Vol. 58 No. 1 75
choose not to follow the rules. Bittner’s (2011) article exhibits how a university student group can
promote sober tailgating with a strong sense of ethical responsibility.

Kentucky SHAPE Journal Vol. 58 No. 1 76
References
Adams, B. (2006). Seven reasons why UGA is the greatest school in the state. Atlanta, 46(7), 44.
Allison, C. (2005). Tailgating: An American tradition.
http://www.associatedcontent.com/article/10253/tailgating_an_american_tradition.html?cat
=25
Appalachian State University (2008), Appalachian State University football tailgating policy.
http://www.alumni.appstate.edu/PDFs/tailgatepolicy.pdf
Armes, A. (2005). Score big with safe tailgating. Family Safety & Health, 64(3), 14-17.
Bormann, C., & M. Stone (2001). The effects of eliminating alcohol in a college stadium: The
Folsom Field beer Bban. Journal of American College Health, 50(2), 81-8.
Bittner, J. (2011). Group promotes sober tailgating.
http://www.alligator.org/news/campus/article_8863f168-eb1e-11e0-92a0-
001cc4c03286.html
Chen, S., Teater, S. A., & Whitaker, B. (2012). Perceptions of students, faculty, and administrators
about pregame tailgate parties at a Kentucky regional university. International Journal of
Developmental Sport Management, 1(2),
http://www.internationaljournalofdevelopmentalsportmanagement.com/resources/Steve%20
S%20Chen%20Second%20article%20for%20April%20Publisihing.pdf
Chen, S., Salazar, W., & Fitzgerald, L. (2011). Factors affecting collegiate sports season-ticket
holders’ satisfaction and renewal intention. ASAHPERD Journal, 31(2), 18-21.
Clouse, A. (2019, June 26). How do other Power 5 schools handle alcohol at college football
games? https://www.knoxnews.com/story/sports/2019/06/26/alcohol-college-football-
games-policy-power-5-university/1358400001/
Dickinson, C. (2004). Syracuse Sports Corp., CVB drive to bring in more sporting events.
Business Journal, 18(25), 4.
Dixon, A. W. (2009). Estimating the private consumption benefits derived from the
college football game experience. Unpublished dissertation, Clemson University.
Drenten, J. Peters, C. Okleshen , L. Thomas, & Hollenbeck, C. R. (2009). Not just a
party in the parking lot: An exploratory investigation of the motives underlying the ritual
commitment of football tailgaters. Sport Marketing Quarterly, 18(2), 92-106.
Douglas, A. (2013). ‘College town’ struggle to gel.
http://www.heraldonline.com/2013/08/12/5107657/building-a-college-town-business.html
Eastern Michigan University (2008a). Eagle’s landing fan zone.
http://www.emueagles.com/sports/2008/4/14/EaglesLanding08.aspx?id=334
Eastern Michigan University (2008b). Eagle's landing tailgates.
http://www.emich.edu/homecoming/documents/2008TailgateFormPolicy.pdf
EVERFI. (2011). AlcoholEdu® for College: Engage students, Inspire action, achieve results.
http://www.outsidetheclassroom.com/solutions/higher-education/alcoholedu-for-
college.aspx
Flynn, K. Lenkowitz, E., & M. Ward, Elizabeth, M. (n.d.). Tailgating 101.
http://www.mensfitness.com/sports_and_recreation/outdoor_recreation/37
Glassman, T., Werch, C., Jobli, E., & Bian, H. (2007). Alcohol-related fan behavior on college
football game day. Journal of American College Health, 56(3), 255-260.
James, J., Breezeel, G. S., & Ross, S. (2001). A two-stage study of the reasons to begin and

Kentucky SHAPE Journal Vol. 58 No. 1 77
continue tailgating. Sport Marketing Quarterly, 10(4), 212-222.
Juarez, C. (2020, September 10). How to tailgate during a pandemic?
https://www.kcbd.com/2020/09/10/how-tailgate-during-pandemic/
Laverie, D., & Arnett, D. (2000). Factors affecting fan attendance: The influence of identify
salience and satisfaction. Journal of Leisure Research, 32, 225-246.
McCarthy, M. (2009). NFL's crackdown on fan conduct gets tough. USA Today.
http://www.usatoday.com/NEWS/usaedition/2009-11-19-1Anflfans19_CV_U.htm?csp=34
McLeod, S. (2018, May 21). Maslow's hierarchy of needs.
https://www.simplypsychology.org/maslow.html
Moore, A. S. (2013). Off, off, off campus. http://www.nytimes.com/2013/02/03/education/edlife/at-
suitcase-schools-around-the-country-friday-means-its-time-to-
leave.html?pagewanted=all&_r=0
Morehead State University (2010). Eagle Rally Zone tailgating.
http://www.msueagles.com/sports/2010/8/30/GEN_0830104853.aspx
National Football League (2009). NFL teams implement fan code of conduct.
http://www.nfl.com/news/story?id=09000d5d809c28f9&template=without-
video&confirm=true
NBC News (2012). University of Kentucky restricts alcohol at tailgate parties in response to post-
game fights. http://usnews.nbcnews.com/_news/2012/09/27/14126193-university-of-
kentucky-restricts-alcohol-at-tailgate-parties-in-response-to-post-game-fights?lite
New York Giants (2008). Updated stadium alcohol policy for 2008.
http://www.giants.com/news/headlines/story.asp?story_id=28168
Oster-Aaland, L., & Neighbors, C. (2007). The impact of a tailgating policy on students’
drinking behavior and perceptions. Journal of American College Health, 56(3), 281-284.
Reed, P. (2016, December 14). Methods to increase student turnout at games.
https://www.spectatornews.com/sports/2016/12/14/methods-to-increase-student-turnout-at-
games/
Rosier, J. (2013). Suitcase schools. http://blog.ctnews.com/rosier/2013/02/27/suitcase-schools/
Stunson, M. (2019, February 6). Grand jury adds reckless homicide to charges against former UK
student in 4-year-old’s death. https://www.kentucky.com/news/local/counties/fayette-
county/article218592505.html
Swanson, S., Gwinner, K., Larson, B. V., & Janda, S. (2003). Motivations of college student
game attendance and word-of-mouth behavior: The impact of gender differences. Sport
Marketing Quarterly, 12(3), 151-161.
Tailgate Station (2007). Tailgate station testimonials.
http://www.tailgatestation.net/testimonials.cfm
Taylor, J. (2019, August 16). Tennessee joins five other SEC schools in bringing alcohol sales to
football games this fall. https://collegefootballtalk.nbcsports.com/2019/08/16/tennessee-
joins-five-other-sec-schools-in-bringing-alcohol-sales-to-football-games-this-fall/
TEAM Coalition. (n.d.). Techniques for effective alcohol management.
http://www.teamcoalition.org/about/about.asp
University of Florida (n.d.). Alcohol education program requirement.
https://www.dso.ufl.edu/nsfp/first-year-experience/alcohol-education/
University of Massachusetts (2008). UMass releases football tailgating policy for 2008.
http://www.umassathletics.com/sports/m-footbl/spec-rel/081507aaa.html

Kentucky SHAPE Journal Vol. 58 No. 1 78
University of West Georgia (u.d.). Tailgating policies and procedures.
http://www.westga.edu/alcohol/index_10646.php
University of Wisconsin Stout (2009). Football tailgating policies.
http://athletics.uwstout.edu/sports/2009/8/13/FB_0813094947.aspx?tab=Footballtailgatingp
olicies
Unknown. (2010). Eco-friendly tailgating. Men's Fitness, 26(3), 52.
USA Today (2009a). How NFL clubs' tailgating hours differ.
http://www.usatoday.com/NEWS/usaedition/2009-11-19-1Anflfans19_VA_U.htm?csp=34
USA Today (2009b). No fun league' strikes again.
http://www.usatoday.com/NEWS/usaedition/2009-11-23-letters23_ST2_U.htm?csp=34
WATE (2020, April 7). A new way of partying during COVID-19: Social distance ‘tailgating.’
https://www.cbs17.com/news/a-new-way-of-partying-during-covid-19-social-distance-
tailgating/
WDTV (2019, February 4). UK student indicted after crash outside of football game that killed 4-
year-old. https://www.wdtv.com/content/news/UK-student-indicted-after-crash-outside-of-
football-game-that-killed-4-year-old-505460951.html
Williams, B. (n.d.). NCAA sporting events.
http://ccsap.wsu.edu/default.asp?PageID=3352
Woodyard, C.,& Hallan, J. (2010). Differences in college student typical drinking and
celebration drinking. Journal of American College Health, 58(6), 533-538.
Wells, D. E., Southall, R., & Peng, H. W. (2000). Analysis of factors related to attendance at
Division-II football games. Sport Marketing Quarterly, 9(4), 203-210.