kefi update 31 jan 07 - kefi-minerals.com · geological interpretation and construction of orebody...
TRANSCRIPT

p.1 of 5 www.kefi-minerals.com
KEFI Minerals Plc 27-28 Eastcastle Street London W1W 8DH United Kingdom Tel: +90 232 381 9431 Fax: +90 232 381 9071 Email: [email protected]
6 May 2015
KEFI Minerals plc
(“KEFI” or the “Company”)
EXPLORATION UPDATE AT JIBAL QUTMAN, SAUDI ARABIA
Positive Preliminary Economic Assessment based on increase in JORC Mineral Resource and
favourable metallurgical heap leach test results
KEFI Minerals (AIM: KEFI), the gold exploration and development company with projects in the Kingdom
of Saudi Arabia and the Federal Democratic Republic of Ethiopia, is pleased to announce an expansion of
JORC (2012) Compliant Mineral Resources and the early results of metallurgical heap leach testing for its
Jibal Qutman project in Saudi Arabia. As with all KEFI’s activities in Saudi Arabia, the Jibal Qutman project
is part of the Gold and Minerals Joint Venture company (“G&M”).
The December 2014 Mineral Resource has been updated and upgraded via introduction of exploration data
from activities carried out until end March 2015. The Company is focusing on the possibility of an open cut
heap leach operation at Jibal Qutman in order to lower capital requirements and expedite the potential
development timetable.
Highlights of Preliminary Economic Assessment
The additional resource is a JORC compliant Indicated and Inferred Resource category
The total Mineral Resource, including the additional November 2014 resource, is 28.4 Mt at 0.80 g/t
Au for 733,045 contained gold ounces (previously 22.0 Mt at 0.90 g/t Au for 633,461 contained gold
ounces), both at a cut-off grade of 0.2 g/t Au
The expansion of Mineral Resource notably includes an oxide resource of 11.1Mt at 0.80 g/t Au for
287,329 contained gold ounces
Positive metallurgical heap leach test work results have been received from coarse crush cyanide leach
on four of the main oxide deposits, averaging 69% gold recovery over a 5-day leach time. Column
leach test work is ongoing and is expected to support the coarse crush results
Preliminary pit shells at a price of $1,250/oz Au have been designed on the oxide resource indicating
a potential open cut mineable resource of 6.6Mt at 0.95 g/t Au for 201,600 oz Au
An internal preliminary assessment using 69% Au recovery and local costs suggests an operating cash
cost of $597/oz on a 1.5Mt per annum heap leach mine
Conclusion and Next Steps
These results indicate the economic merit of development
The Company intends to commence a Preliminary Feasibility Study (“PFS”) in Q3 2015, which it
expects to complete in mid-2016
The development of the project would require an investment of approximately $30m in 2017, to be
comprised of a local development loan of $22.5m and equity of $7.5m (with KEFI being accountable
for 40% of the equity portion)
Jeff Rayner, Exploration Director of KEFI Minerals, commented:
“We are very encouraged by these latest results at our Jibal Qutman project. The metallurgical test
work and enlarged oxide resource indicate the economic viability of the development of a low cost heap
leach operation that could generate early cash flow to fund our Saudi exploration program. With our
Tulu Kapi project in Ethiopia on schedule to commence gold production in 2017 and Jibal Qutman in

p.2 www.kefi-minerals.com
Saudi Arabia expected to transition to the development phase shortly thereafter, we are well-positioned
to benefit from being one of the first companies exploring the enriched Arabian Nubian Shield.”
Enquiries
KEFI Minerals plc Harry Anagnostaras-Adams (Executive Chairman) +357 99457843
Jeff Rayner (Exploration Director) +905 339281913
J Rayner
SP Angel Corporate Finance LLP (Nominated Adviser)
Ewan Leggat, Katy Birkin +44 20 3470 0470
X
Brandon Hill Capital Ltd (Broker)
Oliver Stansfield, Jonathan Evans +44 20 3463 5000
X
Luther Pendragon Ltd (Financial PR)
Harry Chathli, Claire Norbury, Oli Hibberd +44 207 618 9100
Background:
Metallurgical Test Work
Samples of oxide mineralisation from diamond drill core at 4 of the main Jibal Qutman deposits; Main Zone,
West Zone, South Zone and 3K Hill were sent to ALS Metallurgy in Perth, Australia. The samples were
crushed, assayed, composited and separated into 4 crush sizes (<50mm, 25mm, 12.5mm and 6.5mm) for each
deposit area and subjected to standard cyanide leach bottle roll test work over a 5 day period. Gold recoveries
in the <12.5mm and <6.5mm crush sizes ranged from 66.3% to 71.5% with an average of 69.0%.
Column leach test work has been initiated and confirmatory results are expected within two months.
Internal Economic Assessment
Pit optimization studies have been applied to the oxide resources at Jibal Qutman. Initial results show a
potential mineable resource in a series of shallow open pits of 6.6Mt at 0.95 g/t Au for an in-situ 201,600 oz.
The following parameters were applied to the preliminary, internal economic assessment, some of which were
derived from G&M’s 2014 technical study of the potential CIL operation at Jibal Qutman and also from case
examples of similar currently operating heap leach mines: mining cost $1.60/t; heap leach processing cost
$5.50/t; general and administration $2.00/t; average gold recovery 69%; mining dilution 10% and Au price
$1,250/oz.
Based on the Company's preliminary economic assessment of these results, the project now warrants a PFS to
confirm the basis for a mine licence application. Results to date indicate gold production 139,000 oz over an
initial 4.5 years life of mine, at an average grade of 0.95 g/t Au, Au recovery of 69% and a strip ratio of 2.18.
Opex would be in the order of $597/oz. Such a development, if validated by independent studies, approved by
the authorities and committed by G&M, would involve an investment of $30m, potentially funded as 75% by
local finance institutions with KEFI's 40% share of equity funding being $3m. This potential development
would be a source of funding of G&M's regional exploration programs and its timing could be along the lines
of completing the technical studies and permitting in 2016/17 and development thereafter.
The Company expects to continue to define additional oxide resources in the licence area and on adjoining
licence application areas. Cash flow from the heap leach could fund the addition of a carbon in leach (CIL)
circuit for mining and processing of the sulphide mineralisation.
Resource Update

p.3 www.kefi-minerals.com
In March 2014, the Company reported a JORC Compliant Resource of 495,194 oz and the resource model was
independently verified. A non JORC-Compliant resource upgrade of 633,461 oz was estimated internally and
reported by the Company in December 2014.
A new JORC-Compliant resource estimated has been completed by the Company in April 2015. The additional
resources are classified as Indicated and Inferred and have been primarily derived from expanding previous
deposits along strike and from the new discoveries at Red Hill.
The total JORC (2012) Mineral Resource is now 28.4 Mt at 0.80 g/t Au for 733,045 ounces contained gold.
Geological interpretation and construction of orebody solids, which constrain mineralised intercepts at a 0.2
g/t grade boundary, was performed in Surpac. Block model construction, variography, geostatistics studies and
grade estimation were carried out in CAE Studio 3 (Datamine) and Advanced Geostatistics Modules mining
software using dynamic anisotropy to align the estimation with the local dip and strike of mineralisation trends.
Top cuts were applied to prevent over estimation and smearing of comparatively high values relative to the
dataset. Top cutting was based upon continuity in log probability plots and carried out by individual domain.
The estimate was carried out in a three pass Ordinary Kriging plan, where successive search volumes were 2
and 4 factors larger than the initial search ellipse. Final tonnes and grade reported on the kriged estimate from
CAE Studio 3.
OXIDE RESOURCE SULPHIDE RESOURCE OXIDE + SULPHIDE RESOURCE
ZONE TONNES GRADE OZ TONNES GRADE OZ TONNES GRADE OZ
3K 1,607,964 0.99 51,027 2,320,780 0.99 74,139 3,928,745 0.99 125,166
SC 2,887,929 0.69 63,775 4,915,937 0.79 125,392 7,803,866 0.75 189,167
4K 1,646,603 0.62 32,765 2,156,146 0.50 34,690 3,802,749 0.55 67,454
Main 1,452,188 0.89 41,406 1,302,766 0.77 32,323 2,754,954 0.83 73,729
West 2,581,090 0.87 72,361 5,282,494 0.86 145,712 7,863,584 0.86 218,073
Red Hill 832,564 0.89 23,880 1,300,354 0.79 32,989 2,132,918 0.83 56,869
Pyrite Hill 134,308 0.49 2,114 33,980 0.43 471 168,288 0.48 2,585
TOTALS 11,142,647 0.80 287,329 17312457 0.80 445716 28,455,104 0.80 733,045
Numbers may not add up due to rounding
Visual comparison of composite sample grade and block grade were conducted in cross section and in plan.
Visually the model was considered to spatially reflect the composite grades. Statistical analysis of the block
model was carried out for comparison against the composited drill hole data. The validation and checking of
the block model confirms that it performs as expected globally and locally in plan and section within the 2015
drill database and structural comparison with surface and trench mapping confirm mineralised zones to outcrop
where expected and be the approximate thickness as indicated by the block model.
Resource categories were based on geological mapping, interpretation, model validation, the drilling grid
density, surface trenching and observation of the grade and mineralisation continuity.
The central areas of each of the mineralised zones of the deposits show the greatest continuity of mineralisation
and structure and the drill hole and trenching spacing in these areas is generally on a 50m by 25m to 50m by
50m grid. KEFI consider this to be relatively well sampled in comparison to other moderate to high nugget
gold deposits and provides sufficient coverage to give confidence to the geological interpretation for the
reporting of Indicated Mineral Resources; 68% of the total Resource is in the Indicated Resource category.

p.4 www.kefi-minerals.com
In peripheral areas, generally along strike of the central zones or down dip of deeper intersections, where the
current drill hole and trenching spacing may range from 50m by 50m and rarely up to 50m by 100m KEFI
considers the sample spacing to be suitable only of Inferred mineral resources; 32% of the total Resource is in
the Inferred Resource category.
Extrapolation beyond 50m, and to a maximum of 100m has been carried out where supported by adjacent drill
intercepts along strike or on section, approximately 50% of the total Inferred Resource is in this extrapolation
beyond the normal sampling spacing.
INDICATED INFERRED
Tonnes Au (g/t) ounces Tonnes Au (g/t) ounces
OXIDE 833,6176 0.86 229,165 OXIDE 2,806,468 0.64 58,164
SULPHIDE 9,706,111 0.86 269,323 SULPHIDE 7,606,335 0.72 176,392
TOTAL 18,042,287 0.86 498,488 TOTAL 10,412,803 0.7 234,556
Numbers may not add up due to rounding
COMPETENT PERSONS’ STATEMENTS
References in this announcement to exploration results, resources, interpretations and prospects have been approved for
release by Mr. Jeffrey Rayner. Mr Rayner is a geologist and has more than 25 years’ relevant experience in the field of
activity concerned. He is a Member of the Australasian Institute of Mining and Metallurgy (AusIMM) and has reviewed
and consented to the inclusion of the material in the form and context in which it appears.
NOTES TO EDITOR
KEFI Minerals plc
KEFI is the operator of two advanced gold development projects within the highly prospective Arabian-Nubian
Shield, with an attributable 1.93Moz (95% of Tulu Kapi’s 1.72Moz and 40% of Jibal Qutman’s 0.73Moz) Au
Mineral Resources (JORC 2012) plus significant resource growth potential. KEFI is targeting production at
these projects to generate cash flows for further exploration and expansion as warranted, recoupment of
development costs and, when appropriate, dividends to shareholders.
Expected milestones for the remainder of 2015 at Tulu Kapi include:
Independently updated Definitive Feasibility Study for banking purposes
Formalisation of bank syndicate, agreement of final terms for project finance
Full development funding and commencement of construction
In addition, during 2015 KEFI anticipates initiating a preliminary feasibility study on the planned heap leach
mine at Jibal Qutman and submitting a Mining Licence Application for Jibal Qutman in Saudi Arabia through
its joint venture company, Gold & Minerals Ltd (“G&M”).
KEFI in Ethiopia
KEFI has 95% ownership of the Tulu Kapi Mining Licence in western Ethiopia and is at an advanced stage in
refining the development plan for the project, aimed at reducing the previously planned capital and operating
expenditure. Detailed research has yielded encouraging results and has been summarised in recent Company
announcements.
At the end of 2013, the Ethiopian Government improved the fiscal regime applying to the gold sector, and
Tulu Kapi in particular. This included lowering the income tax rate for mining (to 25% from 35%); settling of

p.5 www.kefi-minerals.com
repayment schedule for inherited VAT liability (over three years rather than up-front); the removal of VAT on
future exploration drilling expenditure; lowering royalty on gold mining (to 7% from 8%); accelerating the
depreciation of historical and future capital expenditure (over four years); and clarifying the workings of the
Government’s 5% free-carried interest so that it does not impede conventional project financing terms.
KEFI in the Kingdom of Saudi Arabia
In 2009, KEFI formed G&M in Saudi Arabia with local Saudi partner Abdul Rahman Saad Al-Rashid & Sons
Company Limited (“ARTAR”), to explore for gold and associated metals in the Arabian Shield. KEFI has a
40% interest in G&M and is the operating partner. To date, G&M has conducted preliminary regional
reconnaissance and has had five exploration licences (“EL”) granted, including Jibal Qutman and the recently
granted Hawiah exploration licence that contains over 5km2 of outcropping gossans developed on VMS altered
and mineralised rocks.
ARTAR, on behalf of G&M, holds 24 exploration licence applications that cover an area of approximately
1,484km2. ELs are renewable for up to three years and bestow the exclusive right to explore and to obtain a
30-year exploitation (mining) lease within the area.
The Kingdom of Saudi Arabia has instituted policies to encourage minerals exploration and development, and
KEFI Minerals supports this priority by serving as the technical partner within G&M. ARTAR also serves this
government policy as the major partner in G&M, which is one of the early movers in the modern resurgence
of the Kingdom’s minerals sector.
-Ends-

1
JORC Code, 2012 Edition – Table 1 report KEFI Minerals –
Jibal Qutman February 2014 Section 1 Sampling Techniques and Data (Criteria in this section apply to all succeeding sections.)
Criteria JORC Code explanation Commentary
Sampling techniques
Nature and quality of sampling (e.g. cut channels, random chips, or specific specialised industry standard measurement tools appropriate to the minerals under investigation, such as down hole gamma sondes, or handheld XRF instruments, etc). These examples should not be taken as limiting the broad meaning of sampling.
Include reference to measures taken to ensure sample representivity and the appropriate calibration of any measurement tools or systems used.
Aspects of the determination of mineralisation that are Material to the Public Report.
Rock chip sampling was adopted as a key geochemical exploration tool in early exploration phases. Samples of approximately 3kg were collected and sent for sample preparation and assayed via an industry standard procedure. Sample prep was carried out in the certified labs, which are:
Al Amri Labs (Al Amri Labs) labs, Hyder Al‐Oqaily street, st #39, Industrial area, Al‐Nuzha dist/3, Building no. 7401, unit no. 1, Jeddah 23536 ‐ 4431, Kingdom of Saudi Arabia
And
ALS Arabia, Jeddah laboratory (ALS Lab): Industrial area 1, Phase 4, 62 St. beside Riyadh bank and Civil defence bldg., P.O. Box 54605, Jeddah 21254, Tel: +966 012 608 8900
The resulting 500g pulp was assayed by fire assay using a 30g charge and AAS finish for base metals. Sampling of rock chips followed a documented protocol and quality is of good industry standard. Rock chip assays from outcrop and grab samples are not included in the dataset used for resource estimation.
Trenching was an important exploration tool at Jibal Qutman. Trenches across the identified mineralized zones were excavated at 50 to 100m spacing using both wheel and track‐mounted excavators. Trenches were excavated up to a depth of 1.5m, a width of 1.5 m, and with variable lengths. Hand sampling in trenches was undertaken by trained technicians collecting a channel sample of

2
Criteria JORC Code explanation Commentary
In cases where ‘industry standard’ work has been done this would be relatively simple (e.g. ‘reverse circulation drilling was used to obtain 1 m samples from which 3 kg was pulverised to produce a 30 g charge for fire assay’). In other cases more explanation may be required, such as where there is coarse gold that has inherent sampling problems. Unusual commodities or mineralisation types (e.g. submarine nodules) may warrant disclosure of detailed information.
variable length (1m – 4m) along the base of the trench wall. The sampling process was supervised by field geologists.
Trenches were logged by geologists for lithology, structure, texture,
mineralization, alteration type, colour, weathering intensity and sulphide occurrence. Trench walls (showing sampling intervals and sample bags), were photographed for all trenches.
After delivery of diamond drill core in galvanized metal trays to a dedicated core yard (located proximal to the drill site to minimize transport related risks), core was photographed, logged and sample intervals marked by a geologist. The core was then split to half core using diamond core saws so as to preserve a physical record. Sampling of diamond core followed a well‐documented protocol and quality is considered to be of good industry standard. Core recovery and RQD were measured during the logging process by trained technicians and/or geologists.
RC drill samples were bagged and riffle split at the drillhole: a sample of approximately 3kg was kept for sample preparation. Sampling of RC chips followed a well‐documented protocol and quality was considered to be of good industry standard.
Appropriate care was taken by supervising geologists at the drillhole site and at the sample storage facility to process both diamond core and RC chip samples following well‐documented procedures. Lithologies were respected as boundaries for diamond core sampling where a mineralized lithological unit interval was greater than 0.3 m.
For diamond drill core and RC drill chips, logging was carried out to
determine mineralization intervals based on alteration type, presence of quartz veining and sulphide occurrence.
Both diamond drill core and RC chips samples underwent sample
preparation and assay via an industry‐standard procedure. Sample

3
Criteria JORC Code explanation Commentary
preparation was carried out at a certified laboratory. The resulting 500g pulp was assayed by fire assay using a 30g FA and AAS finish.
Drilling techniques
Drill type (e.g. core, reverse circulation, open‐hole hammer, rotary air blast, auger, Bangka, sonic, etc) and details (e.g. core diametre, triple or standard tube, depth of diamond tails, face‐sampling bit or other type, whether core is oriented and if so, by what method, etc).
Diamond drilling has been carried out with typically HQ (63mm) diametres to maximum depths of 150m. Either single or triple tube was used (the latter in case of highly fractured ground conditions). Downhole survey has been carried using a Reflex EZ‐Track survey system with an initial survey carried out at 6m and then at every 50m to end of hole. A total of 8 diamond holes were not surveyed due to difficult ground conditions.
Reverse‐circulation (RC) drilling was carried out with a face sampling hammer and 4 ½ to 5 ¼ inch bit from collar to end of hole. Downhole survey was carried out using a Reflex EZ‐Track survey system with a winch and cable after hole completion. The collar was cased to a depth of 17 metres to protect the instrument during the survey. Survey Shots were taken at 6, 12 and 17 metres. This practice was adopted to attain downhole surveys for RC holes where the drill rig was not able to survey due to the lack of stainless steel rods.
Drill sample recovery
Method of recording and assessing core and chip sample recoveries and results assessed.
Measures taken to maximise sample recovery and ensure representative nature of the samples.
Diamond drill core sample lengths were measured and recorded after logging in order to calculate core recovery. Core recovery averaged 88% through all rock types and types of ground. In instances where recovery through mineralized areas was below 70%, the hole was re‐drilled.
All RC drill chip samples were weighed and recorded so as to determine that the recovery was within a satisfactory range compared to the expected 30 kg/metre. Two thirds of the recorded data has been entered into digital format. Drill chip recovery averaged 89% through all rock types and types of ground.
Recording of core sample lengths against drill metres and RC drill
chip samples against expected weight is well documented and records are available in a verified database and hard copy format. RC

4
Criteria JORC Code explanation Commentary
Whether a relationship exists between sample recovery and grade and whether sample bias may have occurred due to preferential loss/gain of fine/coarse material.
chips sample recovery has never been a problem in Jibal Qutman due to the competent ultramafic lithologies, abundant quartz veins and relatively thin overburden.
In house statistical studies did not reveal any issues of bias when
reviewing sample recovery against grade with the Pearson correlation coefficient being ‐0.013 for all samples; demonstrating no or negligible relationship between recovery and grade.
Logging Whether core and chip samples have been geologically and geotechnically logged to a level of detail to support appropriate Mineral Resource estimation, mining studies and metallurgical studies.
Whether logging is qualitative or quantitative in nature. Core (or costean, channel, etc) photography.
The total length and percentage of the relevant intersections logged.
Diamond drill core was logged for lithology, structure, texture, mineralization, alteration type, colour and weathering intensity and sulphide occurrence, by geologists with experience in orogenic‐style quartz‐vein‐hosted gold deposits. Core was photographed in the trays at the sample storage facility and half the core retained during the sampling process for reference.
RC drill chips were logged for lithology, alteration and mineralization type and a small sample kept from each metre in plastic chip trays as a logging record.
All trenches were logged were logged by geologists for lithology, structure, texture, mineralization, alteration type, colour, weathering intensity and sulphide occurrence. Trench walls (showing sampling intervals and sample bags), were photographed for all trenches.
All sample intervals returned from drilling activities, including water‐
well drilling, were logged and sampled.
KEFI has drilled 30,003 m of reverse circulation, 5,843 m of diamond and trenched 21,055 m. All drill core and chips as well as trenches

5
Criteria JORC Code explanation Commentary
were logged.
Sub‐sampling techniques and sample preparation
If core, whether cut or sawn and whether quarter, half or all core taken.
If non‐core, whether riffled, tube sampled, rotary split, etc and whether
sampled wet or dry.
For all sample types, the nature, quality and appropriateness of the sample preparation technique.
Drill core was split with core saws and half was submitted for sample prep and assay.
Drill core from metallurgy programs was sampled as whole core through mineralized intervals, and analysed at 1 metre intervals (head assays). Samples where then composited to provide a minimum of 100kg of sample for each one of the four zones to run 4 separated column leach test works. A total of 11 metallurgy holes were drilled in South Zone, Main Zone, West Zone and 3K Hill.
RC chips were riffle‐sampled at the drill site post drilling. For wet sample a pipe is passed through the material to collect an even distribution of material. The pipe is accurately cleaned after each sample collection. Blanks are used near mineralised intervals to detect possible contamination both in the lab and during sampling. And sample repeats are taken over specific mineralised intervals.
Sample preparation was carried out at the reference lab (Al Amri Lab or ALS Lab).
Pulps for every batch, randomly selected in mineralised intervals and containing >0.2g/t Au, were periodically retrieved from AL Amri Lab and re‐assayed at ALS Lab for cross check purposes. To date a total of 9.6% of mineralised pulps were re‐assayed. Since November 2014 all samples have been processed at the ALS Lab due to faster turnaround times.
Diamond drill half‐core from all 77 holes have been retained in a secure sample storage facility (core shed, Bisha field office). Sample bags are kept in the field until the first round of assays is received. When results are received, 3 m or 2 m composite samples showing gold results above 0.2g/t are re‐sampled metre by metre. The new samples are given the same sequential number as the original sample, but with a letter suffix (A, B and C) to designate each
6
Criteria JORC Code explanation Commentary
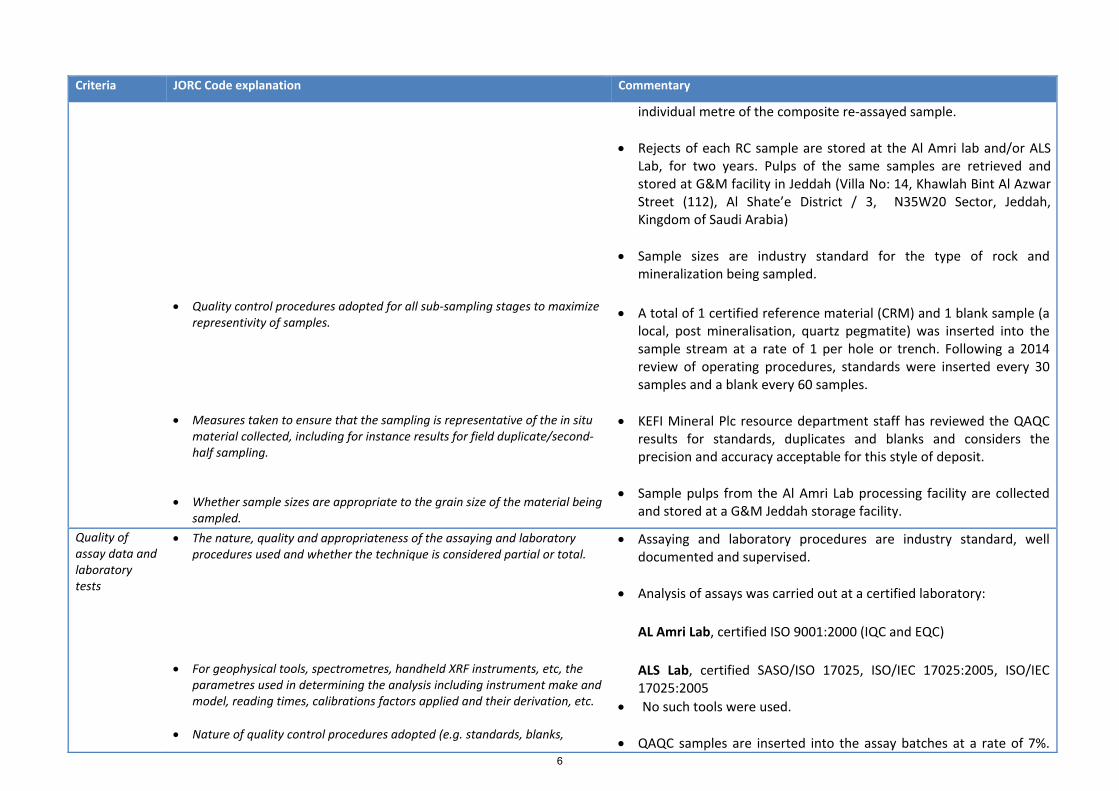
Quality control procedures adopted for all sub‐sampling stages to maximize representivity of samples.
Measures taken to ensure that the sampling is representative of the in situ material collected, including for instance results for field duplicate/second‐half sampling.
Whether sample sizes are appropriate to the grain size of the material being sampled.
individual metre of the composite re‐assayed sample.
Rejects of each RC sample are stored at the Al Amri lab and/or ALS Lab, for two years. Pulps of the same samples are retrieved and stored at G&M facility in Jeddah (Villa No: 14, Khawlah Bint Al Azwar Street (112), Al Shate’e District / 3, N35W20 Sector, Jeddah, Kingdom of Saudi Arabia)
Sample sizes are industry standard for the type of rock and mineralization being sampled.
A total of 1 certified reference material (CRM) and 1 blank sample (a
local, post mineralisation, quartz pegmatite) was inserted into the sample stream at a rate of 1 per hole or trench. Following a 2014 review of operating procedures, standards were inserted every 30 samples and a blank every 60 samples.
KEFI Mineral Plc resource department staff has reviewed the QAQC results for standards, duplicates and blanks and considers the precision and accuracy acceptable for this style of deposit.
Sample pulps from the Al Amri Lab processing facility are collected and stored at a G&M Jeddah storage facility.
Quality of assay data and laboratory tests
The nature, quality and appropriateness of the assaying and laboratory procedures used and whether the technique is considered partial or total.
For geophysical tools, spectrometres, handheld XRF instruments, etc, the parametres used in determining the analysis including instrument make and model, reading times, calibrations factors applied and their derivation, etc.
Nature of quality control procedures adopted (e.g. standards, blanks,
Assaying and laboratory procedures are industry standard, well documented and supervised.
Analysis of assays was carried out at a certified laboratory:
AL Amri Lab, certified ISO 9001:2000 (IQC and EQC)
ALS Lab, certified SASO/ISO 17025, ISO/IEC 17025:2005, ISO/IEC 17025:2005
No such tools were used.
QAQC samples are inserted into the assay batches at a rate of 7%.
7
Criteria JORC Code explanation Commentary
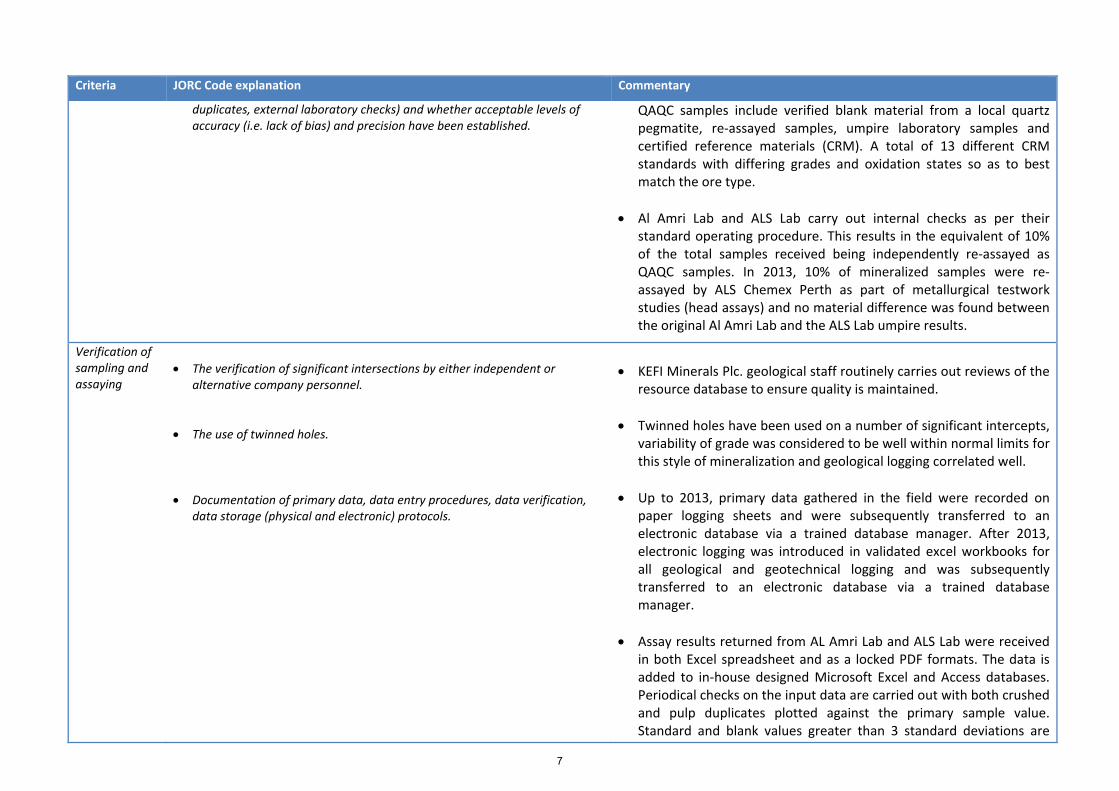
duplicates, external laboratory checks) and whether acceptable levels of accuracy (i.e. lack of bias) and precision have been established.
QAQC samples include verified blank material from a local quartz pegmatite, re‐assayed samples, umpire laboratory samples and certified reference materials (CRM). A total of 13 different CRM standards with differing grades and oxidation states so as to best match the ore type.
Al Amri Lab and ALS Lab carry out internal checks as per their standard operating procedure. This results in the equivalent of 10% of the total samples received being independently re‐assayed as QAQC samples. In 2013, 10% of mineralized samples were re‐assayed by ALS Chemex Perth as part of metallurgical testwork studies (head assays) and no material difference was found between the original Al Amri Lab and the ALS Lab umpire results.
Verification of sampling and assaying
The verification of significant intersections by either independent or alternative company personnel.
The use of twinned holes.
Documentation of primary data, data entry procedures, data verification, data storage (physical and electronic) protocols.
KEFI Minerals Plc. geological staff routinely carries out reviews of the
resource database to ensure quality is maintained.
Twinned holes have been used on a number of significant intercepts, variability of grade was considered to be well within normal limits for this style of mineralization and geological logging correlated well.
Up to 2013, primary data gathered in the field were recorded on paper logging sheets and were subsequently transferred to an electronic database via a trained database manager. After 2013, electronic logging was introduced in validated excel workbooks for all geological and geotechnical logging and was subsequently transferred to an electronic database via a trained database manager.
Assay results returned from AL Amri Lab and ALS Lab were received in both Excel spreadsheet and as a locked PDF formats. The data is added to in‐house designed Microsoft Excel and Access databases. Periodical checks on the input data are carried out with both crushed and pulp duplicates plotted against the primary sample value. Standard and blank values greater than 3 standard deviations are

8
Criteria JORC Code explanation Commentary
Discuss any adjustment to assay data.
flagged and batches with error values highlighted. Any errors were followed up with the analytical laboratory and repeat sampling issued.
Returned assays with a below detection limit value have been
reduced to half of the returned value so to allow for the removal of any non‐numeric characters assigned by the laboratory without assigning a potentially significant grade. No other adjustments to assay data have been carried out.
Location of data points
Accuracy and quality of surveys used to locate drill holes (collar and down‐hole surveys), trenches, mine workings and other locations used in Mineral Resource estimation.
Specification of the grid system used.
Quality and adequacy of topographic control.
Drill hole collar co‐ordinates were initially located using handheld GPS units. Post drilling, the collar location is re‐surveyed using a TOPCON ES103 Total Station by an in‐house G&M survey team. Drillhole collars and trenches are surveyed on weekly basis.
The grid system in use is UTM WGS84–Zone 38N
Control topographic points where initially set in 4 different areas of Jibal Qutman by a professional team of surveyors working for Saudi‐Turki Information Technology Company. The Control points where set referring to the KSA national topographic grid control points.
A topographic survey was carried out to produce a DTM surface of
the area covering the resource zones, a survey was done using a TOPCON ES 103 total station. Survey was performed as follows: starting from the southernmost licence limit the surveyor set an EW line and survey coordinates and elevation at 1 m intervals along the line. Once the line survey is completed, a new line, located 12.5m North is surveyed. Survey was completed in a rectangle with the following coordinates (UTM, WGS84m, 38N):
SW corner
Easting 334,000m
Northing 2,247,000m
NE corner

9
Criteria JORC Code explanation Commentary
Easting 337,250m
Northing 2,255,800m
Data spacing and distribution
Data spacing for reporting of Exploration Results.
Whether the data spacing and distribution is sufficient to establish the degree of geological and grade continuity appropriate for the Mineral Resource and Ore Reserve estimation procedure(s) and classifications applied.
Whether sample compositing has been applied.
50 x 50m to approximately 50 x 25m grid through the central part of the deposit and approximately 100 x 50m at the peripheries.
Directional semi‐variograms for the along strike, down dip and down hole directions were generated for Au for individual resource zones using the drill hole composites. The nugget variances were modelled constrained by orebody solids from average down hole variograms based on a 1.0 m lag reflecting the down hole drill hole composite spacing.
Variograms were constructed using the nugget and 1 spherical structure for 5 of 7 resource zones. Two smaller zones did not have sufficient data to produce interpretable structures. For these zones nearest and most geologically similar variogram models from interpreted zones were used. The principal direction of continuity was based on known geological and structural continuity for each resource zone. The three orthogonal orientations represented the predominant along‐strike, down‐dip and cross‐strike directions. Experimental variograms were constructed for along‐strike, down‐dip and cross‐strike for 5 of 7 resource zones and these variograms indicated ranges of approximately 20 ‐ 50m along strike, 20 ‐ 30m down dip and 4 ‐ 6m cross strike depending on orezone and veins within orezones. The data spacing is sufficient for a mineral resource estimate and its classification as applied.
Single metre samples are used in sections of alteration and
mineralisation, and three metre composites are used for unaltered zones. Sampling gaps are avoided. Two metre composites may result from switching from fresh to altered zones, or at the end of a hole. Composite samples showing grades above the lower cut‐off grade (0.2 g/t Au) are re‐sampled, metre by metre. The re‐samples are

10
Criteria JORC Code explanation Commentary
given the same sequential number as the original sample, but with a letter suffix (A, B and C) to designate each individual metre of the composite sample re‐assayed.
Orientation of data in relation to geological structure
Whether the orientation of sampling achieves unbiased sampling of possible structures and the extent to which this is known, considering the deposit type.
If the relationship between the drilling orientation and the orientation of key mineralised structures is considered to have introduced a sampling bias, this should be assessed and reported if material.
While RC holes were sampled every 1 m through alteration and 3 m through unaltered ground, DD core was sampled up to a 0.3 m resolution depending on lithology and structure. Since the mineralised structures along with their mineralized halo are not observed to be less than one metre wide, the sampling is considered to be unbiased.
Drilling has generally been carried out on an approximate 50 m grid with holes typically inclined at 60° / 50° and orientated at an azimuth of 270°. A limited number of vertical holes have also been drilled. The mineralization is interpreted to strike N‐S or NNW‐SSE and dip 80 to 35° to the E, the drilling orientation is considered appropriate for sampling the principal mineralization orientation. Sufficient data density exists and sufficient work has been carried out via drillhole logging, detailed mapping and statistical analysis that the sampling is considered to be unbiased.
Sample security
The measures taken to ensure sample security. Sample security was ensured by the adoption of an internal chain‐of‐custody procedure. Field samples were collected, transported to the core yard, and then to the analytical laboratory by G&M employees. Samples were transported using company vehicles, driven by G&M drivers. Retrieval of pulps from AL Amri Lab and delivery to ALS Lab was entirely managed logistically by G&M personnel. Electronic and paper receipts were received from the laboratory staff by G&M personnel on sample delivery; these receipts are printed and stored at the Exploration Office.
Audits or reviews
The results of any audits or reviews of sampling techniques and data. No independent auditing and review of sampling techniques and data has been carried out

11
Section 2 Reporting of Exploration Results (Criteria listed in the preceding section also apply to this section.)
Criteria JORC Code explanation Commentary
Mineral tenement and land tenure status
Type, reference name/number, location and ownership including agreements or material issues with third parties such as joint ventures, partnerships, overriding royalties, native title interests, historical sites, wilderness or national park and environmental settings.
The security of the tenure held at the time of reporting along with any known impediments to obtaining a licence to operate in the area.
Gold and Minerals LLC (G&M; commercial registration number 101029291; address 9102, Riyadh, 11413) was incorporated in Riyadh in 2009 and is a Saudi Arabian joint venture company (60:40) between Abdul Rahman Saad Al Rashid & Sons Co. LLC (ARTAR) of Saudi Arabia (commercial registration number 1010168729, address 9102 Riyadh, 11413) and KEFI Minerals (incorporated and registered in England and Wales; Company Number 5976748; registered office 27/28 Eastcastle Street, London, W1W 8DH). ARTAR conducts business in construction, healthcare, real estate, agriculture and heavy industry, and operates a number of subsidiaries. KEFI Minerals is an exploration and development company with a history of exploration in the eastern Mediterranean and current interests in Saudi Arabia and Ethiopia. On 30 Rahab 1433 (20th June 2012), the Government of the Kingdom of Saudi Arabia awarded an exploration licence with a total area of 99.9km2 covering the Jibal Qutman prospects to ARTAR. Under the articles of association the licenses will be transferred to G&M in due course. Work under this licence has been carried out by staff of G&M.
The Jibal Qutman deposit is located approximately 110km east north east from Bisha City in Asir Province, Kingdom of Saudi Arabia. The project is located in a remote area without any settlements and has not been exploited previously, except for ancient workings and mineral exploration performed by the Deputy Ministry of Mineral Recourses and G&M.
G&M has carried out diverse exploration activities at Jibal Qutman
including; geological mapping, various geophysical surveys, surface sampling and drilling. A total of 430 Reverse Circulation (RC) holes and 77 Diamond (DD) holes have been drilled at Jibal Qutman between 2012 and April 2015, including exploration, hydro‐geological and metallurgical holes. Both RC and DD drilling have

12
Criteria JORC Code explanation Commentary
been carried out on the property. Except for mineral exploration performed by the ministry of mineral recourses and G&M, the project has not been commercially exploited.
The Jibal Qutman area is currently under an exploration licence.
Under Saudi Arabian law an exploration licence gives the holder the exclusive right to explore for minerals within the area specified in the licence for a period of 5 years. The licensing authority may allow extension or renewal to be made on each anniversary where the licensee proves the necessity to undertake exploration activity beyond the initial work programme, provided such a period does not exceed a further five years in total.
Exploration done by other parties
Acknowledgment and appraisal of exploration by other parties. The first field‐reconnaissance of the area was performed by the United States Geological Survey (USGS) on behalf of the then Directorate General of Mineral Resources (DGMR) in 1979. During 1983, the Au occurrence, then termed Bani Qutman, was explored by the DGMR drilling three diamond holes. The findings of the work in the area were that the deposit was sporadic and very low grade, and therefore did not, at the time, represent a potentially viable gold resource.
Geology Deposit type, geological setting and style of mineralisation. The deposit is a mesothermal or orogenic‐style quartz‐vein‐hosted gold deposit located in the major north‐south trending Nabitah‐Tathlith fault zone.
The project currently comprises separate areas of mineralisation with indicated, inferred and extrapolated resource categories. There are currently other adjacent prospects being explored and the project is open along strike, down dip and at locations peripheral to the known mineralization.
The mineralised zones are interpreted as quartz vein and shear‐zone‐related gold mineralization, hosted by folded Upper Proterozoic volcanic and sedimentary units. The shear zones occur along the prominent north‐south trending Nabitah‐Tathlith fault

13
Criteria JORC Code explanation Commentary
zone, and range in thickness from some tens to hundreds of metres. Gold mineralisation is associated with the shears in three predominant styles: a) Quartz veins and surrounding stockwork within a carbonatized
and albitized alteration envelope, with gold accompanied by disseminated pyrite and minor copper sulphides and oxides.
b) Sub‐horizontal unsheared carbonatized and albitized volcanic bodies, with gold accompanied by large quantities of pyrite and very minor amounts of other sulphides.
c) A strongly sheared and folded carbonaceous meta‐sedimentary unit, strongly sericitised and containing a significant quantity of pyrite. This mineralisation style accounts for only a small part of the resource.
Drill hole Information
A summary of all information material to the understanding of the exploration results including a tabulation of the following information for all Material drill holes: o easting and northing of the drill hole collar o elevation or RL (Reduced Level – elevation above sea level in metres) of
the drill hole collar o dip and azimuth of the hole o down hole length and interception depth o hole length.
If the exclusion of this information is justified on the basis that the information is not Material and this exclusion does not detract from the understanding of the report, the Competent Person should clearly explain why this is the case.
East‐to‐west trenches were excavated across all resource zones. With the exception of 3 exploratory north‐to‐south trenches in the 4K Hill prospect. The majority of the diamond and RC holes were drilled with N270° azimuth and 60° dip. All drillholes in West Zone were orientated with a N255° azimuth. The early diamond drilling campaign at Main Zone and South Zone (50 holes) were drilled with 50° and 80° inclination. All drillholes and trenches considered for the resource estimation are enclosed in a rectangle with the following coordinates (UTM, WGS84m, 38N):
SW corner
Easting 334,618m
Northing 2246912m
NE corner
Easting 337032m
Northing 2254551m
The following trenches and drillholes were completed at Jibal Qutman:

14
Criteria JORC Code explanation Commentary
Data aggregation
In reporting Exploration Results, weighting averaging techniques, maximum and/or minimum grade truncations (e.g. cutting of high grades) and cut‐off
Results are reported to the market periodically. Trench and drillhole assay results are reported with a 0.2g/t Au cut‐off grade, using
n° of Trenches metersMain Zone 48 5221West Zone 57 4170
South Zone Composite 60 36093K Hill 24 14544K Hill 53 5221Red Hill 20 1139
Pyrite Hill 4 241
TOTALS 266 21055
TRENCHING
n° of Holes metersMain Zone 36 2361West Zone 21 1863
South Zone Composite 15 11743K Hill 7 4454K HillRed Hill
Pyrite Hill
TOTALS 79 5843
Diamond Drilling
n° of Holes metersMain Zone 50 5040West Zone 68 6930
South Zone Composite 85 80303K Hill 56 45444K Hill 48 3735Red Hill 13 1482
Pyrite Hill 4 242
TOTALS 324 30003
RC DRILLING

15
Criteria JORC Code explanation Commentary
methods grades are usually Material and should be stated. Where aggregate intercepts incorporate short lengths of high grade results
and longer lengths of low grade results, the procedure used for such aggregation should be stated and some typical examples of such aggregations should be shown in detail.
The assumptions used for any reporting of metal equivalent values should be clearly stated.
weighed average gold grade across mineralized intervals, highlighting specific intervals of higher internal grades if necessary.
Relationship between mineralisation widths and intercept lengths
These relationships are particularly important in the reporting of Exploration Results.
If the geometry of the mineralisation with respect to the drill hole angle is known, its nature should be reported.
If it is not known and only the down hole lengths are reported, there should be a clear statement to this effect (e.g. ‘down hole length, true width not known’).
The strike of the mineralized bodies ranges from NS to N270°, and dips from 80° to 35°. All reasonable effort are made to intersect the mineralized bodies to represent the true width. However, some steeper dipping bodies are approached at 50° drill dip, resulting in intersections 40° to true thickness. This accounts for a limited number of intersections in specific zones
Diagrams Appropriate maps and sections (with scales) and tabulations of intercepts should be included for any significant discovery being reported These should include, but not be limited to a plan view of drill hole collar locations and appropriate sectional views.
Not applicable
Balanced reporting
Where comprehensive reporting of all Exploration Results is not practicable, representative reporting of both low and high grades and/or widths should be practiced to avoid misleading reporting of Exploration Results.
Results are reported to the market periodically. Trench and drillhole assay results are reported with a 0.2g/t Au cut‐off grade, using weighed average gold grade across mineralized intervals.
Other substantive exploration data
Other exploration data, if meaningful and material, should be reported including (but not limited to): geological observations; geophysical survey results; geochemical survey results; bulk samples – size and method of treatment; metallurgical test results; bulk density, groundwater, geotechnical and rock characteristics; potential deleterious or contaminating substances.
Periodic market updates include geological observations, such as: geophysical survey results; geochemical survey results; metallurgical test results; bulk density, groundwater; potential deleterious or contaminating substances.
Further work The nature and scale of planned further work (e.g. tests for lateral extensions or depth extensions or large‐scale step‐out drilling).
Diagrams clearly highlighting the areas of possible extensions, including the main geological interpretations and future drilling areas, provided this information is not commercially sensitive.
Currently 9,400 m of resource Reverse Circulation (RC) and 1500 m of DDH infill drilling is planned across 155 holes.
Currently 5,000m of step out drilling is planned in 35 reverse circulation (RC) holes.

16
Section 3 Estimation and Reporting of Mineral Resources (Criteria listed in section 1, and where relevant in section 2, also apply to this section.)
Criteria JORC Code explanation Commentary
Database integrity
Measures taken to ensure that data has not been corrupted by, for example, transcription or keying errors, between its initial collection and its use for Mineral Resource estimation purposes.
Data validation procedures used.
Exploration work was conducted under a quality management system involving all stages of exploration, from the drilling and sample collection to resource estimation. All field data were captured by hard copy and subsequently uploaded to a spread sheet system or captured electronically, checked for consistency and added to the database with all original entered spreadsheets stored. The database is checked for input errors at different stages, from the field office to the head office in the township of Bisha. The master database is managed by a dedicated Exploration Geologist‐Geological Database Manager based at Bisha, with quality control and sampling protocol co‐ordinated by the Exploration Manager and Resource Manager.
The final database is stored in macro enabled Microsoft Excel and Microsoft Access and imported to Surpac Mining Software and Datamine Software which includes a final validation step where Surpac or Datamine maintains a check for consistency within the database prior to estimation.
KEFI minerals nominates a staff member professionally trained in QA/QC review, during resource estimates, to check and report concerns which are in turn corrected where necessary, prior to the estimation.
Site visits Comment on any site visits undertaken by the Competent Person and the outcome of those visits.
If no site visits have been undertaken indicate why this is the case.
The Competent Person, KEFI Exploration Director is a full‐time KEFI Minerals employee.
Geological interpretation
Confidence in (or conversely, the uncertainty of ) the geological interpretation of the mineral deposit.
Nature of the data used and of any assumptions made.
Geological and structural interpretation of the Jibal Qutman area has been based on surface mapping and drillhole interpretation and logging by an experienced team of expatriate field exploration geologists with more than 4 years’ experience in the Jibal Qutman area geology. All data available has been used and is also available for review in digital or analogue format and there is good confidence

17
Criteria JORC Code explanation Commentary
The effect, if any, of alternative interpretations on Mineral Resource estimation.
The use of geology in guiding and controlling Mineral Resource estimation.
The factors affecting continuity both of grade and geology.
in the current interpretation.
An alternative interpretation is only likely to be regarding subtle controls on mineralization, particularly local variations in strike, dip and thickness of mineralized zones and is unlikely to materially affect the estimate. The mineralized structure is covered well by the drilling grid, geological continuity is adequate section to section and the geology is well understood.
Geology is logged in detail during the data collection process via a standard set of geological codes which form an integral part of the final database. This includes drillholes as well as surface exploration trenches. Geology is then interpreted on drill/trench section along strike, correlated section to section and compiled for a final geological interpretation including mineralization.
The correlation between carbonate alteration, quartz veining and stockwork, pyritization and grade is strong and is a contributor along with grade for the interpretation of constraining wireframes for grade estimation.
A relatively complex structural environment with narrow to medium width variably dipping veins which pinch and swell along strike and down dip.
The relationship with grade and structure are not yet fully understood however structural geology interpretation and infill drilling programs are confirming initial interpretations and improving confidence. Initial interpretation is NS striking w dipping mineralised structures (faults and fractures).

18
Criteria JORC Code explanation Commentary
Dimensions The extent and variability of the Mineral Resource expressed as length (along strike or otherwise), plan width, and depth below surface to the upper and lower limits of the Mineral Resource.
Mineralization as modelled extends for some 7,000m along strike, currently in 7 discrete concentrated zones which outcrop at surface and were the focus of expanding exploration works. Width of near‐surface mineralization is some 500m at the widest zone, comprising a closely stacked series of discreet mineralized zones varying in width from metre scale to 15 metres and extending to a depth of some 150m below topography..
Estimation and modelling techniques
The nature and appropriateness of the estimation technique(s) applied and key assumptions, including treatment of extreme grade values, domaining, interpolation parametres and maximum distance of extrapolation from data points. If a computer assisted estimation method was chosen include a description of computer software and parametres used.
Mineralisation solids were interpreted at a 0.2 g/t grade boundary reflecting the interpreted geology. The 0.2 g/t boundary is considered a natural geological cut‐off for mineralized material within the Jibal Qutman deposit.
Orebody solids were projected a maximum of 50m down dip of last mineralized intercepts and a maximum of 50m along strike. Top cutting was carried out to reduce the influence of any values that were outside of the general statistical population. Top cutting was based upon continuity in log probability plots and carried out by individual domain.
Top‐cuts were applied to 5 of the 7 resource zones to reduce the influence of any values which were outside the general statistical population. Top cutting was carried out by visual examination of the generally low grade database as well as checking by histograms and top cuts were chosen to remove obviously anomalous high grades without significant reduction to the mean grade of the deposit. In addition and prior to top cutting assays considered anomalous were reviewed on screen and found to be narrow high grade veins or possibly coarse gold and were truly anomalous compared to surrounding data.
Variography was undertaken to: a) Estimate the presence of anisotropy in the deposit; b) Derive the spatial continuity of mineralization along the
principal main anisotropic orientations; c) Produce suitable variogram model parameters for use in

19
Criteria JORC Code explanation Commentary
geostatistical grade interpolation; d) Assist in selection of suitable search parametres upon which to
base the resource estimation.
Directional semi‐variograms for the along strike, down dip and down hole directions were generated for Au for individual resource zones using the drill hole composites. The nugget variances were modelled constrained by orebody solids from average down hole variograms based on a 1.0 m lag reflecting the down hole drill hole composite spacing.
Variograms were constructed using the nugget and 1 spherical
structure for 5 of 7 resource zones. Two did not have sufficient data to produce interpretable structures. For these zones nearest and most geologically similar variogram models from interpreted zones were used. The principal direction of continuity was based on known geological and structural continuity for each resource zone. The three orthogonal orientations represented the predominant along‐strike, down‐dip and cross‐strike directions. A variogram was constructed for 5 of the 7 resource zones along‐strike, down‐dip and cross‐strike for each resource zone and these variograms indicated ranges of approximately 20 ‐ 50m along strike, 20 ‐ 30m down dip and 4 ‐ 6m cross strike depending on resource zone and veins within resource zones.
A 1.0m sample composite length downhole has been applied after histogram analysis of sample length indicates the predominant sample length to be 1.0m.
The estimate was carried out in Datamine Studio 3 and Advanced
Geostatistics Modules, registered mining and resource software using dynamic anisotropy and ordinary kriging.
The estimate was carried out in a three pass ordinary kriging plan, where successive search volumes were 2 and 4 factors larger than

20
Criteria JORC Code explanation Commentary
The availability of check estimates, previous estimates and/or mine production records and whether the Mineral Resource estimate takes appropriate account of such data.
The assumptions made regarding recovery of by‐products.
Estimation of deleterious elements or other non‐grade variables of economic significance (e.g. sulphur for acid mine drainage characterisation).
In the case of block model interpolation, the block size in relation to the average sample spacing and the search employed.
Any assumptions behind modelling of selective mining units. Any assumptions about correlation between variables.
Description of how the geological interpretation was used to control the resource estimates.
the initial search ellipse. The initial search ellipse for each resource zone was determined by the variability distances for X and Y, and 1 to 1/3 of the variability in Z (cross‐strike). A key‐field parameter was used (Borehole ID) in the first two passes, so as not to allow the population of a cell by samples from one key‐field value. The maximum number of samples from a key‐field was 3. Parent cell discretization was 3*3*1.
The Jibal Qutman deposit is a newly discovered prospect and has been worked exclusively by the KEFI Minerals Joint Venture (Gold & Minerals LLC) and no previous estimates are available. Resource estimates are carried out on a regular basis as internal and published company reports approximately 6 months apart.
Jibal Qutman is essentially a gold deposit and due to the low unit value of silver all exploration work and resource estimates have focused on gold and no emphasis has been placed on the presence of, and estimate of a silver Mineral Resource. KEFI did not carry out an estimate of silver resources in this resource update.
No estimates have been carried out.
The block model was constructed in Datamine with parent cells 10 ‐ 10 – 1m (X,Y,Z) and sub‐celling to 1,1,1m (Z direction subcelled to 0.25m against lithology and oxidation surface). o Average sample spacing is approximately 50m x 25m x 1m in
the bulk of the deposit (X,Y,Z). o Scoping study level studies of selective mining units have been
carried out and it is considered a selective mining unit of 2.0 m E by2.5 m N by 2.5 m RL can be used to delineate practical mining areas.
o No assumptions have been made.
The interpretation was carried out by the exploration team based on all previous KEFI geologists’ interpretations which were carried out on paper cross sections based on all drillhole logging, trench

21
Criteria JORC Code explanation Commentary
Discussion of basis for using or not using grade cutting or capping.
The process of validation, the checking process used, the comparison of model data to drill hole data, and use of reconciliation data if available.
mapping and surface mapping and updated approximately every quarter. The current digital interpretation reflects the most recent exploration interpretation and pays particular attention to a gold‐quartz vein relationship. Digital interpretations were reviewed and discussed with the exploration team before final orebody solids modelling. The exploration team has 4 years of experience working with the Jibal Qutman prospect and have amassed considerable geological data and knowledge upon which to base their interpretations. The correlation between Carbonate alteration, quartz veining (massive, stockwork and vein arrays), pyritization and grade is strong and is a contributor along with grade for the interpretation of constraining wireframes for grade estimation.
Top‐cuts were applied to 5 of the 7 resource zones which were estimated to reduce the influence of any values which were outside the general population. Top cutting was carried out by visual examination of the generally low grade database as well as checking by histograms and top cuts were chosen to remove obviously anomalous high grades without significant reduction to the mean grade of the deposit. In addition and prior to top cutting assays considered anomalous were reviewed on screen and found to be narrow high grade veins or possibly coarse gold and were truly anomalous compared to surrounding data.
Top cuts were applied to composite assays constrained by orebody solids prior to grade estimation in Datamine.
Following grade estimation a statistical and visual assessment of the block model was undertaken to: o assess successful application of the estimation passes, o to ensure that as far as the data allowed, all blocks within
mineralization domains were estimated, o check the model estimates performed as expected.
The model validation methods carried out included: o A visual assessment of grade; o Global statistical grade validation;

22
Criteria JORC Code explanation Commentary
o Assessment of volume of solids and block model; o SWATH plot (model grade profile) analysis.
Visual: A visual comparison of composite sample grade and block grade was conducted in cross section and in plan. Visually the model was generally considered to spatially reflect the composite grades.
Statistical: Statistical analysis of the block model was carried out for comparison against the composited drill hole data. This analysis provides a check on the reproduction of the mean grade of the composite data against the model over the global domain. Typically, the mean grade of each domain should not be significantly different than that of the samples from which it has been derived. Overall, these global average grades compare well for more well informed areas of the block model.
SWATH plots have been generated from the model by averaging both the composites and blocks along northings at 75m intervals, Easting and mRL at 25 m intervals. SWATH plots were generated for the ordinary kriged gold estimate and should exhibit a close relationship to the composite data upon which the estimation is based. Comparison is generally good particularly where sample composite data density is high.
Moisture Whether the tonnages are estimated on a dry basis or with natural moisture, and the method of determination of the moisture content.
Tonnages were estimated on a dry basis.
Cut‐off parametres
The basis of the adopted cut‐off grade(s) or quality parametres applied. Orebody solids were interpreted at a 0.2 g/t grade boundary reflecting the interpreted geology. The 0.2 g/t boundary is considered a natural geological cut‐off for mineralized material within the Jibal Qutman deposit.
Mining factors or assumptions
Assumptions made regarding possible mining methods, minimum mining dimensions and internal (or, if applicable, external) mining dilution. It is always necessary as part of the process of determining reasonable prospects for eventual economic extraction to consider potential mining methods, but the assumptions made regarding mining methods and parametres when estimating Mineral Resources may not always be
Basic mining studies have been carried out internally and with the assistance of suitable qualified consultants in order to confirm assumptions. A selective mining unit (SMU) of 2.0 m E by 5.0 m N by 2.5 m RL was used to delineate practical mining areas. The SMU is the smallest volume of material that can be removed by the assumed ore mining equipment. The standard size machine for

23
Criteria JORC Code explanation Commentary
rigorous. Where this is the case, this should be reported with an explanation of the basis of the mining assumptions made.
selective mining of ore was assumed to be an EX870 excavator in backhoe configuration. The standard size bucket for this machine has a capacity of 2.4m3 with a nominal width of 1.7 m. Based on this configuration a minimum SMU width of 2m wide was assumed. Bench height sensitivity analysis suggested a flitch height of 2.5m would provide the optimal mining recovery. The length of the SMU block was nominally set to 5m. A mining dilution of 10% at 0.0 g/t was applied to approximate an unplanned dilution skin surrounding the ore zones. A mining recovery of 95% was assumed to reflect operational errors from mining.
Metallurgical factors or assumptions
The basis for assumptions or predictions regarding metallurgical amenability. It is always necessary as part of the process of determining reasonable prospects for eventual economic extraction to consider potential metallurgical methods, but the assumptions regarding metallurgical treatment processes and parametres made when reporting Mineral Resources may not always be rigorous. Where this is the case, this should be reported with an explanation of the basis of the metallurgical assumptions made.
DDH and RC drill samples from 22 drill holes were selected from various locations to test variability within the orebody. Comprehensive head assays including soluble gold analysis, basic direct cyanidation (Bottle Roll), Column Leach tests, mineralogy (QEMSCAN) diagnostic tests and a rougher flotation test were undertaken by qualified consultants (ALS Perth) advised by G&M metallurgists.
Environmental factors or assumptions
Assumptions made regarding possible waste and process residue disposal options. It is always necessary as part of the process of determining reasonable prospects for eventual economic extraction to consider the potential environmental impacts of the mining and processing operation. While at this stage the determination of potential environmental impacts, particularly for a greenfields project, may not always be well advanced, the status of early consideration of these potential environmental impacts should be reported. Where these aspects have not been considered this should be reported with an explanation of the environmental assumptions made.
An internal Environmental and Social Assessment study has been carried out with suitably qualified local Saudi Arabian consultants to asses all aspects of environment and social aspects which are likely to impact on an operating mine site at the Jibal Qutman prospect.
This study also reviewed in detail the disposal and storage of waste rock and process tailings materials in accordance with the relevant legislation and design parameters applicable to the prospect area.
Bulk density Whether assumed or determined. If assumed, the basis for the assumptions. If determined, the method used, whether wet or dry, the frequency of the measurements, the nature, size and representativeness of the samples.
The bulk density for bulk material must have been measured by methods that adequately account for void spaces (vugs, porosity, etc), moisture and differences between rock and alteration zones within the deposit.
Discuss assumptions for bulk density estimates used in the evaluation process of the different materials.
A density value of 2.65g/cm3 was applied to sulphide, and a value of 2.63g/cm3 applied to oxide domain are used in the estimate. The values used are based on specific gravity testwork carried out during exploration on mineralized diamond drill core intercepts.
In total 40 samples were tested for specific gravity at the Al Amri laboratory in Jeddah Saudi Arabia. Samples were chosen from depths of approximately 10 to 50 m below surface and statistics of measurements returned mean 2.73, median 2.69 and mode 2.64

24
Criteria JORC Code explanation Commentary
resulting in a global default density of 2.65 being chosen as a robust, slightly conservative and generally representative specific gravity for Jibal Qutman mineralization.
Classification The basis for the classification of the Mineral Resources into varying confidence categories.
Whether appropriate account has been taken of all relevant factors (i.e. relative confidence in tonnage/grade estimations, reliability of input data, confidence in continuity of geology and metal values, quality, quantity and distribution of the data).
Whether the result appropriately reflects the Competent Person’s view of the deposit.
Criteria for defining resource categories were derived from a combination of the geostatistical studies (grade continuity), mineralisation continuity via cross sectional interpretations and drill hole spacing.
The central areas of each of the ore zones of the deposit show the greatest continuity of mineralization and structure and the drill hole/trenching spacing in these areas is generally on a 50m by 25m to 50m by 50m grid. KEFI consider this to be relatively well sampled in comparison to other moderate to high nugget gold deposits and provides sufficient coverage to give confidence to the geological interpretation. Given the nature of the geological and grade continuity encountered within the deposit, KEFI consider the sample spacing to be adequate to define the mineralization in these areas for medium to long term mine planning and potentially for the reporting of Indicated Mineral Resources.
In peripheral areas, generally along strike of the central zones or down dip of deeper intersections, where the current drill hole and trenching spacing may range from 50m by 50m up to 50m by 100m KEFI consider the sample spacing to be suitable only for long term mine planning (life of mine) and, where appropriate, the reporting of Inferred and extrapolated mineral resources.
Audits or reviews
The results of any audits or reviews of Mineral Resource estimates. No audits or external reviews have been carried out.
Discussion of relative accuracy/ confidence
Where appropriate a statement of the relative accuracy and confidence level in the Mineral Resource estimate using an approach or procedure deemed appropriate by the Competent Person. For example, the application of statistical or geostatistical procedures to quantify the relative accuracy of the resource within stated confidence limits, or, if such an approach is not deemed appropriate, a qualitative discussion of the factors that could affect the relative accuracy and confidence of the estimate.
Statistical and visual validation and checking of the block model confirm it performs as expected globally and locally in plan and section within the 2015 drill database and structural comparison with surface and trench mapping confirm mineralized zones to outcrop where expected and be the approximate thickness as indicated by the block model.
25
Criteria JORC Code explanation Commentary
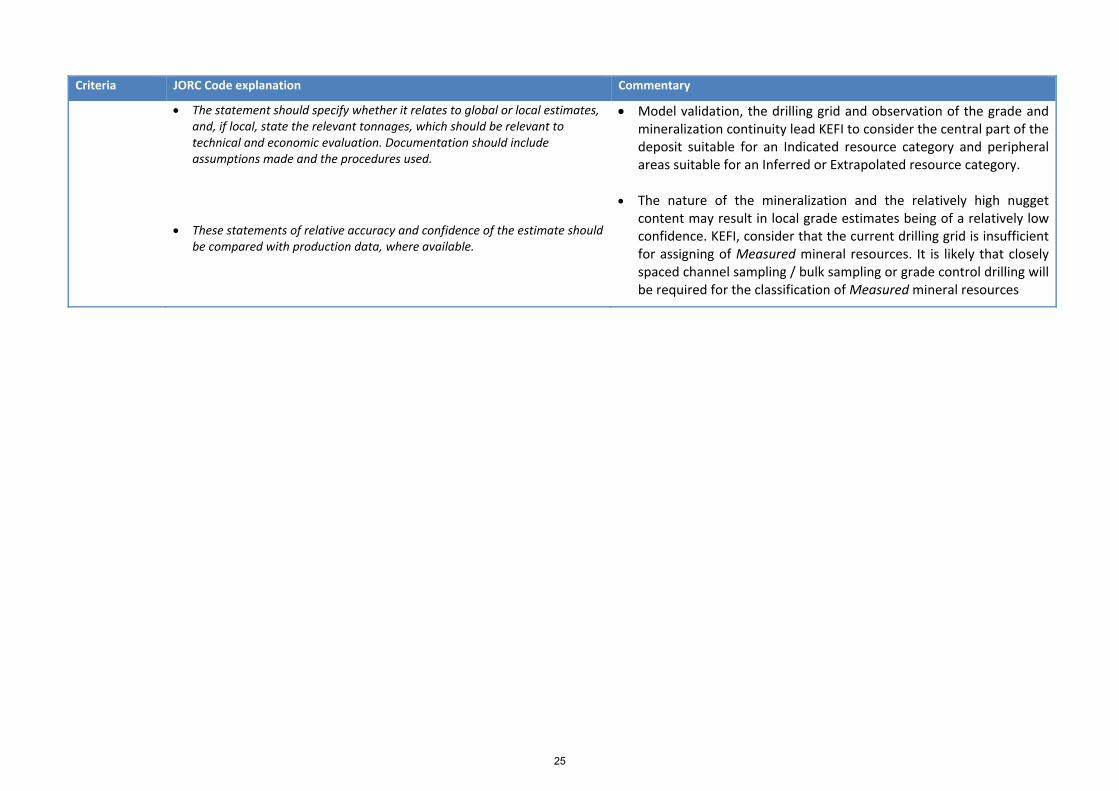
The statement should specify whether it relates to global or local estimates, and, if local, state the relevant tonnages, which should be relevant to technical and economic evaluation. Documentation should include assumptions made and the procedures used.
These statements of relative accuracy and confidence of the estimate should be compared with production data, where available.
Model validation, the drilling grid and observation of the grade and mineralization continuity lead KEFI to consider the central part of the deposit suitable for an Indicated resource category and peripheral areas suitable for an Inferred or Extrapolated resource category.
The nature of the mineralization and the relatively high nugget content may result in local grade estimates being of a relatively low confidence. KEFI, consider that the current drilling grid is insufficient for assigning of Measured mineral resources. It is likely that closely spaced channel sampling / bulk sampling or grade control drilling will be required for the classification of Measured mineral resources