keeping it together - international institute for energy...
TRANSCRIPT
1
© 2017, General Electric Company. Proprietary information. All rights reserved.© 2016 General Electric Company - All rights reserved
Keeping it Together
International Conference on Energy Systems Integration; Denver | December 6, 2017
Nicholas W Miller, Senior Technical Director, Energy Consulting, GE Power
Transient stability in a world fully electrified by wind & solar generation

Confidential. Not to be copied, reproduced, or distributed without prior approval.
CAUTION CONCERNING FORWARD-LOOKING STATEMENTS:
This document contains "forward-looking statements" – that is, statements related to
future events that by their nature address matters that are, to different degrees,
uncertain. For details on the uncertainties that may cause our actual future results to
be materially different than those expressed in our forward-looking statements, see
http://www.ge.com/investor-relations/disclaimer-caution-concerning-
forwardlooking-statements as well as our annual reports on Form 10-K and quarterly
reports on Form 10-Q. We do not undertake to update our forward-looking
statements. This document also includes certain forward-looking projected financial
information that is based on current estimates and forecasts. Actual results could
differ materially. to total risk-weighted assets.]
NON-GAAP FINANCIAL MEASURES:
In this document, we sometimes use information derived from consolidated financial data but not presented in our financial statements
prepared in accordance with U.S. generally accepted accounting principles (GAAP). Certain of these data are considered “non-GAAP
financial measures” under the U.S. Securities and Exchange Commission rules. These non-GAAP financial measures supplement our GAAP
disclosures and should not be considered an alternative to the GAAP measure. The reasons we use these non-GAAP financial measures
and the reconciliations to their most directly comparable GAAP financial measures are posted to the investor relations section of our
website at www.ge.com. [We use non-GAAP financial measures including the following:
• Operating earnings and EPS, which is earnings from continuing operations excluding non-service-related pension costs of our principal pension plans.
• GE Industrial operating & Verticals earnings and EPS, which is operating earnings of our industrial businesses and the GE Capital businesses that we expect to retain.
• GE Industrial & Verticals revenues, which is revenue of our industrial businesses and the GE Capital businesses that we expect to retain.
• Industrial segment organic revenue, which is the sum of revenue from all of our industrial segments less the effects of acquisitions/dispositions and currency exchange.
• Industrial segment organic operating profit, which is the sum of segment profit from all of our industrial segments less the effects of acquisitions/dispositions and currency exchange.
• Industrial cash flows from operating activities (Industrial CFOA), which is GE’s cash flow from operating activities excluding dividends received from GE Capital.
• Capital ending net investment (ENI), excluding liquidity, which is a measure we use to measure the size of our Capital segment.
• GE Capital Tier 1 Common ratio estimate is a ratio of equity
Keeping it Together
6 December, 2017

3
© 2017, General Electric Company. Proprietary information. All rights reserved.
What the policy people see3
Source: NREL
4
© 2017, General Electric Company. Proprietary information. All rights reserved.
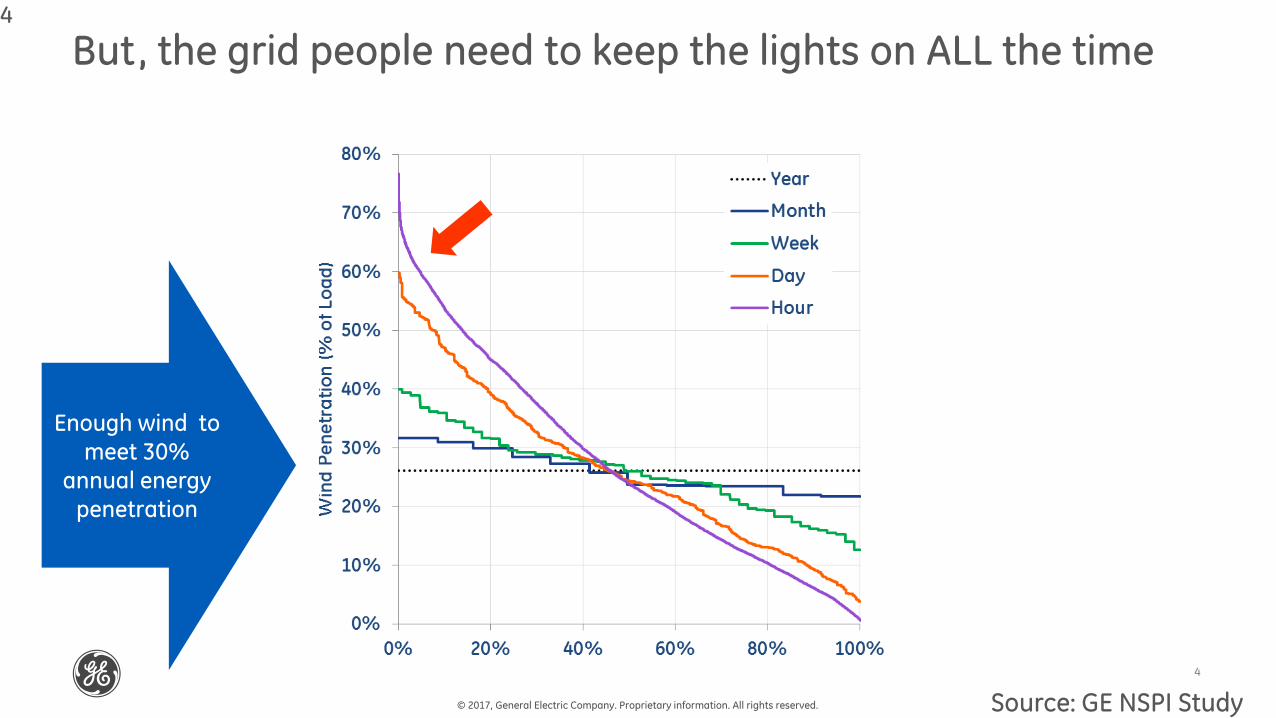
But, the grid people need to keep the lights on ALL the time4
Source: GE NSPI Study
Enough wind tomeet 30%
annual energypenetration

5
© 2017, General Electric Company. Proprietary information. All rights reserved.
At periods of high instantaneous penetration, things get interesting
5
Wind 4.5
PV 7.5
CSP 2.2DG5.7
Others 12.4
Wind 8.3
PV 0.2CSP 0.0DG 0.1
Others 9.3
Wind 7.0
PV 0.7CSP 0.0DG 0.7
Others 4.1
Wind 10.9
PV 5.1
CSP6.1
DG 3.8
Others 9.1
Production/Dispatch in GWSource: NREL/GE WWSIS 3a

6
© 2017, General Electric Company. Proprietary information. All rights reserved.
What the grid people see6
• ~10000 nodes• 38 balancing authorities• ~120,000 circuit miles of
transmission• ~4000 generators-
~265GW • ~5000 loads• ~100,000 state variables

7
© 2017, General Electric Company. Proprietary information. All rights reserved.
Is it stable?
Derived from original figure by ElgerdElgerd, Olle, I. 1971. “Electric Energy Systems Theory: An Introduction” McGraw-Hill, pg 478.

8
© 2017, General Electric Company. Proprietary information. All rights reserved.
8
What happens when the flow patterns change?
Heavy summer Base
Heavy summer Base with high COI flows
Heavy summer High Mix with high COI flows
12
3
2
3
1
California, Oregon interface power flow (MW)
4,800 MW
Time (Seconds)
P (M
M)
A disturbance on the north-south
corridor between Oregon and California
(Trip of the Pacific DC Intertie)
Source: NREL/GE WWSIS 3a
Same generation
& new flows -failure
More wind & solar AND
new flows – fails too, but less badly!

9
© 2017, General Electric Company. Proprietary information. All rights reserved.
“Strong Grid” “Weak Grid” “Impending Fault”
What about “weak grids”? What is Grid Strength?• Grid strength is like a “stiffness” of a power system
• It is specifically for voltage (not frequency)
• Unlike frequency stability, location matters
• In a strong grid, bus voltages do not change much when the system is ‘whacked’ by a disturbance like a fault
• In a weak grid, bus voltages change a lot during disturbances like faults
10
© 2017, General Electric Company. Proprietary information. All rights reserved.
0
5000
10000
15000
20000
25000
30000
35000
Base Hi-Mix Extreme Base Hi-Mix Extreme
Dis
pat
ch/P
rod
uct
ion
(M
W)
WIND
PV
CSP
GAS+
HYDRO
NUCLEAR
COAL
Ge
ne
rati
on
pro
du
cti
on
(GW
)
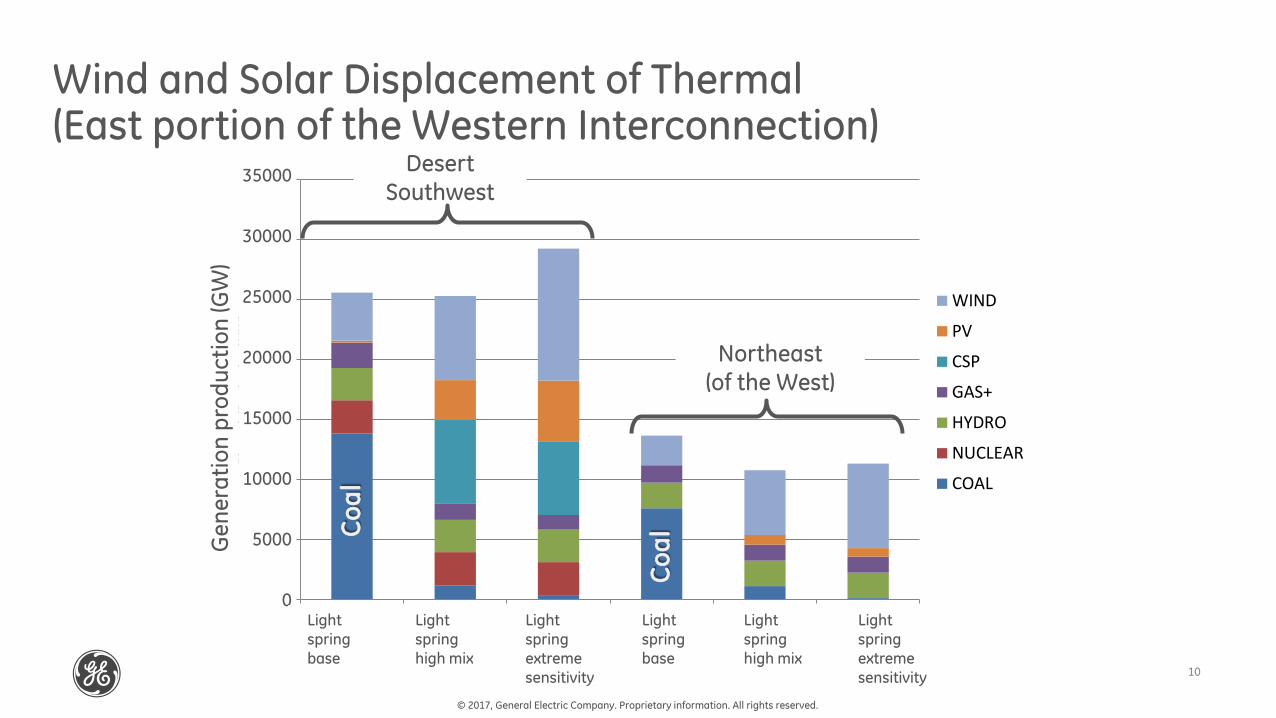
Desert Southwest
Northeast (of the West)
Co
al
35000
30000
25000
20000
15000
10000
5000
0
Co
al
Lightspringbase
Lightspringhigh mix
Lightspringextremesensitivity
Lightspringbase
Lightspringextremesensitivity
Lightspringhigh mix
Wind and Solar Displacement of Thermal (East portion of the Western Interconnection)

11
© 2017, General Electric Company. Proprietary information. All rights reserved.
Weak Grid Example: Transient Stability in Northeastern Western Interconnection
L
Aeolus
500kV
Large Coal PlantsGateway South 500kV transmission project
Gateway West 500kV transmission project

12
© 2017, General Electric Company. Proprietary information. All rights reserved.
It depends on how stressed the system is:
0
0.2
0.4
0.6
0.8
1
1.2
0 0.5 1 1.5 2
Wyo
dak
23
0kV
Vo
ltag
e (p
u)
Time (Seconds)
High Mix Extreme
Highly stressed,
but stable
Too stressed, unstable: failure is very fast
Source: NREL/GE WWSIS 3a
13
© 2017, General Electric Company. Proprietary information. All rights reserved.
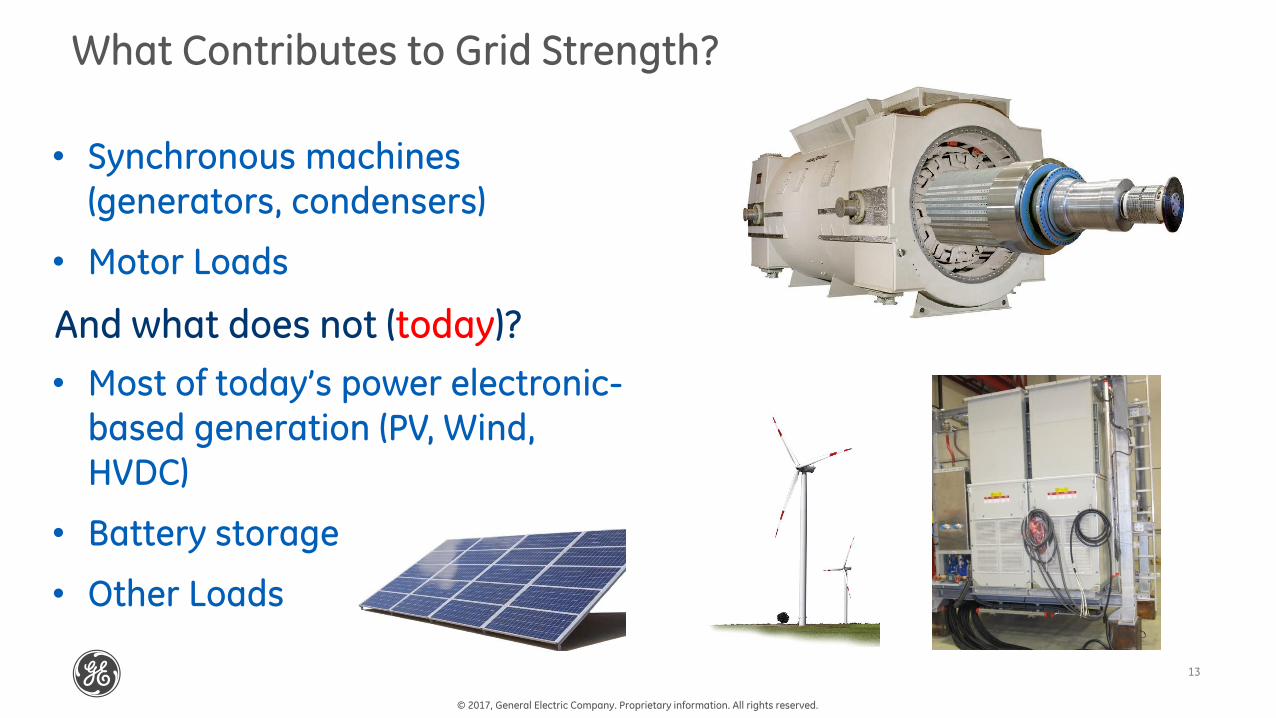
• Synchronous machines
(generators, condensers)
• Motor Loads
• Most of today’s power electronic-
based generation (PV, Wind,
HVDC)
• Battery storage
• Other Loads
What Contributes to Grid Strength?
And what does not (today)?

14
© 2017, General Electric Company. Proprietary information. All rights reserved.
Dave Johnson Voltage
Light Spring BaseLight Spring High Mix Light Spring ExtremeLight Spring Extreme with synchronous condenser conversion
Synchronous Condenser Conversion Results in Acceptable Performance even under extreme stress
Disturbance: Aeolus bus fault and line trip
1
3
2
4
1
2
3
4
Reinforcements for Extreme sensitivity makes the system stable again: 3 condensers total ~1700MVA plus ~500 MVAr shunt banks.
Repurpose the old stuff!
Source: NREL/GE WWSIS 3a

15
© 2017, General Electric Company. Proprietary information. All rights reserved.
Weak Grid – why the wind & solar need to keep improving
Small wind plant relative to grid Large wind plant relative to grid
1 Ton
Source: NREL/GE WWSIS 3a

16
© 2017, General Electric Company. Proprietary information. All rights reserved.
Better controls can make a huge difference:
0
0.2
0.4
0.6
0.8
1
1.2
1.4
0 0.5 1 1.5 2
Wyo
dak
23
0kV
Vo
ltag
e (p
u)
Time (Seconds)
High Mix
Extreme without pre-disturbance overloads with less aggressive LVPL
Extreme without pre-disturbance overloads with OEM weak grid controlsFail with “standard”
controls
“saved” with weak grid controls on the
wind plants
Source: NREL/GE WWSIS 3a

17
© 2017, General Electric Company. Proprietary information. All rights reserved.
“Load Netting” isn’t adequate anymore
P = P0((ap +bpV +cpV2) x (1+kpfF))
Q = Q0((aq +bqV +cqV2) x (1+kqfF))
Today: we simplify to
this!!!!P + jQ
General practice is for “load netting”:
What is lost when distributed PV is “buried” in net load:
• Load shedding is wrong.
• Vulnerability to common mode tripping of dPV is lost.
• Weather impacts can’t be captured.
• Dynamics of dPV are lost.
“ZIP” load model
18
© 2017, General Electric Company. Proprietary information. All rights reserved.
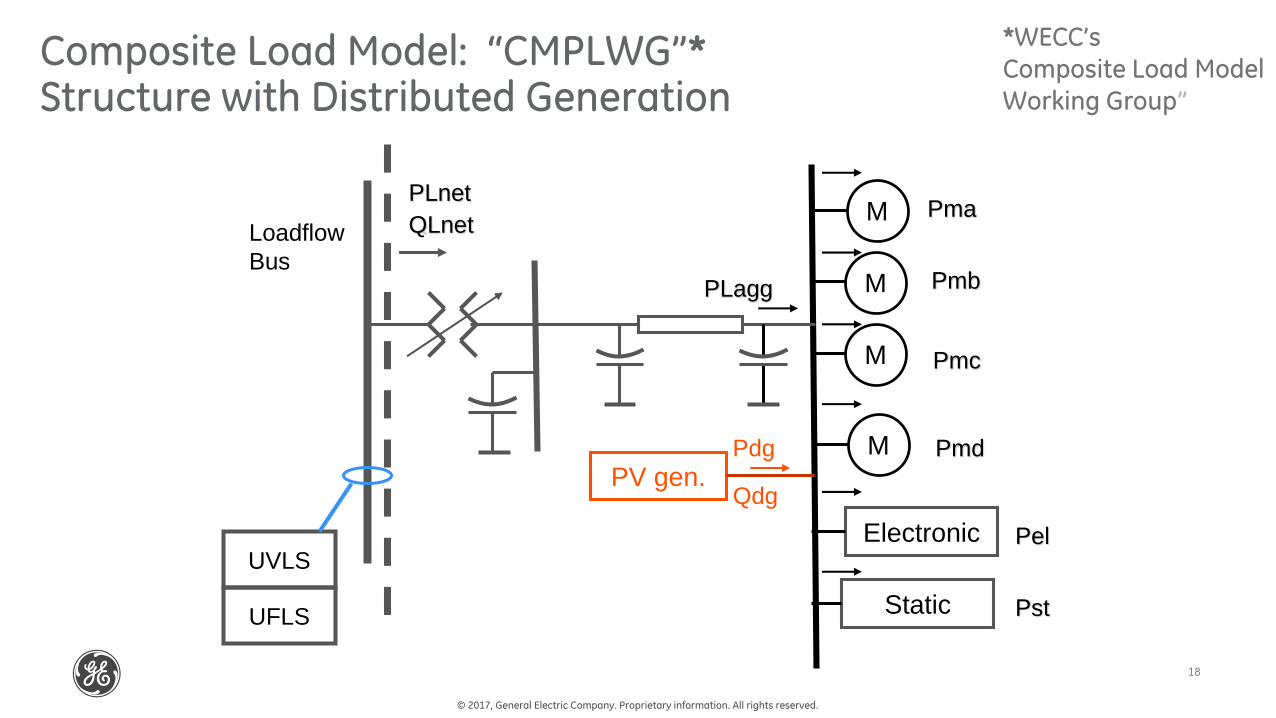
Composite Load Model: “CMPLWG”*Structure with Distributed Generation
Electronic
M
M
M
Loadflow
Bus
Static
M
UVLS
UFLS
PLagg
PV gen.
PLnet
Pdg
Pma
Pmb
Pmc
Pmd
Pel
Pst
QLnet
Qdg
*WECC’s Composite Load Model Working Group”

19
© 2017, General Electric Company. Proprietary information. All rights reserved.
The behavior of the load can dominate the system dynamics
Same disturbance* - very different
outcome
Std WECC load model (blue)
192GW total load modeled as induction motor (18%
overall) + static – fast voltage recovery, very stable
response
Composite load model (red)
143.9 GW modeled as composite load – fails to recover
There’s a shocking dearth of actual supporting data!!!
Load behavior dominates system response – what will ESI “loads” look like?
*
• 3Φ fault at Vincent 500 kV
• Clear fault and trip 2 Midway-Vincent lines in 6 cycles
• No load shedding in either case
Source: NREL/GE WWSIS 3

20
© 2017, General Electric Company. Proprietary information. All rights reserved.
20
Fault ride-through is critical:Impact of common-mode tripping of DG without low-voltage ride-through
Pessimistic
DG with LVRTDG without LVRT
1
2
1
2
Distributed PV tripped on fault: took entire
system down.
Distributed PV behaved well on fault: recovery
satisfactory
Source: NREL/GE WWSIS 3

21
© 2017, General Electric Company. Proprietary information. All rights reserved.
Is it stable with ESI?
Derived from original figure by Elgerd
Goran’s factories

22
© 2017, General Electric Company. Proprietary information. All rights reserved.
What happens in an ESI world?
It seems inevitable that this simplification will be
wildly inadequateP + jQ
The “load” becomes an even more complex and active element
What might bite us?
• “Prosumer” fault ride-through
• Vehicle to Grid; Grid to Vehicle dynamics.
• Active thermal loads; new load dynamics
• Embedded energy storage.
• Load dynamics driven by weather or externalities (that we
ignore today).

23
© 2017, General Electric Company. Proprietary information. All rights reserved.
Main grid
Subgrid with only load and
inverter-based
generation
Tie-line(s)
What happens when the grid breaks up? Consequences in an ESI World are even more dire…..
24
© 2017, General Electric Company. Proprietary information. All rights reserved.
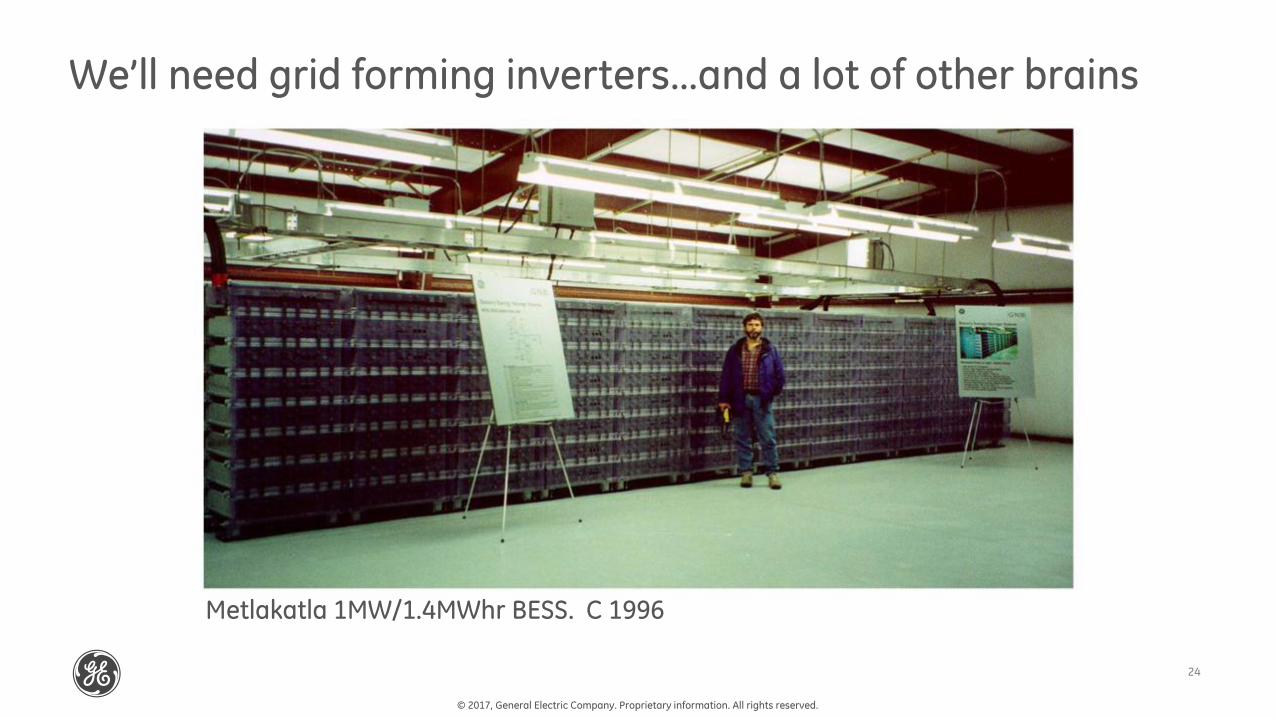
We’ll need grid forming inverters…and a lot of other brains
Metlakatla 1MW/1.4MWhr BESS. C 1996

25
© 2017, General Electric Company. Proprietary information. All rights reserved.
Take aways
© 2016, General Electric Company. Proprietary information. All rights reserved.
The Grid and ESI future is only as reliable as it is stable• Reliability must be and can be as good or better, with well designed systems. • Flexibility, flexibility, flexibility• Transmission is (still) needed.
System Dynamics are already complex, and getting more so.• Understanding and tools must evolve• ESI brings a whole new layer of complexity and opportunity
Using the actual power system as a simulator is uneconomic and
irresponsible• We’ve got research to do, and we’d better get to it!

26
© 2017, General Electric Company. Proprietary information. All rights reserved.
Thanks…
Source: GE Power Marketing, GE Energy Consulting