ke pd-vcs … · web viewghg sequestration is creating a long-term income stream and developing...
TRANSCRIPT

MONITORING REPORT : VCS Version 3
MONITORING REPORTFOR
TIST PROGRAM IN KENYAVCS-006, VERIFICATION 03
Document Prepared By Clean Air Action Corporation
Project Title TIST Program in Kenya, VCS 006
Version Version 03
Report ID KE PD-VCS-006, Verification 03
Date of Issue 01-March-2018
Project ID VCSPD899
Monitoring Period 01-January-2014 to 01-March-2018
Prepared By Charlie Williams, Vice President
Contact Clean Air Action Corporation4112 Timbervale DriveEvergreen CO, USA 80439Telephone [email protected]
v3.4 1

MONITORING REPORT : VCS Version 3
Table of Contents
1 Project Details...................................................................................................................31.1 Summary Description of the Implementation Status of the Project................................................31.2 Sectoral Scope and Project Type..................................................................................................31.3 Project Proponent.......................................................................................................................... 31.4 Other Entities Involved in the Project............................................................................................41.5 Project Start Date.......................................................................................................................... 41.6 Project Crediting Period................................................................................................................41.7 Project Location............................................................................................................................. 51.8 Title and Reference of Methodology..............................................................................................51.9 Other Programs............................................................................................................................. 5
2 Implementation Status.................................................................................52.1 Implementation Status of the Project Activity................................................................................62.2 Deviations...................................................................................................................................... 8
2.2.1 Methodology Deviations.........................................................................................................82.2.2 Project Description Deviations...............................................................................................8
2.3 Grouped Project............................................................................................................................ 8
3 Data and Parameters..................................................................................123.1 Data and Parameters Available at Validation..............................................................................133.2 Data and Parameters Monitored.................................................................................................163.3 Monitoring Plan........................................................................................................................... 17
3.3.1 Organization and Responsibilities........................................................................................173.3.2 Data Management and QA/QC............................................................................................183.3.3 Monitoring and Carbon Calculations....................................................................................193.3.4 Accuracy.............................................................................................................................. 22
4 Quantification of GHG Emission Reductions and Removals............................234.1 Baseline Emissions..................................................................................................................... 234.2 Project Emissions........................................................................................................................234.3 Leakage....................................................................................................................................... 244.4 Net GHG Emission Reductions and Removals...........................................................................24
APPENDICES:.........................................................................................................................25
v3.4 2

MONITORING REPORT : VCS Version 3
1 PROJECT DETAILS
1.1 Summary Description of the Implementation Status of the Project
The International Small Group and Tree Planting Program (TIST) empowers Small Groups of subsistence farmers in Kenya, Uganda, India and Tanzania to combat the devastating effects of deforestation, poverty and drought. Combining sustainable development with carbon sequestration, TIST supports the reforestation and biodiversity efforts of about 75,000 subsistence farmers. Carbon credit sales generate participant income and provide project funding to address agricultural, HIV/AIDS, nutritional and fuel challenges. As TIST expands to more groups and more areas, it ensures more trees, more biodiversity, more climate change benefit and more income for more people.
Since its inception in 1999, TIST participants organized into over 11,000 TIST Small Groups have planted over 16 million trees on their own and community lands. GhG sequestration is creating a long-term income stream and developing sustainable environments and livelihoods. TIST in Kenya began in 2004 and has grown to nearly 65,000 TIST participants in almost 9,000 Small Groups.
KE PD-VCS-006 is a grouped AFOLU project, eligible under the Afforestation, Reforestation and Revegetation (ARR) category. It is a subset of the TIST project in Kenya and initially applied to 3,961 of the Small Groups, 29,222 members, 18,099 project areas and 7,419.2 ha. The PD was validated and first verified on 27 September 2012 by Environmental Services, Inc. (ESI). At that time all of the Project Areas were established and the monitoring systems were in place. The PD was verified a second time on 24 September 2014 by JACO CDM CO., Ltd. Although a grouped project no new instances were added during the second or this verification. The following is the Verification history, including what has been determined for this report.
Verification Number Date Monitoring Period
Gross Reductions Buffer Issuance
This Report Pending 01-Jan-04 to 01-Mar-18 xxx xxx xxxLess Verif 01 27-Sep-12 01-Jan-04 to 29-Jun-12 188,649 18,865 169,784Less Verif 02 24-Sep-14 30-Jun-12 to 31-Dec-13 154,225 15,423 138,802Net This Report Pending 01-Jan-14 to 01-Mar-18 xxx xxx xxx
1.2 Sectoral Scope and Project Type
This project is registered under the Verified Carbon Standard (VCS, 3.2) as an Afforestation, Reforestation and Revegetation (ARR) project and has been developed in compliance with the VCS Guidance for Agriculture, Forestry and Other Land Use Projects (VCS, 3.2). It is a grouped project.
1.3 Project Proponent
Organization name Clean Air Action Corporation (CAAC)
Contact person Charles E. Williams
v3.4 3

MONITORING REPORT : VCS Version 3
Title Vice President
Address 4112 Timbervale Drive, Evergreen CO 80439
Telephone +1-720-394-2112
Email [email protected]
1.4 Other Entities Involved in the Project
Organization name Institute for Environmental Innovation (I4EI)
Role in the project Manages sustainable development components of TIST
Contact person Vannesa Henneke
Title Executive Director
Address 250 Old Harbor Rd, Vinalhaven, ME 04863
Telephone +1-918-592-0311
Email [email protected]
Organization name United States Agency for International Development (USAID)
Role in the project Provided funding for sustainable development components (2005-2008, 2009-2014)
Contact person Enoch Kanyanga
Title Technical Officer
Address USAID-Kenya c/o American EmbassyUnited Nations Avenue, Gigiri,P. O. Box 629, Village Market-00621Nairobi, Kenya
Telephone + 254-20-862-2000
Email [email protected]
1.5 Project Start Date
01-January-2004.
1.6 Project Crediting Period
30 years starting 01-January-2004 and ending to 31-December-2033
v3.4 4

MONITORING REPORT : VCS Version 3
1.7 Project Location
The TIST Kenya Project is located in central Kenya in the Central, Rift Valley and Eastern Provinces. Most of the project activity is centered around Meru and Nanyuki. The individual project areas, their location and their boundaries are presented in a KML file, Appendix 031.
1.8 Title and Reference of Methodology
The monitoring methodology used by the Project is CDM AR-AMS0001 Version 06: "Simplified baseline and monitoring methodologies for small-scale afforestation and reforestation project activities under the clean development mechanism implemented on grasslands or croplands" and the associated tools. AFOLU Non-Permanence Risk Tool version 3.2 was also used. No other tools or methodologies were used for this verification report.
1.9 Other Programs
The Project is certified under Climate, Community and Biodiversity Standard (CCBA) as “TIST Program in Kenya, VCS 006”. CCBA does not issue GhG credits. The Project does not participate in any other forms of environmental credits or GHG programs.
1.10 Sustainable Development
The following are the sustainable development goals that TIST addresses.2
No Poverty: TIST provides cash income from carbon credits and sustainable development benefits monetized at over 140,000 Ksh per person. Zero Hunger: TIST promotes Conservation Farming to improve crop yields and planting fruit and nut trees as part of the tree planning program. Good Health and Well-being: TIST provides training in many health topics including HIV/AIDS, malaria, clean water, hygiene and indoor air pollution. Gender Equality: TIST creates an environment for gender equality whereby women are given the same opportunities as men. It is enforced by ensuring there is a gender balance in employment, leadership and representation. Clean Water and Sanitation: TIST provides training in clean water and hygiene. TIST also trains and encourages tree plant along water courses to reduce run-off and erosion. Affordable and Clean Energy: TIST trains in the building of and use of more energy efficient cook stoves. Climate Action: TIST is a climate mitigation program. Life on Land: TIST provides biodiversity benefits by adding indigenous tree, fruit trees, nut trees and canopy. TIST farmers are trained in biodiversity. TIST project areas provide linkage and buffers with high conservation value areas.
1 Appendix 03: TIST KE PD-VCS-006d App03 PA Plots 120824.kml at http://www.tist.org/PD-KE-VCS-006%20Documents.php2 CCBA "TIST Program in Kenya, VCS 006”". TIST KE PD-CCB-006a PIR Text 170222.docx at http://www.tist.org/PD-KE-VCS-006%20Documents.php
v3.4 5

MONITORING REPORT : VCS Version 3
2 IMPLEMENTATION STATUS
2.1 Implementation Status of the Project Activity
The project has been fully operational since 2004. The project was implemented in accordance with the PD and the validation report. No new instances have been added.
As discussed more thoroughly in Section 4.3, no further leakage monitoring is required.
Permanence is addressed through the risk buffer. A Non-Permanence Risk Report was prepared under VCS 3.2 and provided to the Verifier (Appendix 12).3
411 Project Areas (2.0% of the carbon volumes) have been removed from the PD since validation and the first verification. In addition, 870 PAs (3.94% of the carbon volumes) have been put in a "Pending" category. The status of each individual PA is addressed in column AO of the "PA Summary" worksheet,4 verification data spreadsheet. If the column indicates something other than active, their status is given. The carbon of all removed or pending PAs have been set to zero. This means that remaining PAs must first make up the carbon loss before any new credits can be issued.
There are several reasons for the removal of the PA. First, however, each category description is preceded by a "treatment" code. The codes are as follows:
1. Active: These are PAs that are active in TIST and have valid tree counts and calculated carbon volumes. Only Active PAs contribute to the carbon volume of this verification.
2. Pending: These are PAs that need to be reviewed to determine if they will continue as TIST PAs or need a current quantification. They will still be listed on the PA Summary sheet to acknowledge they are currently part of the PD but for this verification their trees and carbon are zero. Once their circumstances have been reviewed, they will either be removed or listed as active. If they are listed as active, we will reestablish the tree count and carbon in subsequent verifications.
3. Removed: These PA are being permanently removed from the program. They will still be listed on the PA Summary sheet to acknowledge they were part of the PD but their trees and carbon are zero. They will not participate in the future.
The following describes the different categories and the way they are treated:
a. Pending: Baseline Error: These are cases where the baseline and boundaries of a grove were taken at one location but the farmer decided to plant somewhere else. Due to the rules of VCS, the groves with the trees are not part of this PD. The baselined area can still be a project area if it is ever planted. Until that time the tree and carbon will be set to zero.
b. Pending-Change in ownership: This includes sale to others; transfer to family members that don't want to be in TIST; and subdividing to family members whom want their groves to be treated separately. If the new owners want to keep their groves in the PD, they are eligible.
c. Pending-Fire. These groves were lost to fire. If the member replants the trees will be eligible under this PD.
3 Appendix 12: TIST KE PD-VCS-006m App12 Verif 03 Risk Analysis 180301.doc at http://www.tist.org/PD-KE-VCS-006%20Documents.php4 Appendix 14: TIST KE PD-VCS-006o App14a Verif 03 Monitor Data 180301.xlsx and TIST KE PD-VCS-006o App14b Verif 03 Monitor Data 180301.xlsx at http://www.tist.org/PD-KE-VCS- 006%20Documents.php. Due to the extreme file size, Appendix 14 is split into t files. App14a is Location IDs (column B) up to 59,999 and App14a is Location IDs over 60,000.
v3.4 6

MONITORING REPORT : VCS Version 3
d. Pending-Group Quit. Some groups have quit the program. Reasons include they registered in more than one group, they were too small to qualify for carbon payments, they had a misunderstanding with another member. A group can rejoin if they change their mind and rejoin before the next verification.
e. Pending-Grove inaccessible. These PAs are too remote to be able to be serviced. If quantified in the future, they will be added in subsequent verifications.
f. Pending-Member quit. Some members have quit. Reasons include, they refuse to be quantified so they are dropped from the program; they say they have not received any carbon payments, they had a misunderstanding with another member; they felt that participation was not in their best interest; because they did not want to participate; because they felt the carbon payment was not adequate and some for undisclosed reasons. Sometimes members change their minds about quitting so they are put in a pending category. If they don't change their minds buy the next verification they will be removed.
g. Pending-Merged with another grove. These are cases where there were 2 or more original tracks on a farm and in a subsequent quantification the Quantifier merged the groves into one. Since this is not allowed under VCS rules, the carbon and trees in these groves were set to zero. If the PAs are un-merged and are requantified properly, they can become eligible in a subsequent verification.
h. Pending-Needs requantification. These are groves that are still active but we do not believe the quantification to be accurate. Most are groves that had no trees at the time of the first verification and have not been requantified. Their carbon was zero at the time of the first quantification and remains zero. Two other reasons for questioning the quantification are the data was lost during synchronization and poor quality of quantification.
i. Pending-Never planted. The members have not planted any trees in these PA. If they do they will be included in subsequent verifications.
j. Pending-Ownership dispute. This generally results when the farmer dies and the family does not agree on the inheritance. These are pending because sometime the new owners decide they want to be in TIST. Since these PAs have been validated and the baseline and additionality are not affected, this change in ownership is permitted if the new owners decide they want to keep the PAs in TIST.
k. Pending-Pest. These groves were lost to pest or disease fire. If the member replants the trees will be eligible under this PD.
l. Remove-Baseline Error. These are groves where baseline trees were erroneously marked as TIST trees. These trees have been removed and the PAs are not eligible under the PD.
m. Remove-Change in ownership: This includes sale to others; transfer to family members that don't want to be in TIST; and subdividing to family members whom want their groves to be treated separately. These are cases where new owners will not be eligible for membership.
n. Remove-Double registration. These are cases where subsequent to validation we learned that the grove had been registered twice. This includes cases where the same farmer registered the same grove in two different Small Groups and where the same grove was quantified under 2 different names.
o. Remove-Group Quit. Some groups have quit the program. Reasons include they registered in more than one group, they were too small to qualify for carbon payments, they had a misunderstanding with another member. We do not expect groups in this category to change their minds.
p. Remove-Harvest. While TIST allows beneficial thinning, we do not allow harvest. Those in this category have violated the contract and have been marked inactive. We expect most of them will be removed from TIST permanently. We have identified a few, however, that removed eucalyptus trees in order to plant indigenous trees. If that can be demonstrated, those PAs may be allowed to stay in the PD. In such a case, the carbon from the harvested trees will have been debited from the total carbon of the PA and only the carbon from the new trees will be counted.
q. Remove-Member quit. Some members have quit. Reasons include, they refuse to be quantified so they are dropped from the program; they say they have not received any carbon payments, they had a misunderstanding with another member; they felt that participation was not in their best interest; because they did not want to participate; because they felt the
v3.4 7

MONITORING REPORT : VCS Version 3
carbon payment was not adequate and some for undisclosed reasons. We do not expect members in this category to change their minds.
r. Remove-Nursery, not a tree grove. This was a nursery mislabeled a grove. s. Remove-Overlap. These are cases where subsequent to validation we learned that the grove
boundary overlapped with another grove boundary. These groves have been removed to avoid double counting.
t. Remove-Registration Error. These are groves that the farmers says were not part of TIST. The likely cause is the Quantifier misunderstood the farmer during baseline and tracked the wrong area.
u. Remove-Trees Removed. These are PAs where trees were removed because the land was needed for cultivation, home construction, powerlines, road expansion or school expansion. The land is not expected be available in the future as a TIST grove.
v. Remove-Unauthorized registration: These are cases where an unauthorized person registered the grove for TIST. Sometimes it is the wife joining and the husband later refusing.
Loss of a few PAs was discussed in the External Risk section of the Non-Permanence Risk Report. It was considered possible but of minimal risk to the carbon asset. Since this monitoring report has determined that the total carbon stocks have increased from the previous one, it is clear that the loss has not caused a loss event or reversal. According to the risk tool, the overall risk rating is 2.5, qualifying the project for the minimum buffer, 10%.
2.2 Deviations
2.2.1 Methodology Deviations
None.
2.2.2 Project Description Deviations
There are two deviations from the PD. 1) In the PD we stated "the operational processes for monitoring the actual GhG removal by the sinks are for TIST Quantifiers to visit each grove once per year and, at minimum, once every five years to count trees and collect circumference, GPS and other data" (Section 4.1.3). TIST Quantifiers are not visiting each PA (grove) once per year. 2) The PD does not address the removal of project activity instances from the PD.
Quantification Every Five Years: While counting trees and collecting circumference every five years is a requirement of the methodology (and followed by the Project), visiting every PA every year was simply an operational goal. Not making annual visits does not impact the applicability of the methodology, additionality or the appropriateness of the baseline scenario. That it was an operational goal was clearly stated in Section 4.3.5, "TIST’s internal goal is to quantify each project area once per year."
There are 18,000 PAs in this PD and over 50,000 in TIST Kenya. Unfortunately, visiting every PA every year proved to be too costly to maintain. Instead the entire TIST program in Kenya was modified and centered on a "Cluster" administrative structure. A Cluster is a group of Small Groups within walking distance that has their own local leadership. It is where Small Groups receive training, voucher payment, share "best practices," share news and newsletters and discuss quantification issues. A Quantifier is assigned to each Cluster and their scope has been broadened to include training and assisting Cluster leaders as they rotate into new positions. The Cluster provides an alternate method of gathering intelligence about what is happening at the Small Group level and to individual groves including information that might assist in monitoring
v3.4 8

MONITORING REPORT : VCS Version 3
the actual GhG removal.5 This allows us to get the same information that a Quantifier might get on a non-quantification visit (i.e. the annual visit) by asking members and their neighbors about changes, at a more sustainable cost. The ideal schedule for Cluster meetings is one per month, increasing the frequency of opportunity to learn about changes at the grove level.
Removing Project Activity Instances: While it was expected that there would be loss of trees from the PD due to harvest, etc.,6 the loss of PAs was not addressed. When a member or Small Group quits or harvests their trees, or if a PA is found to fall within one of the “remove” categories l through v in section 2.1, above, they are no longer active in the PD. The name of the grove is kept on the monitoring spreadsheet (Appendix 14), the reason for the removal is given in the “Status V3” column of the “PA Summary” worksheet of Appendix 14, and the carbon sequestered from the PA is zeroed out. By zeroing the carbon, all of the carbon credits previously issued from the PA are replaced.
2.3 Grouped Project
Although this is a grouped project, there have been no new instances since validation.
2.4 Safeguards
2.4.1 No Net Harm
TIST has conducted numerous evaluations of the program in Kenya under CCB and has determined that there are no negative environmental or socio-economic impacts. The program was designed to be beneficial to the farmers and environment. No mitigation is necessary.
2.4.2 Local Stakeholder Consultation
The stakeholders are primarily the 36,582 individual members that comprise the 5,173 Small Groups of this project. They are primarily subsistence farmers. They own, or have rights, to the lands where the project activities take place and own the trees and tree products that are the focus of the climate change portion of the project. The membership to TIST is voluntary. Members hear about the program and ask to join. TIST holds regular meetings and various levels (Small Groups, Cluster, National Seminars and Leadership Council) to maintain communications among the members.
Membership in TIST is completely voluntarily. The actions that members take are on their own land. They maintain ownership of the land, the trees planted for sequestration and all the products that the trees yield. TIST exists for the local farmers and only grows if the local farmers support it. The growth of TIST is a reflection of the positive reaction that the farmers and other stakeholders have had about TIST.
When TIST begins in an area, they contact community leaders, village heads/village leaders, local NGOs and local government officials to determine if there is an interest in the program. If
5 This includes examples such as if an SG or an SG member has quit or if there has been a major loss from fire, pest, harvest, etc. The type of information collected is reflected in the monitoring spreadsheets where we have indicated an issue with the project area (removed or pending) and zeroed out the carbon for this verification.6 See section 4.3.3 of the PD: “since ex post carbon calculations are based on current tree counts, any trees lost to harvest, etc., are automatically excluded from the calculation”
v3.4 9

MONITORING REPORT : VCS Version 3
there is an interest, TIST holds a public seminar to present the program, answer questions, address concerns and receive comments. This is followed by regular and ongoing meetings where the public is invited to attend. TIST representatives have met with numerous State, District and Village officials seeking comment and showing them the project. In addition to the meetings, information about TIST is disseminated by word of mouth; using “The Tree,” a multi-lingual newsletter published by TIST Uganda; and direct contact with community leaders and government officials and over local radio programming.
The original TIST program was started in Tanzania, in late 1999, to meet local needs in a sustainable way, while at the same time addressing climate change. Uganda sent their first representatives to a TIST seminar in Tanzania in July 2003. The representatives went back to Uganda and introduced TIST by word of mouth and Small Group meetings. Interested individuals formed Small Groups and began planting trees.
The first TIST seminar of TIST Kenya was held in Nanyuki from February 21, 2005 to February 26, 2005. The seminar began with the process of customizing TIST to the desires and needs of farmers in the Meru and Nanyuki areas. Seventy-three people attended; 40 men and 33 women. A second training seminar was held April 11, 2005 to April 14, 2005 at the Gitoro Conference Centre in Meru. Seventy-five people attended; 39 men and 36 women.
In February 2005, the first “Mazingira Bora” was published and circulated within the communities to TIST members and those interested in the program. Since that time, TIST has published regular newsletters that document an ongoing dialogue and support with members of the community, both inside and outside the program. These documents are available to the public in a transparent form on the internet at tist.org.7 TIST also has a collection of written stakeholder comments (see PD).
At the Small Group level, member farmers meet with TIST representatives regularly, where they have an opportunity to ask more questions and make more comments. Since one of TIST’s main focuses is adopting best practices, these are forums to review what is working about the program and how it can be improved. Changes to the program are announced in the newsletter.
The result of this stakeholder process has led to numerous invitations for TIST to come to new villages and numerous positive comments about TIST. The following section will summarize written comments. TIST has not received any negative comments.
Other stakeholders are NGOs and government entities we have identified from their activities in the Project Zone. TIST has been active in Kenya since 2004, has seven VCS PDs (including KE-VCS-006) and four CCB PDs (including KE-CCB-006). TIST had held numerous public meetings that we announced in several Kenya national newspapers.8 We have collected the names of interested stakeholders.
3 DATA AND PARAMETERS
3.1 Data and Parameters Available at Validation
7 http://www.tist.org/moreinfo.php8 Support Document 14: TIST KE PD-CCB-Spt 14i Public Comments PD-003 V03.doc at http://www.tist.org/PD-KE-VCS-006%20Documents.php
v3.4 10

MONITORING REPORT : VCS Version 3
Data / Parameter Location of project area
Data unit Latitude and longitude
Description Single point location of the area where project activity has been implemented
Source of data GPS
Value applied: See "PA Summary" worksheet, Appendix 14a/b, for each result
Justification of choice of data or description of measurement methods and procedures applied
GPS is the modern standard for determining geographic coordinates.
Purpose of the data Baseline
Comments None
Data / Parameter Boundary of project area
Data unit Latitude and longitude
Description Multiple points of latitude and longitude that describe the boundary of a discrete project area
Source of data GPS
Value applied: See KML file, Appendix 39, for all results
Justification of choice of data or description of measurement methods and procedures applied
GPS is the modern standard for determining geographic coordinates.
Purpose of the data Baseline
Comments None
Data / Parameter Area of project area
Data unit Hectares
Description Size of the area where the project activity has been implemented
Source of data GPS
Value applied: See "PA Summary" worksheet, Appendix 14a/b, for each result
Justification of choice of data or description of measurement methods and procedures applied
GPS is the modern standard for determining geographic coordinates.
Purpose of the data Baseline
Comments None
9 Appendix 03: TIST KE PD-VCS-006d App03 PA Plots 120824.kml at http://www.tist.org/PD-KE-VCS-006%20Documents.php
v3.4 11

MONITORING REPORT : VCS Version 3
Data / Parameter Ownership of project area
Data unit Name
Description Ownership of land of project area
Source of data “Carbon Credit Sale Agreement”
Value applied: See "PA Summary" worksheet, Appendix 14a/b, for each result
Justification of choice of data or description of measurement methods and procedures applied
TIST representatives ask if there is a change in ownership when they visit the PA.
Purpose of the data Baseline
Comments None
Data / Parameter Baseline trees
Data unit Baseline Trees
Description The number of trees existing in a project area is counted, before the planting of project trees.
Source of data Trees are physically counted in the field
Value applied: See "Baseline Strata" worksheet, Appendix 04a/b, for each result
Justification of choice of data or description of measurement methods and procedures applied
A physical count provides the most accurate information possible.
Purpose of the data Baseline
Comments None
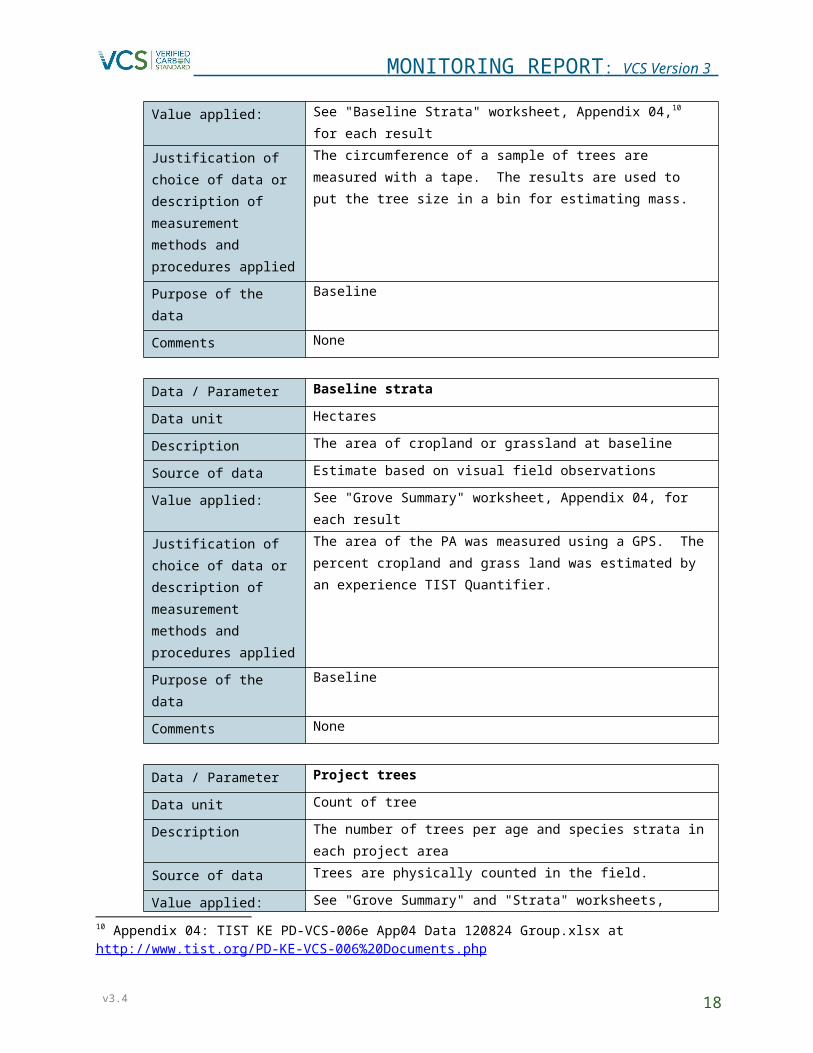
Data / Parameter Baseline tree circumference
Data unit Centimeters
Description The circumference of trees existing in a project area, before the planting of project trees, is counted
Source of data Trees are physically measured in the field
Value applied: See "Baseline Strata" worksheet, Appendix 04,10 for each result
Justification of choice of data or description of measurement methods and procedures applied
The circumference of a sample of trees are measured with a tape. The results are used to put the tree size in a bin for estimating mass.
Purpose of the data Baseline
10 Appendix 04: TIST KE PD-VCS-006e App04 Data 120824 Group.xlsx at http://www.tist.org/PD-KE-VCS-006%20Documents.php
v3.4 12

MONITORING REPORT : VCS Version 3
Comments None
Data / Parameter Baseline strata
Data unit Hectares
Description The area of cropland or grassland at baseline
Source of data Estimate based on visual field observations
Value applied: See "Grove Summary" worksheet, Appendix 04, for each result
Justification of choice of data or description of measurement methods and procedures applied
The area of the PA was measured using a GPS. The percent cropland and grass land was estimated by an experience TIST Quantifier.
Purpose of the data Baseline
Comments None
Data / Parameter Project trees
Data unit Count of tree
Description The number of trees per age and species strata in each project area
Source of data Trees are physically counted in the field.
Value applied: See "Grove Summary" and "Strata" worksheets, Appendix 04a/b, for each result
Justification of choice of data or description of measurement methods and procedures applied
The trees were all counted by an experience TIST Quantifier.
Purpose of the data The tree count by strata is used to extrapolate the ex-ante GhG removals
Comments None
Table 1 of the methodology (CDM AR-AMS0001) also lists “height of tree”, "location of the permanent sample plots” and "basic wood density" as data variables. The project does not collect “height of tree” data or "basic wood density." As noted in paragraph 42, Step 2 of the methodology, the option is given to "measure the diameter at breast height (DBH) or DBH and tree height, as appropriate." The validated PD stated "height will not be used in the allometric equations" because project monitoring relies solely on allometric equations that only require DBH. "Basic wood densities" are not used because they are assumed in the allometric equations. This approach was implicit in the validated PD. Because all the trees are counted in each project area, each project area is a "permanent sample plot.”
The above table also includes a parameter not found in the methodology, "ownership of project area." This was added at the request of the first verifier, ESI, to acknowledge the fact that virtually every PA is owned by a different farmer.
v3.4 13

MONITORING REPORT : VCS Version 3
3.2 Data and Parameters Monitored
Data / Parameter Number of trees
Data unit Trees
Description Number of trees in a project area by strata
Source of data Physical counts
Description of measurement methods and procedures to be applied
Physical count of the trees in each stratum by Quantifiers with each visit
Frequency of monitoring/recording Ongoing measurement taken by Quantifiers as they visit project areas. Each PA could be visited as much as once per year.
Value monitored: See "Ex-post Strata" worksheet of Appendix 14a/b
Monitoring equipment Customized handheld computer
QA/QC procedures to be applied Part of overall QA/QC procedures discussed in Section 3.3
Purpose of the data Calculation of project emissions
Calculation method Not applicable
Comments None
Data / Parameter DBH
Data unit cm
Description Diameter of tree at breast height (1.30 m)
Source of data Physical measurements
Description of measurement methods and procedures to be applied
TIST measures DBH of up to 20 representative trees of each age/species stratum in different project area
Frequency of monitoring/recording Ongoing measurement taken by Quantifiers as they visit project areas
Value monitored: See "Circ" worksheet of Appendix 14a/b
Monitoring equipment Measuring tape and customized handheld computer
QA/QC procedures to be applied Part of overall QA/QC procedures discussed in Section 3.3
Purpose of the data Calculation of project emissions
Calculation method Not applicable
Comments None
Data / Parameter Total CO2
Data unit Tonnes
v3.4 14

MONITORING REPORT : VCS Version 3
Description Total CO2 sequestered by the trees
Source of data Calculation
Description of measurement methods and procedures to be applied
Allometric equations are assigned to each stratum. DBH values are applied to the allometric. Average biomass of a tree in each stratum is calculated and multiplied by number of trees in each stratum. Biomass is converted to CO2e and the CO2e of the stratum are totaled.
Frequency of monitoring/recording Calculation takes place with each monitoring report
Value monitored: See "Ex-post Strata" worksheet of Appendix 14a/b
Monitoring equipment Computer and database
QA/QC procedures to be applied Part of overall QA/QC procedures discussed in Section 3.3
Purpose of the data Calculation of project emissions
Calculation method Not applicable
Comments None
3.3 Monitoring Plan
3.3.1 Organization and Responsibilities
The Small Groups manage themselves based on a covenant among the members of each Small Group. They manage and oversee their own trees. They contract with Clean Air Action Corporation (CAAC) to sell their carbon, receive payments, and receive training. The GhG component of TIST is managed by CAAC, whom developed the database, web site, and procedures for monitoring the GhG. CAAC was responsible for the PD, monitoring plan and for selling any GhG that becomes available.
The operational processes for monitoring the actual GhG removal by the sinks are for TIST Quantifiers to visit each grove, at minimum, once every five years, to count trees and collect circumference, GPS, and other data. Quantifiers are audited by the TIST Kenya staff. Quantifiers transmit the monitoring data via the Internet to the TIST website, where it is managed by CAAC. CAAC oversees the data and conducts QA/QC reviews. Feedback is provided to the TIST's Quantifiers and office staff. CAAC is responsible for tabulating carbon stocks.
The TIST Data System stores all of the current and archived data. CAAC managers use customized reports to analyze the data and look for trends, missing data or obvious errors. TIST managers visit selected project areas and observe quantifications and audits.
3.3.2 Data Management and QA/QC
TIST uses the following QA/QC procedures:
Quantifier Training: Quantifiers receive explicit training in regard to TIST’s Standard Operating Procedures, so that quantifications are performed in a standard and regular fashion. Quantifiers meet monthly to discuss questions or problems that they may have and
v3.4 15

MONITORING REPORT : VCS Version 3
receive training and software updates when necessary. Quantifiers are not dedicated to a grove for the life of that grove and may be rotated to other groves.
Staff Audits: TIST staff members are trained to quantify groves and have handheld devices that are programmed to conduct audits. A requirement of their job is to periodically audit Quantifiers, including an independent sampling of tree counts and circumference measurement.
Multiple Quantifications: TIST’s internal goal is to quantify each project area at least once every 5 years. Inaccurate data and errors are self-correcting with the subsequent visits. If trees have died or have been removed, a new count will reflect the current population. The growth of the trees, as indicated by increased DBH, is monitored with these subsequent visits. If a species is mislabeled, it will arise as a conflict when different Quantifiers attempt to perform tree counts for that grove that do not match the previous one. Comparisons are made over time, to determine whether a particular quantification, or tree count, appears unrealistic.
Cluster Meeting Updates: The Cluster provides an alternate method of gathering intelligence about what is happening at the Small Group level and to individual groves including information that might assist in monitoring the actual GhG removal. To facilitate a conservative approach to estimating GhG removals, a minimum of one Cluster meeting will be held within 12 months prior to the end of the verification period unless there has been a quantification within said 12 month period, in which case, the minimum meeting Cluster is waived.
Multiple Tracks: In order to ensure that the location and perimeter of each discrete project area is accurate, each GPS track of the parcel was measured at least twice, or until two tracks that reliably define the project area, are obtained. Quantifiers re-trace the tract with each quantification to verify that they are at the correct project area and that they are counting the correct trees.
Double Counting: To ensure that the same project area is not counted more than once, an overlap script was used that compares the outline of all project areas. If an overlap was detected, the project areas were visually compared. If an overlap was determined, the overlapping project areas were removed from the PD.
Data Quality: TIST Quantifiers counted every tree in each discrete project area. Counting each tree is 100% sampling and provides greater than 10% precision at the 95% confidence level. Up to 20 circumference readings for each strata in a project area were taken and archived, to develop a localized database of growth data by strata. This data provided the circumference data for each stratum. This sampling exceeds the 10% precision at the 95% confidence level required by the methodology.
TIST Data System: The data system is an integral part of TIST’s quality assurance and quality control plan. The handheld devices are programmed in a manner that requires the data to be collected in a step-by-step manner, increasing the likelihood that all the data will be collected. Data field characteristics are defined to force the use of numbers, text or special formats. Drop down menus are used to restrict answers to certain subsets (e.g. a TIST Small Group name comes from a drop down menu). Some data fields are restricted to a range of
v3.4 16

MONITORING REPORT : VCS Version 3
data (e.g. negative numbers are not allowed). The data is uploaded within a few days to the main database, providing timely reporting and secure storage of the data.
Desk Audit: TIST has developed analytical tools for reviewing data as it comes in from the field to look at track data, tree counts, and completeness of data.
Transparency: By providing the quantification data online and available to anyone with an Internet connection, TIST is open to audit by anyone at any time. By providing the location, boundaries, tree count by species and circumference, any interested party can field check TIST data. This transparency and the actual visits that have already taken place provide a further motive to make sure the field data is correct.
Data Storage: The data is being stored in an electronic format on the TIST server. Currently, the server hardware is operated by a third party company that specializes in web and data hosting. They are currently on the Amazon Cloud. However, CAAC could, in the future, change hosts or choose to host the server at its offices.
3.3.3 Monitoring and Carbon Calculations
The overall plan employs TIST Quantifiers going to each PA, counting each tree by stratum and taking circumference measurements of up to 20 trees in a stratum. The data is recorded on a handheld computer using a custom database. The data is uploaded to the TIST database via the Internet where it is incorporated with all the other monitoring data and displayed on the TIST website (tist.org). This is an ongoing process that takes place almost every day. As each PA is revisited, the old data is achieved and the results of the new quantification are displayed on the website. The data used in this monitoring report is the most current information from each PA. It was accessed from the database by the proponent and used in the carbon calculations.
The following provides the step-by-step procedure used to determine the Project GhG removals:
Step 1: Because of the difference in species and age of the trees and location, ownership and management of the project areas, each project area is monitored. They are documented in the "PA Summary" worksheet of Appendix 14a/b.11 The location of each PA was obtained with a GPS and is also provided in the "PA Summary" worksheet of Appendix 14a/b. The boundary of each project area was obtained using a GPS and provided in PD Appendix 03.12 The area was calculated and is listed with each project area in the "PA Summary" worksheet of Appendix 14.
Step 2. The strata for the ex post estimation of the actual net greenhouse gas removals was done by species and year similar to the ex-ante estimate as described in PD Section 3.2. Stratification was done within each individual project areas. The area of a stratum in a project area ("Area of a Stratum (ha)") was determined by multiplying the area of project area (see Step 1) by the percentage of trees of that stratum in the respective project area. The results are provided in the "Ex-post Strata" worksheet of Appendix 14.13
11 "PA Summary" worksheet of Appendix 14 is an abbreviated version of the "Grove Summary" worksheet of PD Appendix 04. It contains the same list of Project Areas but omits the baseline information. Appendix 04: TIST KE PD-VCS-006e App04 Data 120824 Group.xlsx at http://www.tist.org/PD-KE-VCS-006%20Documents.php Appendix 14a/b: see http://www.tist.org/PD-KE-VCS-006%20Documents.php 12 Appendix 03 is the KML files See http://www.tist.org/PD-KE-VCS-006%20Documents.php13 "Ex-post Strata" worksheet of Appendix 14 is similar to the "Strata" worksheet of PD Appendix 04. It contains the same list of strata but includes carbon calculation information.
v3.4 17
MONITORING REPORT : VCS Version 3
Step 3. Where a tree species exceeded 10% of the total tree inventory, it was assigned to a Major Strata. All other tree species were assigned to an "Other" strata. Based on the tabulations in Appendix 14, there are four major strata: eucalyptus, grevillea, Cupressus and other.
Step 4. Allometric equations were used to convert DBH values to biomass. An allometric equation for each Major Strata was identified. If a species specific equation for a Major Strata was unavailable, it used the "Other" equation as a default. Allometric equations were researched and the most appropriate ones identified by the Proponent were assigned to the major strata. Because no better allometric equations could be found for grevillea and Cupressus, they were assigned to the "other" equation. The following is the assignment.
Eucalyptus14: Log Y = -2.43 + 2.58 Log C Grevillea: no species specific equations, will use "Other" equationCupressus: no species specific equations, will use "Other" equationOther (default)15: Y = (0.2035 x DBH2.3196) x 1.2
Where:Y= aboveground dry matter, kg (tree)-1DBH = diameter at breast height, cmC = circumference at breast height, cmln = natural logarithmexp = e raised to the power of1.2 = expansion factor to go from bole biomass to tree biomass
The result is that there are only two Allometric Strata: eucalyptus and other. See "Circ" worksheet, Appendix 14.
Step 5. The DBH of up to 20 trees per stratum, per project area, were measured. The results of these measurements are presented in the "Circ (cm)" column of worksheets "Circ" of Appendix 14. Each DBH value for each tree measured was applied to the appropriate allometric equation and the above ground biomass ("AG Biomass, kg") of each per tree in the stratum was obtained.16
The "Average Above Ground Biomass per Tree (kg)" of the "Ex-post Strata" worksheet was created by processing the "AG Biomass (kg)" values in the "Statistics" worksheet. The individual "AG Biomass" values were transferred by strata to the "Sample Data" section of the "Statistics" worksheet. To be conservative, where the strata age was one year, a zero was entered in the column (see Section 3.3.2, below). The "Statistics" worksheet has a row ("Mean, t BM"), which used the Excel "Average" function to derive the average biomass for each stratum.
14 DH Ashton, “The Development of Even-aged Stands in Eucalyptus regnans F. Muell. in Central Victoria,” Australian Journal of Botany, 24 (1976): 397-414, cited by Tim Pearson, Sandra Brown and David Shoch, in “Assessment of Methods and Background for Carbon Sequestration in the TIST Project in Tanzania,” Report to Clean Air Action Corporation, (December 2004).15 Tim Pearson, Sandra Brown and David Shoch, in “Assessment of Methods and Background for Carbon Sequestration in the TIST Project in Tanzania,” Report to Clean Air Action Corporation, (December 2004).16 The "AG Biomass (kg)" column is the result of this operation. The "Code" function in the formula is looking for an "E" (ASCII 69) in the first letter of the entry in the "Allometric Strata" column to indicate eucalyptus. If the "Code" is E, then the first (eucalyptus) equation applies. If not, the "other" equation applies.
v3.4 18

MONITORING REPORT : VCS Version 3
The values from "Mean, t BM" of each allometric/age strata were transferred to the "Biomass/ Tree, kg" column of the "Circ" worksheet using an Excel "Lookup" function.
Step 6. For each stratum in each project area, the average above ground biomass per tree ("Biomass/ Tree, kg" column "Ex-post Strata" worksheet) was multiplied times the number of trees, to yield the above ground biomass in stratum (kg), and divided by 1,000 to obtain above ground biomass in stratum ("AG Biomass in Stratum, t").
Step 7. The methodology requires the use of "tons of biomass per hectare" as a factor, in a subsequent step. It was determined by dividing the above ground biomass, in stratum (t), from Step 6, by the area of the stratum, from Step 2.
Above Ground Biomass in Stratum (t/ha) = Above Ground Biomass in Stratum (t)Area of the Stratum (ha)
Step 8. The above ground biomass in stratum ("AG Biomass in Stratum, t/ha") was multiplied by 0.5 to convert biomass to carbon. The result is above ground carbon in stratum ("AG Carbon in Stratum, t/ha").
Step 9. The carbon stocks of the below ground biomass of each stratum ("BG Carbon in Stratum, t/ha") were calculated by multiplying "AG Biomass in Stratum, t/ha" by the appropriate roots to shoot ratio and by 0.5, the carbon fraction of the biomass. A root to shoot factor of 0.27 is used.17
Step 10. The total carbon stocks (CO2e) are determined by adding the above and below ground carbon (C) of each stratum in each project area, multiplying each sum by the respective area of that stratum, converting the result to CO2e and summing the products. The following is the general equation required by the methodology.
I
P(t) = Σ(PA(t) i + PB(t) i) * Ai*(44/12)i-I
Where:P(t) = carbon stocks within the project boundary at time t achieved by the project activity (t
CO2e)PA(t)I = carbon stocks in above-ground biomass at time t of stratum i achieved by the
project activity during the monitoring interval (t C/ha) from Step 8.PB(t)I = carbon stocks in below-ground biomass at time t of stratum i achieved by the
project activity during the monitoring interval (t C/ha) from Step 9.Ai = project activity area of stratum i (ha) from Step 2.I = stratum i (I = total number of strata)
The first part of this equation required adding the "AG Biomass in Stratum, t/ha" and "BG Carbon in Stratum, t/ha" and multiplying the sum by the area of each stratum and by 44/12 to convert carbon to CO2. This is accomplished in the "CO2 in Stratum (t)" column.
The second part of this formula required summing the values in the "CO2 in Stratum (t)" column. The result is in the "CO2 in Stratum (t)" column of the "Ex-Post Strata" worksheet on the "Project Total" row (bottom of worksheet).
17 GPG-LULUCF, Table 3.A.1.8
v3.4 19

MONITORING REPORT : VCS Version 3
3.3.4 Accuracy
Precision at 95% confidence level
The methodology required showing that the stratification approach could achieve a targeted precision level of ±10% of the mean at a 95% confidence level. This demonstration was made in the "Statistics" worksheet of Appendix 14.
The "Statistics" worksheet reads all of the circumference readings from the "Circ" worksheets. This was accomplished by using the database functions of Excel (DSUM, DCOUNT, etc). Columns F through L are the results based on all of the Circ data. A modification has been added to identify circumference outliers. We revised the Statistics and Circ worksheets to enable us to identify the circumference measurements of every stratum that is in the 4th standard deviation above the mean. The 4th SD is identified in column L of the Statistics worksheet. Column O of the Circ worksheet compares these thresholds with each circumference measurement. If the value is in the 4th SD it is excluded. Columns N through T of the Statistics worksheet.are the statistics for this subset. The new mean is calculated in Column O.
The results are that when the strata are combined to the project level, the original instances have a 95% confidence level of 0.67% of the mean and the new instances have a 95% confidence level of 1.58% of the mean. The data meets the precision requirement of the methodology.
No zero values for trees less than breast height
The project counts all trees, but no circumference measurements are taken if the trees are less than breast height. We learned that during the early stages of the program, that instead of entering a zero in the circumference field Quantifiers sometimes left it null. To make sure this did not bias the results, a conservative approach was adopted and the circumference of all one-year-old trees was set at zero.
Cordia africana
The field observation indicated that the Cordia africana were subject to extensive pruning in order to get the main trunk growing straight. There was concern that use of circumference measurements from these trees in the allometric equations could have a material effect on the total carbon calculated. This was tested by examining the effect of removing the cordia from the CO2 calculations. In the "Misc Calc" worksheet of the first verification (Appendix 14), the CO2 of all the cordia was determined to be 1.0% of the original instances and 1.0% of the new instances. Therefore, this issue is well below the 5% materiality threshold and the cordia strata received no special treatment.
No circumference sample if less than 20 trees in PA
In spite of the thousands of circumference readings taken for the project, circumference readings were rarely taken in project areas where the tree count was less than twenty. There was concern this could have a material effect on the total carbon calculated. This was tested by looking at the total number of trees that are affected by this issue. As shown in the "Misc Calc" worksheet of Appendix 14,18 0.55% of the trees in the original instances have less than 20 trees and 0.51% of
18 Appendix 14: TIST KE PD-VCS-006o App14a Verif 03 Monitor Data 171101.xlsx and TIST KE PD-VCS-006o App14b Verif 03 Monitor Data 171101.xlsx at http://www.tist.org/PD-KE-VCS-006%20Documents.php
v3.4 20

MONITORING REPORT : VCS Version 3
the trees in the new instances have less than 20 trees. Therefore, this issue is well below the 5% materiality threshold.
Conclusion
In conclusion, the Project meets the precision required by the methodology. In addition, the issue regarding one-year-old trees was addressed by assuming one-year-olds had zero biomass. The remaining issues of concern were shown to be both individually and cumulatively below the 5% materiality threshold.
4 QUANTIFICATION OF GHG EMISSION REDUCTIONS AND REMOVALS
4.1 Baseline Emissions
No monitoring of the baseline is required. As demonstrated in Section 4.2 of the PD, the change in baseline carbons stocks is below the threshold that would require monitoring. Because only the trees planted as part of the project are counted in the estimation of project removals, the baseline carbon stocks are fixed at zero.
4.2 Project Emissions
Project emissions are considered zero. As addressed in the PD, this is due to the manner in which the Project is operated, such as: no vehicles, manual labor conducted by the small-hold farmers on their own land, restrictions on chemical fertilizers, no clearing of baseline trees and minimal disturbance of the ground for planting.
Project removals are as calculated in the "Project Total" row (bottom of worksheet), "CO2 in Stratum (t)" column, "Ex-Post Strata" worksheet of Appendix 14. The total is provided in Section 4.4, below.
4.3 Leakage
For ex-post leakage, the methodology requires the monitoring of cropland, domesticated grazing animals and domesticated roaming animals displaced by the project activity during the first crediting period. If the indicators were less than 10%, leakage is set to zero. The monitoring results provided in the PD indicated cropland and grazing leakage is below the thresholds that require further monitoring and that the ex-post leakage can be set at zero.
4.4 Net GHG Emission Reductions and Removals
Year Baseline emissions or removals (tCO2e)
Project emissions or removals (tCO2e)
Leakage emissions (tCO2e)
Net GHG emission reductions or removals (tCO2e)
Total -0- 534,020 -0- 534,020
The net GhG emissions reductions can be found in cell AK18108, "PA Summary" worksheet. It reflects the emission reductions calculated from the "Ex-Post Strata" worksheet, less the Pending and Removed groves.
v3.4 21

MONITORING REPORT : VCS Version 3
There is no intent to have vintages issued separately in the VCS registry system. The non-permanence risk rating is 2.5 and the required buffer is 10%. The non-permanence risk report is Appendix 09.
Verification Number Date Monitoring Period
Gross Reductions Buffer Issuance
This Report Pending 01-Jan-04 to 01-Mar-18 xxx xxx xxxLess Verif 01 27-Sep-12 01-Jan-04 to 29-Jun-12 188,649 18,865 169,784Less Verif 02 24-Sep-14 30-Jun-12 to 31-Dec-13 154,225 15,423 138,802Net This Report Pending 01-Jan-14 to 01-Mar-18 xxx xxx xxx
v3.4 22

MONITORING REPORT : VCS Version 3
APPENDICES:
The following appendices can be found at: http://www.tist.org/PD-KE-VCS-005%20Documents.php Appendix 03, PA plots, TIST KE PD-VCS-005d App03 PA Plots.kml Appendix 04, Validation Spreadsheet, TIST KE PD-VCS-005e App04 Data 111102 Group.xls Appendix 08, First Verification spreadsheet, TIST KE PD-VCS-005i App08 Monitoring Data
111102.xlsx Appendix 09, Non-Permanence Risk Report of this verification. TIST KE PD-VCS-005j App09
Verif 02 Risk Analysis 161115.doc Appendix 14, Second Verification spreadsheet, TIST KE PD-VCS-005l App11b Verif 02 Monitor
Data 161110.xlsx
v3.4 23