kansas real estate housing statistics | december 2013
DESCRIPTION
ÂTRANSCRIPT

KANSAS MLS STATISTICS
Prepared on 1/20/2014 courtesy of the Kansas Association of REALTORS® using data from the Participating Kansas REALTOR® MLS Systems. Page 1 of 23
Provided by the WSU Center for Real Estate www.wichita.edu/realestate
Entire State of Kansas December Summary Statistics 2013 2012 Change Home Sales 2,504 2,471 1.3% Active Listings 12,037 13,089 -8.0% Months' Supply 4.8 5.3 -9.2% New Listings 2,303 2,444 -5.8% Contracts Written 1,753 1,825 -3.9% Pending Contracts 2,868 2,142 33.9% Sales Volume (1,000s) 422,567 411,109 2.8%
Aver
age
Sale Price 168,757 166,374 1.4%
List Price of Actives 190,764 185,348 2.9%
Days on Market 85 91 -7.1%
Percent of List 96.2% 95.6% 0.6%
Percent of Original 92.2% 91.7% 0.6% M
edian
Sale Price 137,275 134,900 1.8%
List Price of Actives 130,400 129,500 0.7%
Days on Market 56 59 -5.9%
Percent of List 97.6% 97.2% 0.4%
Percent of Original 95.2% 94.8% 0.5%
• Market Overview Statistics – Page 2
• Year-to-Date Statistics – Page 3
• Sold Listings Analysis – Page 4
• Active Listings Analysis – Page 8
• Months’ Supply Analysis – Page 12
• New Listings Analysis – Page 13
• Contracts Written Analysis – Page 16
• Pending Contracts Analysis – Page 20
Kansas Home Sales Rose in December Total home sales in the state of Kansas rose by 1.3% last month to 2,504 units, compared to 2,471 units in December 2012. Total sales volume was $422.6 million, up 2.8% from a year earlier. The median sale price in December was $137,275, up from $134,900 a year earlier. Homes that sold in December were typically on the market for 56 days and sold for 97.6% of their list prices. Kansas Active Listings Down at End of December The total number of active listings in the state of Kansas at the end of December was 12,037 units, down from 13,089 at the same point in 2012. This represents a 4.8 months' supply of homes available for sale. The median list price of homes on the market at the end of December was $130,400. During December, a total of 1,753 contracts were written down from 1,825 in December 2012. At the end of the month, there were 2,868 contracts pending, compared to 2,142 at the end of December 2012. KAR – The Voice of Real Estate in Kansas The Kansas Association of REALTORS® (KAR) provides members with applications, ideas, knowledge and tools to help them succeed in real estate. Members can learn how to apply technology and productivity tools to grow their business; acquire knowledge about real estate trends, legal issues, legislation and regulation to gain a competitive advantage in the marketplace and connect with the best in the business to share knowledge and experience. This monthly statewide market report is provided so members can deliver the most accurate information to their clients and customers. Contact Information Karen Gehle, Chief Executive Officer Kansas Association of REALTORS® 3644 W Burlingame Road Topeka, KS 66611 800-366-0069 [email protected] www.kansasrealtor.com

KANSAS MLS STATISTICS
Prepared on 1/20/2014 courtesy of the Kansas Association of REALTORS®
using data from the Participating Kansas REALTOR® MLS Systems. Page 2 of 23 Provided by the WSU Center for Real Estate
www.wichita.edu/realestate
ENTIRE STATE OF KANSAS BREAKDOWNS BY HOME TYPE
AS OF 1/16/2014
MARKET OVERVIEW STATISTICS
December MLS Statistics 2013 2012 2011 By Property Type Total Existing New Total Existing New Total Existing New
Home Sales 2,504 2,321 183 2,471 2,259 212 2,204 2,059 145 Change from prior year 1.3% 2.7% -13.7% 12.1% 9.7% 46.2% 4.4% 7.0% -22.9%
Active Listings 12,037 11,047 990 13,089 12,146 943 14,856 13,697 1,159 Change from prior year -8.0% -9.0% 5.0% -11.9% -11.3% -18.6% -15.7% -15.0% -22.8%
Months' Supply 4.8 4.8 5.4 5.3 5.4 4.4 6.7 6.7 8.0 Change from prior year -9.2% -11.5% 21.6% -21.4% -19.2% -44.4% -19.2% -20.6% 0.1%
New Listings 2,303 2,136 167 2,444 2,251 193 2,365 2,227 138 Change from prior year -5.8% -5.1% -13.5% 3.3% 1.1% 39.9% -19.4% -20.0% -9.2%
Contracts Written 1,753 1,618 135 1,825 1,680 145 1,633 1,521 112 Change from prior year -3.9% -3.7% -6.9% 11.8% 10.5% 29.5% 10.9% 11.2% 7.7%
Pending Contracts 2,868 2,358 510 2,142 1,712 430 1,746 1,487 259 Change from prior year 33.9% 37.7% 18.6% 22.7% 15.1% 66.0% 14.8% 15.2% 12.6%
Sales Volume (1,000s) 422,567 359,884 62,682 411,109 340,127 70,983 317,843 278,514 39,329 Change from prior year 2.8% 5.8% -11.7% 29.1% 21.8% 80.5% -4.1% 0.7% -28.5%
Aver
age
Sale Price 168,757 155,056 342,527 166,374 150,565 334,825 144,540 135,596 271,236 Change from prior year 1.4% 3.0% 2.3% 15.1% 11.0% 23.4% -8.1% -5.9% -7.2%
List Price of Actives 190,764 179,051 321,231 185,348 176,316 306,259 190,244 182,244 288,797 Change from prior year 2.9% 1.6% 4.9% -2.6% -3.3% 6.0% -3.5% -3.6% -1.4%
Days on Market 85 85 78 91 93 77 110 107 143 Change from prior year -7.1% -7.9% 1.9% -16.7% -13.7% -46.0% 4.7% 5.7% 3.6%
Percent of List 96.2% 95.8% 101.2% 95.6% 95.1% 101.0% 94.5% 94.2% 99.4% Change from prior year 0.6% 0.7% 0.2% 1.1% 0.9% 1.7% -0.2% 0.0% -0.6%
Percent of Original 92.2% 91.5% 101.9% 91.7% 90.8% 101.1% 89.1% 88.5% 98.5% Change from prior year 0.6% 0.8% 0.7% 2.8% 2.6% 2.6% -0.5% -0.3% -0.2%
Med
ian
Sale Price 137,275 128,350 301,414 134,900 125,000 294,782 122,000 115,000 235,000 Change from prior year 1.8% 2.7% 2.2% 10.6% 8.7% 25.4% -7.6% -7.2% 0.9%
List Price of Actives 130,400 124,900 302,848 129,500 123,000 276,000 139,950 134,000 260,000 Change from prior year 0.7% 1.5% 9.7% -7.5% -8.2% 6.2% -3.5% -3.6% 5.1%
Days on Market 56 57 9 59 60 34 74 74 75 Change from prior year -5.9% -5.0% -73.1% -20.3% -18.9% -55.3% -3.9% -3.9% -3.8%
Percent of List 97.6% 97.2% 100.0% 97.2% 96.8% 100.0% 96.6% 96.3% 100.0% Change from prior year 0.4% 0.5% 0.0% 0.7% 0.4% 0.0% -0.1% 0.0% 0.0%
Percent of Original 95.2% 94.7% 100.4% 94.8% 94.0% 100.0% 92.6% 92.1% 100.0% Change from prior year 0.5% 0.7% 0.4% 2.4% 2.0% 0.0% -0.6% -0.3% 0.0%

KANSAS MLS STATISTICS
Prepared on 1/20/2014 courtesy of the Kansas Association of REALTORS®
using data from the Participating Kansas REALTOR® MLS Systems. Page 3 of 23 Provided by the WSU Center for Real Estate
www.wichita.edu/realestate
ENTIRE STATE OF KANSAS YTD BREAKDOWNS BY HOME TYPE
AS OF 1/16/2014
YEAR-TO-DATE STATISTICS
Year-to-Date Activity 2013 2012 2011 By Property Type Total Existing New Total Existing New Total Existing New
Home Sales 35,128 32,731 2,397 32,131 29,977 2,154 28,165 26,363 1,802 Change from prior year 9.3% 9.2% 11.3% 14.1% 13.7% 19.5% -1.6% 0.3% -22.6%
New Listings 51,865 48,881 2,984 50,714 48,059 2,655 50,072 47,694 2,378 Change from prior year 2.3% 1.7% 12.4% 1.3% 0.8% 11.6% -9.2% -9.0% -13.4%
Contracts Written 34,689 32,286 2,403 32,244 29,888 2,356 27,919 26,103 1,816 Change from prior year 7.6% 8.0% 2.0% 15.5% 14.5% 29.7% 1.4% 3.1% -17.4%
Sales Volume (1,000s) 5,974,462 5,183,222 791,240 5,100,980 4,452,601 648,379 4,284,964 3,770,250 514,714 Change from prior year 17.1% 16.4% 22.0% 19.0% 18.1% 26.0% -4.2% -2.1% -17.6%
Aver
age
Sale Price 170,091 158,373 330,096 158,800 148,579 301,012 152,230 143,105 285,635 Change from prior year 7.1% 6.6% 9.7% 4.3% 3.8% 5.4% -2.7% -2.3% 6.4%
Days on Market 82 81 97 94 93 120 103 100 145 Change from prior year -13.5% -13.0% -19.2% -8.3% -7.5% -17.2% 7.4% 10.4% -5.9%
Percent of List 96.5% 96.1% 101.3% 95.7% 95.4% 100.7% 95.2% 94.9% 100.4% Change from prior year 0.8% 0.8% 0.6% 0.5% 0.5% 0.3% -0.4% -0.3% 0.2%
Percent of Original 93.4% 92.8% 101.6% 91.7% 91.1% 100.3% 90.6% 90.0% 99.7% Change from prior year 1.8% 1.8% 1.3% 1.3% 1.3% 0.7% -1.3% -1.3% 0.4%
Med
ian
Sale Price 140,000 134,000 295,000 133,000 126,500 265,000 127,000 121,000 249,850 Change from prior year 5.3% 5.9% 11.3% 4.7% 4.5% 6.1% -5.2% -4.3% 11.0%
Days on Market 50 50 47 59 59 68 69 68 90 Change from prior year -15.3% -15.3% -30.9% -14.5% -13.2% -24.4% 13.1% 13.3% 1.1%
Percent of List 97.8% 97.5% 100.0% 97.2% 96.9% 100.0% 96.8% 96.6% 100.0% Change from prior year 0.6% 0.6% 0.0% 0.4% 0.4% 0.0% -0.5% -0.4% 0.0%
Percent of Original 96.1% 95.6% 100.3% 94.8% 94.3% 100.0% 93.8% 93.3% 100.0% Change from prior year 1.4% 1.4% 0.3% 1.0% 1.0% 0.0% -1.2% -1.2% 0.0%

KANSAS MLS STATISTICS
Prepared on 1/20/2014 courtesy of the Kansas Association of REALTORS®
using data from the Participating Kansas REALTOR® MLS Systems. Page 4 of 23 Provided by the WSU Center for Real Estate
www.wichita.edu/realestate
ENTIRE STATE OF KANSAS ALL HOMES
AS OF 1/16/2014
SOLD LISTINGS ANALYSIS
Summary Statistics December Year-to-Date for Sold Listings 2013 2012 Change 2013 2012 Change
Sold Listings 2,504 2,471 1.3% 35,128 32,131 9.3%
Volume (1,000s) 422,567 411,109 2.8% 5,974,462 5,100,980 17.1%
Aver
age
Sale Price 168,757 166,374 1.4% 170,091 158,800 7.1%
Days on Market 85 91 -7.1% 82 94 -13.5%
Percent of List 96.2% 95.6% 0.6% 96.5% 95.7% 0.8%
Percent of Original 92.2% 91.7% 0.6% 93.4% 91.7% 1.8%
Med
ian
Sale Price 137,275 134,900 1.8% 140,000 133,000 5.3%
Days on Market 56 59 -5.9% 50 59 -15.3%
Percent of List 97.6% 97.2% 0.4% 97.8% 97.2% 0.6%
Percent of Original 95.2% 94.8% 0.5% 96.1% 94.8% 1.4%
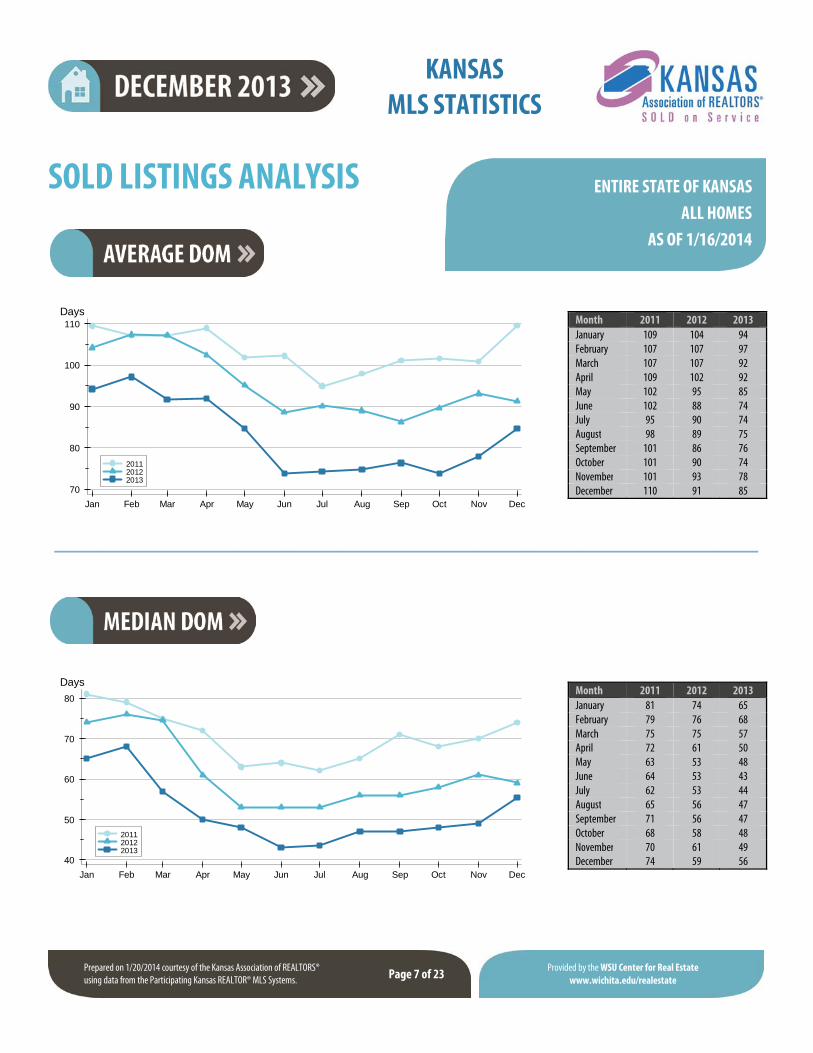
A total of 2,504 homes sold in the state of Kansas in December, up from 2,471 units in December 2012. Total sales volume rose to $422.6 million compared to $411.1 million in the previous year. The median sales price in December was $137,275, up 1.8% compared to the prior year. Median days on market was 56 days, up from 49 days in November, but down from 59 in December 2012.
0
1,000
2,000
3,000
4,000
2009 2010 2011 2012 2013
Seasonally Adjusted
Actual Values
Units

KANSAS MLS STATISTICS
Prepared on 1/20/2014 courtesy of the Kansas Association of REALTORS®
using data from the Participating Kansas REALTOR® MLS Systems. Page 5 of 23 Provided by the WSU Center for Real Estate
www.wichita.edu/realestate
ENTIRE STATE OF KANSAS ALL HOMES
AS OF 1/16/2014
SOLD LISTINGS ANALYSIS
Sales Sale Price Days on Market Price as % of List Price as % of Orig. Price Range Number Percent Volume Average Median Average Median Average Median Average Median
Below $25,000 123 4.9% 1,977 16,074 17,000 100 71 83.4% 86.8% 72.2% 73.5% $25,000-$49,999 232 9.3% 8,615 37,135 36,000 104 71 92.5% 91.8% 82.8% 82.3% $50,000-$99,999 522 20.8% 39,154 75,007 75,101 94 58 95.6% 95.9% 90.7% 92.5% $100,000-$124,999 238 9.5% 26,812 112,657 113,000 96 71 97.1% 98.0% 93.9% 95.3% $125,000-$149,999 253 10.1% 34,520 136,444 136,000 70 51 97.7% 98.1% 95.2% 95.9% $150,000-$174,999 246 9.8% 39,774 161,681 160,950 70 49 97.8% 98.2% 95.1% 96.7% $175,000-$199,999 185 7.4% 34,410 185,999 185,000 77 50 98.6% 98.5% 96.6% 97.3% $200,000-$249,999 227 9.1% 50,332 221,727 221,250 79 52 97.4% 98.1% 95.5% 96.9% $250,000-$299,999 173 6.9% 47,464 274,361 274,500 65 45 97.3% 98.2% 95.2% 95.9% $300,000 and up 305 12.2% 139,508 457,403 395,595 84 52 98.4% 98.4% 97.0% 97.7% All price ranges 2,504 100.0% 422,567 168,757 137,275 85 56 96.2% 97.6% 92.2% 95.2%
Month 2011 2012 2013January 1,403 1,637 1,850February 1,557 1,871 1,961March 2,247 2,582 2,734April 2,546 2,682 2,960May 2,816 3,265 3,797June 3,049 3,377 3,644July 2,783 3,212 3,832August 2,829 3,235 3,545September 2,502 2,554 3,020October 2,157 2,641 2,789November 2,072 2,604 2,492December 2,204 2,471 2,504
1,500
2,000
2,500
3,000
3,500
4,000
Jan Feb Mar Apr May Jun Jul Aug Sep Oct Nov Dec
201120122013
Units

KANSAS MLS STATISTICS
Prepared on 1/20/2014 courtesy of the Kansas Association of REALTORS® using data from the Participating Kansas REALTOR® MLS Systems. Page 6 of 23
Provided by the WSU Center for Real Estate www.wichita.edu/realestate
ENTIRE STATE OF KANSAS ALL HOMES
AS OF 1/16/2014
SOLD LISTINGS ANALYSIS
Month 2011 2012 2013January 117,500 114,900 121,000February 117,000 114,000 121,500March 120,000 125,000 135,000April 122,000 131,600 135,000May 130,000 136,900 148,000June 136,000 144,250 154,000July 135,000 142,550 150,000August 134,500 139,900 148,000September 127,881 134,000 137,000October 125,000 132,500 140,000November 125,000 130,000 136,000December 122,000 134,900 137,275
Month 2011 2012 2013January 143,872 138,430 151,776February 138,809 138,232 151,047March 142,199 150,254 163,175April 144,960 155,112 160,505May 157,021 160,155 174,751June 165,419 173,532 181,270July 161,753 165,991 181,153August 159,368 164,328 175,914September 149,568 158,467 167,960October 151,535 156,371 168,768November 151,425 157,717 174,317December 144,540 166,374 168,757
140,000
150,000
160,000
170,000
180,000
Jan Feb Mar Apr May Jun Jul Aug Sep Oct Nov Dec
201120122013
Dollars
110,000
120,000
130,000
140,000
150,000
Jan Feb Mar Apr May Jun Jul Aug Sep Oct Nov Dec
201120122013
Dollars
KANSAS MLS STATISTICS
Prepared on 1/20/2014 courtesy of the Kansas Association of REALTORS® using data from the Participating Kansas REALTOR® MLS Systems. Page 7 of 23
Provided by the WSU Center for Real Estate www.wichita.edu/realestate
ENTIRE STATE OF KANSAS ALL HOMES
AS OF 1/16/2014
SOLD LISTINGS ANALYSIS
Month 2011 2012 2013January 81 74 65February 79 76 68March 75 75 57April 72 61 50May 63 53 48June 64 53 43July 62 53 44August 65 56 47September 71 56 47October 68 58 48November 70 61 49December 74 59 56
Month 2011 2012 2013January 109 104 94February 107 107 97March 107 107 92April 109 102 92May 102 95 85June 102 88 74July 95 90 74August 98 89 75September 101 86 76October 101 90 74November 101 93 78December 110 91 8570
80
90
100
110
Jan Feb Mar Apr May Jun Jul Aug Sep Oct Nov Dec
201120122013
Days
40
50
60
70
80
Jan Feb Mar Apr May Jun Jul Aug Sep Oct Nov Dec
201120122013
Days

KANSAS MLS STATISTICS
Prepared on 1/20/2014 courtesy of the Kansas Association of REALTORS® using data from the Participating Kansas REALTOR® MLS Systems. Page 8 of 23
Provided by the WSU Center for Real Estate www.wichita.edu/realestate
ENTIRE STATE OF KANSAS ALL HOMES
AS OF 1/16/2014
ACTIVE LISTINGS ANALYSIS
Summary Statistics End of December for Active Listings 2013 2012 Change
Active Listings 12,037 13,089 -8.0%
Months' Supply 4.8 5.3 -9.2%
Volume (1,000s) 2,296,222 2,426,025 -5.4%
Aver
age List Price 190,764 185,348 2.9%
Days on Market 133 149 -10.4%
Percent of Original 97.0% 96.5% 0.5%
Med
ian List Price 130,400 129,500 0.7%
Days on Market 92 99 -7.1%
Percent of Original 100.0% 100.0% 0.0%
A total of 12,037 homes were available for sale in the state of Kansas at the end of December. This represents a 4.8 months' supply of active listings. The median list price of homes on the market at the end of December was $130,400, up 0.7% from 2012. The typical time on market for active listings was 92 days, down from 99 days a year earlier.
0
5,000
10,000
15,000
20,000
2009 2010 2011 2012 2013
Seasonally Adjusted
Actual Values
Units

KANSAS MLS STATISTICS
Prepared on 1/20/2014 courtesy of the Kansas Association of REALTORS® using data from the Participating Kansas REALTOR® MLS Systems. Page 9 of 23
Provided by the WSU Center for Real Estate www.wichita.edu/realestate
ENTIRE STATE OF KANSAS ALL HOMES
AS OF 1/16/2014
ACTIVE LISTINGS ANALYSIS
Active Listings Months' List Price Days on Market List as % Orig. Price Range Number Percent Volume Supply Average Median Average Median Average Median
Below $25,000 309 2.6% 5,009 2.5 16,210 18,000 127 87 89.0% 100.0% $25,000-$49,999 1,134 9.4% 44,659 4.9 39,382 39,900 147 97 94.3% 100.0% $50,000-$99,999 3,039 25.2% 230,549 5.8 75,863 75,000 144 95 96.2% 100.0% $100,000-$124,999 1,106 9.2% 126,062 4.6 113,980 114,900 125 91 97.0% 100.0% $125,000-$149,999 1,353 11.2% 185,883 5.3 137,386 137,500 118 89 97.9% 100.0% $150,000-$174,999 953 7.9% 154,953 3.9 162,594 162,900 116 85 98.1% 100.0% $175,000-$199,999 820 6.8% 153,821 4.4 187,587 187,700 114 85 98.5% 100.0% $200,000-$249,999 897 7.5% 203,713 4.0 227,105 225,000 119 83 98.0% 100.0% $250,000-$299,999 649 5.4% 178,999 3.8 275,808 275,000 131 89 98.3% 100.0% $300,000 and up 1,758 14.6% 1,008,949 5.8 573,919 429,950 150 104 98.5% 100.0% All price ranges 12,037 100.0% 2,296,222 4.8 190,764 130,400 133 92 97.0% 100.0%
Month 2011 2012 2013January 17,535 15,182 13,565February 17,329 15,545 13,692March 18,776 16,338 14,044April 19,782 16,779 14,658May 19,844 17,932 15,112June 19,455 16,923 15,255July 19,471 16,805 15,349August 19,127 16,499 15,205September 18,607 16,414 14,926October 18,238 15,532 14,578November 16,478 14,542 13,826December 14,856 13,089 12,03712,000
14,000
16,000
18,000
20,000
Jan Feb Mar Apr May Jun Jul Aug Sep Oct Nov Dec
2011 2012 2013
Units
KANSAS MLS STATISTICS
Prepared on 1/20/2014 courtesy of the Kansas Association of REALTORS® using data from the Participating Kansas REALTOR® MLS Systems. Page 10 of 23
Provided by the WSU Center for Real Estate www.wichita.edu/realestate
ENTIRE STATE OF KANSAS ALL HOMES
AS OF 1/16/2014
ACTIVE LISTINGS ANALYSIS
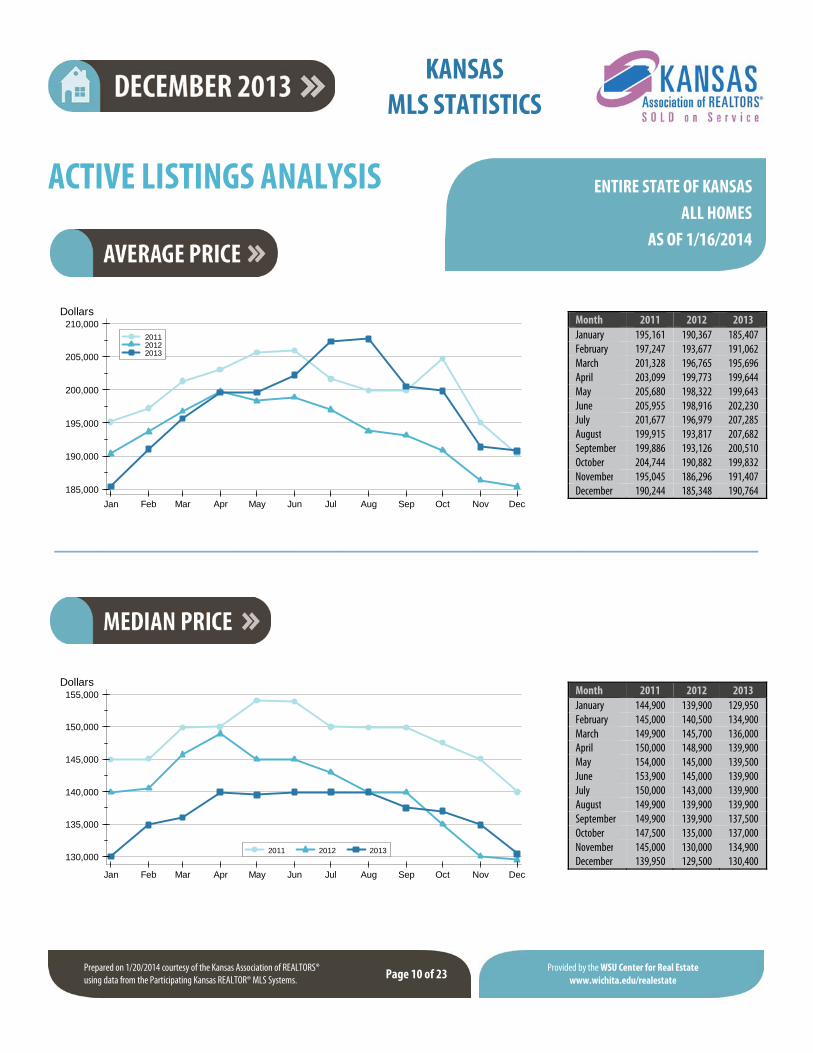
Month 2011 2012 2013January 144,900 139,900 129,950February 145,000 140,500 134,900March 149,900 145,700 136,000April 150,000 148,900 139,900May 154,000 145,000 139,500June 153,900 145,000 139,900July 150,000 143,000 139,900August 149,900 139,900 139,900September 149,900 139,900 137,500October 147,500 135,000 137,000November 145,000 130,000 134,900December 139,950 129,500 130,400
Month 2011 2012 2013January 195,161 190,367 185,407February 197,247 193,677 191,062March 201,328 196,765 195,696April 203,099 199,773 199,644May 205,680 198,322 199,643June 205,955 198,916 202,230July 201,677 196,979 207,285August 199,915 193,817 207,682September 199,886 193,126 200,510October 204,744 190,882 199,832November 195,045 186,296 191,407December 190,244 185,348 190,764185,000
190,000
195,000
200,000
205,000
210,000
Jan Feb Mar Apr May Jun Jul Aug Sep Oct Nov Dec
201120122013
Dollars
130,000
135,000
140,000
145,000
150,000
155,000
Jan Feb Mar Apr May Jun Jul Aug Sep Oct Nov Dec
2011 2012 2013
Dollars

KANSAS MLS STATISTICS
Prepared on 1/20/2014 courtesy of the Kansas Association of REALTORS® using data from the Participating Kansas REALTOR® MLS Systems. Page 11 of 23
Provided by the WSU Center for Real Estate www.wichita.edu/realestate
ENTIRE STATE OF KANSAS ALL HOMES
AS OF 1/16/2014
ACTIVE LISTINGS ANALYSIS
Month 2011 2012 2013January 99 107 99February 101 99 89March 72 80 74April 63 71 69May 71 77 64June 78 78 64July 81 78 67August 83 83 73September 81 85 76October 82 92 77November 93 94 83December 107 99 92
Month 2011 2012 2013January 135 149 145February 137 147 141March 123 141 134April 119 133 126May 121 133 121June 122 129 117July 122 128 116August 125 132 119September 123 133 119October 124 138 120November 134 142 127December 152 149 133
120
130
140
150
Jan Feb Mar Apr May Jun Jul Aug Sep Oct Nov Dec
2011 2012 2013
Days
60
70
80
90
100
110
Jan Feb Mar Apr May Jun Jul Aug Sep Oct Nov Dec
2011 2012 2013
Days

KANSAS MLS STATISTICS
Prepared on 1/20/2014 courtesy of the Kansas Association of REALTORS® using data from the Participating Kansas REALTOR® MLS Systems. Page 12 of 23
Provided by the WSU Center for Real Estate www.wichita.edu/realestate
ENTIRE STATE OF KANSAS ALL HOMES
AS OF 1/16/2014
MONTHS’ SUPPLY ANALYSIS
Month 2011 2012 2013January 12.5 9.3 7.3February 11.1 8.3 7.0March 8.4 6.3 5.1April 7.8 6.3 5.0May 7.0 5.5 4.0June 6.4 5.0 4.2July 7.0 5.2 4.0August 6.8 5.1 4.3September 7.4 6.4 4.9October 8.5 5.9 5.2November 8.0 5.6 5.5December 6.7 5.3 4.8
0.0
5.0
10.0
15.0
2009 2010 2011 2012 2013
Seasonally Adjusted
Actual Values
Months
4
6
8
10
12
Jan Feb Mar Apr May Jun Jul Aug Sep Oct Nov Dec
2011 2012 2013
Months

KANSAS MLS STATISTICS
Prepared on 1/20/2014 courtesy of the Kansas Association of REALTORS® using data from the Participating Kansas REALTOR® MLS Systems. Page 13 of 23
Provided by the WSU Center for Real Estate www.wichita.edu/realestate
ENTIRE STATE OF KANSAS ALL HOMES
AS OF 1/16/2014
NEW LISTINGS ANALYSIS
Summary Statistics December for New Listings 2013 2012 Change
Curre
nt M
onth
New Listings 2,303 2,444 -5.8%
Volume (1,000s) 383,842 400,623 -4.2%
Average List Price 166,670 163,921 1.7%
Median List Price 126,000 124,950 0.8%
YTD
New Listings 51,865 50,714 2.3%
Volume (1,000s) 9,299,161 8,692,217 7.0%
Average List Price 179,296 171,397 4.6%
Median List Price 139,950 134,950 3.7%
A total of 2,303 new listings were added in the state of Kansas during December, down 5.8% from the same month in 2012. Year-to-date the state of Kansas has seen 51,865 new listings. The median list price of these homes was $126,000 up from $124,950 in 2012.
0
2,000
4,000
6,000
2009 2010 2011 2012 2013
Seasonally Adjusted
Actual Values
Units

KANSAS MLS STATISTICS
Prepared on 1/20/2014 courtesy of the Kansas Association of REALTORS® using data from the Participating Kansas REALTOR® MLS Systems. Page 14 of 23
Provided by the WSU Center for Real Estate www.wichita.edu/realestate
ENTIRE STATE OF KANSAS ALL HOMES
AS OF 1/16/2014
NEW LISTINGS ANALYSIS
New Listings List Price Price Range Number Percent Volume Average Median
Below $25,000 102 4.4% 1,452 14,230 15,000 $25,000-$49,999 273 11.9% 10,422 38,174 39,000 $50,000-$99,999 524 22.8% 39,572 75,520 75,250 $100,000-$124,999 233 10.1% 26,380 113,220 114,900 $125,000-$149,999 249 10.8% 33,969 136,421 135,100 $150,000-$174,999 195 8.5% 31,821 163,185 164,000 $175,000-$199,999 139 6.0% 26,119 187,904 187,500 $200,000-$249,999 185 8.0% 41,797 225,928 225,000 $250,000-$299,999 108 4.7% 29,445 272,637 274,925 $300,000 and up 285 12.4% 141,199 495,435 389,000 All price ranges 2,303 100.0% 383,842 166,670 126,000
Month 2011 2012 2013January 3,895 4,058 4,134February 3,540 3,964 3,710March 5,496 5,113 4,674April 5,293 5,166 5,481May 4,873 4,975 5,540June 4,972 4,878 5,270July 4,399 4,628 4,960August 4,489 4,432 4,550September 3,973 3,825 4,090October 3,767 3,990 4,087November 3,010 3,241 3,066December 2,365 2,444 2,3032,000
3,000
4,000
5,000
6,000
Jan Feb Mar Apr May Jun Jul Aug Sep Oct Nov Dec
201120122013
Units

KANSAS MLS STATISTICS
Prepared on 1/20/2014 courtesy of the Kansas Association of REALTORS® using data from the Participating Kansas REALTOR® MLS Systems. Page 15 of 23
Provided by the WSU Center for Real Estate www.wichita.edu/realestate
ENTIRE STATE OF KANSAS ALL HOMES
AS OF 1/16/2014
NEW LISTINGS ANALYSIS
Month 2011 2012 2013January 124,000 129,900 129,950February 139,900 137,700 142,500March 139,950 145,000 145,000April 144,900 144,500 148,405May 139,900 138,000 144,950June 135,000 139,500 144,900July 134,900 136,890 140,000August 130,000 130,000 140,000September 135,000 129,900 138,500October 129,900 125,000 139,900November 120,000 123,900 134,900December 116,000 124,950 126,000
Month 2011 2012 2013January 157,829 166,390 166,410February 172,273 177,584 178,243March 178,224 178,884 184,083April 179,124 186,257 186,653May 178,770 174,102 184,437June 165,793 172,814 185,426July 165,060 169,400 178,366August 164,069 166,712 179,712September 166,236 166,718 177,998October 161,163 166,184 178,092November 154,286 154,968 171,470December 147,460 163,921 166,670
150,000
160,000
170,000
180,000
190,000
Jan Feb Mar Apr May Jun Jul Aug Sep Oct Nov Dec
2011 2012 2013
Dollars
110,000
120,000
130,000
140,000
150,000
Jan Feb Mar Apr May Jun Jul Aug Sep Oct Nov Dec
2011 2012 2013
Dollars

KANSAS MLS STATISTICS
Prepared on 1/20/2014 courtesy of the Kansas Association of REALTORS® using data from the Participating Kansas REALTOR® MLS Systems. Page 16 of 23
Provided by the WSU Center for Real Estate www.wichita.edu/realestate
ENTIRE STATE OF KANSAS ALL HOMES
AS OF 1/16/2014
CONTRACTS WRITTEN ANALYSIS
Summary Statistics December Year-to-Date for Contracts Written 2013 2012 Change 2013 2012 Change
Contracts Written 1,753 1,825 -3.9% 34,689 32,244 7.6%
Volume (1,000s) 277,814 308,611 -10.0% 6,132,359 5,423,559 13.1%
Aver
age List Price 158,479 169,102 -6.3% 176,781 168,204 5.1%
Days on Market 86 90 -5.2% 80 92 -13.0%
Percent of Original 93.9% 90.7% 3.5% 93.6% 91.9% 1.9%
Med
ian List Price 128,985 132,000 -2.3% 145,000 139,900 3.6%
Days on Market 57 62 -8.1% 49 58 -15.5%
Percent of Original 98.2% 94.2% 4.3% 96.4% 95.0% 1.5%
A total of 1,753 contracts for sale were written in the state of Kansas during the month of December, down from 1,825 in 2012. The median list price of these homes was $128,985, down from $132,000 the prior year. Half of the homes that went under contract in December were on the market less than 57 days, compared to 62 days in December 2012.
0
1,000
2,000
3,000
4,000
5,000
2009 2010 2011 2012 2013
Seasonally Adjusted
Actual Values
Units

KANSAS MLS STATISTICS
Prepared on 1/20/2014 courtesy of the Kansas Association of REALTORS® using data from the Participating Kansas REALTOR® MLS Systems. Page 17 of 23
Provided by the WSU Center for Real Estate www.wichita.edu/realestate
ENTIRE STATE OF KANSAS ALL HOMES
AS OF 1/16/2014
CONTRACTS WRITTEN ANALYSIS
Contracts Written List Price Days on Market List as % Orig. Price Range Number Percent Volume Average Median Average Median Average Median
Below $25,000 81 4.6% 1,325 16,358 17,900 59 50 88.7% 90.0% $25,000-$49,999 206 11.8% 7,768 37,709 37,950 85 49 86.1% 92.5% $50,000-$99,999 362 20.7% 27,699 76,515 78,950 112 67 91.6% 94.7% $100,000-$124,999 189 10.8% 21,427 113,372 113,400 89 65 94.7% 97.5% $125,000-$149,999 199 11.4% 27,409 137,736 139,000 85 61 95.7% 97.6% $150,000-$174,999 162 9.2% 26,498 163,567 163,500 77 60 97.0% 98.3% $175,000-$199,999 124 7.1% 23,177 186,908 185,950 78 59 97.1% 99.3% $200,000-$249,999 149 8.5% 33,549 225,162 225,000 63 38 97.7% 100.0% $250,000-$299,999 86 4.9% 23,598 274,390 269,979 88 64 97.2% 99.4% $300,000 and up 172 9.8% 81,720 475,115 403,613 82 54 97.4% 100.0% All price ranges 1,753 100.0% 277,814 158,479 128,985 86 57 93.9% 98.2%
Month 2011 2012 2013January 1,747 2,299 2,560February 1,986 2,514 2,525March 2,785 3,197 3,220April 2,713 3,144 3,713May 2,904 3,217 3,789June 2,761 3,044 3,478July 2,519 2,908 3,356August 2,611 2,851 3,079September 2,120 2,320 2,538October 2,083 2,689 2,536November 2,057 2,236 2,142December 1,633 1,825 1,7531,500
2,000
2,500
3,000
3,500
4,000
Jan Feb Mar Apr May Jun Jul Aug Sep Oct Nov Dec
201120122013
Units

KANSAS MLS STATISTICS
Prepared on 1/20/2014 courtesy of the Kansas Association of REALTORS® using data from the Participating Kansas REALTOR® MLS Systems. Page 18 of 23
Provided by the WSU Center for Real Estate www.wichita.edu/realestate
ENTIRE STATE OF KANSAS ALL HOMES
AS OF 1/16/2014
CONTRACTS WRITTEN ANALYSIS
Month 2011 2012 2013January 124,950 127,000 132,000February 124,900 134,900 147,500March 132,900 139,900 146,900April 139,000 149,900 151,446May 139,000 144,900 159,000June 140,000 147,900 152,700July 139,900 147,500 146,000August 134,500 135,000 145,000September 130,000 137,800 144,900October 129,950 135,500 139,000November 127,250 137,750 134,900December 120,000 132,000 128,985
Month 2011 2012 2013January 151,544 154,027 165,265February 151,354 161,259 175,885March 159,896 165,779 179,313April 170,315 178,773 180,428May 169,448 170,718 190,039June 167,781 175,367 181,543July 169,917 172,277 180,026August 155,475 163,331 177,361September 158,248 165,621 172,593October 156,544 168,111 175,187November 157,223 168,805 166,050December 147,127 169,102 158,479
150,000
160,000
170,000
180,000
190,000
Jan Feb Mar Apr May Jun Jul Aug Sep Oct Nov Dec
201120122013
Dollars
120,000
130,000
140,000
150,000
160,000
Jan Feb Mar Apr May Jun Jul Aug Sep Oct Nov Dec
201120122013
Dollars

KANSAS MLS STATISTICS
Prepared on 1/20/2014 courtesy of the Kansas Association of REALTORS® using data from the Participating Kansas REALTOR® MLS Systems. Page 19 of 23
Provided by the WSU Center for Real Estate www.wichita.edu/realestate
ENTIRE STATE OF KANSAS ALL HOMES
AS OF 1/16/2014
CONTRACTS WRITTEN ANALYSIS
Month 2011 2012 2013January 75 77 68February 77 69 51March 70 55 47April 59 52 45May 61 51 42June 63 54 43July 66 57 46August 69 58 48September 70 57 50October 69 60 52November 76 60 52December 74 62 57
Month 2011 2012 2013January 103 105 97February 109 103 91March 104 98 86April 101 89 79May 98 87 74June 97 91 72July 96 87 75August 102 87 73September 102 88 78October 100 91 79November 107 92 80December 109 90 8670
80
90
100
110
Jan Feb Mar Apr May Jun Jul Aug Sep Oct Nov Dec
201120122013
Days
40
50
60
70
80
Jan Feb Mar Apr May Jun Jul Aug Sep Oct Nov Dec
201120122013
Days

KANSAS MLS STATISTICS
Prepared on 1/20/2014 courtesy of the Kansas Association of REALTORS® using data from the Participating Kansas REALTOR® MLS Systems. Page 20 of 23
Provided by the WSU Center for Real Estate www.wichita.edu/realestate
ENTIRE STATE OF KANSAS ALL HOMES
AS OF 1/16/2014
PENDING CONTRACTS ANALYSIS
Summary Statistics End of December for Pending Contracts 2013 2012 Change
Pending Contracts 2,868 2,142 33.9%
Volume (1,000s) 544,048 466,679 16.6%
Aver
age List Price 189,696 217,871 -12.9%
Days on Market 84 90 -7.0%
Percent of Original 96.6% 95.6% 1.0%
Med
ian List Price 143,900 150,000 -4.1%
Days on Market 46 51 -9.8%
Percent of Original 100.0% 100.0% 0.0%
A total of 2,868 listings in the state of Kansas had contracts pending at the end of December, up from 2,142 contracts pending at the end of December 2012. Pending contracts reflect listings with a contract in place at the end of the month. In contrast, contracts written measures the number of listings put under contract during the month.
0
1,000
2,000
3,000
4,000
2009 2010 2011 2012 2013
Seasonally Adjusted
Actual Values
Units

KANSAS MLS STATISTICS
Prepared on 1/20/2014 courtesy of the Kansas Association of REALTORS® using data from the Participating Kansas REALTOR® MLS Systems. Page 21 of 23
Provided by the WSU Center for Real Estate www.wichita.edu/realestate
ENTIRE STATE OF KANSAS ALL HOMES
AS OF 1/16/2014
PENDING CONTRACTS ANALYSIS
Contracts Pending List Price Days on Market List as % Orig. Price Range Number Percent Volume Average Median Average Median Average Median
Below $25,000 100 3.5% 1,697 16,969 18,000 75 38 91.6% 100.0% $25,000-$49,999 258 9.0% 9,812 38,031 39,000 79 38 93.1% 100.0% $50,000-$99,999 567 19.8% 43,402 76,546 76,900 123 69 94.4% 100.0% $100,000-$124,999 280 9.8% 31,707 113,241 113,700 100 65 96.2% 100.0% $125,000-$149,999 303 10.6% 41,747 137,779 139,000 85 55 96.9% 100.0% $150,000-$174,999 243 8.5% 39,462 162,397 162,000 77 53 98.5% 100.0% $175,000-$199,999 176 6.1% 32,981 187,391 185,950 84 54 97.8% 100.0% $200,000-$249,999 248 8.6% 55,837 225,148 224,900 68 33 98.2% 100.0% $250,000-$299,999 169 5.9% 46,655 276,067 275,000 70 29 98.4% 100.0% $300,000 and up 499 17.4% 236,005 472,956 419,950 53 1 99.4% 100.0% All price ranges 2,868 100.0% 544,048 189,696 143,900 84 46 96.6% 100.0%
Month 2011 2012 2013January 1,695 2,113 2,445February 1,796 2,522 2,899March 2,466 3,108 3,238April 2,760 3,402 3,832May 2,786 4,331 3,904June 2,391 3,277 3,727July 2,415 3,027 3,306August 2,304 2,863 2,998September 2,232 2,682 4,011October 2,056 2,656 3,644November 1,808 2,508 3,339December 1,746 2,142 2,8681,000
2,000
3,000
4,000
5,000
Jan Feb Mar Apr May Jun Jul Aug Sep Oct Nov Dec
201120122013
Units

KANSAS MLS STATISTICS
Prepared on 1/20/2014 courtesy of the Kansas Association of REALTORS® using data from the Participating Kansas REALTOR® MLS Systems. Page 22 of 23
Provided by the WSU Center for Real Estate www.wichita.edu/realestate
ENTIRE STATE OF KANSAS ALL HOMES
AS OF 1/16/2014
PENDING CONTRACTS ANALYSIS
Month 2011 2012 2013January 137,900 138,900 150,000February 139,000 142,000 158,000March 135,000 149,900 159,900April 139,950 155,645 164,500May 146,650 154,900 169,900June 149,900 152,900 169,000July 148,000 150,000 165,900August 139,950 149,500 159,925September 139,900 149,500 149,900October 139,900 149,900 149,000November 143,500 150,000 145,000December 137,800 150,000 143,900
Month 2011 2012 2013January 169,767 178,436 201,323February 170,604 179,709 202,315March 173,043 183,124 202,646April 178,046 191,118 206,539May 185,162 191,987 212,118June 188,674 189,408 211,396July 186,115 189,657 210,652August 176,543 186,890 207,494September 180,393 187,301 196,509October 176,061 193,472 197,294November 185,493 198,208 190,363December 180,563 217,871 189,696170,000
180,000
190,000
200,000
210,000
220,000
Jan Feb Mar Apr May Jun Jul Aug Sep Oct Nov Dec
201120122013
Dollars
130,000
140,000
150,000
160,000
170,000
Jan Feb Mar Apr May Jun Jul Aug Sep Oct Nov Dec
201120122013
Dollars

KANSAS MLS STATISTICS
Prepared on 1/20/2014 courtesy of the Kansas Association of REALTORS® using data from the Participating Kansas REALTOR® MLS Systems. Page 23 of 23
Provided by the WSU Center for Real Estate www.wichita.edu/realestate
ENTIRE STATE OF KANSAS ALL HOMES
AS OF 1/16/2014
PENDING CONTRACTS ANALYSIS
Month 2011 2012 2013January 67 70 55February 68 67 45March 65 51 39April 53 43 34May 50 42 29June 52 41 28July 58 46 32August 68 49 33September 68 49 36October 66 48 41November 67 52 42December 73 51 46
Month 2011 2012 2013January 106 112 93February 106 107 91March 105 101 87April 96 93 79May 94 84 73June 90 86 71July 97 89 74August 106 88 72September 110 85 74October 105 90 79November 107 91 81December 113 90 8470
80
90
100
110
Jan Feb Mar Apr May Jun Jul Aug Sep Oct Nov Dec
201120122013
Days
30
40
50
60
70
Jan Feb Mar Apr May Jun Jul Aug Sep Oct Nov Dec
201120122013
Days