kansas real estate housing market statistics | october 2013
DESCRIPTION
ÂTRANSCRIPT

KANSAS
MLS STATISTICS
Prepared on 11/18/2013 courtesy of the Kansas Association of REALTORS® using data from the Participating Kansas REALTOR® MLS Systems. Page 1 of 23
Provided by the WSU Center for Real Estate www.wichita.edu/realestate
Entire State of Kansas October Summary Statistics 2013 2012 Change Home Sales 2,735 2,642 3.5% Active Listings 14,639 15,532 -5.7% Months' Supply 5.5 6.2 -11.6% New Listings 2,988 2,888 3.5% Contracts Written 2,321 2,727 -14.9% Pending Contracts 2,523 2,656 -5.0% Sales Volume (1,000s) 461,710 411,554 12.2%
Aver
age
Sale Price 168,815 155,774 8.4%
List Price of Actives 204,198 190,882 7.0%
Days on Market 76 93 -18.8%
Percent of List 96.2% 95.2% 1.1%
Percent of Original 93.2% 91.0% 2.5% M
edian
Sale Price 150,000 140,500 6.8%
List Price of Actives 139,500 135,000 3.3%
Days on Market 50 63 -20.6%
Percent of List 97.8% 97.1% 0.7%
Percent of Original 96.2% 94.4% 1.9%
• Market Overview Statistics – Page 2
• Year-to-Date Statistics – Page 3
• Sold Listings Analysis – Page 4
• Active Listings Analysis – Page 8
• Months’ Supply Analysis – Page 12
• New Listings Analysis – Page 13
• Contracts Written Analysis – Page 16
• Pending Contracts Analysis – Page 20
Kansas Home Sales Rose in October Total home sales in the state of Kansas rose by 3.5% last month to 2,735 units, compared to 2,642 units in October 2012. Total sales volume was $461.7 million, up 12.2% from a year earlier. The median sale price in October was $150,000, up from $140,500 a year earlier. Homes that sold in October were typically on the market for 50 days and sold for 97.8% of their list prices. Kansas Active Listings Down at End of October The total number of active listings in the state of Kansas at the end of October was 14,639 units, down from 15,532 at the same point in 2012. This represents a 5.5 months' supply of homes available for sale. The median list price of homes on the market at the end of October was $139,500. During October, a total of 2,321 contracts were written down from 2,727 in October 2012. At the end of the month, there were 2,523 contracts pending, compared to 2,656 at the end of October 2012. KAR – The Voice of Real Estate in Kansas The Kansas Association of REALTORS® (KAR) provides members with applications, ideas, knowledge and tools to help them succeed in real estate. Members can learn how to apply technology and productivity tools to grow their business; acquire knowledge about real estate trends, legal issues, legislation and regulation to gain a competitive advantage in the marketplace and connect with the best in the business to share knowledge and experience. This monthly statewide market report is provided so members can deliver the most accurate information to their clients and customers. Contact Information Karen Gehle, Chief Executive Officer Kansas Association of REALTORS® 3644 W Burlingame Road Topeka, KS 66611 800-366-0069 [email protected] www.kansasrealtor.com

KANSAS
MLS STATISTICS
Prepared on 11/18/2013 courtesy of the Kansas Association of REALTORS®
using data from the Participating Kansas REALTOR® MLS Systems. Page 2 of 23 Provided by the WSU Center for Real Estate
www.wichita.edu/realestate
ENTIRE STATE OF KANSAS BREAKDOWNS BY HOME TYPE
AS OF 11/14/2013
MARKET OVERVIEW STATISTICS
October MLS Statistics 2013 2012 2011 By Property Type Total Existing New Total Existing New Total Existing New
Home Sales 2,735 2,529 206 2,642 2,454 178 2,158 1,999 151 Change from prior year 3.5% 3.1% 15.7% 22.4% 22.8% 17.9% 10.0% 11.6% -1.3%
Active Listings 14,639 13,530 1,109 15,532 14,584 948 18,238 16,952 1,286 Change from prior year -5.7% -7.2% 17.0% -14.8% -14.0% -26.3% -12.8% -12.2% -19.9%
Months' Supply 5.5 5.6 5.1 6.2 6.3 5.1 8.8 8.8 8.1 Change from prior year -11.6% -12.4% 1.2% -28.9% -28.2% -37.4% -25.0% -25.1% -23.8%
New Listings 2,988 2,794 194 2,888 2,712 176 2,730 2,573 157 Change from prior year 3.5% 3.0% 10.2% 5.8% 5.4% 12.1% -5.3% -6.5% 20.8%
Contracts Written 2,321 2,164 157 2,727 2,526 201 2,133 2,008 125 Change from prior year -14.9% -14.3% -21.9% 27.8% 25.8% 60.8% 9.8% 10.5% 0.0%
Pending Contracts 2,523 2,004 519 2,656 2,187 469 2,056 1,787 269 Change from prior year -5.0% -8.4% 10.7% 29.2% 22.4% 74.3% 5.5% 6.6% -1.5%
Sales Volume (1,000s) 461,710 387,538 74,172 411,554 359,060 52,494 325,135 282,595 42,540 Change from prior year 12.2% 7.9% 41.3% 26.6% 27.1% 23.4% 6.8% 8.3% -2.3%
Aver
age
Sale Price 168,815 153,238 360,057 155,774 146,316 294,912 150,665 141,368 281,725 Change from prior year 8.4% 4.7% 22.1% 3.4% 3.5% 4.7% -2.9% -2.9% -1.0%
List Price of Actives 204,198 195,436 317,256 190,882 183,688 303,710 204,744 199,051 283,352 Change from prior year 7.0% 6.4% 4.5% -6.8% -7.7% 7.2% -3.0% -2.5% -6.7%
Days on Market 76 77 64 93 91 119 108 105 141 Change from prior year -18.8% -16.0% -46.0% -13.4% -13.2% -15.1% -6.0% -3.1% -25.0%
Percent of List 96.2% 95.8% 101.7% 95.2% 94.8% 101.0% 94.5% 94.1% 100.0% Change from prior year 1.1% 1.1% 0.7% 0.7% 0.7% 1.0% 0.4% 0.3% 0.8%
Percent of Original 93.2% 92.4% 103.6% 91.0% 90.3% 100.0% 89.7% 89.0% 99.2% Change from prior year 2.5% 2.3% 3.5% 1.4% 1.5% 0.9% 0.2% 0.1% 2.1%
Med
ian
Sale Price 150,000 142,500 332,515 140,500 133,000 272,758 130,000 125,000 268,850 Change from prior year 6.8% 7.1% 21.9% 8.1% 6.4% 1.5% -2.3% 0.0% 8.9%
List Price of Actives 139,500 130,000 296,000 135,000 129,900 274,950 147,500 139,900 250,000 Change from prior year 3.3% 0.1% 7.7% -8.5% -7.1% 10.0% -4.8% -6.7% 1.0%
Days on Market 50 51 3 63 63 63 74 71 97 Change from prior year -20.6% -19.0% -96.0% -14.3% -11.3% -35.6% -3.3% -5.3% -8.5%
Percent of List 97.8% 97.5% 100.0% 97.1% 96.8% 100.0% 96.4% 96.1% 100.0% Change from prior year 0.7% 0.7% 0.0% 0.7% 0.8% 0.0% 0.0% -0.1% 0.0%
Percent of Original 96.2% 95.7% 100.9% 94.4% 93.8% 100.0% 92.9% 92.5% 100.0% Change from prior year 1.9% 2.0% 0.9% 1.6% 1.5% 0.0% -0.1% 0.0% 0.0%

KANSAS
MLS STATISTICS
Prepared on 11/18/2013 courtesy of the Kansas Association of REALTORS®
using data from the Participating Kansas REALTOR® MLS Systems. Page 3 of 23 Provided by the WSU Center for Real Estate
www.wichita.edu/realestate
ENTIRE STATE OF KANSAS YTD BREAKDOWNS BY HOME TYPE
AS OF 11/14/2013
YEAR-TO-DATE STATISTICS
Year-to-Date Activity 2013 2012 2011 By Property Type Total Existing New Total Existing New Total Existing New
Home Sales 29,963 27,907 2,017 27,056 25,124 1,824 23,893 22,192 1,577 Change from prior year 10.7% 11.1% 10.6% 13.2% 13.2% 15.7% -2.6% -0.7% -21.3%
New Listings 34,734 32,662 2,072 33,184 31,284 1,900 33,047 31,316 1,731 Change from prior year 4.7% 4.4% 9.1% 0.4% -0.1% 9.8% -7.8% -7.8% -7.7%
Contracts Written 30,883 28,793 2,090 28,729 26,692 2,037 24,776 23,160 1,616 Change from prior year 7.5% 7.9% 2.6% 16.0% 15.3% 26.1% 3.8% 5.4% -14.8%
Sales Volume (1,000s) 5,081,689 4,422,134 659,555 4,263,614 3,727,866 535,749 3,632,346 3,183,924 448,422 Change from prior year 19.2% 18.6% 23.1% 17.4% 17.1% 19.5% -4.7% -3.0% -15.5%
Aver
age
Sale Price 169,599 158,460 326,998 157,585 148,379 293,722 152,026 143,472 284,351 Change from prior year 7.6% 6.8% 11.3% 3.7% 3.4% 3.3% -2.2% -2.3% 7.4%
Days on Market 83 81 112 99 96 141 107 103 159 Change from prior year -15.9% -15.4% -20.5% -7.5% -7.3% -11.6% 5.3% 9.2% -14.6%
Percent of List 96.5% 96.2% 101.2% 95.7% 95.3% 100.6% 95.1% 94.8% 100.2% Change from prior year 0.9% 0.9% 0.6% 0.6% 0.5% 0.4% -0.4% -0.4% 0.5%
Percent of Original 93.5% 92.9% 101.6% 91.6% 91.0% 99.9% 90.5% 89.9% 99.2% Change from prior year 2.1% 2.2% 1.7% 1.2% 1.2% 0.7% -1.4% -1.5% 0.9%
Med
ian
Sale Price 150,000 143,000 308,450 141,000 134,000 268,340 135,000 127,900 261,971 Change from prior year 6.4% 6.7% 14.9% 4.4% 4.8% 2.4% -4.3% -5.3% 9.2%
Days on Market 50 50 67 63 62 87 72 71 102 Change from prior year -20.6% -19.4% -23.6% -12.5% -12.7% -14.7% 10.8% 12.7% -7.7%
Percent of List 97.8% 97.5% 100.0% 97.2% 96.9% 100.0% 96.8% 96.5% 100.0% Change from prior year 0.7% 0.7% 0.0% 0.4% 0.4% 0.0% -0.5% -0.5% 0.0%
Percent of Original 96.3% 95.8% 100.1% 94.7% 94.3% 100.0% 93.8% 93.3% 100.0% Change from prior year 1.6% 1.7% 0.1% 1.0% 1.1% 0.0% -1.2% -1.4% 0.0%

KANSAS
MLS STATISTICS
Prepared on 11/18/2013 courtesy of the Kansas Association of REALTORS®
using data from the Participating Kansas REALTOR® MLS Systems. Page 4 of 23 Provided by the WSU Center for Real Estate
www.wichita.edu/realestate
ENTIRE STATE OF KANSAS ALL HOMES
AS OF 11/14/2013
SOLD LISTINGS ANALYSIS
Summary Statistics October Year-to-Date for Sold Listings 2013 2012 Change 2013 2012 Change
Sold Listings 2,735 2,642 3.5% 29,963 27,056 10.7%
Volume (1,000s) 461,710 411,554 12.2% 5,081,688 4,263,615 19.2%
Aver
age
Sale Price 168,815 155,774 8.4% 169,599 157,585 7.6%
Days on Market 76 93 -18.8% 83 99 -15.9%
Percent of List 96.2% 95.2% 1.1% 96.5% 95.7% 0.9%
Percent of Original 93.2% 91.0% 2.5% 93.5% 91.6% 2.1%
Med
ian
Sale Price 150,000 140,500 6.8% 150,000 141,000 6.4%
Days on Market 50 63 -20.6% 50 63 -20.6%
Percent of List 97.8% 97.1% 0.7% 97.8% 97.2% 0.7%
Percent of Original 96.2% 94.4% 1.9% 96.3% 94.7% 1.6%
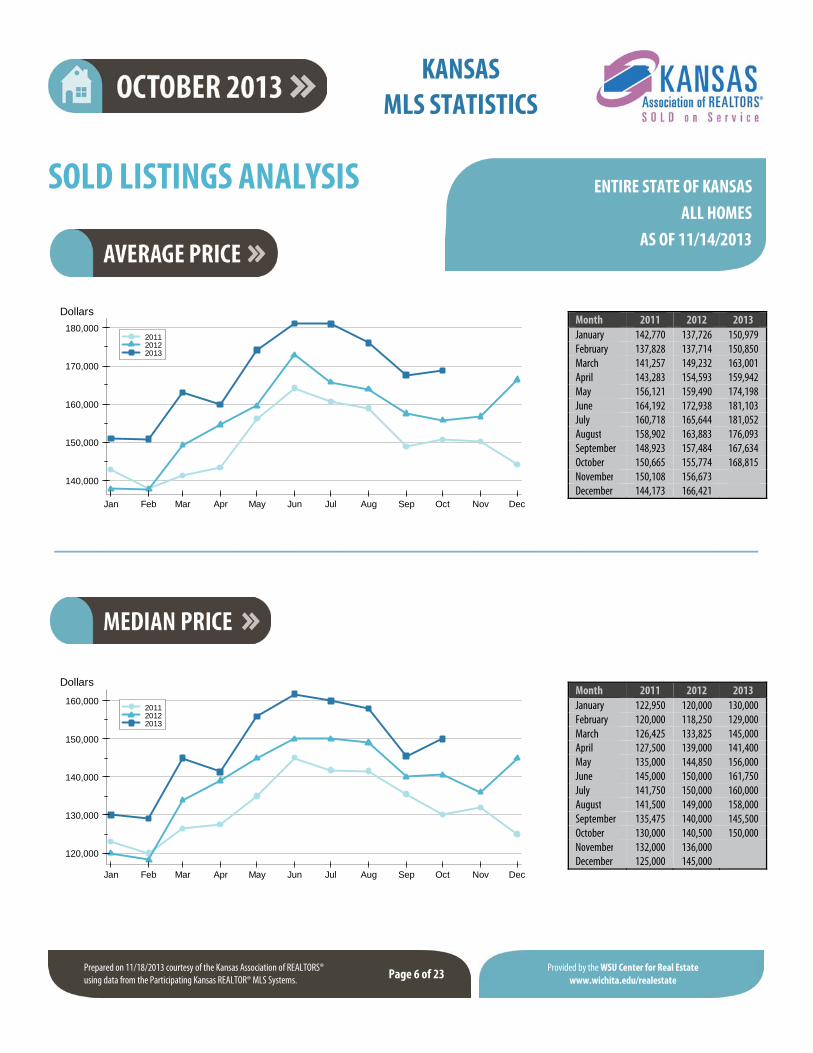
A total of 2,735 homes sold in the state of Kansas in October, up from 2,642 units in October 2012. Total sales volume rose to $461.7 million compared to $411.6 million in the previous year. The median sales price in October was $150,000, up 6.8% compared to the prior year. Median days on market was 50 days, up from 49 days in September, but down from 63 in October 2012.
0
1,000
2,000
3,000
4,000
2009 2010 2011 2012 2013
Seasonally Adjusted
Actual Values
Units

KANSAS
MLS STATISTICS
Prepared on 11/18/2013 courtesy of the Kansas Association of REALTORS®
using data from the Participating Kansas REALTOR® MLS Systems. Page 5 of 23 Provided by the WSU Center for Real Estate
www.wichita.edu/realestate
ENTIRE STATE OF KANSAS ALL HOMES
AS OF 11/14/2013
SOLD LISTINGS ANALYSIS
Sales Sale Price Days on Market Price as % of List Price as % of Orig. Price Range Number Percent Volume Average Median Average Median Average Median Average Median
Below $25,000 103 3.8% 1,746 16,948 19,000 88 67 88.2% 88.3% 76.8% 78.0% $25,000-$49,999 155 5.7% 5,691 36,718 35,500 88 58 90.4% 90.4% 83.1% 83.1% $50,000-$99,999 334 12.2% 25,652 76,804 77,750 90 70 94.7% 95.7% 90.6% 92.9% $100,000-$124,999 185 6.8% 20,937 113,171 114,000 82 62 96.0% 97.5% 92.8% 94.9% $125,000-$149,999 229 8.4% 31,399 137,115 136,900 77 55 97.4% 98.0% 95.4% 96.7% $150,000-$174,999 174 6.4% 28,017 161,015 160,000 77 50 97.4% 97.7% 95.6% 96.9% $175,000-$199,999 164 6.0% 30,405 185,399 184,950 70 43 98.1% 98.7% 96.2% 97.3% $200,000-$249,999 236 8.6% 52,706 223,332 222,750 73 42 98.0% 98.5% 95.9% 97.4% $250,000-$299,999 169 6.2% 45,726 270,567 270,000 51 31 98.5% 98.5% 98.0% 98.1% $300,000 and up 274 10.0% 126,179 460,506 392,500 62 29 98.9% 99.1% 98.5% 98.8% All price ranges 2,735 100.0% 461,710 168,815 150,000 76 50 96.2% 97.8% 93.2% 96.2%
Month 2011 2012 2013January 1,404 1,637 1,847February 1,557 1,871 1,958March 2,248 2,582 2,732April 2,547 2,682 2,956May 2,816 3,265 3,795June 3,049 3,377 3,632July 2,783 3,211 3,807August 2,829 3,235 3,517September 2,502 2,554 2,984October 2,158 2,642 2,735November 2,071 2,604December 2,204 2,469
1,500
2,000
2,500
3,000
3,500
4,000
Jan Feb Mar Apr May Jun Jul Aug Sep Oct Nov Dec
201120122013
Units
KANSAS
MLS STATISTICS
Prepared on 11/18/2013 courtesy of the Kansas Association of REALTORS® using data from the Participating Kansas REALTOR® MLS Systems. Page 6 of 23
Provided by the WSU Center for Real Estate www.wichita.edu/realestate
ENTIRE STATE OF KANSAS ALL HOMES
AS OF 11/14/2013
SOLD LISTINGS ANALYSIS
Month 2011 2012 2013January 122,950 120,000 130,000February 120,000 118,250 129,000March 126,425 133,825 145,000April 127,500 139,000 141,400May 135,000 144,850 156,000June 145,000 150,000 161,750July 141,750 150,000 160,000August 141,500 149,000 158,000September 135,475 140,000 145,500October 130,000 140,500 150,000November 132,000 136,000December 125,000 145,000
Month 2011 2012 2013January 142,770 137,726 150,979February 137,828 137,714 150,850March 141,257 149,232 163,001April 143,283 154,593 159,942May 156,121 159,490 174,198June 164,192 172,938 181,103July 160,718 165,644 181,052August 158,902 163,883 176,093September 148,923 157,484 167,634October 150,665 155,774 168,815November 150,108 156,673December 144,173 166,421
140,000
150,000
160,000
170,000
180,000
Jan Feb Mar Apr May Jun Jul Aug Sep Oct Nov Dec
201120122013
Dollars
120,000
130,000
140,000
150,000
160,000
Jan Feb Mar Apr May Jun Jul Aug Sep Oct Nov Dec
201120122013
Dollars

KANSAS
MLS STATISTICS
Prepared on 11/18/2013 courtesy of the Kansas Association of REALTORS® using data from the Participating Kansas REALTOR® MLS Systems. Page 7 of 23
Provided by the WSU Center for Real Estate www.wichita.edu/realestate
ENTIRE STATE OF KANSAS ALL HOMES
AS OF 11/14/2013
SOLD LISTINGS ANALYSIS
Month 2011 2012 2013January 86 82 67February 83 81 74March 79 82 57April 77 65 52May 64 56 48June 69 55 43July 65 56 45August 67 59 48September 78 60 49October 74 63 50November 76 65December 80 61
Month 2011 2012 2013January 118 112 98February 114 114 102March 111 112 93April 115 107 94May 103 98 85June 107 92 74July 98 94 75August 100 92 76September 108 92 79October 108 93 76November 106 97December 116 9470
80
90
100
110
120
Jan Feb Mar Apr May Jun Jul Aug Sep Oct Nov Dec
201120122013
Days
40
50
60
70
80
90
Jan Feb Mar Apr May Jun Jul Aug Sep Oct Nov Dec
201120122013
Days
KANSAS
MLS STATISTICS
Prepared on 11/18/2013 courtesy of the Kansas Association of REALTORS® using data from the Participating Kansas REALTOR® MLS Systems. Page 8 of 23
Provided by the WSU Center for Real Estate www.wichita.edu/realestate
ENTIRE STATE OF KANSAS ALL HOMES
AS OF 11/14/2013
ACTIVE LISTINGS ANALYSIS
Summary Statistics End of October for Active Listings 2013 2012 Change
Active Listings 14,639 15,532 -5.7%
Months' Supply 5.5 6.2 -11.6%
Volume (1,000s) 2,989,250 2,964,773 0.8%
Aver
age List Price 204,198 190,882 7.0%
Days on Market 122 138 -11.9%
Percent of Original 96.8% 96.3% 0.6%
Med
ian List Price 139,500 135,000 3.3%
Days on Market 78 92 -15.2%
Percent of Original 100.0% 100.0% 0.0%
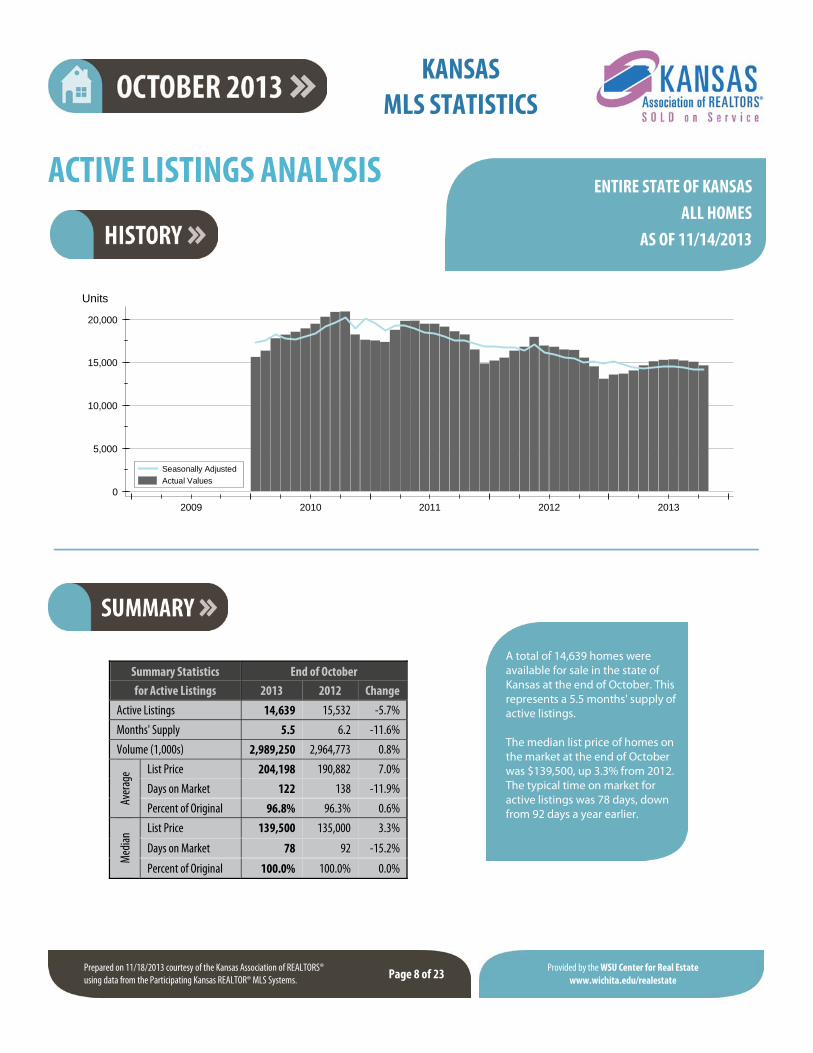
A total of 14,639 homes were available for sale in the state of Kansas at the end of October. This represents a 5.5 months' supply of active listings. The median list price of homes on the market at the end of October was $139,500, up 3.3% from 2012. The typical time on market for active listings was 78 days, down from 92 days a year earlier.
0
5,000
10,000
15,000
20,000
2009 2010 2011 2012 2013
Seasonally Adjusted
Actual Values
Units

KANSAS
MLS STATISTICS
Prepared on 11/18/2013 courtesy of the Kansas Association of REALTORS® using data from the Participating Kansas REALTOR® MLS Systems. Page 9 of 23
Provided by the WSU Center for Real Estate www.wichita.edu/realestate
ENTIRE STATE OF KANSAS ALL HOMES
AS OF 11/14/2013
ACTIVE LISTINGS ANALYSIS
Active Listings Months' List Price Days on Market List as % Orig. Price Range Number Percent Volume Supply Average Median Average Median Average Median
Below $25,000 265 1.8% 4,501 2.6 16,985 18,000 130 78 88.6% 100.0% $25,000-$49,999 937 6.4% 36,842 6.0 39,319 39,900 147 87 94.2% 100.0% $50,000-$99,999 2,628 18.0% 200,275 7.9 76,208 76,000 142 87 95.8% 100.0% $100,000-$124,999 1,056 7.2% 120,321 5.7 113,940 114,925 124 80 96.3% 100.0% $125,000-$149,999 1,303 8.9% 179,512 5.7 137,768 138,000 104 73 97.7% 100.0% $150,000-$174,999 926 6.3% 150,578 5.3 162,611 162,500 100 70 97.8% 100.0% $175,000-$199,999 804 5.5% 150,887 4.9 187,671 187,500 93 66 97.9% 100.0% $200,000-$249,999 873 6.0% 197,945 3.7 226,741 225,000 96 68 98.1% 100.0% $250,000-$299,999 634 4.3% 174,923 3.8 275,904 275,000 112 71 98.2% 100.0% $300,000 and up 1,739 11.9% 1,064,084 6.3 611,894 439,900 129 85 98.2% 100.0% All price ranges 14,639 100.0% 2,989,250 5.4 204,198 139,500 122 78 96.8% 100.0%
Month 2011 2012 2013January 17,535 15,182 13,565February 17,329 15,545 13,692March 18,776 16,338 14,044April 19,782 16,779 14,658May 19,844 17,932 15,112June 19,455 16,923 15,255July 19,471 16,805 15,349August 19,127 16,499 15,205September 18,607 16,414 15,052October 18,238 15,532 14,639November 16,478 14,542December 14,856 13,08912,000
14,000
16,000
18,000
20,000
Jan Feb Mar Apr May Jun Jul Aug Sep Oct Nov Dec
2011 2012 2013
Units

KANSAS
MLS STATISTICS
Prepared on 11/18/2013 courtesy of the Kansas Association of REALTORS® using data from the Participating Kansas REALTOR® MLS Systems. Page 10 of 23
Provided by the WSU Center for Real Estate www.wichita.edu/realestate
ENTIRE STATE OF KANSAS ALL HOMES
AS OF 11/14/2013
ACTIVE LISTINGS ANALYSIS
Month 2011 2012 2013January 144,900 139,900 129,950February 145,000 140,500 134,900March 149,900 145,700 136,000April 150,000 148,900 139,900May 154,000 145,000 139,500June 153,900 145,000 139,900July 150,000 143,000 139,900August 149,900 139,900 139,900September 149,900 139,900 139,900October 147,500 135,000 139,500November 145,000 130,000December 139,950 129,500
Month 2011 2012 2013January 195,161 190,367 185,407February 197,247 193,677 191,062March 201,328 196,765 195,696April 203,099 199,773 199,644May 205,680 198,322 199,643June 205,955 198,916 202,230July 201,677 196,979 207,285August 199,915 193,817 207,682September 199,886 193,126 205,838October 204,744 190,882 204,198November 195,045 186,296December 190,244 185,348185,000
190,000
195,000
200,000
205,000
210,000
Jan Feb Mar Apr May Jun Jul Aug Sep Oct Nov Dec
201120122013
Dollars
130,000
135,000
140,000
145,000
150,000
155,000
Jan Feb Mar Apr May Jun Jul Aug Sep Oct Nov Dec
2011 2012 2013
Dollars
KANSAS
MLS STATISTICS
Prepared on 11/18/2013 courtesy of the Kansas Association of REALTORS® using data from the Participating Kansas REALTOR® MLS Systems. Page 11 of 23
Provided by the WSU Center for Real Estate www.wichita.edu/realestate
ENTIRE STATE OF KANSAS ALL HOMES
AS OF 11/14/2013
ACTIVE LISTINGS ANALYSIS
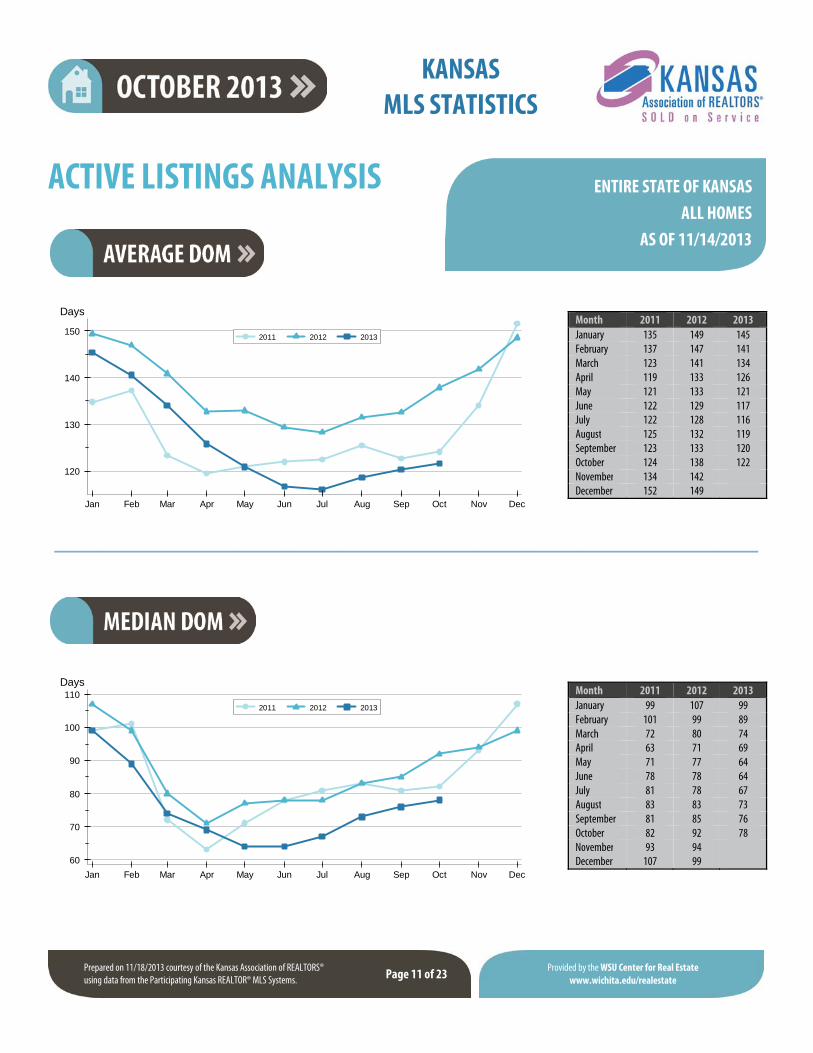
Month 2011 2012 2013January 99 107 99February 101 99 89March 72 80 74April 63 71 69May 71 77 64June 78 78 64July 81 78 67August 83 83 73September 81 85 76October 82 92 78November 93 94December 107 99
Month 2011 2012 2013January 135 149 145February 137 147 141March 123 141 134April 119 133 126May 121 133 121June 122 129 117July 122 128 116August 125 132 119September 123 133 120October 124 138 122November 134 142December 152 149
120
130
140
150
Jan Feb Mar Apr May Jun Jul Aug Sep Oct Nov Dec
2011 2012 2013
Days
60
70
80
90
100
110
Jan Feb Mar Apr May Jun Jul Aug Sep Oct Nov Dec
2011 2012 2013
Days

KANSAS
MLS STATISTICS
Prepared on 11/18/2013 courtesy of the Kansas Association of REALTORS® using data from the Participating Kansas REALTOR® MLS Systems. Page 12 of 23
Provided by the WSU Center for Real Estate www.wichita.edu/realestate
ENTIRE STATE OF KANSAS ALL HOMES
AS OF 11/14/2013
MONTHS’ SUPPLY ANALYSIS
Month 2011 2012 2013January 12.7 9.4 7.6February 11.5 8.5 7.3March 8.8 6.5 5.2April 8.3 6.3 5.0May 7.2 5.5 3.9June 6.5 4.9 4.2July 7.3 5.2 4.0August 7.1 5.2 4.4September 7.9 6.6 5.2October 8.8 6.2 5.5November 8.3 5.7December 7.1 5.3
0.0
5.0
10.0
15.0
2009 2010 2011 2012 2013
Seasonally Adjusted
Actual Values
Months
4
6
8
10
12
Jan Feb Mar Apr May Jun Jul Aug Sep Oct Nov Dec
2011 2012 2013
Months

KANSAS
MLS STATISTICS
Prepared on 11/18/2013 courtesy of the Kansas Association of REALTORS® using data from the Participating Kansas REALTOR® MLS Systems. Page 13 of 23
Provided by the WSU Center for Real Estate www.wichita.edu/realestate
ENTIRE STATE OF KANSAS ALL HOMES
AS OF 11/14/2013
NEW LISTINGS ANALYSIS
Summary Statistics October for New Listings 2013 2012 Change
Curre
nt M
onth
New Listings 2,988 2,888 3.5%
Volume (1,000s) 556,479 508,537 9.4%
Average List Price 186,238 176,086 5.8%
Median List Price 145,000 130,000 11.5%
YTD
New Listings 34,734 33,184 4.7%
Volume (1,000s) 6,620,226 5,994,750 10.4%
Average List Price 190,598 180,652 5.5%
Median List Price 149,500 140,000 6.8%
A total of 2,988 new listings were added in the state of Kansas during October, up 3.5% from the same month in 2012. Year-to-date the state of Kansas has seen 34,734 new listings. The median list price of these homes was $145,000 up from $130,000 in 2012.
0
1,000
2,000
3,000
4,000
5,000
2009 2010 2011 2012 2013
Seasonally Adjusted
Actual Values
Units

KANSAS
MLS STATISTICS
Prepared on 11/18/2013 courtesy of the Kansas Association of REALTORS® using data from the Participating Kansas REALTOR® MLS Systems. Page 14 of 23
Provided by the WSU Center for Real Estate www.wichita.edu/realestate
ENTIRE STATE OF KANSAS ALL HOMES
AS OF 11/14/2013
NEW LISTINGS ANALYSIS
New Listings List Price Price Range Number Percent Volume Average Median
Below $25,000 94 3.1% 1,528 16,252 16,500 $25,000-$49,999 247 8.3% 9,714 39,327 39,900 $50,000-$99,999 639 21.4% 49,222 77,029 78,500 $100,000-$124,999 259 8.7% 29,588 114,241 115,000 $125,000-$149,999 342 11.4% 47,391 138,571 139,900 $150,000-$174,999 268 9.0% 43,505 162,333 163,900 $175,000-$199,999 253 8.5% 47,313 187,010 186,500 $200,000-$249,999 293 9.8% 66,125 225,684 225,000 $250,000-$299,999 180 6.0% 49,578 275,434 275,000 $300,000 and up 412 13.8% 212,327 515,357 399,950 All price ranges 2,988 100.0% 556,479 186,238 145,000
Month 2011 2012 2013January 2,739 2,895 2,980February 2,671 2,952 2,818March 4,204 3,883 3,518April 4,010 3,871 4,164May 3,620 3,735 4,234June 3,633 3,609 3,898July 3,210 3,409 3,698August 3,284 3,199 3,434September 2,946 2,743 3,002October 2,730 2,888 2,988November 2,211 2,360December 1,744 1,815
2,000
3,000
4,000
Jan Feb Mar Apr May Jun Jul Aug Sep Oct Nov Dec
201120122013
Units

KANSAS
MLS STATISTICS
Prepared on 11/18/2013 courtesy of the Kansas Association of REALTORS® using data from the Participating Kansas REALTOR® MLS Systems. Page 15 of 23
Provided by the WSU Center for Real Estate www.wichita.edu/realestate
ENTIRE STATE OF KANSAS ALL HOMES
AS OF 11/14/2013
NEW LISTINGS ANALYSIS
Month 2011 2012 2013January 127,500 135,000 135,000February 148,000 144,000 150,000March 147,500 153,800 149,950April 149,985 149,900 153,000May 145,900 143,900 150,000June 139,900 144,900 150,000July 139,500 140,000 149,500August 139,000 135,500 149,900September 139,900 134,950 145,000October 134,900 130,000 145,000November 125,000 129,000December 119,900 129,000
Month 2011 2012 2013January 164,268 174,207 173,636February 179,364 183,577 188,212March 186,190 186,041 192,959April 185,366 196,400 193,853May 187,830 180,274 191,709June 170,657 179,844 193,763July 170,505 176,690 205,618August 171,653 173,994 186,113September 171,886 173,501 187,680October 168,856 176,086 186,238November 159,620 160,113December 152,557 174,725140,000
160,000
180,000
200,000
220,000
Jan Feb Mar Apr May Jun Jul Aug Sep Oct Nov Dec
201120122013
Dollars
120,000
130,000
140,000
150,000
160,000
Jan Feb Mar Apr May Jun Jul Aug Sep Oct Nov Dec
201120122013
Dollars
KANSAS
MLS STATISTICS
Prepared on 11/18/2013 courtesy of the Kansas Association of REALTORS® using data from the Participating Kansas REALTOR® MLS Systems. Page 16 of 23
Provided by the WSU Center for Real Estate www.wichita.edu/realestate
ENTIRE STATE OF KANSAS ALL HOMES
AS OF 11/14/2013
CONTRACTS WRITTEN ANALYSIS
Summary Statistics October Year-to-Date for Contracts Written 2013 2012 Change 2013 2012 Change
Contracts Written 2,321 2,727 -14.9% 30,883 28,729 7.5%
Volume (1,000s) 407,267 487,213 -16.4% 5,778,988 5,091,505 13.5%
Aver
age List Price 175,470 178,663 -1.8% 187,125 177,225 5.6%
Days on Market 79 95 -16.9% 80 96 -16.2%
Percent of Original 93.9% 91.1% 3.1% 93.9% 91.9% 2.2%
Med
ian List Price 138,500 144,500 -4.2% 155,000 149,500 3.7%
Days on Market 49 64 -23.4% 48 60 -20.0%
Percent of Original 98.1% 94.7% 3.6% 96.7% 95.0% 1.8%
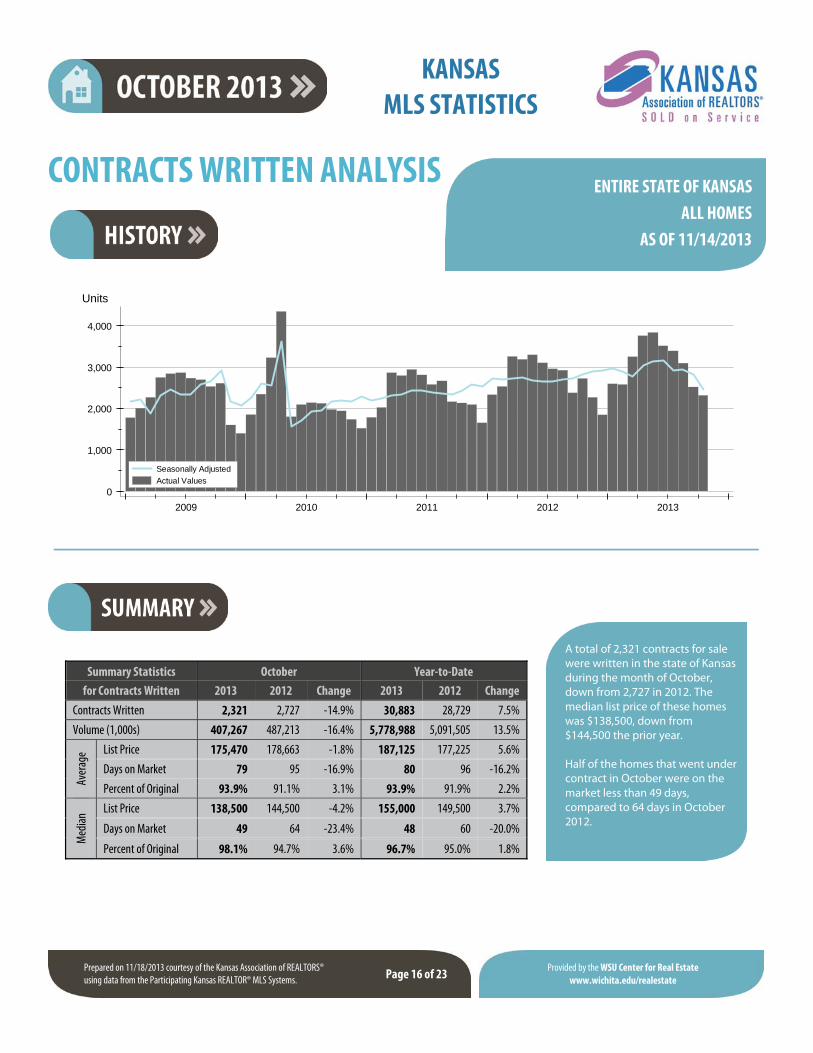
A total of 2,321 contracts for sale were written in the state of Kansas during the month of October, down from 2,727 in 2012. The median list price of these homes was $138,500, down from $144,500 the prior year. Half of the homes that went under contract in October were on the market less than 49 days, compared to 64 days in October 2012.
0
1,000
2,000
3,000
4,000
2009 2010 2011 2012 2013
Seasonally Adjusted
Actual Values
Units

KANSAS
MLS STATISTICS
Prepared on 11/18/2013 courtesy of the Kansas Association of REALTORS® using data from the Participating Kansas REALTOR® MLS Systems. Page 17 of 23
Provided by the WSU Center for Real Estate www.wichita.edu/realestate
ENTIRE STATE OF KANSAS ALL HOMES
AS OF 11/14/2013
CONTRACTS WRITTEN ANALYSIS
Contracts Written List Price Days on Market List as % Orig. Price Range Number Percent Volume Average Median Average Median Average Median
Below $25,000 79 3.4% 1,294 16,385 16,000 85 51 80.1% 81.3% $25,000-$49,999 129 5.6% 4,823 37,384 36,500 89 58 87.0% 88.1% $50,000-$99,999 345 14.9% 26,540 76,927 77,500 96 69 92.0% 95.5% $100,000-$124,999 135 5.8% 15,355 113,742 114,500 67 46 95.1% 100.0% $125,000-$149,999 162 7.0% 22,404 138,296 139,900 77 49 95.2% 98.6% $150,000-$174,999 106 4.6% 17,226 162,509 162,450 76 43 97.0% 98.1% $175,000-$199,999 123 5.3% 23,079 187,634 187,500 76 39 96.8% 99.0% $200,000-$249,999 134 5.8% 30,074 224,434 224,900 58 34 97.8% 100.0% $250,000-$299,999 117 5.0% 31,994 273,454 269,900 56 31 97.2% 100.0% $300,000 and up 195 8.4% 94,803 486,170 399,900 79 46 97.2% 100.0% All price ranges 2,321 100.0% 407,267 175,470 138,500 79 49 93.9% 98.1%
Month 2011 2012 2013January 1,786 2,336 2,597February 2,025 2,539 2,585March 2,869 3,263 3,257April 2,796 3,195 3,760May 2,944 3,302 3,837June 2,810 3,103 3,517July 2,583 2,958 3,391August 2,665 2,927 3,095September 2,165 2,379 2,523October 2,133 2,727 2,321November 2,094 2,277December 1,655 1,8521,500
2,000
2,500
3,000
3,500
4,000
Jan Feb Mar Apr May Jun Jul Aug Sep Oct Nov Dec
201120122013
Units

KANSAS
MLS STATISTICS
Prepared on 11/18/2013 courtesy of the Kansas Association of REALTORS® using data from the Participating Kansas REALTOR® MLS Systems. Page 18 of 23
Provided by the WSU Center for Real Estate www.wichita.edu/realestate
ENTIRE STATE OF KANSAS ALL HOMES
AS OF 11/14/2013
CONTRACTS WRITTEN ANALYSIS
Month 2011 2012 2013January 134,900 134,900 139,900February 130,000 139,950 156,900March 139,900 149,900 156,250April 148,000 157,000 159,900May 146,000 149,950 166,500June 148,000 154,950 159,950July 149,000 154,900 155,000August 139,900 144,500 153,000September 139,000 144,650 154,000October 139,500 144,500 138,500November 134,900 145,000December 125,100 143,900
Month 2011 2012 2013January 162,012 162,267 174,175February 158,684 169,577 187,712March 167,794 174,910 189,741April 177,645 189,901 188,555May 176,381 178,784 198,934June 173,467 184,890 189,628July 179,152 179,209 188,758August 161,423 172,176 185,322September 164,608 175,260 181,805October 163,863 178,663 175,470November 165,595 178,324December 156,393 181,203
160,000
170,000
180,000
190,000
200,000
Jan Feb Mar Apr May Jun Jul Aug Sep Oct Nov Dec
201120122013
Dollars
120,000
130,000
140,000
150,000
160,000
170,000
Jan Feb Mar Apr May Jun Jul Aug Sep Oct Nov Dec
201120122013
Dollars

KANSAS
MLS STATISTICS
Prepared on 11/18/2013 courtesy of the Kansas Association of REALTORS® using data from the Participating Kansas REALTOR® MLS Systems. Page 19 of 23
Provided by the WSU Center for Real Estate www.wichita.edu/realestate
ENTIRE STATE OF KANSAS ALL HOMES
AS OF 11/14/2013
CONTRACTS WRITTEN ANALYSIS
Month 2011 2012 2013January 82 84 70February 83 73 53March 71 58 47April 62 55 46May 62 53 43June 67 55 45July 70 62 47August 77 61 48September 74 62 50October 73 64 49November 82 63December 81 65
Month 2011 2012 2013January 111 111 99February 112 107 92March 107 103 85April 103 91 80May 100 90 75June 100 92 72July 101 90 76August 107 91 73September 107 91 78October 106 95 79November 112 96December 118 9470
80
90
100
110
120
Jan Feb Mar Apr May Jun Jul Aug Sep Oct Nov Dec
201120122013
Days
40
50
60
70
80
Jan Feb Mar Apr May Jun Jul Aug Sep Oct Nov Dec
201120122013
Days

KANSAS
MLS STATISTICS
Prepared on 11/18/2013 courtesy of the Kansas Association of REALTORS® using data from the Participating Kansas REALTOR® MLS Systems. Page 20 of 23
Provided by the WSU Center for Real Estate www.wichita.edu/realestate
ENTIRE STATE OF KANSAS ALL HOMES
AS OF 11/14/2013
PENDING CONTRACTS ANALYSIS
Summary Statistics End of October for Pending Contracts 2013 2012 Change
Pending Contracts 2,523 2,656 -5.0%
Volume (1,000s) 537,351 513,861 4.6%
Aver
age List Price 212,981 193,472 10.1%
Days on Market 78 90 -13.0%
Percent of Original 96.8% 95.6% 1.3%
Med
ian List Price 163,100 149,900 8.8%
Days on Market 37 48 -22.9%
Percent of Original 100.0% 100.0% 0.0%
A total of 2,523 listings in the state of Kansas had contracts pending at the end of October, down from 2,656 contracts pending at the end of October 2012. Pending contracts reflect listings with a contract in place at the end of the month. In contrast, contracts written measures the number of listings put under contract during the month.
0
1,000
2,000
3,000
4,000
2009 2010 2011 2012 2013
Seasonally Adjusted
Actual Values
Units

KANSAS
MLS STATISTICS
Prepared on 11/18/2013 courtesy of the Kansas Association of REALTORS® using data from the Participating Kansas REALTOR® MLS Systems. Page 21 of 23
Provided by the WSU Center for Real Estate www.wichita.edu/realestate
ENTIRE STATE OF KANSAS ALL HOMES
AS OF 11/14/2013
PENDING CONTRACTS ANALYSIS
Contracts Pending List Price Days on Market List as % Orig. Price Range Number Percent Volume Average Median Average Median Average Median
Below $25,000 80 3.2% 1,333 16,663 16,000 103 47 85.8% 100.0% $25,000-$49,999 172 6.8% 6,571 38,206 37,000 102 62 92.2% 100.0% $50,000-$99,999 509 20.2% 39,622 77,843 79,500 109 68 94.4% 100.0% $100,000-$124,999 183 7.3% 20,768 113,488 114,900 87 50 97.6% 100.0% $125,000-$149,999 233 9.2% 32,128 137,888 139,000 87 48 97.3% 100.0% $150,000-$174,999 168 6.7% 27,375 162,945 164,250 67 34 98.0% 100.0% $175,000-$199,999 183 7.3% 34,331 187,602 187,500 84 44 97.7% 100.0% $200,000-$249,999 240 9.5% 53,874 224,473 224,370 68 24 98.7% 100.0% $250,000-$299,999 191 7.6% 52,809 276,486 275,750 53 20 99.0% 100.0% $300,000 and up 560 22.2% 267,688 478,014 424,879 47 4 99.2% 100.0% All price ranges 2,523 100.0% 537,351 212,981 163,100 78 37 96.8% 100.0%
Month 2011 2012 2013January 1,695 2,113 2,445February 1,796 2,522 2,899March 2,466 3,108 3,238April 2,760 3,402 3,832May 2,786 4,331 3,904June 2,391 3,277 3,727July 2,415 3,027 3,306August 2,304 2,863 2,998September 2,232 2,682 2,816October 2,056 2,656 2,523November 1,808 2,508December 1,746 2,1421,000
2,000
3,000
4,000
5,000
Jan Feb Mar Apr May Jun Jul Aug Sep Oct Nov Dec
201120122013
Units
KANSAS
MLS STATISTICS
Prepared on 11/18/2013 courtesy of the Kansas Association of REALTORS® using data from the Participating Kansas REALTOR® MLS Systems. Page 22 of 23
Provided by the WSU Center for Real Estate www.wichita.edu/realestate
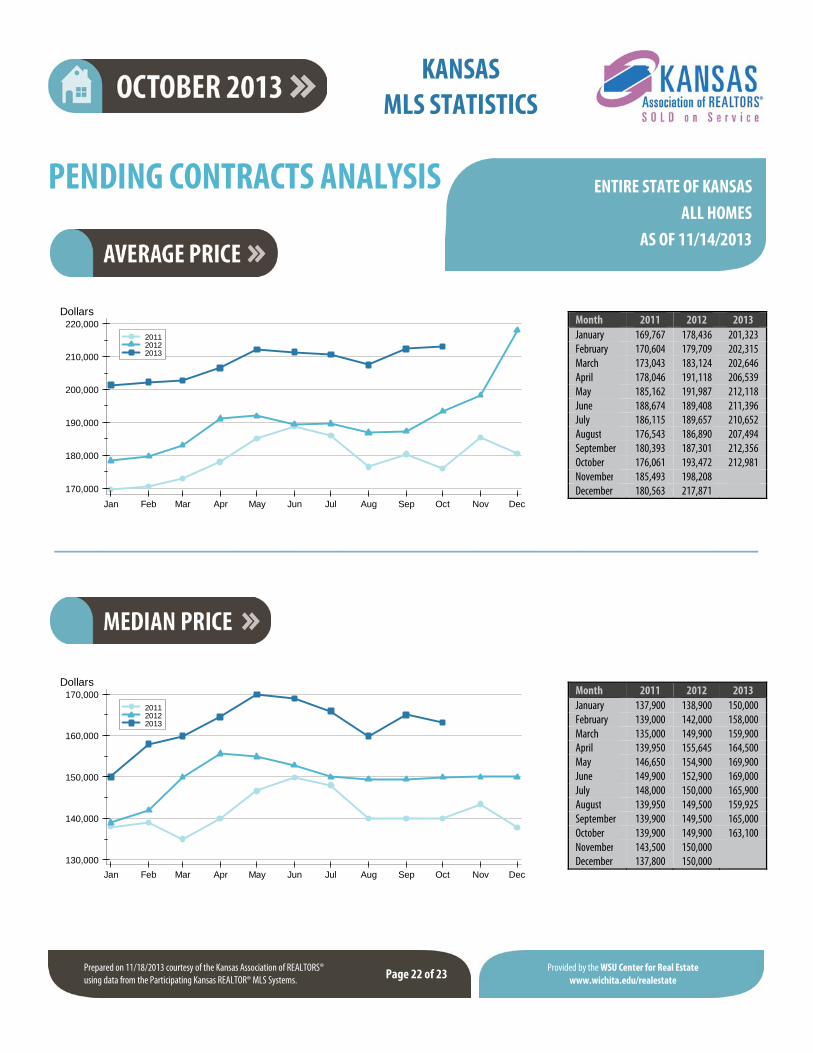
ENTIRE STATE OF KANSAS ALL HOMES
AS OF 11/14/2013
PENDING CONTRACTS ANALYSIS
Month 2011 2012 2013January 137,900 138,900 150,000February 139,000 142,000 158,000March 135,000 149,900 159,900April 139,950 155,645 164,500May 146,650 154,900 169,900June 149,900 152,900 169,000July 148,000 150,000 165,900August 139,950 149,500 159,925September 139,900 149,500 165,000October 139,900 149,900 163,100November 143,500 150,000December 137,800 150,000
Month 2011 2012 2013January 169,767 178,436 201,323February 170,604 179,709 202,315March 173,043 183,124 202,646April 178,046 191,118 206,539May 185,162 191,987 212,118June 188,674 189,408 211,396July 186,115 189,657 210,652August 176,543 186,890 207,494September 180,393 187,301 212,356October 176,061 193,472 212,981November 185,493 198,208December 180,563 217,871170,000
180,000
190,000
200,000
210,000
220,000
Jan Feb Mar Apr May Jun Jul Aug Sep Oct Nov Dec
201120122013
Dollars
130,000
140,000
150,000
160,000
170,000
Jan Feb Mar Apr May Jun Jul Aug Sep Oct Nov Dec
201120122013
Dollars

KANSAS
MLS STATISTICS
Prepared on 11/18/2013 courtesy of the Kansas Association of REALTORS® using data from the Participating Kansas REALTOR® MLS Systems. Page 23 of 23
Provided by the WSU Center for Real Estate www.wichita.edu/realestate
ENTIRE STATE OF KANSAS ALL HOMES
AS OF 11/14/2013
PENDING CONTRACTS ANALYSIS
Month 2011 2012 2013January 67 70 55February 68 67 45March 65 51 39April 53 43 34May 50 42 29June 52 41 28July 58 46 32August 68 49 33September 68 49 34October 66 48 37November 67 52December 73 51
Month 2011 2012 2013January 106 112 93February 106 107 91March 105 101 87April 96 93 79May 94 84 73June 90 86 71July 97 89 74August 106 88 72September 110 85 73October 105 90 78November 107 91December 113 9070
80
90
100
110
Jan Feb Mar Apr May Jun Jul Aug Sep Oct Nov Dec
201120122013
Days
30
40
50
60
70
Jan Feb Mar Apr May Jun Jul Aug Sep Oct Nov Dec
201120122013
Days