just-in-time planning: new york + houston
TRANSCRIPT

88
Michael Kwartler counters the rigiddeterminism of urban planning policywith a just-in-time approach. Hedescribes a new planning, design andregulatory model that harnessesinformation technologies, such asgeographic information systems (GIS)and emerging planning and design-decision support (PDDS), which ‘learn’from experience and provide the meansto be self-organising and adjusting,responding to rather than anticipating or even trying to direct change.
Planning for adaptive reuse in Lower Manhattan using 3-D-GIS
In 1992, the Environmental Simulation Center developed a 3-D-GIS systemto examine the adaptive reuse potential of over 25 million square feet ofvacant space in office buildings in New York’s Lower Manhattan. 3-D-GIS
spatially references the database to a floor-by-floor model of everybuilding in Lower Manhattan, thereby enabling the user to capture, queryand visualise data on a floor-by-floor basis that made it possible toconceptualise mixing uses at a fine grain, building by building. Thedatabase includes zoning, census, infrastructure, building constructionand age, floor sizes and total floor area, independent elevator banks andvacancy rates that were updated quarterly. The figures here illustrate asequential query with the top figure showing all floors above 150 feet thatmet the criteria for residential reuse, in red; the middle figure showingonly those floors in buildings built prior to 1945, in blue; and the bottomfigure showing all of the floors in the pre-1945 buildings that were over50 per cent vacant at that time, in magenta. Beyond the individualbuilding, the 3D-GIS made it possible to understand the probability ofadaptive reuse in an area, and whether the aggregate of the floorsconverted to residential use achieved a critical mass for services andsubway stations to be opened at night.
JUST-IN-TIMEPLANNING: NEW YORK +HOUSTON
89
Planners and architects pride themselves on their(mistaken) belief that they can create regulatory regimesthat reflect with certainty how citizens will live, work andrecreate in the foreseeable future. The result has beenhighly prescriptive regulations, such as New Urbanistcodes, that predetermine, on a site-by-site basis, whereactivities will happen, the intensity or density of theactivities, and overdetermined building form regulations.
This approach to city design defies common sense whenthe perception, if not the reality, of cities is that they arechaotic and unpredictable entities. In other words, citiesare examples of complex systems that manifest self-organising and self-adjusting characteristics. As KevinLynch has noted:
[the city] is the product of many builders who are
constantly modifying the structure for reasons of their own. While it may be stable in general outlines for sometime, it is ever changing in detail. Only partial control can be exercised over its growth and form. There is no final result, only a continuous succession of phases.1
If Lynch’s observation is true – and everyday experience tendsto bear it out – then the current practice of planning, designingand regulating our cities is distinctly 19th century, where thefactory system is applied to city design. In this system, cities areatomised into their component parts, optimised and reassembledinto a rationalised whole.
More recently we have begun to see planning, design andregulatory approaches that are decidedly more 21st century:approaches to city planning and design and regulation that aredynamic, that embrace complexity and change, and deal with flows
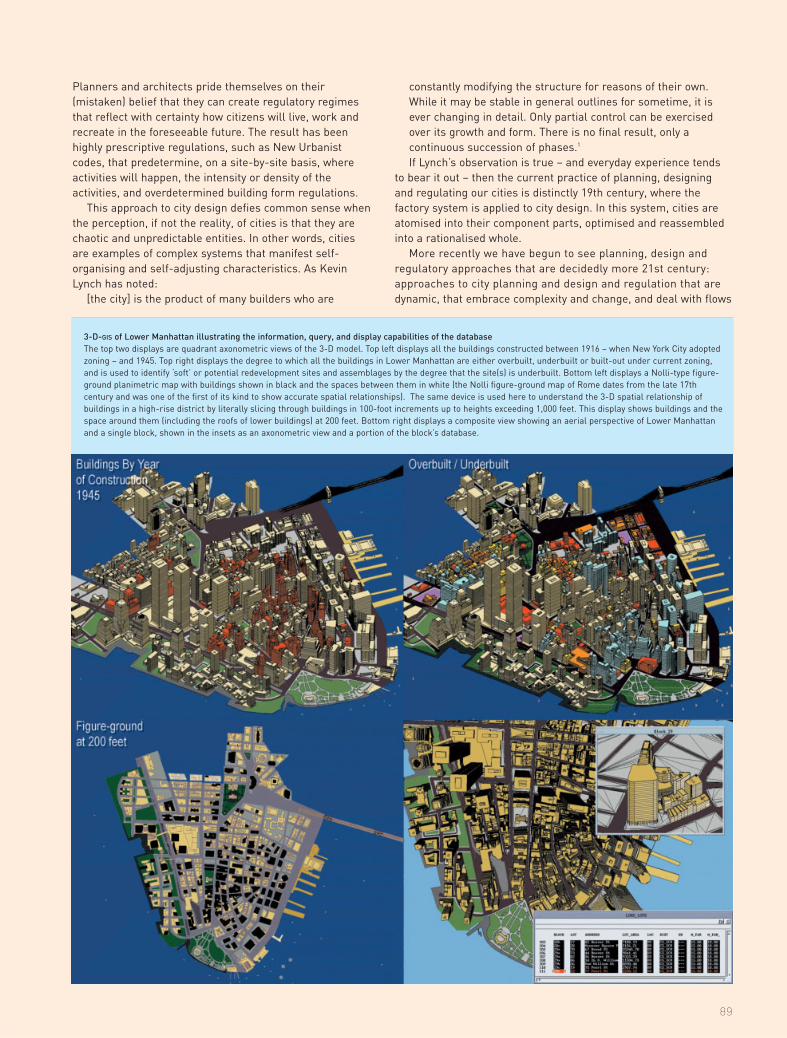
3-D-GIS of Lower Manhattan illustrating the information, query, and display capabilities of the databaseThe top two displays are quadrant axonometric views of the 3-D model. Top left displays all the buildings constructed between 1916 – when New York City adoptedzoning – and 1945. Top right displays the degree to which all the buildings in Lower Manhattan are either overbuilt, underbuilt or built-out under current zoning,and is used to identify ‘soft’ or potential redevelopment sites and assemblages by the degree that the site(s) is underbuilt. Bottom left displays a Nolli-type figure-ground planimetric map with buildings shown in black and the spaces between them in white (the Nolli figure-ground map of Rome dates from the late 17thcentury and was one of the first of its kind to show accurate spatial relationships). The same device is used here to understand the 3-D spatial relationship ofbuildings in a high-rise district by literally slicing through buildings in 100-foot increments up to heights exceeding 1,000 feet. This display shows buildings and thespace around them (including the roofs of lower buildings) at 200 feet. Bottom right displays a composite view showing an aerial perspective of Lower Manhattanand a single block, shown in the insets as an axonometric view and a portion of the block’s database.

of information in iterative feedback loops. These feedback loops –with feedback beginning to occur in real time – make possible afundamental change in thinking about planning and regulation,where demand (bottom-up) rather than supply (top-down) is theoperative principle. Information technology is making thesechanges possible. Geographic information systems (GIS), wherebyinformation is place-based, and emerging planning and design-decision support (PDDS) software, provide tools that enable citiesand their citizens to be responsive to changing conditions anddemands on how urban space is to be used and configured.
The state of the contemporary city argues for a method ofplanning, design and regulation that is ‘just-in-time’, rather than‘not-in-time’ and ‘just-in-case’, while recognising that someelements in a city are more stable (for example, infrastructure,streets, blocks and plots) than others (such as buildings and howthey are used). The metaphor for a Toyota-ist ‘just-in-time’ systemcould be the market. Indeed, Juval Portugali uses the food marketas just such an example:
A miniature of the real big, large-scale case of just-in-
time production and supply systems – the food market oflarge cities where a large number of firms of all sizes supply food for millions of people without creating shortages or surplus … and what happens in the food markets is but one facet, indeed a beautiful illustration, of a more general property of the city as a self-organizing system.2
The key is timely information provided through feedbackloops. This information is the 21st century’s infrastructureequivalent of the 19th century’s water supply systems andthe 20th century’s road and communications systems.
The planning, design and regulatory paradigm describedhere takes advantage of the accelerating feedback loopsprovided by GIS and PDDS, where information feedback onwhat is happening on the ground would be evaluated againstexpectation of performance. With the aid of GIS, performancebecomes place-based, and plays a critical role in locatingcommon ground. As Donald Appleyard has observed:
(T)echnical planning and environmental decisions are
90
Community Viz™ planning and design-decision support softwareCommunity Viz™, designed by the Environmental Simulation Centerand its collaborators, is a suite of GIS-based PDDS software designedfor planners, designers and communities that makes all types ofdata associated with planning and urban design issues – words,numbers and images – mutually accountable to each other in anintuitive, interactive and visual environment that facilitates the
... new policies can be proposed ...
... alternative scenarios can beconstructed in three dimensions ...
... the impacts can bequickly identified ...
... and everything can be viewed and modifiedinstantly in an interactive,virtual model of thecommunity.
Visualisation can betied to GIS data ...
creation, comparison and evaluation of alternative scenarios and strategies. Theprocess of using Community Viz™ is neither linear nor hierarchical. It has beendesigned to encourage the user to simultaneously test and evaluate theimplications of scenarios at different scales, as well as develop and revise allassumptions, performance indicators and formulae in an accessible, fullytransparent environment.

91
which moribund 19th- and early 20th-century industrial loftbuildings and districts in Manhattan were illegally converted tolive/work accommodation by artists and others. Facilitated by thefact that loft buildings are underdetermined and ‘loose fit’, Lynch’s‘builders’ experimented with ways to adapt such lofts to the needsof living and working. This ‘group learning’ led to the developmentof a new housing type, the repositioning of industrial districts andlofts in the public’s mind 20 years later as highly desirable placesto live and work and, ultimately, their legalisation in the city’szoning resolution.
Based on this example, we can imagine a city design andregulatory system that encourages creativity – ‘the good you can’tthink of’ – by framing the problem to be solved, rather thanprescribing the solution. For instance, a principle that guidesdesign and regulatory decision making might be: encourage adiversity of ways to live and work that do not threaten the well-being of the inhabitants and their neighbours. The performance ofproposed uses against this principle can be measured byindicators of performance. By definition performance assumes
not only value-based … but identity-based … (P)hysical planning decisions can, and frequently do, threaten the identity and status of certain groups while enlarging the powers of others.3
Performance indicators would be based on commonlyheld group values that by their nature are guidingprinciples and, hence, have a longer shelf life than thepremeditated ‘solutions’ often embodied in plans andregulations, even including the more recent New Urbanistcodes. Performance indicators are measurable using eitherqualitative or quantitative variables. An example of aperformance indicator might be ‘diversity’ and might bemeasured by tenure, household income, age of thehouseholder, along with other variables.
Unlike static systems, this new planning, design andregulatory paradigm ‘learns’ from experience and providesthe means to be self-organising and self-adjusting, oftenresulting in a ‘good’ that could not have been anticipated ina top-down system. A metaphor would be the process in
Technologically facilitated community-planning workshopThis series of images is taken from a community-planningworkshop that used Community Viz™. The focus of the workshopwas the urban regeneration of an obsolete industrial area. Theworkshop had three components: (1) formulation by theparticipants of indicators, bench marks and capacities that wouldbe used to evaluate the performance of alternative urban-regeneration scenarios [right-hand columns of the userinterfaces); (2) the development of a 3-D tool box of smart,attributed neighbourhood ‘building blocks’; (3) the design ofalternative urban-regeneration scenarios in real time [lower mapwith dynamic view cone and above it the view of the interactive 3-Dmodel at eye level). The sequence illustrates ‘learning by doing’,whereby the participants design a scenario in 3-D by selecting andplacing the smart buildings in the model. Simultaneously, as thesmart building blocks are placed in the 3-D model, the scenario’sperformance is evaluated against the indicators, which change asbuilding blocks are added or subtracted, giving the designersimmediate feedback on the implications of their decisions.

92
that there are multiple right answers to a design or planningproblem and the degree of ‘fit’ (see Christopher Alexander’sNotes on the Syntheses of Form)4 is the measure of performance.
We can design software built on a GIS platform that incorporatesthe tools needed to support a just-in-time performance-basedplanning, design and regulatory regime. PDDS demystifies theintricate process of planning by recognising that words, numbersand images are all ways of representing the world around us. Thispremise allows us to create ‘what-if’ scenarios integrating impactanalysis (a moment in time), performance evaluation andforecasting (change over time) in an interactive 3-D/virtual realityenvironment. These tools are designed to support both deductive(analytical) and inductive (intuitive) reasoning in a nonhierarchical,nonlinear structure that supports the way we think.
Most PDDS systems come with no data or formulae. Rather, theyare empty shells that need to be populated with information aboutthe community, by the community. The process of using PDDS doesnot require a specific entry point or order in which its componentmodules are used. For example, the user is not required to enterat the macroscale of public policy and work towards the micro-scale of neighbourhood block. Instead, the systems encourage theuser to simultaneously test and evaluate the implications of ascenario at different scales, modify them on the fly, all in aniterative and interactive process that informs choices.
The principles and performance indicators described abovemust be formulated and weighted by citizens to ensure that they
represent the community’s values and sense of identity.This is a critical component of PDDS because it bringscitizens together to determine the basis on which they willevaluate events, propositions and proposals, and makechoices that are accountable to a shared set of values. Asignificant outcome of this activity is the creation of social capital.
The best PDDS systems allow everyone to participate inthe process – even those who cannot draw or buildmodels. For most citizens, the quality of the place isimportant, as it is what they experience. PDDS systemssuch as Community Viz™ enable citizens to approachissues experientially by testing ideas in three dimensionsdynamically, greatly enhancing participation and levels ofthe playing field. In this modality, design itself becomes aform of enquiry.
Unlike conventional planning and regulation, which isepisodic (for example, the plan and regulations are doneonce every ‘x’ years and then take on a ‘mosaic’ immutablequality), PDDS would be fully integrated into the publicdecision-making process to create scenarios, evaluatealternatives and provide the basis for informed publicdiscussion and decision making. In communities, or evenneighbourhoods, it is not unusual for the aggregates ofincremental decisions, made over time, to lead tounintended and often unwanted consequences. PDDS can
Managing change along Houston’s light-rail corridorDeveloped for the City of Houston by the Environmental Simulation Center,the Performance/Tracking/Allocation (P/T/A) system monitors growth alongthe city’s recently completed Main Street light-rail corridor. The goals were: (1) measure the performance of the corridor against 22 community-basedindicators; (2) track change as it occurs; and (3) allocate future-year growthto where it is likely to occur. It consists of two components: the LandDevelopment Model and the Performance Report Card. The LandDevelopment Model produces its monthly estimates of population, housingunits, households and employment by utilising digital information alreadyrecorded by the city in the form of building permits. Outputs from the LandDevelopment Model allow the user to examine change for dozens ofindicators. In the example opposite, the user can see the spatial distributionof building permits indicating higher than predicted housing activity, and theadjusted forecast. The short feedback loop is extremely useful in targetingthe planning and allocation of resources for infrastructure improvements to complement and encourage private investment. The top-right example illustrates the suitability of commercial development at a parcel level basedon frontage on busy streets, proximity to light rail, plot size and surrounding
DevelopmentSuitability:Commercial
DevelopmentSuitability:Commercial
uses. The Land Development Model is linked to the Performance Report Card(above), which organises and evaluates the corridor’s performance againstexpectations. Because the districts through which the light rail runs are quitediverse, each district may weight the indicators differently based on communityvalues. Further, the interface allows the user to evaluate performance at multiplelevels of geography – the entire corridor, any district or any light-rail station. Boththe Land Development Model and Performance Report Card are completelytransparent and adjustable by the user.

93
community is critical to the objective of building social capitalthrough a reinvigorated concept of citizenship, and rejects the‘one-size-fits-all’ approach to planning, design and regulation.
Finally, the devolution of control made possible by informationtechnology helps to loosen the tight reins of overdeterminedsystems of control and exclusion into an underdetermined systemof inclusion that harnesses responsible individual action andcreativity, and sustains the creation of social capital anddemocratic values. Given the vested interests in the status quo atthe national, and even the state, level the local level presents theideal environment for creativity and democratic decision makingbased on inclusion and enlightened understanding, control of theagenda, effective participation, and voting equality at the decisivestage.5 We should seize the moment. 4
provide the forecasting environment that can suggestwhere the aggregation of incremental decisions may lead.For example, if we continue ‘business-as-usual’, what arethe short-, medium- and long-term consequences of ouractions, and are they acceptable based on our commonlyheld values and identity? Further, PDDS provides theenvironment in which to calibrate values and, whennecessary, re-evaluate their relevance and their relativeand absolute importance based on feedback from priordecisions and actions. A ‘good thing’ one day might be a ‘badthing’ the next day and vice versa. An example of this couldbe the Eiffel Tower which, when it was built, was widelypanned by artists and intellectuals, and only later became astructure revered by Parisians and an icon of the city.
Such tools have the potential to provide the substantivebasis for decisions made at the appropriate level,decentralising decision making to those most familiar withthe place, the issues and the information needed to informthe decision-making process. The metasystem ofcommonly held values, principles and performanceindicators would be adjusted to local conditions. Forexample, the performance indicator that evaluatescompliance with the diversity principle used above could beweighted differently among all the performance indicators,and the diversity ‘mix’ adjusted to local goals. The processof localising principles and performance indicators to a
Notes1 Kevin Lynch, Image of the City, MIT Press (Cambridge, MA), 1960, p 2.2 Juval Portugali, Self Organization and the City, Springer Verlag (Berlin Heidelberg,Germany), 2000, p 36.3 Donald Appleyard, ‘The Environment as Social Symbol’, Journal of the AmericanInstitute of Planners 143, 1979.4 Christopher Alexander, Notes on the Synthesis of Form, Harvard University Press(Cambridge, MA), 1966.5 Robert A Dahl, Democracy and Its Critics, Yale University Press (New Haven, CT andLondon), 1989.
Building Permits
+ Regional Forecast
= Adjusted Forecast
P/T/A system: tracking change and allocating growthThe P/T/A system uses building permits to track change as it occurs and to adjustforecasted growth.
Higher-than-predictedhousing activity