juries, judges, and punitive damages: an empirical study
TRANSCRIPT

Cornell Law LibraryScholarship@Cornell Law: A Digital Repository
Cornell Law Faculty Publications Faculty Scholarship
3-1-2002
Juries, Judges, and Punitive Damages: An EmpiricalStudyTheodore EisenbergCornell Law School, [email protected]
Neil LaFountainNational Center for State Courts, [email protected]
Brian OstromNational Center for State Courts, [email protected]
David RottmanNational Center for State Courts
Martin T. WellsCornell University, [email protected]
Follow this and additional works at: http://scholarship.law.cornell.edu/facpubPart of the Applied Statistics Commons, Civil Procedure Commons, Litigation Commons, and
the Remedies Commons
This Article is brought to you for free and open access by the Faculty Scholarship at Scholarship@Cornell Law: A Digital Repository. It has beenaccepted for inclusion in Cornell Law Faculty Publications by an authorized administrator of Scholarship@Cornell Law: A Digital Repository. Formore information, please contact [email protected].
Recommended CitationEisenberg, Theodore; LaFountain, Neil; Ostrom, Brian; Rottman, David; and Wells, Martin T., "Juries, Judges, and Punitive Damages:An Empirical Study" (2002). Cornell Law Faculty Publications. Paper 372.http://scholarship.law.cornell.edu/facpub/372

JURIES, JUDGES, AND PUNITIVE DAMAGES:AN EMPIRICAL STUDY
Theodore Eisenberg Neil LaFountain, Brian Ostrom, David Rottman& Martin T. Wellst
This Article, the first broad-based analysis of punitive damages injudge-tried cases, compares judge and jury performance in awarding puni-tive damages and in setting their levels. Data covering one year ofjudge andjury trial outcomes from fort)five of the nation's largest counties yield nosubstantial evidence that judges and juries differ in the rate at which theyaward punitive damages or in the central relation between the size of puni-tive awards and compensatory awards. The relation between punitive andcompensatory awards in jury trials is strikingly similar to the relation injudge trials. For a given level of compensatory award, there is a greaterrange of punitive awards in jury trials than in judge trials. The greaterspread, however, produces trivially few jury awards that are beyond the rangeof what judges might award in similar cases.
INTRODUCTION ................................................. 744I. BACKGROUND AND DEScRIPTIvE DATA .................... 747
A. Trial Outcomes Generally .......................... 748B. Punitive Damages Award Patterns ................... 750
1. Frequency of Punitive Awards ...................... 7502. The Relation Between Punitive and Compensatory
Awards .......................................... 7523. The Punitive-Compensatory Ratio .................. 754
II. TBE DECISION TO AwARD PuNrrIVE DAMAGES ............ 757A. Modeling the Decision to Award Punitive Damages. 758B. Empirical Results ................................... 759C. Interpreting the Results in Light of Other Recent
Studies ............................................. 763D. Selection Effect Considerations ..................... 766
1. Selection Attributable to Case Routing Between JudgeandJu y ........................................ 766
t Theodore Eisenberg is the Henry Allen Mark Professor of Law, Cornell University;Brian Ostrom and David Rottman are Project Co-Directors of the Civil Trial Court NetworkProject at the National Center for State Courts (NCSC); Neil LaFountain is Court ResearchAnalyst at the NCSC; and Martin Wells is Professor of Statistics, Department of Social Statis-tics, and Elected Member of the Law Faculty, Cornell University. The research that theNCSC conducted was supported by grant number BJS-96-BJ-CX-K012 from the U.S. Bureauof Justice Statistics (BJS). The points of view presented are those of the authors; they donot necessarily represent the policies or views of the BJS or the NCSC. We thank Kevin M.Clermont andJeffreyJ. Rachlinski for their comments.
HeinOnline -- 87 Cornell L. Rev. 743 2001-2002

CORNELL LAW REVIEW [Vol. 87:743
2. Selection Attributable to Case Settlement ............. 767III. THE RELATION BETWEEN PUNITrvE DAMAGES AND
COMPENSATORY DAMAGES ................................ 771
A. Modeling the Level of Punitive Damages Awards .... 771B. Results ............................................. 772C. The Greater Spread in the Jury Regression Models . 774D. Selection Effect Considerations ..................... 778
CONCLUSION ...................................................... 779
APPENDIX TABLES .................................................. 780
INTRODUCTION
Concerns about juries dominate punitive damages reform de-bates. Some observers suggest that allowing judges, not juries, to setpunitive award levels will improve civil justice.a Others regard the ju-ror's role as a strength of the system or question reducing jurors'power without evidence of judges' superiority.2 Judge-jury differ-ences, however, often are illusory or exaggerated-a fact that mightgive pause to juries' critics.3 Misperceptions about juries help explaintrial win rates and appellate outcome patterns.4
I See Reid Hastie & W. Kip Viscusi, WhatJuries Can't Do Welk TheJury's Performance as aRisk Manager, 40 Amiz. L. REv. 901, 916 (1998); Paul Mogin, Why Judges, Not Juries, Should SetPunitive Damages, 65 U. CHI. L. REv. 179 (1998); David Schkade et al., Deliberating AboutDollars: The Severity Shift 100 COLUM. L. REv. 1139, 1173 (2000); Cass R. Sunstein et al.,Assessing Punitive Damages (with Notes on Cognition and Valuation in Law), 107 YALE L.J. 2071,2078 (1998).
2 See Marc Galanter & David Luban, Poetic Justice: Punitive Damages and Legal Pluralism,
42 AM. U. L. REv. 1393, 1439 (1993); Richard Lempert, Juries, Hindsight, and Punitive Dam-age Awards: Failures of a Social Science Case for Change, 48 DEPAUL L. REv. 867 (1999); cf.Michael L. Rustad, How the Common Good is Served by the Remedy of Punitive Damages, 64 TENN.L. REv. 793, 844-45 (1997) (arguing that punitive damages are not random or arbitrary,but predictable).
3 See Kevin M. Clermont & Theodore Eisenberg, Trial by Jury or Judge: TranscendingEmpiricism, 77 CORNELL L. REV. 1124, 1151-56 (1992); Chris Guthrie et al., Inside theJudicialMind, 86 CORNELL L. REV. 777, 827 (2001) (finding that "judicial decision making.., isinfluenced by . . . cognitive illusions"); Neil Vidmar, The Performance of the American CivilJury: An Empirical Perspective, 40 Amiz. L. REv. 849, 868-70, 884-85 (1998); Neil Vidmar &Jeffrey J. Rice, Assessments of Noneconomic Damage Awards in Medical Negligence: A ComparisonofJurors with Legal Professionals, 78 IowA L. REv. 883, 896 (1993); Roselle L. Wissler et al.,Decisionmaking About General Damages: A Comparison ofJurors, Judges, and Lawyers, 98 MICH. L.REv. 751, 812 (1999); cf Richard A. Posner, An Economic Approach to the Law of Evidence, 51STAN. L. REV. 1477, 1500-02 (1999) (asserting that there is only slight evidence ofdifferences).
4 See Kevin M. Clermont & Theodore Eisenberg, Appealftom Jury orJudge Tria" Defend-ants' Advantage, 3 AM. L. & ECON. REv. 125 (2001) [hereinafter Clermont & Eisenberg,Appeals 1]; Kevin M. Clermont & Theodore Eisenberg, Plaintiphobia in the Appellate Courts:Civil Rights Really Do Differ from Negotiable Instruments, 2002 U. ILL. L. REv. (forthcomingApril) [hereinafter Clermont & Eisenberg, Appeals II]; Clermont & Eisenberg, supra note 3.
HeinOnline -- 87 Cornell L. Rev. 744 2001-2002

JURIES, JUDGES, AND PUNITIVE DAMAGES
Misperceptions about juries and punitive damages are especiallystrong. Contrary to popular belief, juries rarely award such damages, 5
and award them especially rarely in products liability and medical mal-practice cases. 6 Rather, juries tend to award punitive damages in in-tentional misconduct cases. 7 When juries do award punitive damages,they do so in ways that relate strongly to compensatory awards.8
5 E.g., Thomas A. Eaton et al., Another Brick in the Wall An Empirical Look at Georgia
Ton Litigation in the 1990s, 34 GA. L. REV. 1049, 1094 (2000) (finding that "punitive dam-ages currently are not a significant factor in personal injury litigation in Georgia"); Theo-
dore Eisenberg et a., The Predictability of Punitive Damages, 26J. LEGAL STUD. 623, 633-37(1997) (summarizing studies on the decision to award punitive damages); Neil Vidmar &Mary R. Rose, Punitive Damages by Juries in Rorida: In Terrorem and in Reality, 38 HARV.J. ONLEGIS. 487, 487 (2001) (reporting that, in Florida, the "frequency of punitive damages wasstrikingly low").
6 E.g., Eisenberg et al., supra note 5, at 635-37 (summarizing studies of jury trial
outcomes in these case categories); DeborahJones Merritt & Kathryn Ann Barry, Is the TortSystem in Crisis? New Empirical Evidence, 60 OHIO ST. L.J. 315, 388 (1999) (finding no puni-
tive awards in medical malpractice or products liability cases in a twelve-year period inFranklin County, Ohio); Vidmar & Rose, supra note 5, at 487 (reporting in a Florida studythat, "with the exception of asbestos cases, punitive damages were almost never given inproducts liability cases");J. CLARK KELSO & KA~i C. KELSo, AN ANALYSIS OF PUNrrrV DAm-AGES IN CAUFORNIA COURTS, 1991-2000, at 8 tbl.3 (reporting eleven products liability puni-tive damages awards in ten years of California litigation), available at http://12.2.169.205/govemmentlawand.policy/publications/ccglppubs.punitive_ damagesLreport.pdf (lastvisited Jan. 22, 2002). Kelso and Kelso do not separately report on medical malpractice
claims, perhaps because there were too few punitive awards to warrant separate reportingof that case category.
7 See Rustad, supra note 2, at 809.8 Eisenberg et al., supra note 5, at 637-39, 647-52; Theodore Eisenberg & Martin T.
Wells, The Predictability of Punitive Damages Awards in Published Opinions, the Impact ofBMW v.Gore on Punitive Damages Awards, and Forecasting Which Punitive Awards Will Be Reduced, 7Sup. CT. ECON. REv. 59 (1999) [hereinafter Eisenberg & Wells, Predictability on Appeal];
Theodore Eisenberg & Martin T. Wells, Punitive Awards After BMW, a New Capping System,and the Reported Opinion Bias, 1998 Wis. L. REV. 387, 388-89 [hereinafter Eisenberg & Wells,Reported Opinions]; Jonathan M. Karpoff & John R. Lott, Jr., On the Determinants and Impor-
tance of Punitive Damage Awards, 42 J.L. & ECON. 527, 543 (1999); Erik K. Moller et al.,Punitive Damages in Financial Injury Jury Verdicts, 28 J. LEGAL STUD. 283, 300 n.52 (1999);Vidmar & Rose, supra note 5, at 501 tbl.3 (finding that twelve years of Floridajury punitiveawards had a median punitive-compensatory ratio of 0.7 to 1). Even Alabama's much-maligned system of punitive damages awards is less extreme than is widely believed. SeeMoller et al., supra, at 333-34 (finding that Alabama juries in financial injury cases awardpunitive damages in amounts smaller than and at rates similar to other states in study, butthat punitive awards constitute a high proportion of amounts awarded and are a high mul-tiple of compensatory damages).
Schkade et al., supra note 1, at 1142 n.12, report an unpublished study "finding thatcompensatory and punitive damage awards are random in sexual harassment cases." TheColumbia Law Review kindly furnished us with the manuscript on which this claim is based,and which provides citations to the cases involved in the study. Cass R. Sunstein &Judy M.Shih, Damage Awards in Sexual Harassment Cases (June 23, 1998) (unpublished manu-script, on file with authors). The randomness claim appears to depend on the extremeinfluence of a handful of observations. The mass of cases in the study show a statisticallysignificant relation between punitive (log) and compensatory (log) awards. In addition,the study used published opinions, which tend to overstate punitive award levels and theratio of punitive awards to compensatory awards, see Eisenberg & Wells, Reported Opinions,supra, at 413.
2002]
HeinOnline -- 87 Cornell L. Rev. 745 2001-2002

CORNELL LAW REVIEW
Substantial evidence about juries' punitive damages performancehas led some critics to shift from criticizing the absolute nature ofjuries' performance to arguing that, however well juries perform,judges will perform better.9 Evaluating the propriety of reduced juryauthority requires knowledge ofjudges' performance in punitive dam-ages cases. Unstudied axioms relevant to a shift toward judges are thatjudges and juries systematically differ in (1) their inclinations to awardpunitive damages and (2) the levels of awards.
This Article explores these axioms with actual case data. Datacovering one year of judge and jury trial outcomes from forty-fivelarge trial courts, comprising nearly nine thousand trials, yield no evi-dence thatjudges and juries differ significantly in their rates of award-ing punitive damages, or in the relation between the size of punitiveand compensatory awards. Our primary results are descriptive andour primary claim is a negative one-the absence of evidence thatjudges and juries behave substantially differently. While it is temptingto make the positive assertion that judges and juries behave similarly,they do not see the same streams of cases and we cannot be sure howthey would behave if they did. Nevertheless, the absence of a signifi-cant difference in the cases is noteworthy. Conventional wisdomabout judges and juries-especially the claim that juries systematicallyimpose punitive damages "in a random and capricious manner"' 0-would find more support if substantial differences emerged.
The issues addressed here transcend the usual debate about opti-mizing rules of civil adjudication. In academia, criticizing punitivedamages has become the civil justice cause of recent years. 1l Outsideacademia, punitive damages reform is one of the main battlegroundsin the larger tort reform struggles.
Part I of this Article describes the data and reports descriptivestatistics about punitive damages award frequencies and levels. Part IIdescribes a model of the decision to award punitive damages and re-ports empirical results of tests of the model-tests that find no mean-ingfuljudge-jury differences. This Part also discusses the implicationsof case routing and case selection for interpreting the empirical re-sults. Part III addresses the relation between punitive and compensa-tory damages awards and again finds no substantial differencebetween judge and jury adjudication.
9 See Schkade et al., supra note 1, at 1167-73; Sunstein et al., supra note 1, at 2142-45.10 W. Kip Viscusi, Why There Is No Defense of Punitive Damages, 87 GEo. L.J. 381, 395
(1998).11 See, e.g., Daniel Kahneman et al., Shared Outrage and Erratic Awards: The Psychology of
Punitive Damages, 16 J. RISK & UNCERTAINTY 49 (1998); Mogin, supra note 1; A. MitchellPolinsky & Steven Shavell, Punitive Damages: An Economic Analysis, 111 HARv. L. REv. 869(1998); Schkade et al., supra note 1; Sunstein et al., supra note 1.
[Vol. 87:743
HeinOnline -- 87 Cornell L. Rev. 746 2001-2002

2 JURIES, JUDGES, AND PUNTIVE DAMAGES
IBACKGROUND AND DESCRIPTIVE DATA
The Civil Trial Court Network (CTCN), a project of the NationalCenter for State Courts and the U.S. Bureau of Justice Statistics (BJS),obtains data directly from state court clerks' offices. It covers statecourts of general jurisdiction in a random sample consisting of forty-five of the seventy-five most populous counties in the United States.' 2
The seventy-five counties include approximately 33% of the 1990 U.S.population and the forty-five counties actually sampled account forabout 20% of the population.13 The first CTCN trial data were lim-ited to jury trials and covered fiscal year 1991-92.14 New data, usingthe same stratified sampling methodology, cover judge and jury trialsin calendar year 1996.15 The 1996 data's inclusion of judge trials al-lows study of differences between judge and jury trial characteristics.The data about each case include the subject matter, locale, prevailingparty, type of litigants, and compensatory and punitive damage awardlevels.'
6
The CTCN data are the most representative sample of state courttrials in the United States. With direct access to court clerks' officesand approximately one hundred trained coders recording the data,the information gathered does not depend on litigants or third par-ties to report and code cases. Such self-reporting in jury verdict re-porters can lead to sample bias that overstates plaintiff win rates andaward levels.17 In several counties, CTCN case lists obtained fromclerks' offices were compared with local jury verdict reporters. The
12 For a summary of the data and methodology, see BUREAU OF JusTIcE STATISTICS,
U.S. DEP'T OFJUSTICE, BULLETIN No. NCJ-173426, CIVIL TRIAL CASES AND VERDICTS IN LARGECOUNTIES, 1996, at 1 (Sept. 1999) [hereinafter BJS 1996]. For a more complete description
of the data from the related 1992 study, see BUREAU OFJUSTICE STATISTICS, U.S. DEP'T OFJUSTICE, SPECIAL REPORT No. NCJ-153177, TORT CASES IN LARGE COUNTIES 1, 6 (Apr. 1995).The BJS used a two-stage stratified sampling technique described in the 1992 special re-
port. See id.13 See BJS 1996, supra note 12, app. B, at 20 (showing sampled counties' 1996 popula-
tions); Theodore Eisenberg et al., Litigation Outcomes in State and Federal Courts: A StatisticalPortrait 19 SEATrLE U. L. REV. 433, 434 (1996).
14 See BUREAU OF JUSTICE STATISTICS, U.S. DEP'T OFJUSTICE, CIVILJUSTICE SURVEY OF
STATE COURTS, 1992 (Inter-Univ. Consortium for Political and Soc. Research No. 6587, 3ded. 2001).
15 See BJS 1996, supra note 12, at 17. For sampling purposes, the seventy-five counties
were divided into four strata. See id. The 1996 data are from BUREAU OFJUsTICE STATISTICS,
U.S. DEP'T OF JUsTICE, CIVILJUSTICE SURVEY OF STATE COURTS, 1996 (Inter-Univ. Consor-
tium for Political and Soc. Research No. 2993, 2d ed. 2001) [hereinafter 1996 SURVEY]available at http://www.icpsr.umich.edu.
16 See BJS 1996, supra note 12.17 See Eisenberg et al., supra note 5, at 641 n.53; Merritt & Barry, supra note 6, at
324-26 (finding serious bias in commercial verdict reporter samples); Moller et al., supranote 8, app. at 335 (reporting reasonable levels of confidence in the jury verdict reportersused but acknowledging some possible bias).
2002]
HeinOnline -- 87 Cornell L. Rev. 747 2001-2002

CORNELL LAW REVIEW
jury verdict reporters sometimes failed to include approximately halfthe cases the CTCN found.
The CTCN data include all completed trials in thirty-six countiesand a random sample of trials in nine counties.' 8 In eight of the sam-pled counties, well over half the 1996 trials are included in the data.Appendix Table 1 lists summary statistics by county. In Harris County,Texas, which includes Houston, 352 judge and jury trials were ran-domly sampled out of approximately 1,500 trials, with jury trials some-what more heavily sampled than judge trials. This is the only countyin which sampling might distort the actual number of punitive awardsin judge and jury trials.19 The analyses reported here include HarrisCounty, but we report throughout the Article whether inclusion ofHarris County materially affects results.20
A. Trial Outcomes Generally
Table 1 presents summary statistics of the variables in this study.Panel A's two rows show, for both compensatory and punitive dam-ages, the mean and median awards in thousands of dollars and thenumber of plaintiff awards, all reported separately for jury and judgetrials. Panel A's first row shows that the mean compensatory award injury trials with an award is $1.047 million and the mean compensatoryaward in judge trials with an award is $152,000. The medians are alsosubstantially different; the jury trial median is $45,000 while the judgetrial median is $25,000. For both compensatory and punitive awards,panel A confirms the conventional wisdom that jury awards are higherthan judge awards. But substantial non-random case routing occurs.Amounts plaintiffs demand in jury-tried cases are significantly higherthan those they demand in judge-tried cases.21 In addition, tort trialstend to be routed to juries22 while judges tend to adjudicate contract
18 For a description of the sampling used, see BJS 1996, supra note 12, at 17-18. Thestatements in text are based on the authors' analysis of the data.
19 In Harris County, sampling may have led to an extraordinary proportion ofjudge-tried punitive damages cases. See BJS 1996, supra note 12, app. E, at 23 (reporting sixty-seven bench trials with punitive awards, which exceeds the sum of bench trial punitiveawards in all other counties in the sample). The sixty-seven trials reported reflect thecounty-level sampling. Twelve actual punitive awards were found in Harris County.
20 Unless otherwise noted, simple descriptive tables use unweighted data. In regres-sion analyses, unless otherwise noted, data are weighted to reflect the sampling in ninecounties, and standard errors and significance levels are adjusted to reflect the stratifiednature of the sample and the clustering of data at the county level. Our regression analysesaccount for the weighted sampling design in the data collection as well as the county-levelclustering and stratification based on sampling patterns.
21 See Clermont & Eisenberg, supra note 3, at 1177 app. B; Theodore Eisenberg &Kevin M. Clermont, Trial by Jury orJudge: Which Is Speedier?, 79 JUDIcATUR 176, 180 (1996).
22 See Clermont & Eisenberg, supra note 3, at 1141 tbl.4; Eisenberg et al., supra note13, at 443 tbl.4. Panel C's last two columns show that only three percent of medical mal-practice trials were before judges.
[Vol. 87:743
HeinOnline -- 87 Cornell L. Rev. 748 2001-2002

JURES, JUDGES, AND PUNITIVE DAMAGES
TABLE 1: SU iMARYSTATISTICS OFJURYANDJUDGE
TRIAL OUTCOMES AND AwARD PATrERNS
Mea Meian Number of Number ofMean MedianiPl* ds Trials
A. Award levels (thousands of dollars) &frequencies
Compensatory damages
Punitive damages
B. Plaintiff/defendant status
Individual only vs. individual only
Individual only vs. government
Individual only vs. corporation
Individual only vs. hospital
Individual & nonind. vs. ind. only
Individual & nonind. vs. corporation
Nonindividual vs. individual only
Nonindividual vs. corporation
C. Case categories
Motor vehicle tort
Premises liability
Products liability. asbestos
Products liability. other
Intentional tort
Medical malpractice
Professional malpractice
Slander/libel
Other negligence
Fraud
Seller plaintiff
Buyer plaintiff
Employment discrimination
Other employment dispute
Rental/lease agreement
Tortious interference with contract
Other contract
Other real property
Totals
jury Judge Jury Judge Jury Judge Jury Judge
1,047 152 45 25 3,001 1,375 6,429
1,870 547 50 30 121 55 121
Proportion of Proportion of ProportionTrias Wo by PlaintiffNWinsP rion Trials Won by tf ith Punitive
Plaintiffsd
.370 .269
.075 .052
.390 .273
.082 .020
.007 .014
.019 .027
.017 .126
.041 .220
.394 .096
.180 .056
.018 -
.022 .007
.032 .029
.116 .011
.012 .017
.007 .006
.045 .027
.027 .071
.033 .290
.036 .102
.020 .017
.014 .036
.013 .087
.010 .023
.010 .044
.011 .081
.607 .035 .053
.271 .024 .000
.576 .047 .067
.511 .031 .000
.606 .000 .050
.683 .059 .047
.745 .039 .023
.690 .050 .009
.636 .008 .007
.504 .011 .108
- .016 -
.706 .071 .083
.627 .214 .238
.280 .006 .000
.475 .069 .000
.385 .177 .000
.516 .021 .031
.586 .150 .126
.773 .028 .006
.645 .119 .046
.282 .213 .091
.537 .157 .093
.685 .073 .007
.519 .098 .111
.485 .079 .041
.366 .214 .017
.618 .040 .039
Source: BUREAU OFJUsTICE STATISTICS, U.S. DEP'T OFJUSTICE, CIVILJUSrICE SURVEY OF STATE COURTS, 1996(Inter-Univ. Consortium for Political and Soc. Research No. 2883, 2d ed. 2001)
2002]
HeinOnline -- 87 Cornell L. Rev. 749 2001-2002

CORNELL LAW REVIEW
cases. Plaintiffs tend to prevail in judge-tried cases significantly moreoften than in jury-tried cases. Table l's "Totals" row shows that plain-tiffs have an overall win rate of 62% in judge trials and 47% in jurytrials.
23
Panel B reports award frequencies for each litigant pair; panel Cdoes the same for each case category. Every case, regardless of thenumber of plaintiff or defendant types, is assigned one of four plain-tiff and defendant designations: hospital, corporation, government, orindividual. For cases involving more than one plaintiff or defendanttype, the case is assigned to the type appearing first in the above list-ing. For example, a case with a hospital defendant is characterized asa hospital defendant case even if the case also included business, indi-vidual, and government defendants. 24 The litigant characterizationhierarchy tries to capture the most salient characteristic of the liti-gants, though the hierarchy cannot assure capture of the most salientlitigant characteristic in each case. We further refine litigant pair cat-egories to identify cases in which only individuals sued other individu-als and cases in which only individuals sued corporations, and we alsocreate some smaller related categories.
B. Punitive Damages Award Patterns
Given a plaintiff victory at trial, punitive award decisionmakingcan be divided into two separate decisions: the decision to award puni-tive damages, and the decision setting the level of the punitive award.
1. Frequency of Punitive Awards
With respect to punitive damages award frequency, Table l's twolargest litigant pair categories-"individual only vs. individual only"and "individual only vs. corporation" (reported in panel B's first andthird rows)-account for over 75% of the trial outcomes. Both cate-gories show a higher rate of punitive damages awards in judge trialsthan in jury trials. Panel B's fifth and sixth numerical columns showthat when individuals sue individuals, punitive damages are awardedin 3.5% of the jury trials won by plaintiffs and in 5.3% of the judgetrials won by plaintiffs. However, the difference is not statistically sig-
23 This finding is consistent with federal court data in products liability and medicalmalpractice cases, Clermont & Eisenberg, supra note 3, app. A, at 1175, but is more broadbased in these state court cases. Panel C shows that in nearly all tort categories-includingmotor vehicle tort, premises liability, intentional tort, medical malpractice, professionalmalpractice, slander/libel, other negligence, and fraud-plaintiffs prevailed at a higherrate in judge trials than injury trials. Eitherjudges are more sympathetic to plaintiffs thanjuries or plaintiffs route their weaker cases to juries, probably based on the belief thatjurieswill be biased toward harmed plaintiffs. When that belief turns out to be a misperception,the observed pattern of win rates results. Id. at 1174.
24 BJS 1996, supra note 12, at 3 n.3.
[Vol. 87:743
HeinOnline -- 87 Cornell L. Rev. 750 2001-2002

2002] JURIES, JUDGES, AND PUNITIVE DAMAGES 751
nificant.25 The single highest rate of punitive damages awards occurswhen individuals sue corporations in judge trials; punitive damagesawards occur in 6.7% of the successful plaintiff cases in this category.These simple descriptive statistics provide no evidence that juries aremore inclined than judges to award punitive damages.
Panel C also shows that punitive damages award rates vary moreacross case categories than they do across litigant pairs. Intentionaltort, fraud, and employment cases26 are sizeable case categories inwhich punitive award rates are much higher than the four percentaverage for all plaintiff trial wins. Fraud and intentional tort casesyield punitive awards at a high rate regardless of whether the adjudica-tor is judge or jury, and together they account for about one-third ofall punitive awards. Employment cases show a noticeably higher rateof punitive awards before juries than before judges.27
Prior CTCN data and other data confirm geographical variationin award frequencies.28 The new CTCN data replicate this findingwith substantial intercounty differences in punitive award rates.29
These differences exist whether one considers only judge-tried casesor only jury-tried cases. But we are interested in the relation betweenthe frequency of punitive awards and the mode of trial-judge orjury.Even if judges and juries award punitive damages at different rates,one still wants to know whether that difference varies across the forty-
25 By statistical convention, the hypothesis being tested is called the null hypothesis.
GEORGE W. SNEDECOR & WILLIAi G. COCHRAN, STATISTICAL METHODS 64 (8th ed. 1989).Significance levels (also called p-values) are the probability of rejecting the null hypothesiswhen it is true. That is, the significance levels provide an inverse measure of the likelihoodthat the difference in punitive damages award rates shows a real difference rather thanmere random variation. The smaller the significance level, the more surprised one wouldbe to observe the difference if the tested hypothesis were true. See id. at 64-66. By arbi-trary convention, results that are significant at or below the 0.05 level are described astatistically significant. See THE EVOLVING ROLE OF STATISTICAL ASSESSMENTS AS EVIDENCE 11,THE COURTS app. A, at 196-97 (Stephen E. Fienberg ed., 1988). Throughout this Articlewe use the term significant in the statistical sense of significance level. For "individual onlIvs. individual only," the judge-jury punitive award rate difference is significant at the 0.12(level. For "individual only vs. corporation," thejudgejury punitive award rate difference isignificant at the 0.175 level. The insignificance of these p-values (both being noticeabl,higher than 0.05) does not depend on the inclusion of Harris County, Texas. See suprnote 19.
26 Vidmar and Rose report similar results for Florida jury trials, except they find tha
motor vehicle cases involving impaired or reckless drivers constitute the leading source cpunitive awards. Vidmar & Rose, supra note 5, at 494, 495 tbl.2. For evidence of the domanance of employment cases as a source of punitive damages in Florida federal court, see itat 491 n.14.
27 Combining the two employment categories yields a difference in judg-jury pun
tive award rates that is significant at the 0.062 level. See supra note 25.28 Eisenberg et al., supra note 5, at 640-41; accord STEPHEN DANIELS &JOANNE MARTII
CIVILJuRIES AND THE POLMTCS OF REFORM 69-72 (1995); ERIK MOLLER, TRENDS IN CIVILJUIVERDICTS SINCE 1985, at 33 (1996).
29 BJS 1996, supra note 12, app. E, at 23; infra Appendix Table 1.
HeinOnline -- 87 Cornell L. Rev. 751 2001-2002

CORNELL LAW REVIEW
five different counties observed in the study. Statistical analysis revealsthat one cannot reject the hypothesis of no county-level effect on therelation between frequency of punitive damages awards and mode oftrial.30
The numbers in Table 1 allow us to calculate the percent of puni-tive award cases decided byjudges. Judges gave 55 of the 176 (31.3%)punitive damages awards.31 Given the overwhelming focus on jury pu-nitive awards in the literature and policy debate, this share is surpris-ingly high.3 2 A detailed study of Georgia tort cases confirms thesurprisingly high fraction of punitive awards made byjudges.33
2. The Relation Between Punitive and Compensatory Awards
With respect to punitive award levels, Figure 1 shows the relationbetween punitive and compensatory awards in cases with punitiveawards. Figure I is a scatterplot of punitive damages (log) and com-pensatory damages (log), with judge (bench) and jury trials separatelyindicated by "B" and 'J," respectively. The logarithmic scales are usedbecause, as is often the case with award amounts, linear scales do not
30 The common method for testing such a hypothesis is to calculate the significance
level of the common odds ratio. See DouoLAs G. ALTMAN, PRAcTicAL STATISTICS FOR MEDI-CAL RESEARcH 270-71 (1991). The test for a common odds ratio across counties gives anexact p-value of p=0.331. For each county, we construct a table with two rows and twocolumns. The rows consist ofjudge and jury trials. The columns represent cases in whichno punitive award was given and cases in which a punitive award was given. This yieldsforty-five 2 x 2 tables, one for each county, the entries of which can be computed from theAppendix Tables. One can think of each county's 2 x 2 table as exploring the differencebetween judge and jury punitive award rates within the county, a question we explore for allcounties combined in the regression models that follow. We test whether the odds ratiofor these forty-five 2 x 2 tables is equal across the forty-five counties. Rather than using theMantel-Haenszel procedure, see id., we apply a test based on the conditional maximumlikelihood estimate of the common odds ratio. A problem in directly applying the test isthat many of the 2 x 2 tables are sparse (i.e., have cell counts of zero or one) and theasymptotic p-values may not be reliable. However, we use the results of Robert L.Strawderman & Martin T. Wells, Approximately Exact Inference for the Common Odds Ratio inSeveral 2 x 2 Tables, 93 J. Am. STAT. Ass'N 1294 (1998), to compute the exact p-value,thereby eliminating the sparseness problem.
31 The figures reported in Table 1 yield slightly different results due to rounding. Forjudges, (2,295 trials) x (0.618 proportion won by plaintiffs) x (0.039 proportion plaintiffwins with punitive award) = 55.3. For juries, (6,429 trials) x (0.473 proportion won byplaintiffs) x (0.040 proportion plaintiff wins with punitive award) = 121.6.
32 The 31.3% judge-trial share may understate the prominence of'judge-awarded pu-nitive damages. Accounting for the sampling methods used, the proportion of punitiveawards that are made by judges is 44%, and judges award punitive damages in about 5.5%of successful trials compared to 4.4% for juries. But excluding Harris County, Texas, seesupra note 19, gives judge trials a 25.7% share of all punitive damages awards, with judgesgiving punitive awards in 3.2% of plaintiff wins and juries giving punitive awards in 4.0% ofplaintiff wins.
33 Eaton et al., supra note 5, at 1094 (finding that judges awarded punitive damagesmore frequently than juries).
[Vol. 87:743
HeinOnline -- 87 Cornell L. Rev. 752 2001-2002

2002] JURIES, JUDGES, AND PUNITVE DAMAGES 753
reveal the relation between the variables.3 4 Figure 1 also shows thebest-fitting simple linear regression lines for judge and jury trials.35
The lines, which best describe the relation between compensatory andpunitive awards, are similar in slope and intercept. We defer detailedstatistical analysis ofjudgejury differences to Parts II and Ill. The pu-nitive-compensatory patterns in Figure 1 are similar to those in earlierstudies,3 6 and the pattern in judge-tried cases is consistent with thepattern in jury-tried cases.
Figure 1 shows that the simple log transformation that describesthe relation between punitive and compensatory jury awards also de-scribes judge awards. Both compensatory and punitive awards are ap-proximately log-normally distributed for judges and juries.37 Thisresult addresses a concern aboutjury punitive awards-that a logarith-
34 For discussion of the need for logarithmic scales in other sets of punitive damagesawards, see, for example, Eisenberg et al., supra note 5, at 638 figs.2-3, app. at 661figsAl-A2.
35 Simple regression models of punitive damages (log) as the dependent variable andcompensatory damages (log) as the explanatory variable, when run separately for judgeand jury trials, yield the following results (the intercepts are not statistically significant ineither equation):
Compensatory Standard(log) coefficient error Intercept r-squared N
Judge trials .883 .099 -. 155 .674 54Jury trials .930 .130 -. 395 .459 119
These models account for the sample stratification, weighting, and clustering by county.Models that combine the trial modes and use more explanatory variables are described inTable 3 infra. The greater dispersion around the regression line injury trials, as evidencedby Figure 1 and the lower r-squared for jury trials, is discussed in Part III.C infra.
36 E.g., Eisenberg, et al., supra note 5, at 638 fig.3; Moller et al., supra note 8, at 300n.52.
37 A test of the hypothesis that jury trial punitive awards (log) are normally distributedwith the observed sample mean and standard deviation yields p=0.418. The same test ofjudge trial punitive awards (log) yields p=0.140. Thus, for both judges and juries, onecannot reject the hypothesis that punitive awards are log-normally distributed. In casesthat yield positive punitive awards, a test of the hypothesis that jury trial compensatoryawards (log) are normally distributed with the observed sample mean and standard devia-tion yields p=0.986. The same test ofjudge trial compensatory awards (log) yields p=0.093.See Eisenberg et al., supra note 5, at 638 figs.2-3 (indicating that the logarithm of punitivedamages awards is close to being normally distributed, and showing the relationship be-tween compensatory and punitive damages). In addition, one can firmly reject the hypoth-eses that the untransformed punitive and compensatory awards are normally distributed.A scatterplot of punitive awards in judge trials against compensatory awards without the logtransformation is uninformative, as is a plot of untransformed punitive awards against thelog of compensatory awards.
Implicitly we are assuming that the punitive damages are distributed as a log-normaldistribution. A random variable has a log-normal distribution if its natural logarithm has anormal distribution. The log-normal distribution is common in financial modeling. Forinstance, the celebrated Black-Scholes pricing formula assumes that the evolution of theprice stochastic process follows a geometric Brownian motion. Hence the individual pricesare log-normally distributed. See Fischer Black & Myron Scholes, The Pricing of Options andCorporate Liabilities, 81 J. PoL. ECON. 637, 644 (1973).
HeinOnline -- 87 Cornell L. Rev. 753 2001-2002

CORNELL LAW REVIEW
Jury Trial -- Judge Trial
J100000
J B
10000- fJ 5:; -B1a, 1000 j
VJlOO -
J B J J
0 B. 10- JB'B JJ J j
J jJ
aB-
BB
B J JI II I
1 10 100 1000 10000 100000Compensatory (thousands)
FIGURE 1. Punitive and compensatory damages by judge or jury trial status. The figuredisplays both a scatterplot and the best fitting regression lines.
mic scale is needed to reveal the relation between punitive and com-pensatory awards, and that the scale understates variation in punitiveawards.3 8 The same logarithmic transformation illuminates the rela-tion between punitive and compensatory awards in judge trials.
3. The Punitive-Compensatory Ratio
Figure 1 shows no judgejury difference in the relation betweenpunitive and compensatory awards. To summarize that relation in asingle number to facilitate further comparison, we use punitive dam-ages (log) divided by compensatory damages (log) to construct theratio of the two damages measures.
Table 2 reports statistics summarizing the punitive-compensatoryratio in judge and jury trials. The table's last row shows that themeans, medians, and standard deviations do not differ significantlyacross trial modes. A statistical test of the difference between the en-tire distributions does not allow us to reject the hypothesis that theyare the same.3 9 The 95% confidence intervals for the means of theratios are narrow for both judge and jury trials. For judge trials theinterval ranges from 0.882 to 0.981. Forjury trials, the interval ranges
38 See Brief of Certain Leading Business Corporations as Amici Curiae in Support ofPetitioner at 11 n.14, Cooper Indus., Inc. v. Leatherman Tool Group, Inc., 532 U.S. 424(2001) (No. 99-2035); Schkade et al., supra note 1, at 1146 n.31; Sunstein et al., supra note1, at 2076 n.21; Viscusi, supra note 10, at 386.
39 The significance level is p=0.508.
[Vol. 87:743
HeinOnline -- 87 Cornell L. Rev. 754 2001-2002

2002] JUR1ES, JUDGES, AND PUN1TIVE DAMAGES
from 0.907 to 0.983, slightly narrower than the judge trial range, pre-sumably because of the greater number ofjury trials. Surprisingly, themedian punitive-compensatory ratio without transforming to logs ishigher in judge trials than injury trials. This ratio also does not signif-icantly differ between judge and jury trials.40
TABLE 2: PUNITIVE-COMPENSATORYAWARD RATIO BYTRIAL MODE
Mean Median Standard Untransformed Number ofRatio Ratio Deviation Median Ratio Cases
Judge trial .931 .948 .181 .578 54
Jury trial .945 .945 .211 .497 119
Significance ofjudge- .675 .987 .200 .924jury difference
,Source: BUREAU OFJUSTICE STATISTICS, U.S. DEP'T OFJUSTICE, CIVILJusrcE SURVEY OF STATE COURTS, 1996(Inter-Univ. Consortium for Political and Soc. Research No. 2883, 2d ed. 2001)
Note: The ratio is the ratio of punitive award (log) to compensatory award (log) in each case with an award ofboth. Untransformed ratio is the ratio of punitive award to compensatory award. The significance ofmeans difference is based on a t-test; the significance of medians differences are based on a Mann-Whitney test; the significance of standard deviations difference is based on an F-test.
The untransformed mean ratio is greater in jury trials. But thisstatistically insignificant difference is a consequence of a handful ofawards, most of which are known to have been reduced or are justifia-ble. Follow-up study of the most extreme punitive-compensatory ra-
40 The significance level is p=0.924. A significance test of the entire untransformed
ratio distributions yields p=0.425. The untransformed median ratio allows for comparisonwith Moller et al., supra note 8. In a study of financial injury cases, the Moller study reportsa median punitive-compensatory ratio injury trials of 1.4. Id. at 303 tbl.5. The 1991-92GTCN data, limited to jury trials, have an untransformed punitive-compensatory ratio of0.757. The substantially higher median in the Moller study may be a consequence of sam-ple bias in jury verdict reporters. See supra notes 17-18 and accompanying text. TheMoller study also shows some stability in the untransformed punitive-compensatory ratio.Its median does not vary in a statistically significant manner across jurisdictions in insur-ance cases or real property cases, or across plaintiff types in insurance cases. Id. at 310tbl.9, 313 tbl.11, 318 tbl.16. The median punitive-compensatory ratio is significantly differ-ent across jurisdictions in employment cases, id. at 315 tl.13, and across party types in aresidual category of contract cases; id. at 324 tbl.21. It is marginally significantly differentacross jurisdictions in a residual category of contract cases. Id. at 322 tbl.19.
The absence of statistically significant effects is probably not a consequence of samplesize. Perfectly executed studies may fail to reveal socially important differences "simplybecause the sample sizes are too small to give the procedure enough power to detect theeffect." STANTON A. GLANTZ, PRIMER OF BIosTATISTIcs 178 (4th ed. 1997). The power of atest refers to its likelihood of detecting an effect of a specified size at a specified signifi-cance level. I&. at 177-78. If a test is not very powerful, the likelihood of detecting theeffect is small. A power calculation shows that to be 80% confident of detecting a 10%difference in the ratios' means, at a significance level of 0.05, requires 104jury trials and 48judge trials. The sample size exceeds these numbers. This power calculation employs thestandard deviations observed in Table 2 and hypothesizes means that are 0.9 and 1.0. Thesample is also large enough to detect a statistically significant difference in means of about0.07 with 70% confidence.
HeinOnline -- 87 Cornell L. Rev. 755 2001-2002

CORNELL LAW REVIEW
tios4 1 suggests the distortion introduced by relying on extreme awardswithout further inquiry. Five of seven cases with punitive-compensa-tory ratios greater than ten were clearly justifiable or later resulted in areduced punitive award. One case with an extreme ratio involved sex-ual abuse of a child by a sports coach and led to a $2.6 million puni-tive damages award that no one expected to actually be paid.42
Another extreme case involved a $300,000 punitive award against awealthy car dealer who had failed to disclose a vehicle's history of de-fects and had rolled back a car's odometer by nearly 40,000 miles.43
The largest award was substantially reduced due to a then-existing capon punitive damages.44 One case with an extreme ratio is known tohave been reduced but the amount of reduction is not known, andanother case's punitive award was reduced by 90% to reflect that theplaintiff was 90% at fault.45 No information was found on two of thecases.
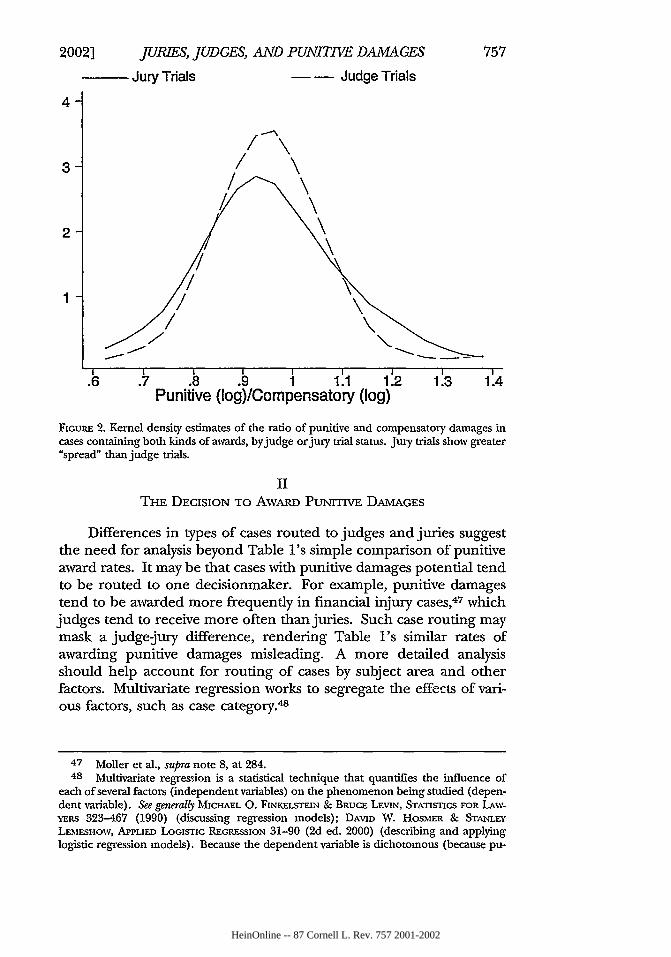
Figure 2 presents the distributions of the punitive-compensatoryratio for judge trials and for jury trials.46 Although Table 2 shows thatthe differences between the distributions are not statistically signifi-cant, the jury trial punitive-compensatory ratios are more "spread"than the judge trial punitive-compensatory ratios. Both the left andright tails of the jury trial distribution are larger than those of thejudge trial distribution. We address this greater spread in Part III.C.
Together, Table l's descriptive statistics, Figure 1, and Table 2'sand Figure 2's analyses of punitive-compensatory ratios show thatjudge-jury rates of awards do not differ substantially and that theirlevels of punitive awards bear a similar relation to levels of compensa-tory awards. The remainder of this Article employs more comprehen-sive statistical methods to further probe the absence of evidence ofjudgejury differences.
41 Three cases (one judge-tried and two jury-tried) involved zero compensatory
awards so the punitive-compensatory ratio is not amenable to numerical analysis. See infranote 104.
42 Margaret Zack, Man Awarded $2.6 Million for Coach's Abuse, but Probably Won't ReceiveMuch, STAR TRiB. (Minneapolis-St. Paul), May 15, 1996, at Bi.
43 Draeger Martinez, Gamel, Firm Ordered to Pay "Lemon"Damages, FRESNO BEE, Oct 22,1996, at B1.
44 Verdict Reduced, NAT'L L.J., Apr. 8, 1996, at All (punitive award reduced from $138million to $64.8 million, against three gas company defendants in an explosion case involv-ing twenty plaintiffs).
45 E-mail from Neil LaFountain to Theodore Eisenberg (Aug. 2, 2001, 09:27:34 EST)(on file with Theodore Eisenberg).
46 Figure 2 employs what are known as kernel density estimates to portray the ratios'
distributions. The more traditional way of portraying univariate statistical distributions,the histogram, can be thought of as a kind of kernel density estimator. Kernel densityestimates have the advantages of being smooth (they do not require the box-like bins ofhistograms) and of being independent of bin location, a choice that can profoundly shapethe appearance of a histogram. For discussion of kernel density estimation, see B.W.SILVERMAN, DENSITY ESTIMATION FOR STATISTICS AND DATA ANALYSIS 34-94 (1986).
756 [Vol. 87:743
HeinOnline -- 87 Cornell L. Rev. 756 2001-2002
J=URIES, JUDGES, AND PUNITIVE DAMAGES
-Jury Trials - - Judge Trials
7 ,/
7-.-- -
i I i i i I I
.6 .7 .8 .9 1 1.1 1.2Punitive (Iog)/Compensatory (log)
1.3 1.4
FIGuRE 2. Kernel density estimates of the ratio of punitive and compensatory damages incases containing both kinds of awards, by judge or jury trial status. Jury trials show greater"spread" than judge trials.
II
THE DECISION TO AwARD PuNrrIVE DAMAGES
Differences in types of cases routed to judges and juries suggestthe need for analysis beyond Table l's simple comparison of punitiveaward rates. It may be that cases with punitive damages potential tendto be routed to one decisionmaker. For example, punitive damagestend to be awarded more frequently in financial injury cases,47 whichjudges tend to receive more often than juries. Such case routing maymask a judgejury difference, rendering Table l's similar rates ofawarding punitive damages misleading. A more detailed analysisshould help account for routing of cases by subject area and otherfactors. Multivariate regression works to segregate the effects of vari-ous factors, such as case category.48
47 Moller et al., supra note 8, at 284.48 Multivariate regression is a statistical technique that quantifies the influence of
each of several factors (independent variables) on the phenomenon being studied (depen-dent variable). See generally MICHAEL 0. FINKELSrEIN & BRUCE LEVIN, STATISTICS FOR LAw-
YERs 323-467 (1990) (discussing regression models); DAVID W. HOSMER & STANLEYLEMESHOW, APPLIED LoGISTIC REGRESSION 31-90 (2d ed. 2000) (describing and applyinglogistic regression models). Because the dependent variable is dichotomous (because pu-
2002]
HeinOnline -- 87 Cornell L. Rev. 757 2001-2002

CORNELL LAW REVIEW
Preliminarily, one must consider whether the sample is largeenough to detect meaningful differences between judge and jury pu-nitive award rates, even if they do exist.49 Specifying what degree ofdifference is meaningful is a subjective judgment. Suppose one ac-cepts that a meaningful difference is a 3% punitive award rate inplaintiff victories in judge trials compared to a 5% punitive award ratein plaintiff victories in jury trials. Both assumed rates are reasonablyclose to Table l's observed rate of punitive awards in about 4% ofplaintiff trial wins. Using these rates, there is almost a 90% chance ofdetecting such a difference, or a larger difference, at a statistically sig-nificant level.50
A. Modeling the Decision to Award Punitive Damages
According to a simple model of the decision to award punitivedamages presented in our earlier work, the decision is linked to thenature of the defendant's behavior.5' The best available proxy forsuch behavior is the type of case. On average, for example, one ex-pects defendant behavior to have been worse in an intentional tortcase than in a case involving mere negligence. Table 1 and prior em-pirical work confirm this pattern.52 Therefore, in modeling the deci-sion to award punitive damages, we include dummy variables(variables equal to zero or one) for each case category and expect casecategories involving intentional misbehavior to yield the highest puni-tive award rates, as Table 1 suggests. This also helps control for therouting of cases between judges and juries based on subject areas.
A second behavior-related measure is the level of the compensa-tory award. Other things being equal, we regard behavior that causesmore harm as worse than behavior that causes less harm and as de-serving of more severe punishment.53 We use the compensatory dam-ages awarded in each case to approximate the degree of harm caused.
nitive damages either are or are not awarded), we use logistic regression. See FINKELSaiN &LEVIN, supra, at 447-52.
49 Professor Viscusi's effort to detect interstate differences in accident deterrencebased on whether states allow punitive damages was limited by, inter alia, sample size (thenumber of states). See Theodore Eisenberg, Measuring the Deterrent Effect of Punitive Damages,87 GEo. L.J. 347, 349 (1998). Viscusi acknowledges this limitation. Viscusi, supra note 10,at 390. However, erroneous characterization of states' punitive damages rules also com-promised the effort. Eisenberg, supra, at 348-49; Eisenberg & Wells, Predictability on Appealsupra note 8, at 73 n.45. Viscusi notes that he relied on published sources. Viscusi, supranote 10, at 391.
50 See supra note 40.51 Eisenberg et al., supra note 5, at 644-47.52 See id. at 645 tbl.4.
53 E.g., Jeffrey S. Parker & Raymond A. Atlins, Did the Corporate Criminal SentencingGuidelines Matter? Some Preliminary Empirical Observations, 42 J.L. & ECON. 423, 448-49(1999).
[Vol. 87:743
HeinOnline -- 87 Cornell L. Rev. 758 2001-2002

JURIES, JUDGES, AND PUNITIVE DAMAGES
Evidence exists thatjurors react differently to corporate and indi-vidual defendants.5 4 Table 1 reports summary statistics for several liti-gant pairs, including two of particular interest: actions by individualsonly versus individuals only, and actions by individuals only versus cor-porations. We include dummy variables for these and for Table l'sother litigant pairings. We use statistical models that account for theclustering of the sample at the county level.55
B. Empirical Results
Because the decision to award punitive damages is dichotomous,we employ logistic regression analysis.56 The dependent variable iswhether the plaintiff received a punitive damages award. The sampleconsists of over 4,300 trials with plaintiff victories. The explanatoryvariables include dummy variables for case categories and litigantcharacteristics, and a continuous variable for the size of the compen-satory award (log). The explanatory variables of particular interestare ajury trial dummy variable, which assesses whetherjuries are morelikely than judges to award punitive damages, and an interaction termconsisting of the product of the jury trial dummy variable and thecompensatory award. The interaction term monitors whether, ascompensatory awards increase, juries are more likely than judges toaward punitive damages.
Table 3 reports two models. The first includes the above-de-scribed explanatory variables. The second limits the explanatory vari-ables to three: the compensatory award, the jury trial dummy variable,and the interaction term.
The first and third numerical columns show a variable's "oddsratio" or "odds multiplier," a way of expressing the size of a variable'sinfluence on whether punitive damages were awarded.57 For the case
54 E.g., Valerie P. Hans & William S. Lofquist, Jurors'Judgments of Business Liability inTort Cases: Implications for the Litigation Explosion Debate, 26 LAw & Soc'y REv. 85 (1992);RobertJ. MacCoun, Differential Treatment of Corporate Defendants by Juries: An Examination ofthe "Deep-Pockets" Hypothesis, 30 LAw & Soc'v REV. 121, 140 (1996). But this difference doesnot necessarily translate into juror hostility toward corporations. See Richard Lempert, WhyDo Juries Get a Bum Rap? Reflections on the Work of Valerie Hans, 48 DEPAUL L. Rxv. 453, 455(1998). Jurors may react especially negatively to misbehavior by insurance companies. SeeEisenberg & Wells, Predictability on Appea4 supra note 8, at 67, app. at 85 tbl.1 (showing thatthe median of punitive-compensatory damages ratios are highest in insurer misbehaviorcases); Valerie P. Hans & Nicole Vadino, Whipped by Whiplash? The Challenges ofJury Commu-nication in Lawsuits Involving Connective Tissue Injury, 67 TENN. L. Rav. 569, 580-82 (2000).But juries generally are skeptical about plaintiffs' claims. See id. at 572-77.
55 A fixed-effects model does not yield materially different results, but we had to dropseveral hundred observations due to lack of within-site variation.
56 See supra note 48.57 In multivariate logistic regression, each estimated coefficient provides an estimate
of the corresponding variable's effect on the logarithm of the odds of the dependent varia-ble, adjusting for all other variables included in the model. The odds multiplier is ob-
2002] 759
HeinOnline -- 87 Cornell L. Rev. 759 2001-2002

CORNELL LAW REVIEW [Vol. 87:743
TABLE 3: LOGISTIC REGRESSION RESULTS: PUNITIVE DAMAGES AWARDED
Full Model Parsimonious Model
Variable Odds Ratio Significance Odds Ratio Significance
Compensatory damages (log) 1.371*** 0.000 1.302"** 0.000
jury trial dummy
Jury trial x log of compensatory interaction
Plaintiff/defendant status dummy variables
Individual only vs. individual only(ref. category)
Individual only vs. government
Individual only vs. corporation
Individual only vs. hospital
Individual & nonind. vs. individual only
Individual & nonind. vs. corporation
Nonindividual vs. individual only
Nonindividual vs. corporation
Case category dummy variables
Products liability (reference)
Motor vehicle tort
Premises liability
Products liability: asbestos
Intentional tort
Medical malpractice
1.660 0.419 0.956 0.934
0.821* 0.014 0.904 0.139
0.294**
0.891
0.798
0.244
1.177
0.736
0.264**
0.131**
0.862
0.700
5.130*
0.206
0.007
0.734
0.635
0.220
0.732
0.570
0.003
0.001
0.865
0.784
0.010
0.191
Professional malpractice 0.421 0.344
Slander/libel 3.095 0.184
Other negligence 0.484 0.400
Fraud 2.909* 0.048
Seller plaintiff 0.320 0.094
Buyer plaintiff 2.461 0.158
Employment discrimination 4.272* 0.025
Other employment dispute 2.397 0.072
Rental/lease agreement 0.484 0.422
Tortious interference with contract 2.234 0.128
Other contract 1.058 0.939
Other real property 1.410 0.612
Model significance .0000 .0000
Pseudo r- squared .187 .023
Number of cases 4,332 4,376
Source: BUREAU OFJUSTICE STATIsTIcS, U.S. DEP'T OFJUSTICE, CIILJUSTICE SURVEY OF STATE COURTS, 1996(Inter-Univ. Consortium for Political and Soc. Research No. 2883, 2d ed. 2001)
Note: Dependent variable is whether a punitive damage aivard isas made. The sample is limited to cases wonat trial by plaintiffs. Models account for clustering at the county level and the stratified sampling pattern.
* p < .05** p< .01*** p< .001
HeinOnline -- 87 Cornell L. Rev. 760 2001-2002

JURIES, JUDGES, AND PUNITIVE DAMAGES
category variables and the litigant pair variables, the odds multiplier isthe amount by which the odds of a case having a punitive damagesaward should be multiplied compared to a reference category, hold-ing all other variables constant. For the case categories, Table 3 showsthat "products liability" is the reference category. An odds multiplierof 1.0 for a case category (the "other contract" category, for example,has an odds multiplier close to 1.0) indicates that, compared to prod-ucts liability cases, the case category does not change the odds of re-ceiving a punitive award. An odds multiplier greater than 1.0indicates case categories with chances of a punitive award that aregreater than the chances in products liability cases. An odds multi-plier of less than 1.0 indicates case categories with chances of a puni-tive award that are less than the chances in products liability cases.For example, Table 3 shows that the odds multiplier for motor vehicletort cases (0.131) is substantially less than 1.0 and thus that, comparedto the reference category (products liability), motor vehicle cases aremuch less likely to end with a punitive award. Similarly, the largeodds ratio for intentional tort cases (5.130) indicates that they are un-usually likely to have a punitive award.
The odds of a punitive damages award should be distinguishedfrom the probability of a punitive damages award, even though theterms "odds" and "probability" are often used interchangeably in in-formal conversation. For example, Table 3 shows that the intentionaltort case category has an odds multiplier of 5.130. Assume that theodds of a punitive damages award (based on all of the other factorsabout a case) are 1:1, corresponding to a 50% probability of a punitiveaward. The odds multiplier of 5.130 means that the classification ofthe case as one of intentional tort changes the odds of a punitive dam-ages award from 1:1 to 5.130:1, corresponding to a probability of puni-tive damages award of approximately 84%.58
The interpretation of the compensatory damages variable, whichis continuous, differs from the interpretation of the case category andlitigant pair variables, which are dichotomous. For the compensatorydamages variable, the odds multiplier represents the effect of a unitincrease in the variable. For example, an increase in the compensa-tory award (log) from 1.0 to 2.0 would require multiplying the odds ofa punitive award by 1.37. The second and fourth columns in Table 3
tained by taking the anti-log of the regression coefficient. HOSMER & LEMESHOW, supranote 48, at 50; J. Scorr LONG, REGRESSION MODELS FOR CATEGORICAL AND LiMrrD DEPEN-
DENT VARIABLE-S 79-82 (1997).58 This description of the marginal effect of case category is slightly oversimplified. In
the logistic model, the effect of a change in one variable on the dependent variable de-pends on the values of the other variables. LONG, supra note 57, at 82. For a set of "aver-age" values for the other variables, the presence of an intentional tort increases theprobability of a punitive damages award by 0.082.
2002]
HeinOnline -- 87 Cornell L. Rev. 761 2001-2002
CORNELL LAW REVIEW
show significance levels for each odds multiplier: the probability thatthe observed result would occur by chance.
In the full model, the juty trial dummy variable's odds multiplieris greater than one, but is not statistically significant. The effectchanges direction (from greater than one to less than one) in thesimpler of the two models. One cannot reject the hypothesis thatju-ries are no more likely than judges to award punitive damages. Theodds multiplier on the interaction term, consisting of the jury trialdummy variable and the compensatory award, is less than one and isstatistically significant in one model and of borderline statistical signif-icance in the simpler model. Thus,judges, more than juries, display atendency to award punitive damages as the stakes increase. 59
Table 3 confirms Table l's evidence that certain classes of triedcases-intentional tort, fraud, and employment cases-are morelikely than other classes of tried cases to lead to punitive awards. Theodds multipliers for these variables are all large and statistically signifi-cant. These results are similar to findings from the 1991-92 CTCNdata.60
Another noteworthy result in Table 3 is the absence of supportfor the belief that adjudicators are more likely to award punitive dam-ages against corporate defendants. The odds multiplier for the "indi-vidual only vs. corporation" dummy variable is less than 1.0.Compared to the reference category of cases involving "individualsonly vs. individuals only," plaintiffs are more likely to obtain punitiveawards against individual defendants than against corporate defend-
59 The special sampling characteristics of Harris County, Texas, supra note 19, led usto run Table 's full model with dummy variables for Harris County judge and jury trials.Each of the dummy variables is positive and significant, indicating that both Harris Countyjudges and juries are more likely to award punitive damages than the reference category,which consists of judge trials in other counties. Harris County judges are significantlymore likely to award punitive damages than Harris Countyjuries. In this model, both theinteraction term and the jury trial dummy variable become significant, but in oppositedirections. The jury trial dummy variable's coefficient is 1.002 and the jury trial dummycompensatory damages interaction term's coefficient is -0.154. This suggests that juriesare more likely to award punitive damages at the low end of compensatory awards, upthrough about $670,000, at which pointjudges become more likely to award punitive dam-ages. In a model that excludes the interaction term, the jury trial dummy variable is posi-tive, but not statistically significant.
60 Eisenberg et al., supra note 5, at 645 tbl.4. The low rate of punitive awards in cases
involving government defendants is consistent with the common rule that punitive dam-ages cannot be awarded against the government. See, e.g., ARiz. REv. STAT. ANN. § 12-820.04 (West 1992) (no punitive damages against public entity or employee); FLA. STAT.ANN. § 768.28(5) (West Supp. 2002) (government immune from punitive damages); HAv.REV. STAT. ANN. § 662-2 (Michie 1995) (same); IND. CODE ANN. § 34-13-3-4 (Michie 1998)(same); MINN. STAT. ANN. § 3.736(3) (West 1997) (same); id. § 466.04(1) (b) (West 2001)(no punitive damages against municipalities); Mo. REv. STAT. § 537.610(3) (2000) (no pu-nitive damages against state and its public entities); Wis. STAT. ANN. § 893.80(3) (WestSupp. 2001) (same). The data include some cases in which the government is a defendant,presumably because other parties also are defendants.
762 [Vol. 87:743
HeinOnline -- 87 Cornell L. Rev. 762 2001-2002
JURIES, JUDGES, AND PUNITIVE DAMAGES
ants, though the effect is not statistically significant. Because busi-nesses' concern focuses especially on juries' tendency to awardpunitive damages, we have run a model similar to the large model inTable 3, but adding an interaction term to explore the differencesbetween judges and juries. That model, not reported here, includesan interaction term equal to the product of the jury trial dummy varia-ble and the individual only vs. corporation dummy variable. The oddsmultiplier for the interaction term is less than one and is statisticallysignificant.61 Thus, compared to judges, our models suggest that, con-ditional on a case being tried, juries are significantly less likely thanjudges to award punitive damages in cases involving individual plain-tiffs and corporate defendants.
C. Interpreting the Results in Light of Other Recent Studies
The absence of significant difference between judge and jury de-cisions to award punitive damages is consistent with experimental evi-dence comparing groups of adjudicators. Researchers report finding"a remarkable consensus in the judgments of individual jurors, madeon a rating scale, about a series of personal injury cases."62 They alsoreport strong agreement among sets of juries when judging punish-ment63 and a strong correlation between the egregiousness of behav-ior and the decision to award punitive damages. 64 These experimentsdo not involve judges. Butjudges, like jurors, are people respondingto stimuli. If many individual judgments reflect a "remarkable consen-sus," some of that consensus ought to survive when the individualjudgments are those of judges. As Guthrie, Rachlinski, and Wistrichstate, 'Judges, it seems, are human. '65
Our results are less consistent with judgejury punitive damagesexperiments of Hastie and Viscusi. They report that mock jurors weremuch more likely than judges to impose punitive sanctions in a hypo-
61 Coefficient= -1.182; p= 0.011. The coefficient is -0.905 (corresponding to an oddsmultiplier of less than 1.0) and the significance level is 0.050 in a model that includesdummy variables for Harris County, Texas judge and jury trials. See supra note 19.
62 Schkade et al., supra note 1, at 1141; cf Wissler et al., supra note 3, at 815 (conclud-ing that, although high unpredictability exists when examining award patterns of individ-ual jurors, jurors as a group "produce considerably more stable and predictableoutcomes").
63 Schkade et al., supra note 1, at 1152 & tbl.3.64 See Michelle Chernikoff Anderson & RobertJ. MacCoun, Goal Conflict inJurorAssess-
ments of Compensatory and Punitive Damages, 23 LAw & Hum. BEHAV. 313, 326-28 (1999). Butsee Reid Hastie et al., JurorJudgments in Civil Cases: Effects of Plaintiffs Requests and Plaintiff'sIdentity on Punitive Damage Awards, 23 LAw & Hum. BEHAV. 445 (1999) (finding that mockjurors award punitive damages when courts found them unwarranted).
65 Guthrie et al., supra note 3, at 821; cf Richard A. Posner, What DoJudges andJusticesMaximize? (The Same Thing Everybody Else Does), 3 Sup. CT. ECON. REV. 1, 4 (1993) ("By treat-ingjudges andJustices as ordinary people, my approach makes them fit subjects for eco-nomic analysis; for economists have no theories of genius." (footnote omitted)).
2002]
HeinOnline -- 87 Cornell L. Rev. 763 2001-2002

thetical railroad accident case. 66 Similarly, in experiments involvingairplane repair scenarios, Viscusi reports evidence that 'Judges aremuch more willing than jurors ... to refrain from imposing punitivedamages."
67
Unlike the classic Kalven and Zeisel judge-jury study, these re-searchers did not study actual judges and juries. Kalven and Zeisel'squestionnaires to presiding judges in about 4,000 actual civil jury trialsin the 1950's yielded data showing a 78% agreement between judgeand jury on liability.68 In the cases of disagreement, there was a verysmall tendency of juries to favor plaintiffs.69 And the rate of agree-ment, although not 100%, is high compared to other humanendeavors.
70
The vast difference between experimental punitive damages re-sults and real case evidence of absence of disagreement betweenjudges and juries is worth addressing. It is theoretically possible thatreal-world judges and juries could so substantially agree on liability, asKalven and Zeisel found,7 ' and yet, as the recent experimental evi-dence might suggest, so massively disagree on the decision to awardpunitive damages.72 But experiments searching for substantial disa-greement between judges and juries on punitive damages might try toreplicate the real world rate of agreement between judges and juriesabout liability. Otherwise, a risk exists that the experiments' judge-jury difference in awarding punitive damages results from an experi-mental design that artificially inflates the differences.
66 Hastie & Viscusi, supra note 1, at 916; see also Viscusi, supra note 10, at 387-88
(finding that judges "perform better than jurors with respect to hindsight bias").67 W. Kip Viscusi, Jurors, Judges, and the Mistreatment of Risk by the Courts, 30 J. LEGAL
STUD. 107, 115 (2001) (comparing Hastie & Viscusi's mock jurors with judges).68 HARRY KALVEN, JR. & HANS ZEISEL, THE AMERICAN JURY 63-64 (Univ. of Chi. Press
1971) (1966).69 Id. at 64. The jury but not the judge found for the plaintiff in 12% of the cases,
while the jury but not the judge found for the defendant in 10% of the cases. See also HansZeisel, The AmericanJury, in THE AMERICAN JURY SYSTEM (FINAL REPORT) 65, 69-70 (AnnualChiefJustice Earl Warren Conference on Advocacy in the United States ed., 1977) (discuss-ing analysis ofjudge and jury disagreement); Marc Galanter, The CivilJury as Regulator of theLitigation Process, 1990 U. CHI. LEGAL F. 201, 204-05 (reporting more recent polls support-ing similar results).
70 As previous research has concluded:When compared to other human decisionmakers, the rate of agree-
ment is more impressive than it first appears. This 78% agreement rate isbetter than the rate of agreement between scientists doing peer review, em-ployment interviewers ranking applicants, and psychiatrists and physiciansdiagnosing patients, and almost as good as the 79% or 80% rate of agree-ment between judges making sentencing decisions in an experimental
setting.Clermont & Eisenberg, supra note 3, at 1153; see also Wissler et al, supra note 3, at 814 tbl.5(comparing reliability of various decisionmakers).
71 See supra note 68 and accompanying text.72 See supra notes 66-67 and accompanying text.
764 CORNELL LAW REVEW [Vol. 87:743
HeinOnline -- 87 Cornell L. Rev. 764 2001-2002

JURIES, JUDGES, AND PUNITIVE DAMAGES
Unlike Kalven and Zeisel's experiments, the recent experimentsdo not achieve substantial judge-jury agreement on liability. In an air-plane accident scenario, judges and mock jurors were asked whether afirm should undertake a repair that was constructed to be economi-cally inefficient. Judges and experimental jurors disagreed massivelyon this basic liability question, with nearly 90% of the jurors requiringrepair of the plane compared to less than 50% of the judges.73 Thevastjudgejury difference on liability in the new studies calls into ques-tion the experimental designs' ability to detect socially meaningful pu-nitive damages differences between judges and juries. If the Kalvenand Zeisel and other results74 are valid, the new experiments may em-ploy scenarios and assumptions that occur too rarely to be of socialsignificance.75 The airplane scenarios seem especially questionable asevidence exists that punitive awards are unusually rare in suchaccidents.
76
73 See Viscusi, supra note 67, at 113 tbl.4, 114 (comparing judges' and juries' results).74 "[C]onsiderable research indicates that juries are not substantially different from
judges." Clermont & Eisenberg, Appeals I, supra note 4, at 145; see also supra note 3 (citingexamples of such research). Indeed, "virtually no evidence exists to support the prevailingingrained intuitions aboutjuries"; instead "the evidence, such as it is, consistently supportsa view of the jury as generally unbiased and competent." Clermont & Eisenberg, supranote 3, at 1151-52.
75 Nevertheless the newer work would represent a useful addition to the study of dif-ferences between judges andjuries. Comments about why their findings differ from find-ings of adjudicator similarity may be helpful. First, the experiments may elicit greaterpunitive damages rates from jurors because the experimenters offer jurors only punitivedamages as a remedy. E.g., Hastie & Viscusi, supra note 1, at 905. A punitive award is theonly way for the jurors to express disapproval of behavior. Judges would more likely under-stand that the existence of a compensatory award already expresses disapproval of thebehavior.
Second, the experimental scenarios yielding massive judge-jury differences in willing-ness to award punitive damages do not represent real-world punitive damages cases. Incases before both judges and juries, over 50% of punitive awards are in cases involvingfraud, intentional tort, or employment matters. Products liability cases, which seem to bemost analogous to the airplane scenario, constitute a trivially small fraction of punitiveawards. See supra Table 1 and note 6. Railroad crossing cases are not numerous enough tobe accounted for in the CTCN data. See supra Table 1.
Third, the sample ofjudges used in the experiments is not representative. Thejudgeswere attendees at a law and economics program. Viscusi, supra note 67, at 109. Such agroup ofjudges seems more likely to respond based on economic efficiency than a randomsample ofjudges, especially to questions whose "right" answers depend on the ability andwillingness to engage in cost-benefit analysis. See Guthrie et al., supra note 3, at 818 n.201(noting problems with the sample in the Hastie and Viscusi studies).
76 SeeJAmAEs S. KAKALIK ET AL., COSTS AND COMPENSATION PAID IN AVIATION ACCIDENTLITIGATION 27 (1988) ("[Punitive damages were not paid on any of the 2,198 dosed [avia-tion accident] cases in our study; in two cases, they were awarded in trial but reversed onappeal.").
2002]
HeinOnline -- 87 Cornell L. Rev. 765 2001-2002
CORNELL LAW REVIEW
D. Selection Effect Considerations
A remaining issue is the need to account for the nonrandomrouting of cases between judges and juries. Interpreting empirical le-gal findings requires caution about accepting results at face valuewhere strong selection effects may be at work.77 Table 1 suggests thatjuries tend to adjudicate large-stakes cases, as measured by both com-pensatory and punitive damages. Federal data confirm this,78 as dostudies using jury verdict reporter data.79 This skewed routing of casesto juries cannot conclusively be proven from our data, which lack theex ante characteristics of the cases. But given perceptions about ju-rors' greater inclination to award punitive damages, one expects juriesto see a sample of cases biased in favor of strong candidates for puni-tive awards.8 0 Looked at differently, a study in which the higher-stakescases that are more prone to punitive damages are in fact beingrouted to judges would be more remarkable than any of our findings.
1. Selection Attributable to Case Routing Between Judge and Jury
The most realistic assumption is that what are perceived as high-stakes cases with punitive damages potential are more likely to berouted to juries than judges. If plaintiffs select juries for cases withhigh probabilities of punitive awards, Table 3 may overstate the differ-ences between judges' and juries' tendencies to award punitive dam-ages and could be interpreted as precluding rejection of thehypothesis that judges are more likely than juries to award punitivedamages. If judges saw the same group of high-punitive-probabilitycases that we believe juries see, a model similar to that depicted inTable 3 might reveal a greater tendency by judges to award punitivedamages. Table 's interaction term already suggests that judges aremore likely than juries to award punitive damages as compensatoryawards increase.8 '
Another possible routing effect relates to the perceived greaterreliability of judges compared to juries. Plaintiffs may regard judges
77 E.g., Kevin M. Clermont & Theodore Eisenberg, Do Case Outcomes Really Reveal Any-thing About the Legal System? Win Rates and Removal Jurisdiction, 83 CORNELL L. REv. 581,588-91 (1998).
78 Clermont & Eisenberg, supra note 3, at 1162-65. Conditional on plaintiff winning
at trial, separate logistic regressions of the mode of trial (jury or judge) for each casecategory yield positive coefficients on the compensatory award (log) level. The other ex-planatory variables used are dummy variables for the litigant characteristics.
79 KELso & KELso, supra note 6, at 21; Eric Helland & Alexander Tabarrok, RunawayJudges? Selection Effects and the Juy, 16 J.L. ECON. & ORG. 306, 323--24 (2000).
80 Cf Helland & Tabarrok, supra note 79, at 325-27 & tbl.4, app. A, at 330 (findingdifferences in samples of cases routed to judges and juries).
81 Separate logistic regression of judge-tried cases and jury-tried cases confirm thisfinding. The coefficient for compensatory damages (log) is noticeably higher in the judge-tried cases' regression.
[Vol. 87:743
HeinOnline -- 87 Cornell L. Rev. 766 2001-2002

JURIES, JUDGES, AND PUNITIVE DAMAGES
as more reliable, and thereby opt for trial before judges in theirstrongest cases on the merits. 82 Similarly, the plaintiff with a strongpunitive damages case may opt for a judge trial to avoid the less relia-ble jury because the jury might refuse to grant a punitive award in acase that merits an award. If such routing occurs, then one mightobserve judges awarding punitive damages at a greater rate than juriesand defendants opting for jury trials when the case for punitive dam-ages is weakest. Absent some affirmative evidence of such routing, weare skeptical that it systematically occurs. Perceptions that juries aremore likely to award punitive damages, and more likely to award morein punitive damages, are widespread.8 3 Indeed, until the CTCN datawere gathered, the surprisingly prominent role of judges in the puni-tive damages area was, we suspect, unknown. Systematically seekingthe reliable judge to obtain a punitive damages award, when judgesare not perceived as even awarding punitive damages, seems an un-likely effect. But we cannot eliminate this effect based on our data,and it could mask real judge-jury differences.
2. Selection Attributable to Case Settlement
Because juries are believed to be more unpredictable thanjudges, especially in high-award cases,84 defendants may choose to set-tie cases that have high probabilities of large punitive awards. It ismore difficult to account for this aspect of case selection.85 Trials incases in which jurors' propensity to award punitive damages is strong-est may never be observed. Juries are viewed as so much wilder thanjudges that they only rarely get to act in those cases in which theirbehavior would be expected to be wildest.8 6
82 See supra note 23. This effect, applied symmetrically to plaintiffs and defendants,should lead to all trials being jury trials because the party with the weaker case should optfor the adjudicator perceived to be less reliable. Yet we observe many judge trials, perhapsbecause parties differ in their evaluation of the merits of the same case.
83 Clermont & Eisenberg, supra note 3, at 1127-28.84 See Helland & Tabarrok, supra note 79, at 306-08.85 SeeThomas Koenig, The Shadow Effect of Punitive Damages on Settlements, 1998 Wis. L.
REv. 169, 171-72 (noting that debate has shifted to this "shadow effect," and finding thatfear of runaway damages is exaggerated); Herbert M. Kritzer & Frances Kahn Zemans, TheShadow of Punitives: An Unsuccessful Effort to Bring It into View, 1998 Wis. L. REv. 157, 157-59.
86 See, e.g., David Segal, Tag-Team Lawyers Make Businesses Blink, WASH. POST, Nov. 12,1999, at Al. Studies funded by industry or tort reform groups, which find evidence thatpunitive damages are often requested, conclude that the frequency of such requests posesa serious problem. See KELSO & Kmso, supra note 6, at 5 n.3;JoHN H. SuLLvAN, NEW STATEDATA CONFIRMS [sic) RUNAWAY ABUSE OF PUNITIVE DAMAGES (surveying incidence of puni-tive damage demands in various jurisdictions), http://www.cjac.org/research/puni-tivedamages.pdf (last visited Jan. 22, 2002). A study that followed up on the tallying ofclaims for punitive damages by studying whether awards were in fact obtained suggests theneed for caution in interpreting the effect of punitive damages claim rates. The studyfound that 3,763 of 25,561 (14.7%) tort cases filed in Georgia state courts from 1994 to1997 involved claims for punitive damages. These 3,763 cases yielded 15 punitive damages
2002]
HeinOnline -- 87 Cornell L. Rev. 767 2001-2002

CORNELL LAW REVIEW
The CTCN data's pattern should partially alleviate this concern.That judges award punitive damages as frequently as juries is surpris-ing and has implications for the dogma of juror bias. Because judgesaward punitive damages at rates similar to juries, the simplest descrip-tion of the data, admittedly ignoring case routing, is that juries andjudges behave similarly, as Kalven and Zeisel found. 7 Even if they donot behave similarly, jurors' shadow effect on settlements cannot bebased on the observed pattern of judge and jury trial outcomes. Thepresumed settlement behavior may be based on misperception. 88
Second, available data suggest that there is no hidden mountainof settlements involving punitive damages masking the ability of trialstudies to detect punitive damages' true effects. Karpoff and Lottstudied eleven years (1985-96) of lawsuits in which plaintiffs soughtpunitive damages from publicly traded businesses.89 They found thatsettlement amounts (including both punitive and nonpunitive dam-ages) constituted a near-trivial portion of awards paid, and that trialverdicts dwarfed settlements in both number and amount.90 Theyalso found no statistically significant abnormal stock returns and con-cluded that "the data from our sample do not support" the hypothesisthat settlements shaped by punitive damages comprise the main effectof punitive damages. 91
The CTCN data allow further study of the settlement effect, albeitnot as directly as the Karpoff-Lott study. The existence of statutorycaps on punitive damages in several states allows for an empirical testof the settlement aspect of case selection. In states that cap punitive
awards, with judges disproportionately making the awards, not juries. Eaton et al., supranote 5, at 1060, 1094. Sullivan, for example, reports high rates of claims for punitive dam-ages but does not report the resulting yield in actual punitive awards. See SULLIVAN, supra
87 See KALVEN & ZEISEL, supra note 68, at 63-64.88 If defendants are rational economic actors, knowledge of the sober pattern of puni-
tive awards should lead them to be less averse to pressing potentially damaging cases totrial. Punitive awards are rare; "bet-the-company" cases are also rare. The settlement selec-tion effect could affect some potentially large cases, but might not be expected to influ-ence the pattern observed in the mass of cases. Furthermore, plaintiffs may play ondefendants' fears ofjuries to increase their settlement demands to the point where defend-ants must strongly consider taking a chance on trial.
89 Karpoff & Lott, supra note 8, at 534-35.90 See id. at 537.91 Id. at 562. But serious doubts exist about the representativeness of the Karpoff-Lott
sample, and further study of this issue is warranted. Their data show 94 settlements and1,595 plaintiff verdicts. Id. at 538 tbl.2. This settlement-verdict ratio suggests that the vastmajority of plaintiff recoveries are via verdicts rather than settlements, which seems to con-tradict virtually every other study of civil litigation. In addition, their finding that 310 of352 products liability verdicts were for plaintiffs, see id., contradicts all other studies ofproducts liability litigation, as does their report that, across all lawsuit types, plaintiff ver-dicts were 85% of all verdicts. See id. Either suits seeking punitive damages against publiclytraded corporations are shockingly different from other lawsuits or some further explana-tion of their data is needed.
[Vol. 87:743
HeinOnline -- 87 Cornell L. Rev. 768 2001-2002

JURIES, JUDGES, AND PUNITIVE DAMAGES
awards, plaintiffs' threat to go to the jury should not intimidate de-fendants into settling nearly as much as in states that do not capawards. If defendants are only gambling against a punitive award oftwo or three times the compensatory award-the typical cap-thepressure to avoid the jury substantially diminishes. Therefore, instates that cap punitive awards we might expect defendants to press tojury trial potential punitive cases that they would settle in states with-out caps. The percentage of jury trials ending in punitive awards in-creases, but defendants know that the punitive award is substantiallyless likely to bankrupt them because of the caps. If defendants settleenough cases to call into question the implications of studies limitedto trials, this effect should be substantial. 92
To explore this possibility, we introduce a dummy variable equalto one in states that cap punitive awards. The CTCN sample includescounties in twenty-one states, and several of these states cap punitiveawards.93 Connecticut, Florida, Georgia, Illinois, Indiana, Texas, andVirginia did so for all or part of the period covered by the CTCN
92 For a model of the effect of caps on awards on settlement rates, see Linda Babcock
& Greg Pogarsky, Damage Caps and Settlement: A Behavioral Approach, 28J. LEGAL STUD. 341,368 (1999). The authors report experimental evidence that a cap on damages has a posi-tive and marginally significant effect on settlement rates. Id. The caps they assess differfrom punitive damages caps because punitive damages caps do not cap the total award.The compensatory award is still unlimited in most states in most classes of cases. The riskaverseness of defendants who settle rather than take a chance before a jury without a capon punitive awards suggests that imposing a punitive cap could promote trial rather thansettlement of cases with large potential punitive awards. One study reports experimentalevidence that capping punitive damages awards causes jurors to inflate compensatoryawards and summarizes other studies on the subject. Edith Greene et al., The Effects ofLimiting Punitive Damage Awards, 25 LAw & HUM. BEHAV. 217 (2001).
93 E.g., CONN. GEN. STAT. ANN. § 52-240b (West 1991) (capping punitive damages attwice compensatory damages in products liability cases); FLA. STAT. ANN. § 768.73(1) (WestSupp. 2001) (generally capping punitive damages at three times compensatory damages);GA. CODE ANN. § 51-12-5.1(g) (2000) (capping punitive damages at $250,000 in some tortactions); IND. CODE ANN. § 34-51-3-4 (Michie 1998) (capping punitive damages at thegreater of three times the amount of compensatory damages or $50,000); N.J. STAT. ANN.§ 2A.15-5.14 (West 2000) (capping punitive damages at five times the amount of compen-satory damages or $350,000, whichever is greater); TEx. Civ. PRAc. & REM. CODE ANN.§ 41.008 (Vernon 1997) (capping punitive damages at two times the amount of economicdamages plus the greater of either $200,000 or an amount equal to any noneconomicdamages found by the jury, not to exceed $750,000); VA. CODE ANN. § 8.01-38.1 (Michie2000) (capping punitive damages at $350,000).
Illinois capped punitive damages at three times compensatory for other than "healingart or legal malpractice cases." 735 ILL. CmP. STAT. ANN. 5/2-1115.05(a) (West Supp.2001). But the provision, which wvas effective March 9, 1995, was invalidated when theentire act of which it was a part was struck down on state constitutional grounds in Best v.Taylor Machine Works, 689 N.E.2d 1057 (Ill. 1997). Ohio capped punitive damages as of
January 27, 1997, but the provision was struck down by the Ohio Supreme Court. State exrel Ohio Acad. of Trial Lawyers v. Sheward, 715 N.E.2d 1062, 1090-91 (Ohio 1999).
2002] 769
HeinOnline -- 87 Cornell L. Rev. 769 2001-2002

CORNELL LAW REVIEW
sample.94 We set the dummy variable equal to one for cases decidedat a time when state law imposed caps on punitive awards.
Strong settlement selection effects may exist if this dummy varia-ble correlates with punitive damages award frequency in jury trials.Table 4, however, shows that this is not the case. Limiting the sampleto jury trials won by plaintiffs, Table 4 shows that the punitive awardrate was lower in states with caps than in states without caps. If oneincludes jury trials won by defendants, the rates of punitive awards incapping states remain lower. Regression analysis of jury trial punitiveawards using models similar to those in Table 3 yields insignificantresults for the capping dummy variable. We thus find no evidencethat caps which reduce the risk of ruinous punitive damages liabilityaffect the rate of punitive awards in jury-tried cases. 95
There are, of course, other possible explanations for the absenceof effect. Capping and noncapping states might differ in ways thatour models do not capture. Studying punitive award patterns withincapping states before and after enactment of punitive award capsmight be revealing.96
94 Connecticut, Georgia, Indiana, and Virginia capped punitive damages throughoutthe period covered by the CTCN sample. See supra note 93. Texas enacted meaningfulcaps during the period, see supra note 93, so not all Texas sample cases are subject to caps.Texas earlier capped punitive damages at the greater of four times the compensatoryaward or $200,000, but excepted intentional torts and malicious behavior. 1987 Tex. Gen.Laws ch. 2, § 2.12. This earlier cap affected one Harris County, Texas jury trial in oursample, see Verdict Reduced, supra note 44, but the uncapped amount is used in the data.Florida changed the way it capped during the sample period. We have repeated our analy-sis excluding Florida cases with no material change in results. New Jersey enacted capseffective for cases filed after October 27, 1995, see supra note 93, too late in the CTCNperiod to materially affect results. Illinois imposed caps early in 1995 but they were invali-dated in 1997, see supra note 93, and defendants might not yet have come to rely on themto a degree sufficient to affect results. We have repeated the analysis treating Illinois as anuncapped state without material effect on the results.
95 We do find a positive, significant correlation between the existence of caps andpunitive awards in judge-tried cases. However, this effect is not robust to the exclusion ofHarris County, Texas. See supra note 19. The insignificance of the jury trial effect is notsensitive to inclusion of Harris County. The increasing use of statutory caps on punitivedamages awards raises the question whether a variable should account for the existence ofcaps. Except for an earlier capping statute that later affected a Texas award, see supra notes44, 94, all of the capping systems in the states studied here either took effect after thedecisions were rendered or imposed limits that were not reached in any case subject tothem. Thus, the caps did not directly affect punitive award levels even if they might haveaffected settlement behavior. Knowledge of a cap, however, might affect an adjudicatorwho knows of its existence even if an award does not exceed the cap. See Greene et al.,supra note 92; Hastie et al., supra note 64.
96 See Albert Yoon, Damage Caps and Civil Litigation: An Empirical Study of Medical Mal-practice Litigation in the South, 3 Am. L. & ECON. REv. 199 (2001) (studying the effect ofAlabama's cap on medical malpractice awards).
[Vol. 87:743
HeinOnline -- 87 Cornell L. Rev. 770 2001-2002

JURIES, JUDGES, AND PUNITIVE DAMAGES
TABLE 4: PUNITIVE AWARD FREQUENCYBY STATES' CAPPING STATUS (JuRYTRIALS ONLY)
Lury Trials Won by Plaintiffs All Jury Trials
No Punitive Punitive No Punitive PunitiveAward Award Award Award
States without caps 1,996 (95.73%) 89 (4.27%) 4,456 (98.04%) 89 (1.96%)States with caps 924 (96.65%) 32 (3.35%) 1,853 (98.30%) 26 (1.70%)
Significance of .228 .484difference inpunitive awardrates
Source: BUREAU OFJUSTICE STATISTICS, U.S. DEP'T OFJUSTICE, CMLJUSTICE SURVEY OF STATE COURTS, 1996(Inter-Univ. Consortium for Political and Soc. Research No. 2883, 2d ed. 2001)
'iiTHE RELATION BETWEEN PuNITIVE DAMAGES AND
COMPENSATORY DAMAGES
This Part shifts the focus from the decision to award punitivedamages and studies instead the level of punitive damages, given apunitive award. All studies confirm that juries' punitive damagesawards correlate strongly with compensatory awards.97 We now fur-ther assess Figure l's indication that a similar relation exists in casestried by judges, and Figure 2's and Table 2's indications that the puni-tive-compensatory ratio does not vary between judge and jury trials.
A. Modeling the Level of Punitive Damages Awards
Given a decision to award punitive damages, what should deter-mine their level? Previous work outlines a model in which the mostimportant influences on the punitive award level are the harm caused,the egregiousness of the misbehavior, and the amount needed to ac-complish the goals of punishment or deterrence. 98 We therefore dis-cuss the model only briefly here.
The punishment meted out in a punitive award ought to relate tothe harm the defendant caused. We tend to regard behavior as worsewhen it causes more damage. The compensatory component of thedamages award is a measure of the harm the defendant has caused.Thus, punitive damages ought to correlate positively with compensa-tory damages. 99 We therefore include the compensatory award level(log) in our model of punitive damages.
The punishment-deterrent rationale underlying punitive awardssuggests that the level of punitive award ought to relate to the defen-
97 See Eisenberg et al., supra note 5, at 650-51.98 See id. at 637-40.99 This harm-measuring use of compensatory damages in setting a punitive award is
distinct from the use of compensatory damages to compensate victims. Id. at 639.
2002]
HeinOnline -- 87 Cornell L. Rev. 771 2001-2002

CORNELL LAW REVIEW
dant's financial circumstances, 10 0 though the theoretical soundness ofconsidering defendants' wealth is debated in the law and economicsliterature. We found evidence of this effect in the 1991-92 CTCNdata.1 1 We therefore include dummy variables representing the liti-gant pairs summarized in Table 1 in the punitive damages model.
Independent of the harm caused, the defendant's degree of mis-behavior ought to influence the punitive award level. Table 3 showsthat case categories are useful proxies for punishable behavior. Fraudand intentional tort, which correlate positively with the decision toaward punitive damages, represent intentional misbehavior. Given adecision to award punitive damages, however, a case's subject areashould become less relevant to the award level. 10 2 "Intentional oregregious wrongdoers are more serious wrongdoers whether they pro-duce products, publish newspapers, harm patients, or defraud con-tractual partners. They are united more by the nature of theirwrongdoing than by the subject area of their wrong."' 0 3 We thus ex-pect, as found in the 1991-92 CTCN data, the subject matter of a caseto play less of a role in explaining the size of punitive damages awardsthan it plays in explaining the decision to award punitive damages.
To these previously studied influences on punitive awards, we addvariables to represent the adjudicator. As in our decision-to-awardmodels, ajury trial dummy variable assesses whether the intercept forpunitive awards changes in jury trials compared to judge trials. Aninteraction term between the jury trial dummy variable and the com-pensatory award (log) assesses whether the slope of the punitive-com-pensatory line changes in jury trials compared to judge trials. Thedirection and significance of the coefficients for these variables are ofprimary interest here.
B. Results
Table 5's first numerical column reports the results of the abovemodel, in which the punitive award (log) is the dependent variable ina sample of 171 cases in which plaintiffs won a nonzero punitive awardat trial.'0 4 This model includes all the variables and shows a strong,significant correlation between the compensatory award and the puni-
100 See id. at 639-40.l1 See id. at 648 tbl.5.102 Id. at 630.103 Id.104 Table 5 excludes three punitive damages cases in which the compensatory award
was zero. For discussion of punitive awards in cases with zero or nominal damages awards,see Eisenberg et al., supra note 5, at 629-30. For a notable such case, see Tronzo v. Biomet,Inc., 236 F.3d 1342 (Fed. Cir. 2001), a patent infringement case that, after a remand andpartial reversal on appeal, resulted in a $20 million punitive award and a $526 compensa-tory award.
[Vol. 87:743
HeinOnline -- 87 Cornell L. Rev. 772 2001-2002

JURES, JUDGES, AND PUNITVE DAMAGES
tive award. As was the case for the 1991-92 CTCN data,10 5 the com-pensatory award is the most powerful predictor of the punitive award.The compensatory award alone explains about half the variance in thepunitive award. If the compensatory award is a rational measure ofharm caused-and evidence exists to suggest that it is' 06-one canalso use the compensatory award to partly control for differencesacross judge-jury cases, especially the greater tendency of higherstakes cases to go to juries. 10 7
Table 5's third model changes the dependent variable from thepunitive award (log) to the ratio of the punitive and compensatoryaward (logs), as described in Table 2 and Figure 2. From one perspec-tive, this is the variable of primary interest. Holding other factors con-stant, do judges and juries differ in the amount of punitive damagesawarded per unit of compensatory damages? Except for the changein the dependent variable, the third model is the same as the firstmodel. The litigant pair categories and case categories, reported inthe Appendix, 08 behave about the same as in the first model. Themodel's explanatory power is substantially lower because the punitive-compensatory ratio is so unvarying. 109
The two jury trial variables are not statistically significant. In thefirst model, the jury trial dummy variable is negative and statisticallyinsignificant. 10 The interaction term is positive but also statisticallyinsignificant."' None of the models support the hypothesis that
105 Eisenberg et al., supra note 5, at 648 tbl.5.106 See Merritt & Barry, supra note 6, at 364-65; Frank A. Sloan & Chee Ruey Hsieh,
Variability in Medical Malpractice Payments: Is the Compensation Fair?, 24 LAw & Soc'y Rzv. 997,1025 (1990); Vidmar, supra note 3, at 868-70.
107 Other variables, reported in Appendix Table 2, yield results generally similar to
those in the 1991-92 data but with some differences worth noting. The coefficient on thedummy variable "individual only vs. corporation" is positive, as was the most analogousvariable in the 1991-92 data, and their 95% confidence intervals overlap. Eisenberg et al.,supra note 5, at 648 tbl.5. But the effect is statistically significant in the 1991-92 data and isnot statistically significant in the 1996 data.
Case category effects initially appear to be stronger in the 1996 data than in the1991-92 data, as evidenced by significant differences between the reference case category,products liability, and many other case categories. But using products liability as the refer-ence category tends to overstate the importance of case category effects because it has onlyone punitive award, and that award is relatively high. Using motor vehicle tort, a moremiddle-of-the-road case category with respect to punitive award levels, shows that onlyproducts liability cases, which are higher, and slander/libel cases, which are lower, differ atthe 0.05 level from motor vehicle cases. A Bonferroni correction to the test of the hypothe-sis that all case category coefficients are jointly zero yields p=0.175. SeeJAoN C. Hsu, MuL-TIPLE COMPAMSONS: THEORY AND METHODS 175-80 (1996) (discussing abuses in multiplecomparisons). Case category remains a weak force in explaining the level of punitiveawards.
108 See infra Appendix Table 2.109 See supra Table 2.110 p=0.726.
111 p=0.918.
20021
HeinOnline -- 87 Cornell L. Rev. 773 2001-2002

CORNELL LAW REVIEW
TABLE 5: REGRESSION MODELS OF PUNITIvE DAMAGES LEVELS
Dependent VariableVariable Punitive Punitive Punitive-
Damages Damages Compensatory(log) (log) Ratio (logs)
Compensatory damages (log) 0.854*** 0.883*** 0.002
(0.144) (0.096) (0.019)
Jury trial dummy -0.360 -0.240 0.036
(1.047) (0.959) (0.126)
Jury trial x log of compensatory 0.029 0.056 -0.014
(0.225) (0.198) (0.026)Model significance .0030 .0000 .0022
r-squared .621 .523 .196
Number of cases 171 173 171Source: BUREAU OFJUSTICE STATISTICS, U.S. DEP'T OFJUSTICE, CIVILJUTICE SURVEY OF STATE COURTS, 1996
(Inter-Univ. Consortium for Political and Soc. Research No. 2883, 2d ed. 2001)Note: Models account for clustering at the county level and the stratified sampling pattern. Robust standard
errors are in parentheses. Plaintiff/defendant status dummy variables and case category dummy variables,included in the first and third models, are reported in Appendix Table 2.
* p < .05** p < .01*** p< .001
judges and juries differ in the way they set levels of punitive awards orin the amount of punitive damages awarded per unit of compensatorydamages. The other variables in the fuller model-compensatoryaward, case category dummies, and litigant pair dummies-providesubstantial control for the known principal differences between casesrouted, to juries and judges. That is, judges and juries are known tosee cases with different stakes and with different distributions of casecategories.1 12 The insignificance of thejudgejury differences surviveswhen we account for selectivity and is not sensitive to inclusion of Har-ris County, Texas.113
C. The Greater Spread in the Jury Regression Models
The preceding section addresses the question whether there is amean effect between judges and juries. The regressions assume that
112 See supra notes 21-23, 51-52 and accompanying text.113 See supra note 19 and accompanying text. We accounted for selectivity by using two
Heckman models in which the decision to award punitive damages is estimated jointly withthe level of damages for those cases in which punitive damages are awarded. In both mod-els the selection equation included the jury trial dummy variable, the compensatory award,the litigant pair dummy variables, and the case category dummy variables. In both modelswe accounted for county-level clustering and for the sampling pattern used. In one model,the punitive award level equation used the jury trial dummy variable, the interaction term,the compensatory award, and the litigant pair dummy variables. In the second model, thepunitive award level equation included the case category dummy variables instead of thelitigant pair dummy variables.
774 [Vol. 87:743
HeinOnline -- 87 Cornell L. Rev. 774 2001-2002

JURIES, JUDGES, AND PUNITIVE DAMAGES
the variability in the judge and jury regression models is the same.This section considers how juries and judges differ not in their meanbehavior, but in their variability.
We study variability by analyzing the residuals of Table 5's two fullregression models, those reported in the table's first and third numer-ical columns. Experimental research suggests that the regressionmodels should be less able to 'explain jury awards than judgeawvards. 114 This weaker explanatory power should manifest itself ingreater departures from the predicted regression values. Residualsmeasure the difference between predicted values and observed valuesof a regression model, and should be higher in jury-tried cases. Be-cause we are interested in both larger positive and larger negativeresiduals, and residuals have a mean equal to zero, we analyze theabsolute value of the residuals.
Table 6 presents the results. For Table 5's first model, the residu-als injury-tried cases are substantially and significantly higher than theresiduals in judge-tried cases. This is consistent with Figure l's scatter-plot, which shows more jurytried cases than judge-tried cases are dis-tant from the best-fitting regression line, and which explains more ofthe variance in judge-tried cases than jury-tried cases. 115 It is also con-sistent with studies finding greater variability in jury awards. 116 Butthe significance of the difference in residuals is sensitive to the inclu-sion of Harris County, Texas, the county with the least complete sam-ple of trials.117 Excluding that county leaves the mean and mediandifferences injudgejury residuals far from significant.118 In Table 5'sthird model, which uses the punitive-compensatory ratio as the depen-dent variable, differences between judge and jury residuals are at mostmarginally significant, even with the inclusion of Harris County. Thestatistically insignificant, or marginally significant, spread is consistentwith Figure 2 and Table 2's analysis of the punitive-compensatory ra-tio. Jury punitive-compensatory ratios are more spread out than judgeratios but not dramatically so.
Because the hypothesis we explore is the absence of meaningfuljudge-jury differences, conservative data analysis counsels us to em-phasize the model that maximizes.the differences. That is, to include
114 See Wissler et al., supra note 3, at 783-87.115 See supra note 35.116 Wissler et al., supra note 3, at 783-87. For debate and evidence about whether the
group deliberating process ofjuries will increase or decrease aivards, and increase or de-crease their variability, see Shari Seidman Diamond et al.,JurorJudgments About Liability andDamages: Sources of Variability and Ways to Increase Consistency, 48 DEPAUL L. REv. 301 (1998);Guthrie et al., supra note 3, at 827; Stephan Landsman et al., Be Careful What You Wish For:The Paradoxical Effects of Bifurcating Claims for Punitive Damages, 1998 Wis. L. REv. 297,322-23; Schkade et al., supra note 1; and Wissler et al., supra note 3, at 801-04.
117 See supra note 19 and accompanying text.118 p=0.567 (mean) and p=0.355 (median).
7752002]
HeinOnline -- 87 Cornell L. Rev. 775 2001-2002

CORNELL LAW REVIEW
TABLE 6: ANALYSIS OF ABSOLUTE VALUE OF RESIDUALS
FROM REGRESSIONS REPORTED IN TABLE 5
Number ofTrial Mode Mean Median Nases
Cases
A. Dependent variable=punitive damages (log)
Judge trial 0.870 0.626 53
Jury trial 1.347 1.023 118
Significance ofjudge-jury difference .032 .024
B. Dependent variable=punitive/compensatory ratio (logs)
Judge trial 0.095 0.065 53
Jury trial 0.126 0.091 118
Significance ofjudgejury difference .171 .091
Source: BUREAU OFJUSTICE STATISTICS, U.S. DEP'T OFJUSTICE, CIVILJUSTICE SURVEY OF STATE COURTS, 1996(Inter-Univ. Consortium for Political and Soc. Research No. 2883, 2d ed. 2001)
Note: The significance of means difference is based on a t-test; the significance of medians difference is basedon a Mann-Whitney test.
Harris County and to use the model with punitive damages (log) asthe dependent variable instead of the ratio-based model. In additionto analyzing judge-jury differences using residuals, one can explorehow many jury trial punitive damages awards are beyond what judgesmight have awarded. Jury trials within the expected range of judgeawards cannot be viewed as serious impediments to financial plan-ning. Ifjudges gave all punitive awards, defendants would still have toplan on awards in this range.
How many jury punitive awards could be considered, with tradi-tional statistical certainty, to be beyond the range of likely awards injudge-tried cases? To answer this question we calculate how many juryawards fall within the 95% prediction band of the judge awards. Fig-ure 3 explores this topic through the same scatterplot as Figure 1, butwith two new lines superimposed on the data. The central line in thefigure is the regression line that best fits the data in judge-tried cases.The lines above and below that line, labeled "Upper 95% predictionline" and "Lower 95% prediction line," respectively, are the upper andlower 95% prediction lines for judge-tried cases. These lines providea way to identify punitive awards by juries or judges that bear an ex-treme relation to compensatory awards.119 Scatterplot points abovethe upper 95% line are extreme in the sense that they represent puni-tive awards that are above the judge-tried case upper 95% predictionline. Scatterplot points below the lower 95% line are extreme in thesense that they represent punitive awards that are below the judge-tried case lower 95% prediction line.
119 See Eisenberg & Wells, Predictability on Appeal supra note 8, at 61, 81.
[Vol. 87:743
HeinOnline -- 87 Cornell L. Rev. 776 2001-2002

JURIES, JUDGES, AND PUNITIVE DAMAGES
~j Up er 95%100000 iction line
10000-
1000CB
cn J. 100 Bl BJ B
J ,wr 95% prediction line1B
BJ JJ
0 B1010 1B0 100 0000 10000Compensatory (thousands)
FIGURE 3. Punitive and compensatory damages by judge or trial status. The scatterplotreproduces the scatterplot in Figure 1. The lines summarize the relation between punitiveand compensatory damages in judge trials. The top and bottom lines represent the upperand lower 95 percent prediction bands for the relation between punitive and compensa-tory awards in judge trials only. The center line represents the best-fitting regression linefor judge trials only.
The figure shows seven cases above the upper 95% predictionline. Six of those cases are jury trials and one is a judge trial.'20 Thefigure also shows that seven awards are extremely low in that they fallbelow the lower 95% prediction line. Five of these are jury trials and
two are judge trials. We combine the high and low outlying groups toconsider whether jury trials are more likely than judge trials to pro-duce extremely high or low awards. Three of 53 judge awards areeither high or low compared to 11 of 118 jury awards. This differenceis not statistically significant.' 2 ' We cannot reject the hypothesis thatjury-tried cases are no more likely than judge-tried cases to lead to anextreme award, as measured by the mass of judge-tried cases.
But even these differences in award patterns overstate the differ-ence between judge and jury awards that one should expect to surviveappeal. All but one of the cases that fall above the upper 95% predic-tion line have punitive awards that exceed ten times the compensatoryaward. Most such awards are known to have been justifiable or re-
120 Note that three of the high punitive awards occupy the extremely low end of thecompensatory award range. One does not expect a strong correlation between punitiveand compensatory awards in that range. Supra note 104.
121 p=0.553.
2002]
HeinOnline -- 87 Cornell L. Rev. 777 2001-2002

CORNELL LAW REVIEW
duced. 122 A study that successfully explains appellate outcomes in pu-nitive award cases shows that such awards are unlikely to surviveappellate review.123 After the appellate process, we would expect notmore than about one or two awards above the upper 95% predictionline to survive.
So in one year of data covering a substantial fraction of the na-tion's litigation, in the model that most emphasizes judgejury differ-ence, we find trivially few cases with punitive-compensatory ratiosgreater than ten, and some of these are not extreme given theirfacts. 124 We expect a small handful of juries' punitive awards to sur-vive appeal that exceed the range of whatjudges might have awarded.The greater spread in jury awards thus produces few outcomes thatare beyond what one expects had all cases been tried to judges. Sub-stantial reform to ameliorate such awards may be a solution in searchof a problem. To the extent there is a problem, a cap on punitivedamages of ten times the compensatory award would solve it.125
D. Selection Effect Considerations
Accounting for what we know about case selection suggests evengreater similarity in judge-jury decisionmaking. Case routing betweenjudges and juries based on expected compensatory award size almostcertainly exists. 126 Juries tend to see high-award cases, and the greateraward potential of these cases creates greater potential variance.Thus, greater variability in the jury punitive-compensatory relation isto be expected. The difference in spread may result from differences
122 Supra notes 42-45 and accompanying text.123 Eisenberg & Wells, Predictability on Appeal, supra note 8, at 80-83. More generally,
appellate courts are especially likely to reverse jury trial verdicts for plaintiffs. See Clermont& Eisenberg, Appeals I, supra note 4, at 141-44; Clermont & Eisenberg, Appeals II, supranote 4, at 2.
124 See, e.g., supra note 42 and accompanying text.125 Jury critics fail to address another method to reduce variance in punitive awards.
Floors as well as caps reduce variability. With respect to low-end punitive-compensatoryratios, a system of minimum punitive damages awards would decrease variability. For ex-ample, a system that requires punitive awards to at least equal compensatory awards wouldreduce the variance in punitive award patterns. Critics' failure to propose floors suggeststhat reducing variability may be less of a goal than reducing high awards. Imposing asystem of floors has a cost, namely, the loss of the ability to show mercy in punishing byimposing a low punitive award. This practice may be expected when the wrongdoer is in aprecarious financial condition. The level of corporate criminal fines is significantly andnegatively correlated with corporate-defendant bankruptcy. Cindy R. Alexander et al., Reg-ulating Corporate Criminal Sanctions: Federal Guidelines and the Sentencing of Public Firms, 42 J.L.& ECON. 393, 412 tbl.5 (1999). We may have to tolerate a tradeoff between allowing mercyand increased variability. See Stephen P. Garvey, "As the Gentle Rain from Heaven": Mercy inCapital Sentencing, 81 CORNELL L. REv. 989, 991-92 (1996).
126 See supra Part II.D. Such routing is consistent with the finding that high-stakes casestend to go to juries. Clermont & Eisenberg, supra note 3, at 1164-65; Helland & Tabarrok,supra note 79, at 323-25.
[Vol. 87:743
HeinOnline -- 87 Cornell L. Rev. 778 2001-2002
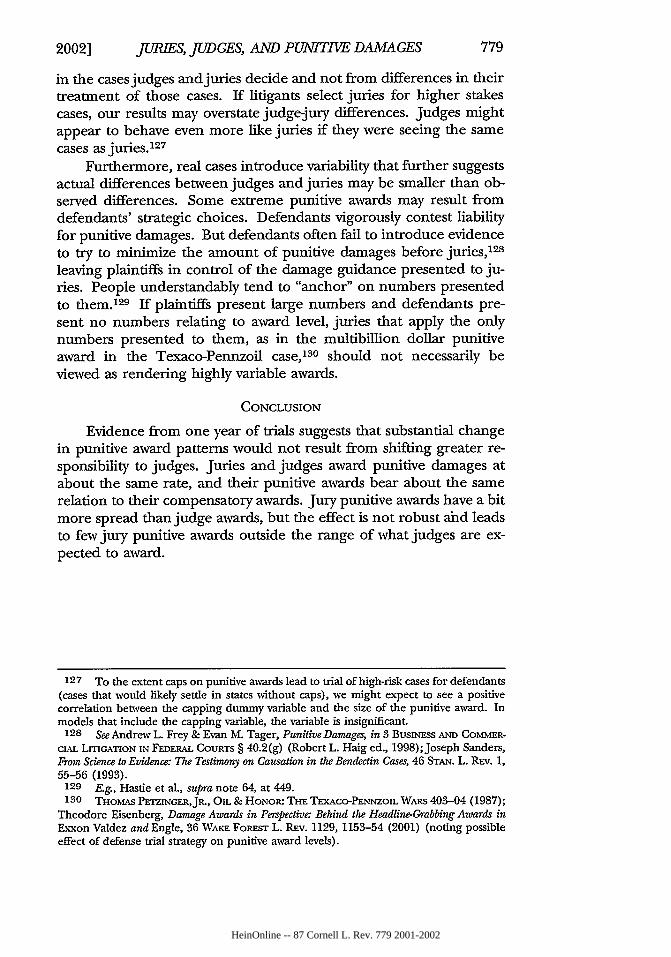
JUR1ES, JUDGES, AND PUNITIVE DAMAGES
in the cases judges and juries decide and not from differences in theirtreatment of those cases. If litigants select juries for higher stakescases, our results may overstate judgejury differences. Judges mightappear to behave even more like juries if they were seeing the samecases as juries.' 27
Furthermore, real cases introduce variability that further suggestsactual differences between judges and juries may be smaller than ob-served differences. Some extreme punitive awards may result fromdefendants' strategic choices. Defendants vigorously contest liabilityfor punitive damages. But defendants often fail to introduce evidenceto try to minimize the amount of punitive damages before juries, 28
leaving plaintiffs in control of the damage guidance presented to ju-ries. People understandably tend to "anchor" on numbers presentedto them. 129 If plaintiffs present large numbers and defendants pre-sent no numbers relating to award level, juries that apply the onlynumbers presented to them, as in the multibillion dollar punitiveaward in the Texaco-Pennzoil case,'8 0 should not necessarily beviewed as rendering highly variable awards.
CONCLUSION
Evidence from one year of trials suggests that substantial changein punitive award patterns would not result from shifting greater re-sponsibility to judges. Juries and judges award punitive damages atabout the same rate, and their punitive awards bear about the samerelation to their compensatory awards. Jury punitive awards have a bitmore spread than judge awards, but the effect is not robust ahd leadsto few jury punitive awards outside the range of what judges are ex-pected to award.
127 To the extent caps on punitive awards lead to trial of high-risk cases for defendants
(cases that would likely settle in states without caps), we might expect to see a positivecorrelation between the capping dummy variable and the size of the punitive award. Inmodels that include the capping variable, the variable is insignificant.
128 See Andrew L. Frey & Evan M. Tager, Punitive Damages, in 3 BUSINESS AND COMMER-CiAL LITIGATION IN FEDERAL COURTS § 40.2(g) (Robert L. Haig ed., 1998);Joseph Sanders,From Science to Evidence: The Testimony on Causation in the Bendectin Cases, 46 STAN. L. RFv. 1,55-56 (1993).
129 E.g., Hastie et al., supra note 64, at 449.130 THOMAS PETZINGER,JR., OIL & HONOR: THE TEXACO-PENNZOIL WARS 403-04 (1987);
Theodore Eisenberg, Damage Awards in Perspective: Behind the Headline-Grabbing Awards inExxon Valdez and Engle, 36 WArE FoREsr L. REv. 1129, 1153-54 (2001) (noting possibleeffect of defense trial strategy on punitive award levels).
20021
HeinOnline -- 87 Cornell L. Rev. 779 2001-2002
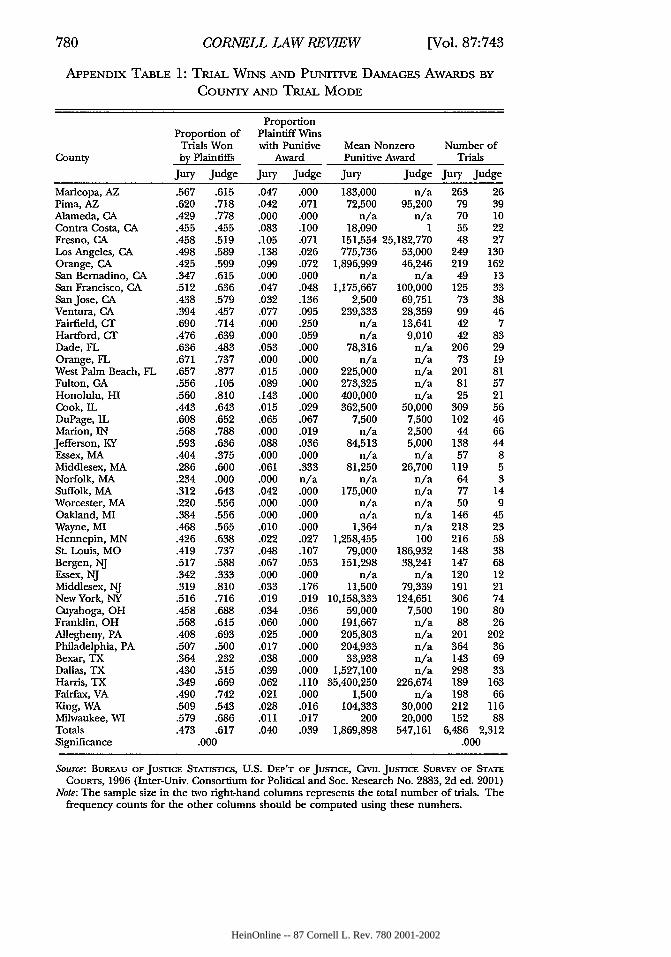
CORNELL LAW REVIEW [Vol. 87:743
APPENDIX TABLE 1: TRIAL WINS AND PUNITIVE DAMAGES AWARDS BY
COUNTY AND TRIAL MODE
ProportionProportion of Plaintiff WinsTrials Won with Punitive Mean Nonzero Number of
County by Plaintiffs Award Punitive Award Trials
Jury Judge Jury Judge Jury Judge Jury Judge
Maricopa, AZPima, AZAlameda, CAContra Costa, CAFresno, CALos Angeles, CAOrange, CASan Bemadino, CASan Francisco, CASan Jose, CAVentura, CAFairfield, CTHartford, CrDade, FLOrange, FLWest Palm Beach, FLFulton, GAHonolulu, HICook, ILDuPage, ILMarion, INJefferson, KYEssex, MAMiddlesex, MANorfolk, MASuffolk, MAWorcester, MAOakland, MIWayne, MIHennepin, MNSt. Louis, MOBergen, NJEssex, NJMiddlesex, NJNew York, NYCuyahoga, OHFranklin, OHAllegheny, PAPhiladelphia, PABexar, TXDallas, TXHarris, TXFairfax, VAKing, WAMilwaukee, WITotalsSignificance
.567 .615
.620 .718
.429 .778
.455 .455
.458 .519
.498 .589
.425 .599
.347 .615.512 .636.438 .579.394 .457.690 .714.476 .639.636 .483.671 .737.657 .877.556 .105.560 .810.443 .643.608 .652.568 .788.593 .636.404 .375.286 .600.234 .000.312 .643.220 .556.384 .556.468 .565.426 .638.419 .737.517 .588.342 .333.319 .810.516 .716.458 .688.568 .615.408 .693.507 .500.364 .232.430 .515.349 .669.490 .742.509 .543.579 .686.473 .617
.000
.047 .000 183,000 n/a 263 26
.042 .071 72,500 95,200 79 39
.000 .000 n/a n/a 70 10
.083 .100 18,090 1 55 22
.105 .071 151,554 25,182,770 48 27
.138 .026 775,736 53,000 249 130
.099 .072 1,896,999 46,246 219 162
.000 .000 n/a n/a 49 13
.047 .048 1,175,667 100,000 125 33.032 .136 2,500 69,751 73 38.077 .095 239,333 28,359 99 46.000 .250 n/a 13,641 42 7.000 .059 n/a 9,010 42 83.053 .000 78,316 n/a 206 29.000 .000 n/a n/a 73 19.015 .000 225,000 n/a 201 81.089 .000 273,325 n/a 81 57.143 .000 400,000 n/a 25 21.015 .029 362,500 50,000 309 56.065 .067 7,500 7,500 102 46.000 .019 n/a 2,500 44 66.088 .036 84,513 5,000 138 44.000 .000 n/a n/a 57 8.061 .333 81,250 26,700 119 5.000 n/a n/a n/a 64 3.042 .000 175,000 n/a 77 14.000 .000 n/a n/a 50 9.000 .000 n/a n/a 146 45.010 .000 1,364 n/a 218 23.022 .027 1,258,455 100 216 58.048 .107 79,000 186,932 148 38.067 .053 151,298 38,241 147 68.000 .000 n/a n/a 120 12.033 .176 11,500 79,339 191 21.019 .019 10,158,333 124,651 306 74.034 .036 59,000 7,500 190 80.060 .000 191,667 n/a 88 26.025 .000 205,803 n/a 201 202.017 .000 204,933 n/a 364 36.038 .000 33,938 n/a 143 69.039 .000 1,527,100 n/a 298 33.062 .110 35,400,250 226,674 189 163.021 .000 1,500 n/a 198 66.028 .016 104,333 30,000 212 116.011 .017 200 20,000 152 88.040 .039 1,869,898 547,161 6,486 2,312
.000
Source: BuREAu OF Jus-ncE STATISTICS, U.S. DEP'T OF JUSTIcE, CVIL JUsTICE SURVEY OF STATECOURTS, 1996 (Inter-Univ. Consortium for Political and Soc. Research No. 2883, 2d ed. 2001)
Note: The sample size in the two right-hand columns represents the total number of trials. Thefrequency counts for the other columns should be computed using these numbers.
HeinOnline -- 87 Cornell L. Rev. 780 2001-2002

JURIES, JUDGES, AND PUNITIVE DAMAGES
APPENDIX TABLE 2: REGRESSION MODELS OF PUNITIVE
DAMAGES LEVELS
Variable
Compensatory damages (log)
Jury trial dummy
Jury trial x log of compensatory
Plaintiff/defendant status dummy variIndividual only vs. individual only (rIndividual only vs. government
Individual only vs. corporation
Individual only vs. hospital
Individual & nonind. vs.individual
Individual & nonind. vs.corporation
Nonindividual vs. individual only
Nonindividual vs. corporation
Case category dummy variablesProducts liability (reference)Motor vehicle tort
Premises liability
Products liability: asbestos
Intentional tort
Medical malpractice
Professional malpractice
Slander/libel
Other negligence
Fraud
Seller plaintiff
Buyer plaintiff
Employment discrimination
Other employment dispute
Rental/lease agreement
Tortious interference withcontract
Dependent Variable
Punitive Punitive Punitive-compensatorydamages (log) damages (log) ratio (logs)
0.854*** 0.883*** 0.002(0.144) (0.096) (0.019)-0.360 -0.240 0.036(1.047) (0.959) (0.126)0.029 0.056 -0.014
(0.225) (0.198) (0.026)ibleseference)
-0.655 -0.061(1.958) (0.182)0.214 0.033
(0.321) (0.036)1.121* 0.110*
(0.494) (0.046)
-0.855 -0.083(1.027) (0.104)
0.441 0.012(0.414) (0.045)-0.699 -0.062(0.588) (0.063)-0.474 -0.041(1.007) (0.088)
-2.342 -0.234(1.408) (0.177)
-2.281 -0.276(1.402) (0.171)-1.834 -0.225(1.275) (0.160)-2.827* -0.335*(1.309) (0.162)-2.789 -0.300(1.396) (0.169)-0.946 -0.138(1.516) (0.182)-3.954* -0.410*(1.451) (0.167)0.241 -0.036
(1.817) (0.202)-2.731* -0.309(1.258) (0.157)-2.587 -0.282(1.522) (0.173)-2.153 -0.257(1.371) (0.166)1.980 -0.234
(1.270) (0.158)-3.138* -0.343*(1.349) (0.162)-2.446 -0.290(1.266) (0.158)
-0.873 -0.142
2002]
HeinOnline -- 87 Cornell L. Rev. 781 2001-2002

782 CORNELL LAW REVIEW [Vol. 87:743
(1.459) (0.170)Other contract -1.322 -0.183
(1.343) (0.161)Other real property -3.333* -0.370*
(1.516) (0.179)Constant -2.400 -0.155 1.211***
(1.502) (0.499) (0.187)Model significance .0030 .0000 .0022r-squared .621 .523 .196Number of cases 171 173 171
Source: BuREAu OF JUSTICE STATISTICS, U.S. DEP'T OF JUsTICE, CVL JUsTnE SURVEY OF STATECOURTS, 1996 (Inter-Univ. Consortium for Political and Soc. Research No. 2883, 2d ed. 2001)
Note: Models account for clustering at the county level and the stratified sampling pattern.Robust standard errors are in parentheses.
*p < .05**p < .01***p < .001
HeinOnline -- 87 Cornell L. Rev. 782 2001-2002