june 30, 2017 - content.icicidirect.comcontent.icicidirect.com/mfsidpdf/kotak mahindra mutual...
TRANSCRIPT

June 30, 2017
1
June 30, 2017
Dear Friends,
Investing in markets is about knowledge and discipline. Knowledge answers the 'How To' of investing. Discipline answers the 'Why To' of investing.
Knowledge is needed to understand the mechanics of the markets. Discipline is needed to let you use that 'mechanics' gainfully while overriding your
fear and greed. In my understanding, there are three primary ways of investing in the equities market using blend of Knowledge and Discipline in various
degree.
We can take many investment lessons from our ancient traditions and epics. For one, I see a an Ekalavya and a Kumbhakarna way of investing.
Ekalavya way demands intense focus, dedicated self-learning, willingness to tolerate mistakes (and to bear their costs), and the self-criticism to learn
from it. Here the investor learns the market fundamentals and complexities by him/herself. Such investors follow direct equity investment strategies
developed on the basis of their own research. This method demands lot of time, intense analytical expertise and indepth financial knowledge. The
returns are also in line with the input. The sharper the knowledge and discipline, the higher the gains. But there is also a cost for those who use this direct
approach but have still not reached the expertise level of Ekalavya.
Kumbhakarna way is simply to invest a lumpsum into the equities market directly/through mutual funds for long term and then forget about it. In
Kumbhakarna way, the investor invests for the long term of 10-15 years and sleeps through the entire investment period (only figuratively of course).
Such investors will find that their investments have grown multifold and the capital created has become substantial during the course. But it is a difficult
to be so detached.
On a slightly off beat note, I want to point out to our distributor brethren the importance of the art of storytelling in the advisory role. People have a
tendency to remember and connect with difficult ideas, concepts and changes if they are communicated in a terms and references with the listener can
connect and identify. I have been approached many times by investors from remote areas who have recognised me as the person who gives Ramayana's
reference towards investing. They still remember the ideas that I presented and the concepts that I clarified using that example. The point is: if
distributors can develop their communication style with the popular imagination of their clientele, then they may be able to gel better with the deeper
ethos of the investors. In the long run, investors would recognize such concepts with the distributors who said it; and their recall value would go up.
Wishing the Best of the Season.
Thanks and Regards,
Nilesh Shah
Managing Director
EXPERT SPEAK
Mr. Nilesh Shah
Market
Valuation/Investor
Stance
Underweight
Neutral
Overweight
Below Fair Value
Lumpsum
Lumpsum
Leverage
Fair Value
STP/Lumpsum
SIP
Partial Profit
Booking
Above Fair Value
STP
Partial
Profit
Booking
Take profit
home
Strategy for Investment in Current Scenario
funds and its distribution business come into picture here. Here the
investor allocates between various assets and funds based on the
objective, plan and strategy devised on the basis of inputs given by
the advisor. They utilise the product and market knowledge of the
advisors to allocate between various funds and asset classes. Such
investors utilise the dedicated focus of the mutual fund managers
to manage their investment portfolio. Finally, the distributors play a
key role in keeping investors engaged with the market; and
motivate the investors to ride through the volatility and help them
create wealth. This is a vital social and economic function that our
distributors play.
Not all can be as relaxed as Kumbhakarna or as self-driven as Ekalavya. Here investors need professional advice, portfolio management support and
also a steady communication to keep them disciplined. Mutual
Economy
Corporate Earnings
FII Flow
DII Flow
Supply of paper
Interest Rates Transmission
Policy/Reform Initiative
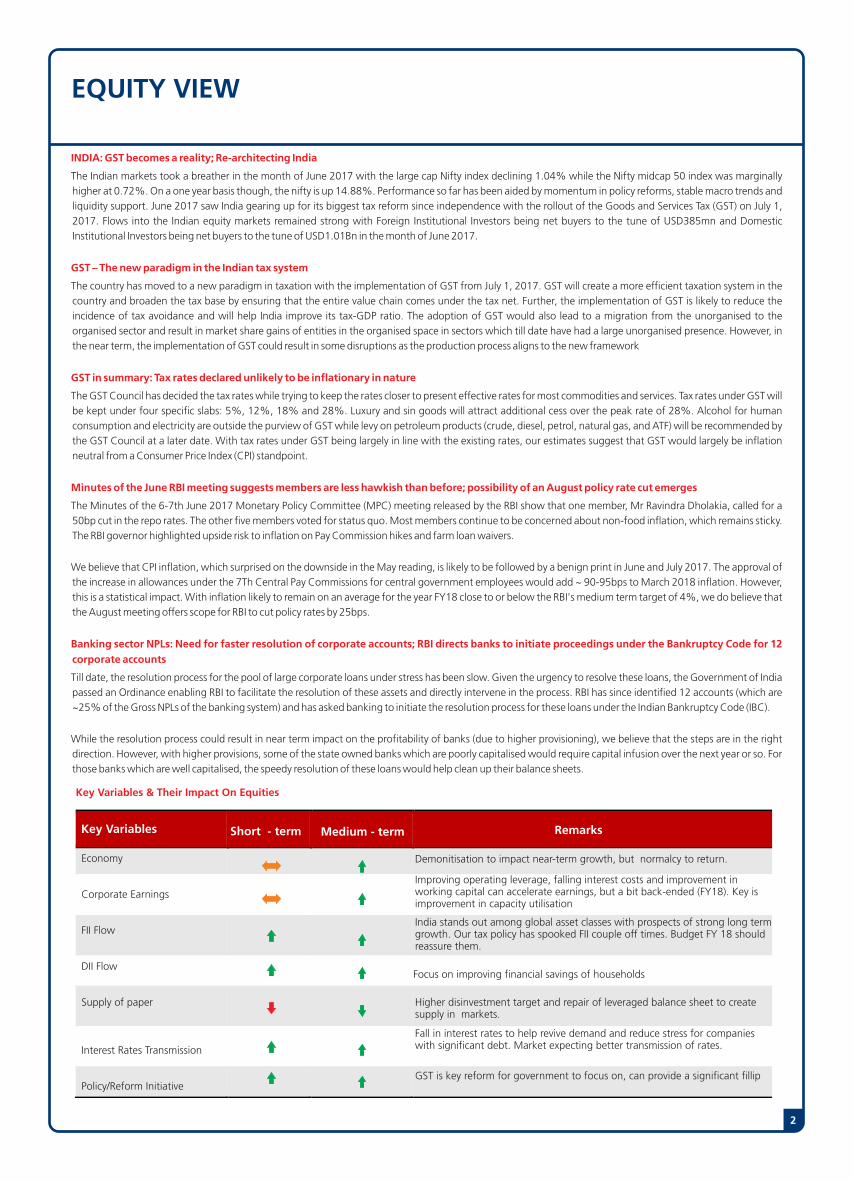
Key Variables & Their Impact On Equities
Demonitisation to impact near-term growth, but normalcy to return.
Improving operating leverage, falling interest costs and improvement in working capital can accelerate earnings, but a bit back-ended (FY18). Key is improvement in capacity utilisation
India stands out among global asset classes with prospects of strong long term growth. Our tax policy has spooked FII couple off times. Budget FY 18 should reassure them.
Focus on improving financial savings of households
Higher disinvestment target and repair of leveraged balance sheet to create supply in markets.
Fall in interest rates to help revive demand and reduce stress for companies with significant debt. Market expecting better transmission of rates.
GST is key reform for government to focus on, can provide a significant fillip
Key Variables Short - term Medium - term Remarks
2
INDIA: GST becomes a reality; Re-architecting India
The Indian markets took a breather in the month of June 2017 with the large cap Nifty index declining 1.04% while the Nifty midcap 50 index was marginally
higher at 0.72%. On a one year basis though, the nifty is up 14.88%. Performance so far has been aided by momentum in policy reforms, stable macro trends and liquidity support. June 2017 saw India gearing up for its biggest tax reform since independence with the rollout of the Goods and Services Tax (GST) on July 1, 2017. Flows into the Indian equity markets remained strong with Foreign Institutional Investors being net buyers to the tune of USD385mn and Domestic Institutional Investors being net buyers to the tune of USD1.01Bn in the month of June 2017.
GST � The new paradigm in the Indian tax system
The country has moved to a new paradigm in taxation with the implementation of GST from July 1, 2017. GST will create a more efficient taxation system in the country and broaden the tax base by ensuring that the entire value chain comes under the tax net. Further, the implementation of GST is likely to reduce the incidence of tax avoidance and will help India improve its tax-GDP ratio. The adoption of GST would also lead to a migration from the unorganised to the
organised sector and result in market share gains of entities in the organised space in sectors which till date have had a large unorganised presence. However, in
the near term, the implementation of GST could result in some disruptions as the production process aligns to the new framework
GST in summary: Tax rates declared unlikely to be inflationary in nature
The GST Council has decided the tax rates while trying to keep the rates closer to present effective rates for most commodities and services. Tax rates under GST will
be kept under four specific slabs: 5%, 12%, 18% and 28%. Luxury and sin goods will attract additional cess over the peak rate of 28%. Alcohol for human
consumption and electricity are outside the purview of GST while levy on petroleum products (crude, diesel, petrol, natural gas, and ATF) will be recommended by the GST Council at a later date. With tax rates under GST being largely in line with the existing rates, our estimates suggest that GST would largely be inflation neutral from a Consumer Price Index (CPI) standpoint.
Minutes of the June RBI meeting suggests members are less hawkish than before; possibility of an August policy rate cut emerges
The Minutes of the 6-7th June 2017 Monetary Policy Committee (MPC) meeting released by the RBI show that one member, Mr Ravindra Dholakia, called for a 50bp cut in the repo rates. The other five members voted for status quo. Most members continue to be concerned about non-food inflation, which remains sticky. The RBI governor highlighted upside risk to inflation on Pay Commission hikes and farm loan waivers.
We believe that CPI inflation, which surprised on the downside in the May reading, is likely to be followed by a benign print in June and July 2017. The approval of the increase in allowances under the 7Th Central Pay Commissions for central government employees would add ~ 90-95bps to March 2018 inflation. However, this is a statistical impact. With inflation likely to remain on an average for the year FY18 close to or below the RBI's medium term target of 4%, we do believe that the August meeting offers scope for RBI to cut policy rates by 25bps.
Banking sector NPLs: Need for faster resolution of corporate accounts; RBI directs banks to initiate proceedings under the Bankruptcy Code for 12 corporate accounts
Till date, the resolution process for the pool of large corporate loans under stress has been slow. Given the urgency to resolve these loans, the Government of India passed an Ordinance enabling RBI to facilitate the resolution of these assets and directly intervene in the process. RBI has since identified 12 accounts (which are ~25% of the Gross NPLs of the banking system) and has asked banking to initiate the resolution process for these loans under the Indian Bankruptcy Code (IBC).
While the resolution process could result in near term impact on the profitability of banks (due to higher provisioning), we believe that the steps are in the right
direction. However, with higher provisions, some of the state owned banks which are poorly capitalised would require capital infusion over the next year or so. For
those banks which are well capitalised, the speedy resolution of these loans would help clean up their balance sheets.
EQUITY VIEW

Key Events:
� Launch of Goods and Services Tax (GST), India's biggest tax reform will help ease of business, increase tax compliance and give a boost to the economy and is a credit positive event as per Moody's
� Reserve Bank of India (RBI) has kept the Repo rate unchanged at 6.25% in its latest Monetary Policy review while cutting the Statutory Liquid Ratio (SLR) by 50 basis points to 20%, effective 24 June.
� Five of the six Monetary Policy Committee (MPC) members voted for status quo on rates, while Mr. R Dholakia pleaded for a 50 bps cut at least with immediate effect.
� RBI also revised the projected real GVA growth for this financial year to 7.3%, down 10 basis points from the earlier projection made in April 2017.
� Consumer price index (CPI), slowed to 2.18 % in May from 2.99 % in April 2017.
� The index of industrial production (IIP) rose by 3.1 % in April led by robust growth in electricity generation.
� The Federal Reserve hiked the fed-funds rate by a 25 bps to between 1 % and 1.25 %, as expected.
� The Bank of Japan kept monetary policy steady and upgraded its assessment of private consumption and overseas growth, signalling its confidence that an export-driven economic recovery was broadening and gaining momentum.
� India's exports rose by 8.32% to USD 24 bn in May, even as the trade deficit shot up to nearly 30-month high of USD 13.84 bn, mainly due to increase in gold imports. India's imports too increased by 33% to USD 37.85 bn in May this year.
Long Term Outlook
Items Jun-17 May-17 Change
Reverse Repo 6.00% 6.00% Nil
Repo 6.25% 6.25% Nil
CRR 4.00% 4.00% Nil
SLR 20.00% 20.50% -50bps
Mibor Overnight 6.25% 6.25% Nil
Call(O/N) 6.11% 6.02% 9 bps
CBLO 6.05% 6.10% -5 bps
1 yr T Bill 6.35% 6.44% -9 bps
10 G Sec 6.51% 6.66% -15 bps
5 Year AAA 7.32% 7.44% - 12 bps
USD/INR 64.58 64.54 -0.04Source: RBI; Bloomberg.
DEBT VIEW
3
Denotes fall in interest rates3
Key Variables & their Impact On Interest Rates in 2017
Short Term Outlook
� We expect short term rate curve up to 2 year to flatten given the renewed possibility of rate cuts going ahead.
� Short Term rates would move down further in case RBI cut rates or would remain at similar levels in absence of rate cuts.
The RBI surprised the market by announcing OMO bond sales worth 10k cr. which probably can create some near term spike in the bond yields.
There is a fear emerging that RBI will add duration and sterilise liquidity through OMO, however we believe while the liquidity may get sterilised but RBI will accept large amount of short bonds rather than long bonds and conduct the OMO in non-disruptive manner.
As far as liquidity is concerned its available in ample and couple of OMO's of 10k will not disturb the magnitude of surplus liquidity
We expect the June CPI reading to be ~1.5-2.00% and Core ~4.00-4.25% which is much below the expectation. This will shift the focus to the rate cut expectation in the coming policy and thus leading to a rally in the 10 yr Gilt.
RBI kept the Policy rates unchanged while waiting to be more sure that inflation will stay subdued. We believe that lower inflation and moderating growth would provide the space for RBI to reduce policy rate by 50 bps over the course of next 1 year.
The Impact of 7 CPC is likely to be minimal and will be looked through by the MPC.
We believe the global bond yields have sold-off considerably and further rise could be low
Having said that, we believe that lower inflation and moderating growth would provide the space for RBI to reduce policy rate by 50 bps over the course of next 1 year.
In the near term, we expect the new 10 year gilt to trade in the 6.45-6.55 band, RBI policy to give direction to the market and will lead to shift in the trading band but will not alter the long term trend of easy rates.
Outlook
Inflation
Key Variables Short - term (3-6 month) Medium � term (6month � 2 years)
Rupee
Credit Demand
Government Borrowing
RBI Policy
Global Event Risk
Corporate bond Spread
Debt FII flow
Liquidity
3
Jun‐
07
Jun‐
08
Jun‐
09
Jun‐
10
Jun‐
11
Jun‐
12
Jun‐
13
Jun‐
14
Jun‐
15
Jun‐
16
Jun‐
17
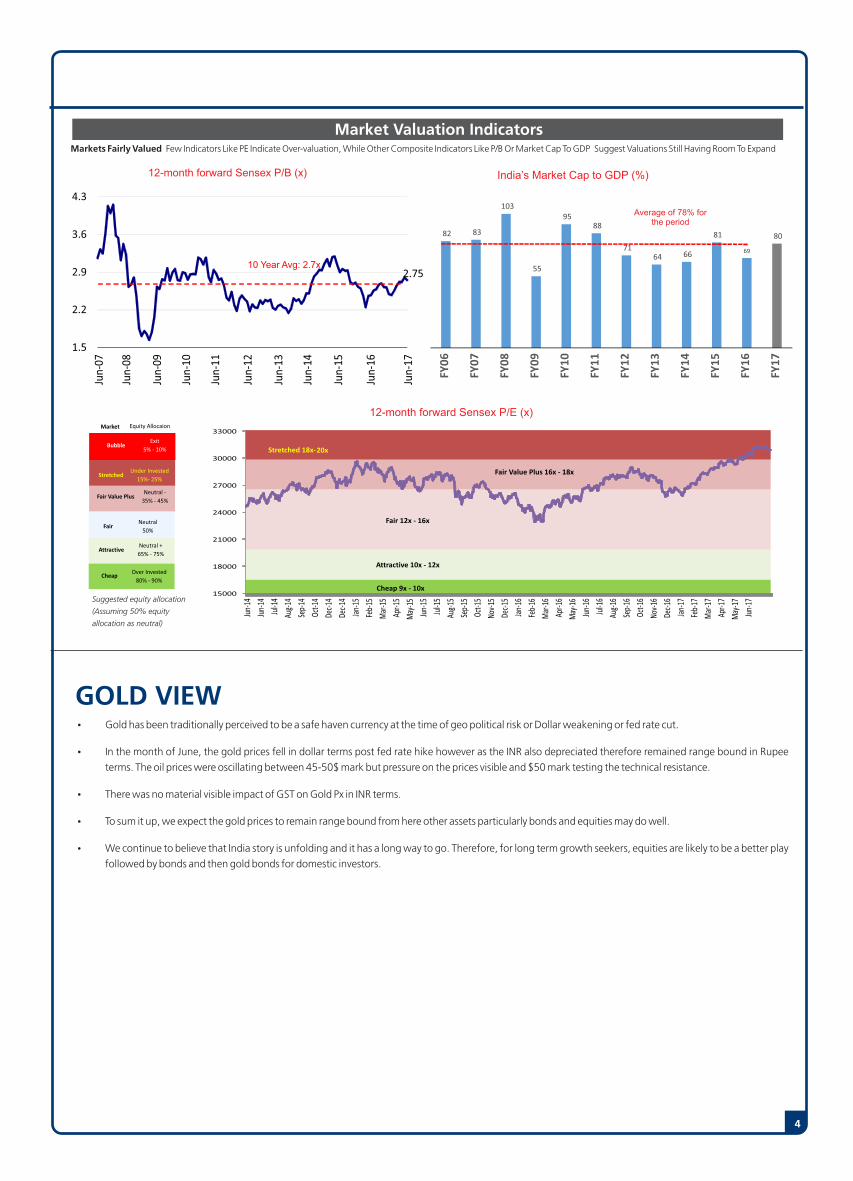
2.75
1.5
2.2
2.9
3.6
4.3
10 Year Avg: 2.7x
Gold has been traditionally perceived to be a safe haven currency at the time of geo political risk or Dollar weakening or fed rate cut.
In the month of June, the gold prices fell in dollar terms post fed rate hike however as the INR also depreciated therefore remained range bound in Rupee
terms. The oil prices were oscillating between 45-50$ mark but pressure on the prices visible and $50 mark testing the technical resistance.
There was no material visible impact of GST on Gold Px in INR terms.
To sum it up, we expect the gold prices to remain range bound from here other assets particularly bonds and equities may do well.
We continue to believe that India story is unfolding and it has a long way to go. Therefore, for long term growth seekers, equities are likely to be a better play
followed by bonds and then gold bonds for domestic investors.
4
GOLD VIEW
Market Valuation Indicators
12-month forward Sensex P/B (x)
12-month forward Sensex P/E (x)
Stretched
Bubble
CheapOver Invested
80% ‐ 90%
AttractiveNeutral +
65% ‐ 75%
FairNeutral
50%
Fair Value PlusNeutral ‐
35% ‐ 45%
Under Invested
15%‐ 25%
Exit
5% ‐ 10%
Market Equity Allocaion
Suggested equity allocation
(Assuming 50% equity
allocation as neutral)
15000
18000
21000
24000
27000
30000
33000
Jun‐
14
Jun‐
14
Jul‐1
4
Aug‐
14
Sep‐
14
Oct‐1
4
Dec‐
14
Dec‐
14
Jan‐
15
Feb‐
15
Mar
‐15
Apr‐1
5
May
‐15
Jun‐
15
Jul‐1
5
Aug‐
15
Sep‐
15
Oct‐1
5
Nov‐
15
Dec‐
15
Jan‐
16
Feb‐
16
Mar
‐16
Apr‐1
6
May
‐16
Jun‐
16
Jul‐1
6
Aug‐
16
Sep‐
16
Oct‐1
6
Nov‐
16
Dec‐
16
Jan‐
17
Feb‐
17
Mar
‐17
Apr‐1
7
May
‐17
Jun‐
17
10x‐12x
Fair 12x
Fair Value Plus 16‐18x
Stretched 18x‐20x
Cheap 9x ‐ 10x
Attractive 10x ‐ 12x
Fair 12x ‐ 16x
Fair Value Plus 16x ‐ 18x
Stretched 18x‐20x
Markets Fairly Valued Few Indicators Like PE Indicate Over-valuation, While Other Composite Indicators Like P/B Or Market Cap To GDP Suggest Valuations Still Having Room To Expand
82 83
103
55
9588
7164 66
81
69
80
FY0
6
FY0
7
FY0
8
FY0
9
FY1
0
FY1
1
FY1
2
FY1
3
FY1
4
FY1
5
FY1
6
FY1
7
India’s Market Cap to GDP (%)
Average of 78% for the period

KOTAK 50An Open - Ended Equity Scheme
(As on June 30, 2017)
Issuer/Instrument Industry/Rating % to Net Assets
Equity & Equity related (Listed/Awaiting listing on Stock Exchange) HDFC Bank Ltd. Banks 8.71 ITC Ltd. Consumer Non Durables 6.93 ICICI Bank Ltd. Banks 5.82 Infosys Ltd. Software 4.45 Reliance Industries Ltd. Petroleum Products 4.40 IndusInd Bank Ltd. Banks 4.33 Maruti Suzuki India Limited Auto 3.88 Larsen And Toubro Ltd. Construction Project 3.46 State Bank Of India Banks 3.15 Hero MotoCorp Ltd. Auto 3.12 Axis Bank Ltd Banks 2.65 Tata Motors Ltd - DVR Auto 2.30 GAIL (India) Ltd. Gas 2.02 Bharat Petroleum Corporation Ltd. Petroleum Products 1.87 Shree Cement Ltd. Cement 1.86 Zee Entertainment Enterprises Ltd Media and Entertainment 1.80 Cadila Healthcare Ltd. Pharmaceuticals 1.73 Britannia Industries Ltd. Consumer Non Durables 1.62 The Ramco Cements Ltd Cement 1.41 Apollo Hospitals Enterprises Ltd. Healthcare Services 1.40 ICICI Prudential Life Insurance Company Ltd Finance 1.37 Bayer Cropscience Ltd. Pesticides 1.36 Ultratech Cement Ltd. Cement 1.36 Kajaria Ceramics Ltd. Construction 1.27 Fag Bearings India Ltd. Industrial Products 1.23 Persistent Systems Limited Software 1.20 Sun TV Limited. Media and Entertainment 1.17 Bank Of Baroda Banks 1.15 HCL Technologies Ltd. Software 1.12 Strides Shasun Ltd. Pharmaceuticals 1.06 DB Corp Limited Media and Entertainment 1.04
Issuer/Instrument Industry/Rating % to Net Assets
Bharat Electronics Ltd Industrial Capital Goods 1.00 Indraprastha Gas Ltd. Gas 0.97 Torrent Pharmaceuticals Ltd. Pharmaceuticals 0.96 Motherson Sumi Systems Ltd. Auto Ancillaries 0.93 National Thermal Power Corporation Limited Power 0.93 Sanofi India Ltd. Pharmaceuticals 0.93 Supreme Industries Limited Industrial Products 0.92 Arvind Ltd Textile Products 0.91 Laurus Labs Ltd Pharmaceuticals 0.90 Castrol (India ) Ltd. Petroleum Products 0.89 MRF Limited Auto Ancillaries 0.89 Tech Mahindra Ltd. Software 0.87 DR.Lal Pathlabs Ltd Healthcare Services 0.86 Sun Pharmaceuticals Industries Ltd. Pharmaceuticals 0.81 Petronet LNG Ltd. Gas 0.79 Solar Industries India Limited Chemicals 0.71 Equitas Holdings Ltd Finance 0.66 HDFC Ltd. Warrants Finance 0.64 Bharat Earth Movers Ltd. Industrial Capital Goods 0.56 Bharat Financial Inclusion Limited Finance 0.49 GE Power India Limited Industrial Capital Goods 0.45 Bata India Ltd. Consumer Durables 0.39 RBL Bank Ltd Banks 0.06 Listed/Awaiting Listing on Stock Exchange - Total 97.76 Futures RBL Bank Ltd-JUL2017 0.82 Futures (Market value represents Notional Value) - Total 0.82 TERM DEPOSITS AXIS Bank Ltd. 0.48 Term Deposits - Total 0.48 Collateral Borrowing & Lending obligation 2.64 Net Current Assets/(Liabilities) -1.70 Grand Total 100.00
PORTFOLIO
INVESTMENT STYLE
Value Blend Growth Size
Large
Mid
Small
EQUITY SCHEMES
Investment Objective
To generate capital appreciation from a portfolio of predominantly equity and equity related securities. The portfolio will generally comprise of equity and equity related instruments of around 50 companies which may go up to 59 companies but will not exceed 59 at any point in time. However, there is no assurance that the objective of the scheme will be realized.
Allotment Date
December 29,1998
Fund Manager
Mr. Harish Krishnan*
Benchmark
Nifty 50
AAUM (` In Crores)
AAUM as on June 30, 2017:
1378.71
AUM (` In Crores)
AUM as on June 30, 2017:
1366.35
Available Plans/Options
A) B) Direct Plan Regular Plan
Options: Dividend Payout, Dividend Reinvestment & Growth (applicable for all plans)
Dividend Frequency
Trustee�s Discretion
Ratios
Portfolio Turnover: 70.24% $Beta: 1.00 $ ##Sharpe :0.52$Standard Deviation : 13.41%
$Source: ICRA MFI Explorer.
## Risk rate assumed to be 6.25% ( FBIL Overnight MIBOR rate as on 30th June 2017)
Minimum Investment Amount
Initial Investment: `5000 and in multiple of `1 for purchase and for `0.01 for switches
Additional Investment: `1000 & in multiples of 1
Ideal Investments Horizon: 3 years & above
Load Structure
Entry Load: Nil. (applicable for all plans)
Exit Load:
i) For redemptions / switch outs (including SIP/STP) within 1 year from the date of allotment of units, irrespective of the amount of investment: 1%.
ii) For redemption/switch outs (including SIP/STP) after 1 year from the date of allotment of units, irrespective of the amount of investment: Nil.
Note � Any exit load charged (net off Service Tax, if any) shall be credited back to the respective scheme. Units issued on reinvestment of dividends shall not be subject to entry and exit load.
Total Expense Ratio**
Regular:2.17%
Direct: 1.00%
**Total Expense Ratio excludes applicable B15 fee and service tax.
Notes: Term Deposit as provided above is towards margin for derivatives transactions
Style
5 For last three dividends, please refer page no 56-58. For scheme performance, please refer page no 45-53 * For Fund Manager experience, please refer page 54-55.
SYSTEMATIC INVESTMENT PLAN (SIP)
Scheme Inception : - December 29, 1998. The returns are calculated by XIRR approach assuming investment of 10,000/- on the 1st working `day of every month. XIRR helps in calculating return on investments given an initial and final value and a series of cash inflows and outflows and taking the time of investment into consideration. Since inception returns are assumed to be starting from the beginning of the subsequent month from the date of inception. # Benchmark ; Additional Benchmark
Kotak 50 NAV as on June 30, 2017: `35.730 (Dividend Option), `37.866 (Direct Dividend Option), `205.358 (Growth Option), `214.655 (Direct Growth Option)
Monthly SIP of Rs 10000
Total amount invested (Rs)
Total Value as on June 30, 2017(Rs)
Scheme Returns (%)
Nifty 50 (Rs)#
Nifty 50 Returns (%)
S&P BSE SENSEX (Rs)^
S&P BSE SENSEX Returns (%)
1 year 3 years 5 years 7 years 10 years Since Inception
120,000 360,000 600,000 840,000 1,200,000 1,540,000
130,742 429,236 879,788 1,374,905 2,316,349 14,852,775
17.13 11.78 15.32 13.84 12.63 17.86
130,496 412,973 798,527 1,221,347 2,020,097 8,676,390
16.73 9.14 11.39 10.52 10.06 13.10
130,881 408,394 784,765 1,197,833 1,975,338 8,719,363
17.36 8.38 10.69 9.98 9.63 13.15
Systematic Investment Plan (SIP) If you had invested `10,000 every month
This product is suitable for investors who are seeking*:� Long term capital growth� Investment in portfolio of predominantly equity & equity related securities* Investors should consult their financial advisors if in doubt about whether the product is suitable for them.
PRODUCT LABEL
Investors understand that their principal will be at moderately high risk
Riskometer
yletaredo
M
Moderate
Low
High
Low
High
LOW HIGH
Moderately
SECTOR ALLOCATION (%)
Banks Auto Consumer Non Durables SoftwarePharmaceuticals Petroleum Products
CementConstruction Project
Others
Media and Entertainment
25.87
9.30
8.557.647.16
6.39
4.634.01
3.78
3.46
19.21
Gas

KOTAK CLASSIC EQUITYAn Open - Ended Equity Growth Scheme
Issuer/Instrument Industry/Rating % to Net Assets
Issuer/Instrument Industry/Rating % to Net Assets
PORTFOLIO
INVESTMENT STYLE
Value Blend Growth Size
Large
Mid
Small
Investment Objective
To generate capital appreciation from a diversified portfolio of equity and equity related securities. However, there is no assurance that the objective of the scheme will be realized.
Allotment Date
July 27, 2005
Fund Manager
Mr. Deepak Gupta*
Benchmark
Nifty 100
AAUM (` In Crores)
AAUM as on June 30, 2017:
`104.35
AUM (` In Crores)
AUM as on June 30, 2017:
104.03
Available Plans/Options
A) B) Direct Plan Regular Plan
Options: Dividend Payout, Dividend Reinvestment & Growth (applicable for all plans)
Dividend Frequency
Trustee�s Discretion
Ratios
Portfolio Turnover: 182.00% $Beta: 0.97$ ##Sharpe :0.34$Standard Deviation : 12.88%
$Source: ICRA MFI Explorer.
## Risk rate assumed to be 6.25% ( FBIL Overnight MIBOR rate as on 30th June 2017)
Minimum Investment Amount
Initial Investment: `5000 and in multiple of `1 for purchase and for `0.01 for switches
Additional Investment: `1000 & in multiples of 1
Ideal Investments Horizon: 3 years & above
Load Structure
Entry Load: Nil. (applicable for all plans)
Exit Load: Nil. (applicable for all plans), (w.e.f December 01, 2014)
Total Expense Ratio**
Regular: 2.69%Direct: 1.19%
**Total Expense Ratio excludes applicable B15 fee and service tax.
Style
SYSTEMATIC INVESTMENT PLAN (SIP)
Scheme Inception : - July 27,2005. The returns are calculated by XIRR approach assuming investment of 10,000/- on the 1st working day of `every month. XIRR helps in calculating return on investments given an initial and final value and a series of cash inflows and outflows and taking the time of investment into consideration. Since inception returns are assumed to be starting from the beginning of the subsequent month from the date of inception. # Benchmark ; Additional Benchmark
Kotak Classic Equity NAV as on June 30, 2017: 22.051 (Dividend Option), 23.536 (Direct Dividend Option), 41.970 (Growth Option), `44.355 (Direct Growth Option)
Equity & Equity related (Listed/Awaiting listing on Stock Exchange) Infosys Ltd. Software 5.69 ITC Ltd. Consumer Non Durables 4.48 Hindalco Industries Ltd Non - Ferrous Metals 4.20 Reliance Industries Ltd. Petroleum Products 3.93 Power Grid Corporation Of India Ltd Power 3.77 Tata Consultancy Services Ltd. Software 2.95 Grasim Industries Ltd. Cement 2.91 Hero MotoCorp Ltd. Auto 2.91 Maruti Suzuki India Limited Auto 2.80 National Thermal Power Corporation Limited Power 2.71 GAIL (India) Ltd. Gas 2.60 Bharat Petroleum Corporation Ltd. Petroleum Products 2.43 Oil & Natural Gas Corporation Ltd. Oil 2.11 Yes Bank Ltd Banks 2.02 HDFC Bank Ltd. Banks 1.89 Tata Motors Ltd - DVR Auto 1.74 Tata Communications Ltd Telecom - Services 1.73 HDFC Ltd. Warrants Finance 1.54 IndusInd Bank Ltd. Banks 1.52 Tata Steel Limited. Ferrous Metals 1.50 Hindustan Petroleum Corporation Ltd Petroleum Products 1.36 State Bank Of India Banks 1.32 Vedanta Ltd. Non - Ferrous Metals 1.29 HDFC Ltd. Finance 1.28 Colgate Palmolive (India ) Ltd. Consumer Non Durables 1.22 Piramal Enterprises Limited Pharmaceuticals 1.22 Sun TV Limited. Media and Entertainment 1.22 Tech Mahindra Ltd. Software 1.20 Wipro Ltd. Software 1.20 Petronet LNG Ltd. Gas 1.18 Bajaj Finserv Ltd. Finance 1.13 Laurus Labs Ltd Pharmaceuticals 1.09 Indraprastha Gas Ltd. Gas 0.99
EQUITY SCHEMES
6
This product is suitable for investors who are seeking*:� Long term capital growth� Investment in portfolio of predominantly equity & equity related securities* Investors should consult their financial advisors if in doubt about whether the product is suitable for them.
PRODUCT LABEL
Investors understand that their principal will be at moderately high risk
Riskometer
yletaredo
M
Moderate
Low
High
Low
High
LOW HIGH
Moderately
AU Small Finance Bank Ltd. Banks 0.96 Muthoot Finance Ltd Finance 0.96 Eris Lifesciences Ltd Pharmaceuticals 0.80 Indian Oil Corporation Ltd Petroleum Products 0.75 The Ramco Cements Ltd Cement 0.72 JSW Steel Ltd. Ferrous Metals 0.60 Avenue Supermarts Ltd Retailing 0.58 Axis Bank Ltd Banks 0.57 S Chand And Company Ltd Media and Entertainment 0.54 Bajaj Finance Limited Finance 0.49 Eicher Motors Ltd Auto 0.47 Aditya Birla Nuvo Limited Services 0.45 HCL Technologies Ltd. Software 0.19 ICICI Bank Ltd. Banks 0.19 7.5 Vedanta Reedemable Preference Shares Non - Ferrous Metals 0.17 Housing & Urban Development Corporation Ltd Finance 0.17 Biocon Ltd. Pharmaceuticals 0.06 RBL Bank Ltd Banks 0.03 Listed/Awaiting Listing on Stock Exchange - Total 79.83 Futures HDFC Bank Ltd.-JUL2017 5.94 ICICI Bank Ltd.-JUL2017 2.92 IndusInd Bank Ltd.-JUL2017 2.22 ITC Ltd.-JUL2017 1.95 Bharat Petroleum Corporation Ltd.-JUL2017 1.47 HCL Technologies Ltd.-JUL2017 1.14 RBL Bank Ltd-JUL2017 1.14 Axis Bank Ltd-JUL2017 0.95 Biocon Ltd.-JUL2017 0.86 Bajaj Finance Limited-JUL2017 0.66 Hindustan Unilever Ltd.-JUL2017 0.38 Futures (Market value represents Notional Value) - Total 19.63 TERM DEPOSITS AXIS Bank Ltd. 3.84 Term Deposits - Total 3.84 Collateral Borrowing & Lending obligation 16.12 Net Current Assets/(Liabilities) -19.42 Grand Total 100.00
SECTOR ALLOCATION (%)
Banks Software Auto Finance Derivatives
Power
23.9215.00
12.048.717.2
6.01
5.364.39
12.31
Others
24.24
15.27
12.38.14
7.17
6.13
5.314.21
12.2318.35
13.4
12.89
10.518.81
6.81
5.65
4.85
11.19
For last three dividends, please refer page no 56-58. For scheme performance, please refer page no 45-53 * For Fund Manager experience, please refer page 54-55.
Monthly SIP of Rs 10000
Total amount invested (Rs)
Total Value as on June 30, 2017 (Rs)
Scheme Returns (%)
Nifty 100 (Rs)#
Nifty 100 Returns (%)
Nifty 50 (Rs)^
Nifty 50 Returns (%)
1 year 3 years 5 years 7 years 10 years Since Inception
1,20,000 3,60,000 6,00,000 8,40,000 12,00,000 14,40,000
1,30,716 4,26,820 8,55,829 13,47,146 23,17,826 31,21,521
17.09 11.40 14.20 13.27 12.64 12.20
1,31,077 4,20,980 8,26,219 12,70,231 21,26,679 28,89,856
17.68 10.45 12.77 11.62 11.02 11.03
1,30,496 4,12,973 7,98,527 12,21,347 20,20,097 27,41,679
16.73 9.14 11.39 10.52 10.06 10.22
Systematic Investment Plan (SIP) If you had invested `10,000 every month
EQUITY SCHEMES
6
Notes: Term Deposit as provided above is towards margin for derivatives transactions
(As on June 30, 2017)
CBLO & Term Deposits & Rev.Repo Non - Ferrous MetalsPetroleum Products Consumer Non Durables
19.96
19.63
11.238.50
8.47
7.92
6.48
5.705.66
5.570.88

EQUITY SCHEMES
KOTAK OPPORTUNITIESAn Open - Ended Equity Growth Scheme
Investment Objective
To generate capital appreciation from a diversified portfolio of equity and equity related securities. However, there is no assurance that the objective of the scheme will be realized.
Allotment Date
September 9, 2004
Fund Manager
Mr. Harsha Upadhyaya*
Benchmark
Nifty 500
AAUM (` In Crores)
AAUM as on June 30, 2017:
1625.55
AUM (` In Crores)
AUM as on June 30, 2017:
1654.75
Available Plans/Options
A) B) Direct Plan Regular Plan
Options: Dividend Payout, Dividend Reinvestment & Growth (applicable for all plans)
Dividend Frequency
Trustee�s Discretion
Ratios
Portfolio Turnover: 51.96% $Beta: 1.02$ ##Sharpe :0.80$Standard Deviation :13.88%
$Source: ICRA MFI Explorer.
## Risk rate assumed to be 6.25% ( FBIL Overnight MIBOR rate as on 30th June 2017)
Minimum Investment Amount
Initial Investment: `5000 and in multiple of `1 for purchase and for `0.01 for switches
Additional Investment: `1000 & in multiples of 1
Ideal Investments Horizon: 3 years & above
Load Structure
Entry Load: Nil. (applicable for all plans)
Exit Load:
I) For redemptions / switch outs (including SIP/STP) within 1 year from the date of allotment of units, irrespective of the amount of investment: 1%
ii) For redemptions / switch outs (including SIP/STP) after 1 year from the date of allotment of units, irrespective of the amount of investment: NIL
iii) Any exit load charged (net off Service Tax, if any) shall be credited back to the respective Scheme. (applicable for all plans)
iv) Units issued on reinvestment of dividends shall not be subject to exit load (applicable for all plans)
Total Expense Ratio**
Regular:2.13%Direct: 0.98%
**Total Expense Ratio excludes applicable B15 fee and service tax.
7
SYSTEMATIC INVESTMENT PLAN (SIP)
Scheme Inception : - September 09, 2004. The returns are calculated by XIRR approach assuming investment of 10,000/- on the 1st working `day of every month. XIRR helps in calculating return on investments given an initial and final value and a series of cash inflows and outflows and taking the time of investment into consideration. Since inception returns are assumed to be starting from the beginning of the subsequent month from the date of inception. # Benchmark ; Additional Benchmark Kotak Opportunities NAV as on June 30, 2017: `26.956 (Dividend Option), `28.338 (Direct Dividend Option), `106.779 (Growth Option), `111.596 (Direct Growth Option)
Issuer/Instrument Industry/Rating % to Net Assets
Issuer/Instrument Industry/Rating % to Net Assets
PORTFOLIO
Notes: Term Deposit as provided above is towards margin for derivatives transactions
This product is suitable for investors who are seeking*:� Long term capital growth� Investment in portfolio of predominantly equity & equity related securities* Investors should consult their financial advisors if in doubt about whether the product is suitable for them.
PRODUCT LABEL
Investors understand that their principal will be at moderately high risk
Riskometer
yletaredo
M
Moderate
Low
High
Low
High
LOW HIGH
Moderately
INVESTMENT STYLE
Value Blend Growth Size
Large
Mid
Small
Style
SECTOR ALLOCATION (%)
For last three dividends, please refer page no 56-58. For scheme performance, please refer page no 45-53 * For Fund Manager experience, please refer page 54-55.
Monthly SIP of Rs 10000
Total amount invested (Rs)
Total Value as on June 30, 2017(Rs)
Scheme Returns (%)
Nifty 500 (Rs)#
Nifty 500 Returns (%)
Nifty 50 (Rs)^
Nifty 50 Returns (%)
1 year 3 years 5 years 7 years 10 years Since Inception
120,000 360,000 600,000 840,000 1,200,000 1,540,000
134,265 462,135 983,627 1,559,355 2,693,432 4,705,831
22.93 16.94 19.89 17.37 15.45 16.16
132,514 432,086 863,279 1,323,137 2,190,654 3,434,690
20.04 12.24 14.55 12.76 11.58 11.77
130,496 412,973 798,527 1,221,347 2,020,057 3,234,727
16.73 9.14 11.39 10.52 10.05 10.92
Systematic Investment Plan (SIP) If you had invested `10,000 every month
Equity & Equity related (Listed/Awaiting listing on Stock Exchange) HDFC Bank Ltd. Banks 6.24 ITC Ltd. Consumer Non Durables 5.09 Reliance Industries Ltd. Petroleum Products 4.59 Hero MotoCorp Ltd. Auto 3.80 ICICI Bank Ltd. Banks 3.38 State Bank Of India Banks 3.27 IndusInd Bank Ltd. Banks 3.13 Maruti Suzuki India Limited Auto 2.84 Shree Cement Ltd. Cement 2.56 HDFC Ltd. Finance 2.44 Larsen And Toubro Ltd. Construction Project 2.37 GAIL (India) Ltd. Gas 2.33 Infosys Ltd. Software 2.04 Hindustan Petroleum Corporation Ltd Petroleum Products 1.99 Dalmia Bharat Ltd. Cement 1.94 UPL Ltd Pesticides 1.90 Axis Bank Ltd Banks 1.88 Coromandel International Ltd. Fertilisers 1.84 Britannia Industries Ltd. Consumer Non Durables 1.74 Max Financial Services Ltd. Finance 1.72 Petronet LNG Ltd. Gas 1.63 Zee Entertainment Enterprises Ltd Media and Entertainment 1.63 Torrent Pharmaceuticals Ltd. Pharmaceuticals 1.59 Ultratech Cement Ltd. Cement 1.56 Bharat Petroleum Corporation Ltd. Petroleum Products 1.53 Indraprastha Gas Ltd. Gas 1.50 ICICI Prudential Life Insurance Company Ltd Finance 1.42 Bajaj Finance Limited Finance 1.41 Healthcare Global Enterprises Ltd Healthcare Services 1.37 Avenue Supermarts Ltd Retailing 1.36 Arvind Ltd Textile Products 1.30 DR.Lal Pathlabs Ltd Healthcare Services 1.30 Mahindra & Mahindra Ltd. Auto 1.29 Tata Motors Ltd. Auto 1.14
The Ramco Cements Ltd Cement 1.12 Fag Bearings India Ltd. Industrial Products 1.08 Linde India Ltd. Chemicals 1.00 Multi Commodity Exchange of India Limited Finance 0.96 MRF Limited Auto Ancillaries 0.95 SRF Ltd. Textile Products 0.93 JK Cement Ltd. Cement 0.91 Techno Electric & Engineering Co Ltd. Construction Project 0.91 AIA Engineering Limited Industrial Products 0.84 Bata India Ltd. Consumer Durables 0.81 Equitas Holdings Ltd Finance 0.78 Sun Pharmaceuticals Industries Ltd. Pharmaceuticals 0.76 National Buildings Construction Corporation Limited Construction 0.75 Bharat Earth Movers Ltd. Industrial Capital Goods 0.74 Va Tech Wabag Limited Engineering Services 0.71 Lupin Ltd. Pharmaceuticals 0.64 Whirlpool of India Ltd. Consumer Durables 0.64 Ashok Leyland Ltd. Auto 0.58 Persistent Systems Limited Software 0.58 Bank Of Baroda Banks 0.55 Container Corporation of India Ltd. Transportation 0.51 Cummins India Ltd. Industrial Products 0.51 HDFC Ltd. Warrants Finance 0.43 Swaraj Engines Ltd Industrial Products 0.43 SKF India Ltd Industrial Products 0.28 6% Redm Preference Sh Zee Entertainment Enterprises Ltd Media and Entertainment 0.07 Listed/Awaiting Listing on Stock Exchange - Total 95.59 TERM DEPOSITS AXIS Bank Ltd. 0.82 Term Deposits - Total 0.82 Collateral Borrowing & Lending obligation 1.69 Net Current Assets/(Liabilities) 1.90 Grand Total 100.00
(As on June 30, 2017)
Banks AutoFinance Petroleum ProductsCement
Gas
Consumer Non Durables Construction Project
OthersIndustrial Products
18.45
9.65
9.16
8.118.09
6.835.46
3.28
3.14
2.99
24.84
Pharmaceu�cals

KOTAK SELECT FOCUS FUNDAn Open - Ended Equity Scheme
Issuer/Instrument Industry/Rating % to Net Assets
Issuer/Instrument Industry/Rating % to Net Assets
PORTFOLIO
EQUITY SCHEMES
Investment Objective
The investment objective of the scheme is to generate long-term capital appreciation from a portfolio of equity and equity related securities, generally focused on a few selected sectors. However, there is no assurance that the objective of the scheme will be realized.
Allotment Date
September 11, 2009
Fund Manager
Mr. Harsha Upadhyaya*
Benchmark
Nifty 200
AAUM (` In Crores)
AAUM as on June 30, 2017:
11378.20
AUM (` In Crores)
AUM as on June 30, 2017:
11590.49
Available Plans/Options
A) B) Direct Plan Regular Plan
Options: Dividend Payout, Dividend Reinvestment & Growth (applicable for all plans)
Dividend Frequency
Trustee�s Discretion
Ratios
Portfolio Turnover: 39.49% $Beta: 1.02$ ##Sharpe : 0.86$Standard Deviation : 13.98%
$Source: ICRA MFI Explorer.
## Risk rate assumed to be 6.25% ( FBIL Overnight MIBOR rate as on 30th June 2017)
Minimum Investment Amount
Initial Investment: `5000 and in multiple of `1 for purchase and for `0.01 for switches
Additional Investment: `1000 & in multiples of 1
Ideal Investments Horizon: 3 years & above
Load Structure
Entry Load: Nil. (applicable for all plans)
Exit Load:
I) For redemptions / switch outs (including SIP/STP) within 1 year from the date of allotment of units, irrespective of the amount of investment:1%
ii) For redemptions / switch outs (including SIP/STP) after 1 year from the date of allotment of units, irrespective of the amount of investment: NIL
iii) Any exit load charged (net off Service Tax, if any) shall be credited back to the respective Scheme. (applicable for all plans)
iv) Units issued on reinvestment of dividends shall not be subject to exit load (applicable for all plans)
Total Expense Ratio**
Regular: 1.98%
Direct: 1.00%
**Total Expense Ratio excludes applicable B15 fee and service tax.
SYSTEMATIC INVESTMENT PLAN (SIP)
Scheme Inception : - September 11, 2009. The returns are calculated by XIRR approach assuming investment of 10,000/- on the 1st working `day of every month. XIRR helps in calculating return on investments given an initial and final value and a series of cash inflows and outflows and taking the time of investment into consideration. Since inception returns are assumed to be starting from the beginning of the subsequent month from the date of inception. # Benchmark ; Additional Benchmark
Kotak Select Focus Fund NAV as on June 30, 2017: ` 23.029 (Dividend Option), ` 24.119 (Direct Dividend Option), ` 30.248 (Growth Option), `31.555 (Direct Growth Option)
Notes: Term Deposit as provided above is towards margin for derivatives transactions
Equity & Equity related (Listed/Awaiting listing on Stock Exchange) HDFC Bank Ltd. Banks 6.41 ITC Ltd. Consumer Non Durables 5.31 Reliance Industries Ltd. Petroleum Products 4.52 State Bank Of India Banks 4.05 Hero MotoCorp Ltd. Auto 3.99 Maruti Suzuki India Limited Auto 3.42 IndusInd Bank Ltd. Banks 3.25 ICICI Bank Ltd. Banks 3.17 Ultratech Cement Ltd. Cement 2.99 GAIL (India) Ltd. Gas 2.68 HDFC Ltd. Finance 2.51 The Ramco Cements Ltd Cement 2.40 Larsen And Toubro Ltd. Construction Project 2.33 Shree Cement Ltd. Cement 2.27 Axis Bank Ltd Banks 1.99 Bharat Electronics Ltd Industrial Capital Goods 1.99 Hindustan Petroleum Corporation Ltd Petroleum Products 1.98 Bajaj Finance Limited Finance 1.93 Indraprastha Gas Ltd. Gas 1.91 Mahindra & Mahindra Ltd. Auto 1.86 Petronet LNG Ltd. Gas 1.84 Britannia Industries Ltd. Consumer Non Durables 1.75 Infosys Ltd. Software 1.70 Max Financial Services Ltd. Finance 1.70 Arvind Ltd Textile Products 1.55 ICICI Prudential Life Insurance Company Ltd Finance 1.36 RBL Bank Ltd Banks 1.26 MRF Limited Auto Ancillaries 1.11 Bharat Petroleum Corporation Ltd. Petroleum Products 1.09 Godrej Consumer Products Ltd. Consumer Non Durables 1.05 Bayer Cropscience Ltd. Pesticides 1.04 Tata Motors Ltd. Auto 1.04 Cadila Healthcare Ltd. Pharmaceuticals 0.95
Bajaj Finserv Ltd. Finance 0.93 Federal Bank Ltd. Banks 0.86 Equitas Holdings Ltd Finance 0.79 HCL Technologies Ltd. Software 0.79 Container Corporation of India Ltd. Transportation 0.68 Jk Lakshmi Cement Ltd. Cement 0.66 Ashok Leyland Ltd. Auto 0.65 Laurus Labs Ltd Pharmaceuticals 0.65 Sun Pharmaceuticals Industries Ltd. Pharmaceuticals 0.65 Lupin Ltd. Pharmaceuticals 0.62 Kec International Ltd. Construction Project 0.58 Techno Electric & Engineering Co Ltd. Construction Project 0.57 AIA Engineering Limited Industrial Products 0.47 Solar Industries India Limited Chemicals 0.47 Bata India Ltd. Consumer Durables 0.46 Bank Of Baroda Banks 0.35 Max India Limited Healthcare Services 0.30 Whirlpool of India Ltd. Consumer Durables 0.27 HDFC Ltd. Warrants Finance 0.25 Navkar Corporation Limited Transportation 0.23 Avenue Supermarts Ltd Retailing 0.21 Kirloskar Oil Engines Ltd. Industrial Products 0.15 6 Redm Preference Sh Zee Entertainment Enterprises Ltd Media and Entertainment 0.01 Listed/Awaiting Listing on Stock Exchange - Total 90.00 Futures CNX NIFTY-JUL2017 2.36 RBL Bank Ltd-JUL2017 0.53 Futures (Market value represents Notional Value) - Total 2.89 TERM DEPOSITS AXIS Bank Ltd. 1.04 Term Deposits - Total 1.04 Collateral Borrowing & Lending obligation 3.75 Net Current Assets/(Liabilities) 2.32 Grand Total 100.00
This product is suitable for investors who are seeking*:� Long term capital growth� Investment in portfolio of predominantly equity & equity related securities
generally focussed on a few selected sectors.* Investors should consult their financial advisors if in doubt about whether the product is suitable for them.
PRODUCT LABEL
Investors understand that their principal will be at moderately high risk
Riskometer
yletaredo
M
Moderate
Low
High
Low
High
LOW HIGH
Moderately
INVESTMENT STYLE
Value Blend Growth Size
Large
Mid
Small
Style
SECTOR ALLOCATION (%)
20.27
10.82
9.43
8.327.77.38
6.68
4.994.95
4.48
14.98
8For last three dividends, please refer page no 56-58. For scheme performance, please refer page no 45-53 * For Fund Manager experience, please refer page 54-55.
(As on June 30, 2017)
1 year 3 years 5 years 7 years Since Inception
1,20,000 3,60,000 6,00,000 8,40,000 9,40,000
1,34,283 4,65,758 10,23,153 16,60,901 19,53,284
22.96 17.49 21.51 19.14 18.19
1,31,643 4,25,454 8,40,713 12,87,418 14,82,738
18.61 11.17 13.47 12.00 11.38
1,30,496 4,12,973 7,98,527 12,21,347 14,11,228
1 6.73 9.14 11.39 10.52 10.15
Systematic Investment Plan (SIP) If you had invested `10,000 every month
Monthly SIP of Rs 10000
Total amount invested (Rs)
Total Value as on June 30, 2017(Rs)
Scheme Returns (%)
Nifty 200 (Rs)#
Nifty 200 Returns (%)
Nifty 50 (Rs)^
Nifty 50 Returns (%)
BanksAuto
CBLO & Term Deposits & Rev.RepoCementFinance
Petroleum Products
Consumer Non Durables
Gas
Derivatives
Others Construction Project
21.34
10.96
9.478.328.11
7.59
6.43
4.79
3.48
2.89
16.62

KOTAK TAX SAVERAn Open - Ended Equity Linked Savings Scheme
Investment Objective
To generate long-term capital appreciation from a diversified portfolio of equity and equity related securities and enable investors to avail the income tax rebate, as permitted from time to time. However, there is no assurance that the objective of the scheme will be realized.
Allotment Date
November 23, 2005
Fund Manager
Mr. Harsha Upadhyaya*
Benchmark
Nifty 500
AAUM (` In Crores)
AAUM as on June 30, 2017:
`652.51
AUM (` In Crores)
AUM as on June 30, 2017:
`646.86
Available Plans/Options
A) B) Direct Plan Regular Plan
Options: Dividend Payout & Growth ( a p p l i c a b l e f o r a l l p l a n s ) . . . . . .
Dividend Frequency
Trustee�s Discretion
Ratios
Portfolio Turnover: 52.53% $Beta: 1.09$ ##Sharpe : 0.73$Standard Deviation : 14.99%
$Source: ICRA MFI Explorer.
## Risk rate assumed to be 6.25% ( FBIL Overnight MIBOR rate as on 30th June 2017)
Minimum Investment Amount
Initial Investment: `500 and in multiple of `500
Additional Investment: `500 & in multiples of 500
Ideal Investments Horizon: 3 years & above
Load Structure
Entry Load: Nil. (applicable for all plans)
Exit Load: Exit Load is not applicable for Kotak Tax Saver Scheme. (applicable for all plans)
Units issued on reinvestment of dividends shall not be subject to exit load (applicable for all plans)
Total Expense Ratio**
Regular: 2.39%Direct: 1.16%
**Total Expense Ratio excludes applicable B15 fee and service tax.
EQUITY SCHEMES
9
SYSTEMATIC INVESTMENT PLAN (SIP)
Scheme Inception : - November 23, 2005. The returns are calculated by XIRR approach assuming investment of 10,000/- on the 1st working `day of every month. XIRR helps in calculating return on investments given an initial and final value and a series of cash inflows and outflows and taking the time of investment into consideration. Since inception returns are assumed to be starting from the beginning of the subsequent month from the date of inception. # Benchmark ; Additional BenchmarkKotak Tax Saver NAV as on June 30, 2017: `19.099 (Dividend Option), `21.916 (Direct Dividend Option), ` 38.731 (Growth Option), ` 41.060 (Direct Growth Option)
INVESTMENT STYLE
Value Blend Growth Size
Large
Mid
Small
Style
Issuer/Instrument Industry/Rating % to Net Assets
Issuer/Instrument Industry/Rating % to Net Assets
AIA Engineering Limited Industrial Products 1.08 SRF Ltd. Textile Products 1.07 Navneet Education Ltd. Media and Entertainment 1.04 HCL Technologies Ltd. Software 1.03 Ashok Leyland Ltd. Auto 1.02 SpiceJet Ltd. Transportation 1.02 Multi Commodity Exchange of India Limited Finance 1.01 Strides Shasun Ltd. Pharmaceuticals 1.01 Bata India Ltd. Consumer Durables 1.00 Linde India Ltd. Chemicals 1.00 AU Small Finance Bank Ltd. Banks 0.93 S Chand And Company Ltd Media and Entertainment 0.91 Tejas Networks Ltd Telecom - Equipment & Accessories 0.91 Container Corporation of India Ltd. Transportation 0.89 Bank Of Baroda Banks 0.87 Sun Pharmaceuticals Industries Ltd. Pharmaceuticals 0.86 Mahindra & Mahindra Ltd. Auto 0.83 Lupin Ltd. Pharmaceuticals 0.82 Thermax Ltd. Industrial Capital Goods 0.80 Hawkins Cooker Ltd Household Appliances 0.68 Blue Dart Express Ltd. Transportation 0.62 LIC Housing Finance Ltd. Finance 0.57 KSB Pump Ltd Industrial Products 0.46 Cummins India Ltd. Industrial Products 0.43 6% Redm Preference Sh Zee Entertainment Enterprises Ltd Media and Entertainment 0.12 Listed/Awaiting Listing on Stock Exchange - Total 98.82 Debt Instruments Debentures and Bonds Corporate Debt/Financial Institutions Blue Dart Express Ltd ICRA AA 0.02 Corporate Debt/Financial Institutions - Total 0.02 Collateral Borrowing & Lending obligation 1.43 Net Current Assets/(Liabilities) -0.27 Grand Total 100.00
PORTFOLIO
Equity & Equity related (Listed/Awaiting listing on Stock Exchange) HDFC Bank Ltd. Banks 6.13 Reliance Industries Ltd. Petroleum Products 4.42 ITC Ltd. Consumer Non Durables 4.02 Hero MotoCorp Ltd. Auto 3.43 IndusInd Bank Ltd. Banks 3.20 Shree Cement Ltd. Cement 3.15 ICICI Bank Ltd. Banks 2.84 Hindustan Petroleum Corporation Ltd Petroleum Products 2.76 Mahanagar Gas Ltd Gas 2.65 Infosys Ltd. Software 2.60 Dalmia Bharat Ltd. Cement 2.48 Ultratech Cement Ltd. Cement 2.45 RBL Bank Ltd Banks 2.39 Bharat Petroleum Corporation Ltd. Petroleum Products 2.37 Axis Bank Ltd Banks 2.36 State Bank Of India Banks 2.31 HDFC Ltd. Finance 2.25 GAIL (India) Ltd. Gas 2.10 Cadila Healthcare Ltd. Pharmaceuticals 2.03 Whirlpool of India Ltd. Consumer Durables 1.85 Larsen And Toubro Ltd. Construction Project 1.83 Techno Electric & Engineering Co Ltd. Construction Project 1.74 SKF India Ltd Industrial Products 1.70 The Ramco Cements Ltd Cement 1.61 UPL Ltd Pesticides 1.56 Solar Industries India Limited Chemicals 1.43 Tata Motors Ltd. Auto 1.41 Federal Bank Ltd. Banks 1.40 Bajaj Finance Limited Finance 1.38 Max Financial Services Ltd. Finance 1.32 Amara Raja Batteries Ltd. Auto Ancillaries 1.30 Laurus Labs Ltd Pharmaceuticals 1.14 Maruti Suzuki India Limited Auto 1.12 Arvind Ltd Textile Products 1.11
This product is suitable for investors who are seeking*:� long term capital growth with a 3 year lock in� Investment in portfolio of predominantly equity & equity related securities.* Investors should consult their financial advisors if in doubt about whether the product is suitable for them.
PRODUCT LABEL
Investors understand that their principal will be at moderately high risk
Riskometer
yletaredo
M
Moderate
Low
High
Low
High
LOW HIGH
Moderately
SECTOR ALLOCATION (%)
22.51
9.75
7.36.14
6.16.055.68
5.32
4.94
4.65
21.56
For last three dividends, please refer page no 56-58. For scheme performance, please refer page no 45-53* For Fund Manager experience, please refer page 54-55
Monthly SIP of Rs 10000
Total amount invested (Rs)
Total Value as on June 30, 2017 (Rs)
Scheme Returns (%)
Nifty 500 (Rs)#
Nifty 500 Returns (%)
Nifty 50 (Rs)^
Nifty 50 Returns (%)
1 year 3 years 5 years 7 years 10 years Since Inception
120,000 360,000 600,000 840,000 1,200,000 1,400,000
132,869 452,111 951,408 1,476,413 2,461,444 3,091,396
20.62 15.40 18.52 15.84 13.77 12.86
132,514 432,086 863,279 1,323,137 2,190,810 2,773,194
20.04 12.24 14.55 12.76 11.58 11.15
130,496 412,973 798,527 1,221,347 2,020,097 2,580,916
16.73 9.14 11.39 10.52 10.06 10.01
Systematic Investment Plan (SIP) If you had invested `10,000 every month
(As on June 30, 2017)
Banks Cement Petroleum Products
Auto Finance Consumer Non DurablesPharmaceuticals Gas
Software
Others
22.43
9.69
9.557.816.53
5.864.75
4.02
3.67
3.63
22.06
Industrial Products
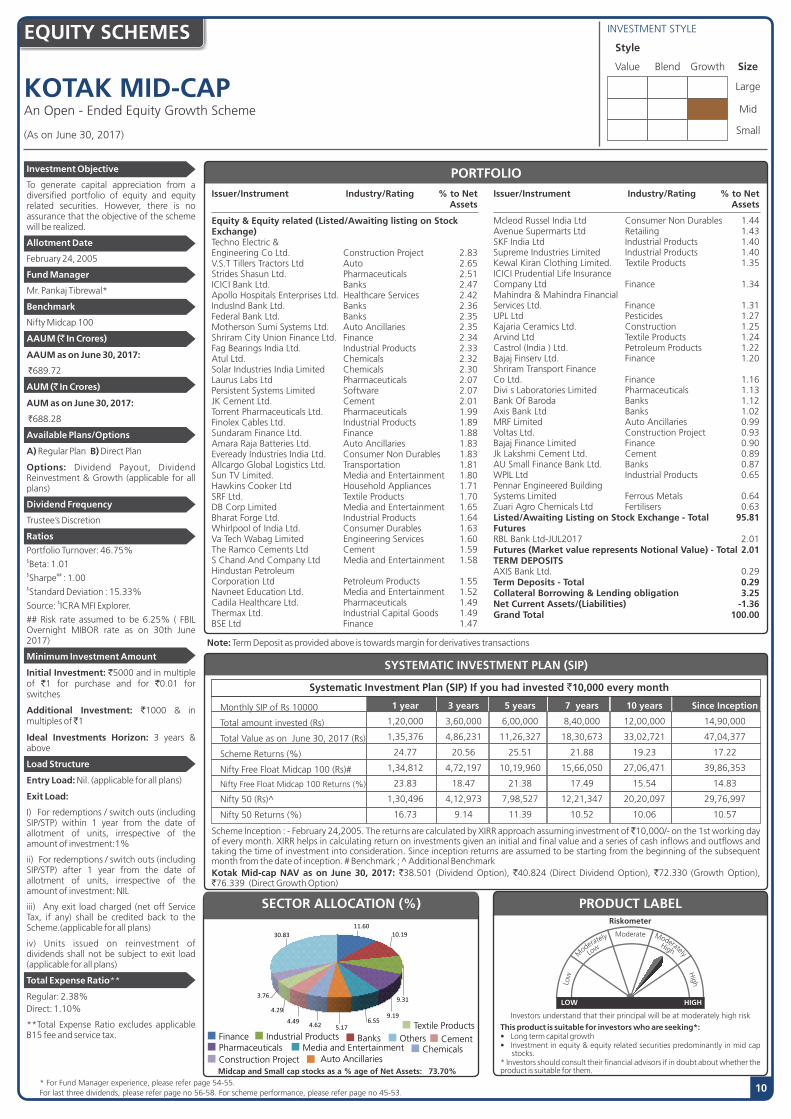
KOTAK MID-CAPAn Open - Ended Equity Growth Scheme
INVESTMENT STYLE
Investment Objective
To generate capital appreciation from a diversified portfolio of equity and equity related securities. However, there is no assurance that the objective of the scheme will be realized.
Allotment Date
February 24, 2005
Fund Manager
Mr. Pankaj Tibrewal*
Benchmark
Nifty Midcap 100
AAUM (` In Crores)
AAUM as on June 30, 2017:
689.72
AUM (` In Crores)
AUM as on June 30, 2017:
688.28
Available Plans/Options
A) B) Direct Plan Regular Plan
Options: Dividend Payout, Dividend Reinvestment & Growth (applicable for all plans)
Dividend Frequency
Trustee�s Discretion
Ratios
Portfolio Turnover: 46.75% $Beta: 1.01$ ##Sharpe : 1.00$Standard Deviation : 15.33%
$Source: ICRA MFI Explorer.
## Risk rate assumed to be 6.25% ( FBIL Overnight MIBOR rate as on 30th June 2017)
Minimum Investment Amount
Initial Investment: `5000 and in multiple of `1 for purchase and for `0.01 for switches
Additional Investment: `1000 & in multiples of 1
Ideal Investments Horizon: 3 years & above
Load Structure
Entry Load: Nil. (applicable for all plans)
Exit Load:
I) For redemptions / switch outs (including SIP/STP) within 1 year from the date of allotment of units, irrespective of the amount of investment:1%
ii) For redemptions / switch outs (including SIP/STP) after 1 year from the date of allotment of units, irrespective of the amount of investment: NIL
iii) Any exit load charged (net off Service Tax, if any) shall be credited back to the Scheme.(applicable for all plans)
iv) Units issued on reinvestment of dividends shall not be subject to exit load (applicable for all plans)
Total Expense Ratio**
Regular: 2.38%Direct: 1.10%
**Total Expense Ratio excludes applicable B15 fee and service tax.
StyleEQUITY SCHEMES
SYSTEMATIC INVESTMENT PLAN (SIP)
Scheme Inception : - February 24,2005. The returns are calculated by XIRR approach assuming investment of 10,000/- on the 1st working day `of every month. XIRR helps in calculating return on investments given an initial and final value and a series of cash inflows and outflows and taking the time of investment into consideration. Since inception returns are assumed to be starting from the beginning of the subsequent month from the date of inception. # Benchmark ; Additional BenchmarkKotak Mid-cap NAV as on June 30, 2017: `38.501 (Dividend Option), `40.824 (Direct Dividend Option), `72.330 (Growth Option), `76.339 (Direct Growth Option)
Value Blend Growth Size
Large
Mid
Small
Issuer/Instrument Industry/Rating % to Net Assets
Equity & Equity related (Listed/Awaiting listing on Stock Exchange) Techno Electric & Engineering Co Ltd. Construction Project 2.83 V.S.T Tillers Tractors Ltd Auto 2.65 Strides Shasun Ltd. Pharmaceuticals 2.51 ICICI Bank Ltd. Banks 2.47 Apollo Hospitals Enterprises Ltd. Healthcare Services 2.42 IndusInd Bank Ltd. Banks 2.36 Federal Bank Ltd. Banks 2.35 Motherson Sumi Systems Ltd. Auto Ancillaries 2.35 Shriram City Union Finance Ltd. Finance 2.34 Fag Bearings India Ltd. Industrial Products 2.33 Atul Ltd. Chemicals 2.32 Solar Industries India Limited Chemicals 2.30 Laurus Labs Ltd Pharmaceuticals 2.07 Persistent Systems Limited Software 2.07 JK Cement Ltd. Cement 2.01 Torrent Pharmaceuticals Ltd. Pharmaceuticals 1.99 Finolex Cables Ltd. Industrial Products 1.89 Sundaram Finance Ltd. Finance 1.88 Amara Raja Batteries Ltd. Auto Ancillaries 1.83 Eveready Industries India Ltd. Consumer Non Durables 1.83 Allcargo Global Logistics Ltd. Transportation 1.81 Sun TV Limited. Media and Entertainment 1.80 Hawkins Cooker Ltd Household Appliances 1.71 SRF Ltd. Textile Products 1.70 DB Corp Limited Media and Entertainment 1.65 Bharat Forge Ltd. Industrial Products 1.64 Whirlpool of India Ltd. Consumer Durables 1.63 Va Tech Wabag Limited Engineering Services 1.60 The Ramco Cements Ltd Cement 1.59 S Chand And Company Ltd Media and Entertainment 1.58 Hindustan Petroleum Corporation Ltd Petroleum Products 1.55 Navneet Education Ltd. Media and Entertainment 1.52 Cadila Healthcare Ltd. Pharmaceuticals 1.49 Thermax Ltd. Industrial Capital Goods 1.49 BSE Ltd Finance 1.47
Issuer/Instrument Industry/Rating % to Net Assets
Mcleod Russel India Ltd Consumer Non Durables 1.44 Avenue Supermarts Ltd Retailing 1.43 SKF India Ltd Industrial Products 1.40 Supreme Industries Limited Industrial Products 1.40 Kewal Kiran Clothing Limited. Textile Products 1.35 ICICI Prudential Life Insurance Company Ltd Finance 1.34 Mahindra & Mahindra Financial Services Ltd. Finance 1.31 UPL Ltd Pesticides 1.27 Kajaria Ceramics Ltd. Construction 1.25 Arvind Ltd Textile Products 1.24 Castrol (India ) Ltd. Petroleum Products 1.22 Bajaj Finserv Ltd. Finance 1.20 Shriram Transport Finance Co Ltd. Finance 1.16 Divi s Laboratories Limited Pharmaceuticals 1.13 Bank Of Baroda Banks 1.12 Axis Bank Ltd Banks 1.02 MRF Limited Auto Ancillaries 0.99 Voltas Ltd. Construction Project 0.93 Bajaj Finance Limited Finance 0.90 Jk Lakshmi Cement Ltd. Cement 0.89 AU Small Finance Bank Ltd. Banks 0.87 WPIL Ltd Industrial Products 0.65 Pennar Engineered Building Systems Limited Ferrous Metals 0.64 Zuari Agro Chemicals Ltd Fertilisers 0.63 Listed/Awaiting Listing on Stock Exchange - Total 95.81 Futures RBL Bank Ltd-JUL2017 2.01 Futures (Market value represents Notional Value) - Total 2.01 TERM DEPOSITS AXIS Bank Ltd. 0.29 Term Deposits - Total 0.29 Collateral Borrowing & Lending obligation 3.25 Net Current Assets/(Liabilities) -1.36 Grand Total 100.00
PORTFOLIO
This product is suitable for investors who are seeking*:� Long term capital growth� Investment in equity & equity related securities predominantly in mid cap
stocks.* Investors should consult their financial advisors if in doubt about whether the product is suitable for them.
PRODUCT LABEL
Investors understand that their principal will be at moderately high risk
Riskometer
yletaredo
M
Moderate
Low
High
Low
High
LOW HIGH
Moderately
SECTOR ALLOCATION (%)
For last three dividends, please refer page no 56-58. For scheme performance, please refer page no 45-53.* For Fund Manager experience, please refer page 54-55.
Monthly SIP of Rs 10000
Total amount invested (Rs)
Total Value as on June 30, 2017 (Rs)
Scheme Returns (%)
Nifty Free Float Midcap 100 (Rs)#
Nifty Free Float Midcap 100 Returns (%)
Nifty 50 (Rs)^
Nifty 50 Returns (%)
1 year 3 years 5 years 7 years 10 years Since Inception
1,20,000 3,60,000 6,00,000 8,40,000 12,00,000 14,90,000
1,35,376 4,86,231 11,26,327 18,30,673 33,02,721 47,04,377
24.77 20.56 25.51 21.88 19.23 17.22
1,34,812 4,72,197 10,19,960 15,66,050 27,06,471 39,86,353
23.83 18.47 21.38 17.49 15.54 14.83
1,30,496 4,12,973 7,98,527 12,21,347 20,20,097 29,76,997
16.73 9.14 11.39 10.52 10.06 10.57
Systematic Investment Plan (SIP) If you had invested `10,000 every month
10
(As on June 30, 2017)
Note: Term Deposit as provided above is towards margin for derivatives transactions
Finance Industrial Products BanksPharmaceuticals Media and Entertainment Chemicals
Cement
Textile Products
Construction Project
Others
Midcap and Small cap stocks as a % age of Net Assets: 73.70%
11.6010.19
9.31
9.196.55
5.174.624.49
4.29
3.76
30.83
Auto Ancillaries

EQUITY SCHEMES
KOTAK EMERGING EQUITYAn Open - Ended Equity Growth Scheme
INVESTMENT STYLE
Investment Objective
The investment objective of the scheme is to generate long-term capital appreciation from a portfolio of equity and equity related securities, by investing predominantly in mid and small cap companies. However, there is no assurance that the objective of the scheme will be realized.
Allotment Date
March 30, 2007
Fund Manager
Mr. Pankaj Tibrewal*
Benchmark
S&P BSE MID SMALL CAP
AAUM (` In Crores)
AAUM as on June 30, 2017:
2025.81
AUM (` In Crores)
AUM as on June 30, 2017:
2043.78
Available Plans/Options
A) B) Direct Plan Regular Plan
Options: Dividend Payout, Dividend Reinvestment & Growth (applicable for all plans)
Dividend Frequency
Trustee�s Discretion
Ratios
Portfolio Turnover: 30.69%$Beta: 0.93$ ##Sharpe :1.17$Standard Deviation : 15.05%
$Source: ICRA MFI Explorer.
## Risk rate assumed to be 6.25% ( FBIL Overnight MIBOR rate as on 30th June 2017)
Minimum Investment Amount
Initial Investment: `5000 and in multiple of `1 for purchase and for `0.01 for switches
Additional Investment: `1000 & in multiples of 1
Ideal Investments Horizon: 3 years & above
Load Structure
Entry Load: Nil. (applicable for all plans)
Exit Load:
i) For redemptions / switch outs (including SIP/STP) within 1 year from the date of allotment of units, irrespective of the amount of investment: 1%.
ii) For redemption/switch outs (including SIP/STP) after 1 year from the date of allotment of units, irrespective of the amount of investment: Nil.
Note � Any exit load charged (net off Service Tax, if any) shall be credited back to the respective scheme. Units issued on reinvestment of dividends shall not be subject to entry and exit load.
Total Expense Ratio**
Regular:2.10%
Direct: 0.89%
**Total Expense Ratio excludes applicable B15 fee and service tax.
Value Blend Growth Size
Large
Mid
Small
Style
11
SYSTEMATIC INVESTMENT PLAN (SIP)
Issuer/Instrument Industry/Rating % to Net Assets
Issuer/Instrument Industry/Rating % to Net Assets
PORTFOLIO
Equity & Equity related (Listed/Awaiting listing on Stock Exchange) IndusInd Bank Ltd. Banks 3.33 Fag Bearings India Ltd. Industrial Products 2.94 Federal Bank Ltd. Banks 2.49 Apollo Hospitals Enterprises Ltd. Healthcare Services 2.47 Motherson Sumi Systems Ltd. Auto Ancillaries 2.37 Strides Shasun Ltd. Pharmaceuticals 2.31 Bata India Ltd. Consumer Durables 2.21 Atul Ltd. Chemicals 2.18 Persistent Systems Limited Software 2.17 Navneet Education Ltd. Media and Entertainment 2.11 Bharat Earth Movers Ltd. Industrial Capital Goods 2.08 Sundaram Finance Ltd. Finance 2.03 Shriram City Union Finance Ltd. Finance 2.02 Solar Industries India Limited Chemicals 2.01 Finolex Cables Ltd. Industrial Products 2.00 Whirlpool of India Ltd. Consumer Durables 1.95 Kirloskar Oil Engines Ltd. Industrial Products 1.90 ICICI Bank Ltd. Banks 1.87 Kajaria Ceramics Ltd. Construction 1.87 V-Guard Industries Ltd. Industrial Capital Goods 1.86 Coromandel International Ltd. Fertilisers 1.76 SKF India Ltd Industrial Products 1.72 Allcargo Global Logistics Ltd. Transportation 1.71 Ramkrishna Forgings Ltd. Industrial Products 1.71 SRF Ltd. Textile Products 1.71 Kewal Kiran Clothing Limited. Textile Products 1.68 Amara Raja Batteries Ltd. Auto Ancillaries 1.64 Eveready Industries India Ltd. Consumer Non Durables 1.64 Hawkins Cooker Ltd Household Appliances 1.61 Torrent Pharmaceuticals Ltd. Pharmaceuticals 1.60 The Ramco Cements Ltd Cement 1.59 Va Tech Wabag Limited Engineering Services 1.59 DB Corp Limited Media and Entertainment 1.58 Thermax Ltd. Industrial Capital Goods 1.58 Laurus Labs Ltd Pharmaceuticals 1.57 Britannia Industries Ltd. Consumer Non Durables 1.54 Bank Of Baroda Banks 1.49
Mahindra & Mahindra Financial Services Ltd. Finance 1.49 Carborundum Universal Ltd. Industrial Products 1.35 Supreme Industries Limited Industrial Products 1.33 Equitas Holdings Ltd Finance 1.32 Zee Entertainment Enterprises Ltd Media and Entertainment 1.30 Oberoi Realty Ltd Construction 1.22 ICICI Prudential Life Insurance Company Ltd Finance 1.20 PNC INFRATECH LIMITED Construction 1.19 Kec International Ltd. Construction Project 1.10 Shriram Transport Finance Co Ltd. Finance 1.02 Castrol (India ) Ltd. Petroleum Products 0.96 Divi s Laboratories Limited Pharmaceuticals 0.96 Jk Lakshmi Cement Ltd. Cement 0.92 Bajaj Finance Limited Finance 0.87 Indraprastha Gas Ltd. Gas 0.80 RBL Bank Ltd Banks 0.77 Zuari Agro Chemicals Ltd Fertilisers 0.76 Kirloskar Brothers Ltd. Industrial Products 0.74 D-Link (India) Ltd Hardware 0.71 Maharashtra Seamless Ltd. Ferrous Metals 0.70 Pennar Engineered Building Systems Limited Ferrous Metals 0.62 Sheela Foam Ltd Consumer Durables 0.59 WPIL Ltd Industrial Products 0.49 Listed/Awaiting Listing on Stock Exchange - Total 94.30 Futures RBL Bank Ltd-JUL2017 1.14 Futures (Market value represents Notional Value) - Total 1.14 TERM DEPOSITS AXIS Bank Ltd. 0.73 Term Deposits - Total 0.73 Collateral Borrowing & Lending obligation 4.70 Net Current Assets/(Liabilities) -0.87 Grand Total 100.00
Scheme Inception : - March 30, 2007. The returns are calculated by XIRR approach assuming investment of 10,000/- on the 1st working day of `every month. XIRR helps in calculating return on investments given an initial and final value and a series of cash inflows and outflows and taking the time of investment into consideration. Since inception returns are assumed to be starting from the beginning of the subsequent month from the date of inception. # Benchmark ; Additional BenchmarkKotak Emerging Equity NAV as on June 30, 2017:`24.774 (Dividend Option), `27.872 (Direct Dividend Option), `36.246 (Growth Option), `38.101 (Direct Growth Option)
This product is suitable for investors who are seeking*:� Long term capital growth� Investment in equity & equity related securities predominantly in mid &
small cap companies* Investors should consult their financial advisors if in doubt about whether the product is suitable for them.
PRODUCT LABEL
Investors understand that their principal will be at moderately high risk
Riskometer
yletaredo
M
Moderate
Low
High
Low
High
LOW HIGH
Moderately
SECTOR ALLOCATION (%)
Midcap and Small cap stocks as a % age of Net Assets: 88.17%
11 For last three dividends, please refer page no 56-58. For scheme performance, please refer page no 45-53.* For Fund Manager experience, please refer page 54-55.
(As on June 30, 2017)
Note: Term Deposit as provided above is towards margin for derivatives transactions
1 year 3 years 5 years 7 years 10 years Since Inception
120,000 360,000 600,000 840,000 1,200,000 1,240,000
135,046 492,628 1,196,255 1,965,941 3,425,666 3,567,393
24.22 21.51 28.04 23.89 19.91 19.36
136,585 476,539 1,024,461 1,563,883 2,623,763 2,745,313
26.79 19.12 21.57 17.45 14.96 14.67
130,496 412,973 798,527 1,221,347 2,020,097 2,115,902
16.73 9.14 11.39 10.52 10.06 9.97
Systematic Investment Plan (SIP) If you had invested `10,000 every month
Monthly SIP of Rs 10000
Total amount invested (Rs)
Total Value as on June 30, 2017(Rs)
Scheme Returns (%)
S&P BSE MidSmallCap (Rs)#
S&P BSE MidSmallCap Returns (%)
Nifty 50 (Rs)^
Nifty 50 Returns (%)
Industrial Products Finance BanksCBLO & Term Deposits & Rev.Repo Pharmaceuticals
Media and EntertainmentConstruction Chemicals Consumer Durables
Others
14.18
9.95
9.95
6.44
5.525.434.994.75
4.28
4.19
30.32
Industrial Capital Goods
EQUITY SCHEMES
KOTAK INFRASTRUCTURE & ECONOMIC REFORM FUNDAn Open - Ended Equity Scheme
Issuer/Instrument Industry/Rating % to Net Assets
Issuer/Instrument Industry/Rating % to Net Assets
Investment Objective
The investment objective of the Scheme is to generate long-term capital appreciation f rom a d i ve r s i f i ed po r t fo l i o o f predominantly (at least 65%) equity and equity-related securities of companies involved in economic development of India as a result of potential investments in infrastructure and unfolding economic reforms.However, there is no assurance that the objective of the scheme will be realized.
Allotment Date
February 25, 2008
Fund Manager
Mr. Harish Krishnan
Benchmark
S&P BSE � 100
AAUM (` In Crores)
AAUM as on June 30, 2017:
289.68
AUM (` In Crores)
AUM as on June 30, 2017:
293.37
Available Plans/Options
A) Regular Plan B) Direct Plan
Options: Dividend Payout, Dividend Reinvestment & Growth (applicable for all plans)
Dividend Frequency
Trustee�s Discretion
Ratios
Portfolio Turnover: 42.70%$Beta: 0.91$ ##Sharpe :0.68$Standard Deviation : 14.92%
$Source: ICRAMFI Explorer.
## Risk rate assumed to be 6.25% ( FBIL Overnight MIBOR rate as on 30th June 2017)
Minimum Investment Amount
Initial Investment: `5000 and in multiple of `1 for purchase and for `0.01 for switches
Additional Investment: `1000 & in multiples of 1
Ideal Investments Horizon: 3 years & above
Load Structure
Entry Load: Nil. (applicable for all plans)
Exit Load:
I) For redemptions / switch outs (including SIP/STP) within 1 year from the date of allotment of units, irrespective of the amount of investment � 1%;
ii) For redemptions / switch outs (including SIP/STP) after 1 year from the date of allotment of units, irrespective of the amount of investment � NIL;
iii) Any exit load charged (net off Service Tax, if any) shall be credited back to the Scheme;
iv) Units issued on reinvestment of dividends shall not be subject to entry and exit load. (applicable for all plans)
Total Expense Ratio**
Regular: 2.54%Direct: 1.14%
**Total Expense Ratio excludes applicable B15 fee and service tax.
(formerly known as �PineBridge Infrastructure & Economic Reform Fund�)
12
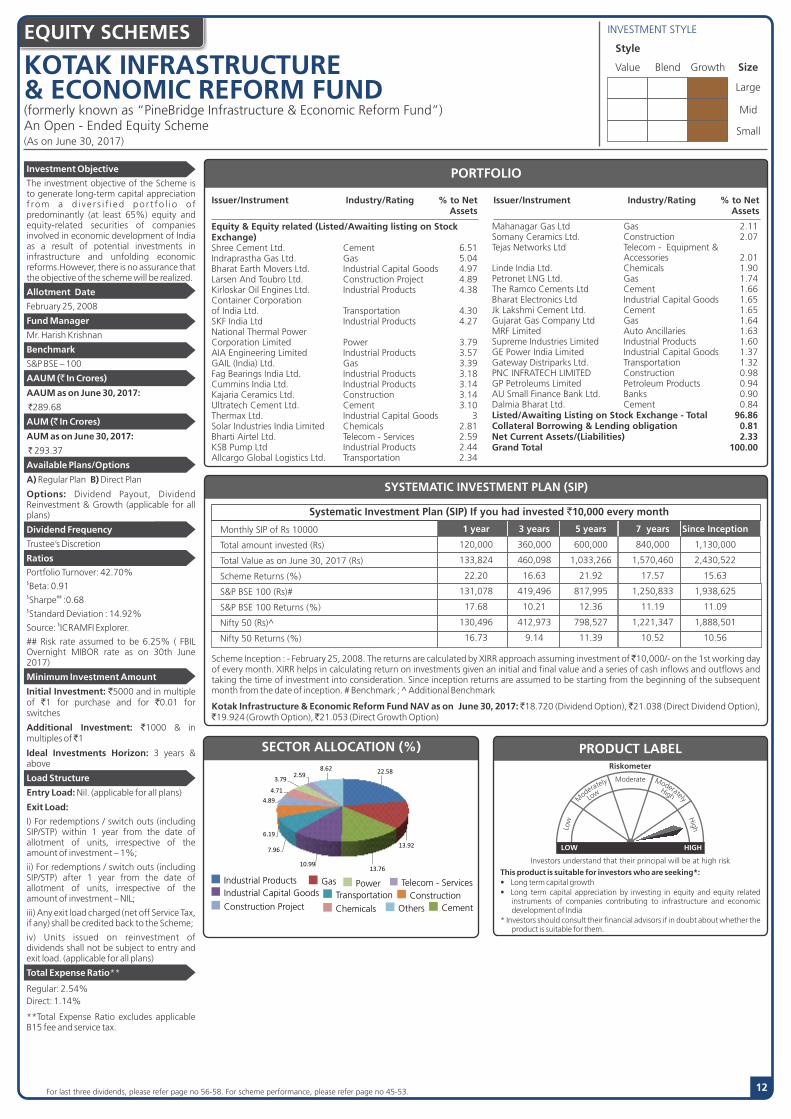
Equity & Equity related (Listed/Awaiting listing on Stock Exchange) Shree Cement Ltd. Cement 6.51 Indraprastha Gas Ltd. Gas 5.04 Bharat Earth Movers Ltd. Industrial Capital Goods 4.97 Larsen And Toubro Ltd. Construction Project 4.89 Kirloskar Oil Engines Ltd. Industrial Products 4.38 Container Corporation of India Ltd. Transportation 4.30 SKF India Ltd Industrial Products 4.27 National Thermal Power Corporation Limited Power 3.79 AIA Engineering Limited Industrial Products 3.57 GAIL (India) Ltd. Gas 3.39 Fag Bearings India Ltd. Industrial Products 3.18 Cummins India Ltd. Industrial Products 3.14 Kajaria Ceramics Ltd. Construction 3.14 Ultratech Cement Ltd. Cement 3.10 Thermax Ltd. Industrial Capital Goods 3 Solar Industries India Limited Chemicals 2.81 Bharti Airtel Ltd. Telecom - Services 2.59 KSB Pump Ltd Industrial Products 2.44 Allcargo Global Logistics Ltd. Transportation 2.34
Mahanagar Gas Ltd Gas 2.11 Somany Ceramics Ltd. Construction 2.07 Tejas Networks Ltd Telecom - Equipment & Accessories 2.01 Linde India Ltd. Chemicals 1.90 Petronet LNG Ltd. Gas 1.74 The Ramco Cements Ltd Cement 1.66 Bharat Electronics Ltd Industrial Capital Goods 1.65 Jk Lakshmi Cement Ltd. Cement 1.65 Gujarat Gas Company Ltd Gas 1.64 MRF Limited Auto Ancillaries 1.63 Supreme Industries Limited Industrial Products 1.60 GE Power India Limited Industrial Capital Goods 1.37 Gateway Distriparks Ltd. Transportation 1.32 PNC INFRATECH LIMITED Construction 0.98 GP Petroleums Limited Petroleum Products 0.94 AU Small Finance Bank Ltd. Banks 0.90 Dalmia Bharat Ltd. Cement 0.84 Listed/Awaiting Listing on Stock Exchange - Total 96.86 Collateral Borrowing & Lending obligation 0.81 Net Current Assets/(Liabilities) 2.33 Grand Total 100.00
PORTFOLIO
SYSTEMATIC INVESTMENT PLAN (SIP)
Scheme Inception : - February 25, 2008. The returns are calculated by XIRR approach assuming investment of 10,000/- on the 1st working day `of every month. XIRR helps in calculating return on investments given an initial and final value and a series of cash inflows and outflows and taking the time of investment into consideration. Since inception returns are assumed to be starting from the beginning of the subsequent month from the date of inception. # Benchmark ; Additional Benchmark
Kotak Infrastructure & Economic Reform Fund NAV as on June 30, 2017: 18.720 (Dividend Option), 21.038 (Direct Dividend Option), `19.924 (Growth Option), 21.053 (Direct Growth Option)
This product is suitable for investors who are seeking*:� Long term capital growth� Long term capital appreciation by investing in equity and equity related
instruments of companies contributing to infrastructure and economic development of India
* Investors should consult their financial advisors if in doubt about whether the product is suitable for them.
PRODUCT LABEL
Investors understand that their principal will be at high risk
Riskometer
yletaredo
M
Moderate
Low
High
Low
High
LOW HIGH
Moderately
INVESTMENT STYLE
Value Blend Growth Size
Large
Mid
Small
Style
SECTOR ALLOCATION (%)
32.53
14.697.53
7.09
7.03
4.814.04
5.93
29.12
14.3
10.617.49
6.94
6.9
5.644.3
7.78
For last three dividends, please refer page no 56-58. For scheme performance, please refer page no 45-53.
(As on June 30, 2017)
29.24
14.518.37
7.78
6.34
6.264.36
5.62
1 year 3 years 5 years 7 years Since Inception
120,000 360,000 600,000 840,000 1,130,000
133,824 460,098 1,033,266 1,570,460 2,430,522
22.20 16.63 21.92 17.57 15.63
131,078 419,496 817,995 1,250,833 1,938,625
17.68 10.21 12.36 11.19 11.09
130,496 412,973 798,527 1,221,347 1,888,501
16.73 9.14 11.39 10.52 10.56
Systematic Investment Plan (SIP) If you had invested `10,000 every month
Monthly SIP of Rs 10000
Total amount invested (Rs)
Total Value as on June 30, 2017 (Rs)
Scheme Returns (%)
S&P BSE 100 (Rs)#
S&P BSE 100 Returns (%)
Nifty 50 (Rs)^
Nifty 50 Returns (%)
Industrial Products
Cement
GasIndustrial Capital Goods Transportation ConstructionConstruction Project Chemicals
Power
Others
22.58
13.92
13.7610.99
7.96
6.19
4.89
4.71
3.792.59
8.62
Telecom - Services
KOTAK BALANCEAn Open - Ended Balanced Scheme
Investment Objective
To achieve growth by investing in equity & equity related instruments, balanced with income generation by investing in debt &money market instruments. However, there is no assurance that the objective of the scheme will be realized.
Allotment Date
November 25, 1999
Fund Managers
Mr. Pankaj Tibrewal and Mr. Abhishek Bisen*
Benchmark
Crisil Balanced Fund
AAUM (` In Crores)
AAUM as on June 30, 2017:
1619.16
AUM (` In Crores)
AUM as on June 30, 2017:
1686.04
Available Plans/Options
A) B) Direct Plan Regular Plan
Options: Dividend Payout, Dividend Reinvestment & Growth (applicable for all plans)
Dividend Frequency
Half Yearly (25th of Mar/Sep)
Ratios
Portfolio Turnover: 18.22% $Beta: 1.17$ ##Sharpe : 0.52$Standard Deviation : 10.74%
$Source: ICRA MFI Explorer.
## Risk rate assumed to be 6.25% ( FBIL Overnight MIBOR rate as on 30th June 2017)
Minimum Investment Amount
Initial Investment: `5000 and in multiple of `1 for purchase and for `0.01 for switches
Additional Investment: `1000 & in multiples of 1
Ideal Investments Horizon: 3 years & above
Load Structure
Entry Load: Nil. (applicable for all plans)
Exit Load:
i) For redemption/switch out of upto 10% of the initial investment amount (limit) purchased or switched in within 1 year from the date of allotment: Nil.
ii) If units redeemed or switched out are in excess of the limit within 1 year from the date of allotment: 1%.
iii) If units are redeemed or switched out on or alter 1 year from the date of allotment: Nil.
iv) Any exit load charged (net off Service Tax, if any) shall be credited back to the respective Scheme. (applicable for all plans)
v) Units issued on reinvestment of dividends shall not be subject to exit load (applicable for all plans)
Total Expense Ratio**
Regular:2.14%
Direct: 0.94%
**Total Expense Ratio excludes applicable B15 fee and service tax.
EQUITY SCHEMES INVESTMENT STYLE
Short Medium Long Volatility
Low
Medium
High
Maturity
Value Blend Growth Size
Large
Mid
Small
Style
Issuer/Instrument Industry/Rating % to Net AssetsEquity & Equity related (Listed/Awaiting listing on Stock Exchange) State Bank Of India Banks 2.84 ICICI Bank Ltd. Banks 2.47 HDFC Bank Ltd. Banks 2.18 Tata Motors Ltd. Auto 1.93 V.S.T Tillers Tractors Ltd Auto 1.82 Fag Bearings India Ltd. Industrial Products 1.80 Larsen And Toubro Ltd. Construction Project 1.75 GAIL (India) Ltd. Gas 1.68 Apollo Hospitals Enterprises Ltd. Healthcare Services 1.59 Zee Entertainment Enterprises Ltd Media and Entertainment 1.57 Motherson Sumi Systems Ltd. Auto Ancillaries 1.55 Axis Bank Ltd Banks 1.53 Infosys Ltd. Software 1.50 Maruti Suzuki India Limited Auto 1.49 IndusInd Bank Ltd. Banks 1.40 Thermax Ltd. Industrial Capital Goods 1.40 Strides Shasun Ltd. Pharmaceuticals 1.39 Bank Of Baroda Banks 1.36 ITC Ltd. Consumer Non Durables 1.36 JK Cement Ltd. Cement 1.29 GlaxoSmithkline Consumer Healthcare Ltd Consumer Non Durables 1.28 Atul Ltd. Chemicals 1.25 Kajaria Ceramics Ltd. Construction 1.24 Techno Electric & Engineering Co Ltd. Construction Project 1.21 Laurus Labs Ltd Pharmaceuticals 1.13 Gujarat Gas Company Ltd Gas 1.10 Whirlpool of India Ltd. Consumer Durables 1.04 HDFC Ltd. Finance 1.03 Mahindra & Mahindra Ltd. Auto 1.01 S Chand And Company Ltd Media and Entertainment 1.01 Sun TV Limited. Media and Entertainment 1.01 Mcleod Russel India Ltd Consumer Non Durables 0.91 Reliance Industries Ltd. Petroleum Products 0.88 HCL Technologies Ltd. Software 0.86 ICICI Prudential Life Insurance Company Ltd Finance 0.86 DB Corp Limited Media and Entertainment 0.82 Eris Lifesciences Ltd Pharmaceuticals 0.82 Cipla Ltd. Pharmaceuticals 0.81 Finolex Cables Ltd. Industrial Products 0.80 BSE Ltd Finance 0.79 Bharat Forge Ltd. Industrial Products 0.77 Solar Industries India Limited Chemicals 0.76 Federal Bank Ltd. Banks 0.73 Persistent Systems Limited Software 0.71 SRF Ltd. Textile Products 0.71 Shriram Transport Finance Co Ltd. Finance 0.70 Kirloskar Oil Engines Ltd. Industrial Products 0.69
Issuer/Instrument Industry/Rating % to Net Assets
PORTFOLIO
Music Broadcast Limited Media and Entertainment 0.69 Lupin Ltd. Pharmaceuticals 0.63 Mahindra & Mahindra Financial Services Ltd. Finance 0.63 Va Tech Wabag Limited Engineering Services 0.61 Ramkrishna Forgings Ltd. Industrial Products 0.60 Tata Consultancy Services Ltd. Software 0.55 Divi s Laboratories Limited Pharmaceuticals 0.51 Equitas Holdings Ltd Finance 0.50 The Ramco Cements Ltd Cement 0.48 Arvind Ltd Textile Products 0.44 Carborundum Universal Ltd. Industrial Products 0.39 Navkar Corporation Limited Transportation 0.30 HDFC Ltd. Warrants Finance 0.19 RBL Bank Ltd Banks 0.01 Listed/Awaiting Listing on Stock Exchange - Total 65.36 Futures RBL Bank Ltd-JUL2017 1.45 Futures (Market value represents Notional Value) - Total 1.45 Debt Instruments Debentures and Bonds Corporate Debt/Financial Institutions LIC Housing Finance Ltd. CRISIL AAA 0.03 Tata Sons Ltd. CRISIL AAA 0.01 Corporate Debt/Financial Institutions - Total 0.04 Public Sector Undertakings U P Power Corporation Ltd ( Guaranteed By UP State Government ) FITCH IND AA(SO) 4.00 Bank of India CRISIL A+ 2.06 Punjab & Sind Bank ICRA A+ 2.06 Vijaya Bank ICRA AA- 1.81 Syndicate Bank CARE AA- 1.66 Allahabad Bank FITCH IND A 0.59 Power Finance Corporation Ltd. CRISIL AAA 0.45 Konkan Railway Corporation Ltd. ICRA AAA 0.31 Public Sector Undertakings - Total 12.94 Government Dated Securities 7.61% Central Government SOV 10.35 8.60% Central Government SOV 0.66 8.18% State Government SOV 0.31 8.45% State Government SOV 0.12 8.27% State Government SOV 0.06 8.29% State Government SOV 0.04 8.43% State Government SOV 0.02 7.35% Central Government SOV 0.01 Government Dated Securities - Total 11.57 TERM DEPOSITS AXIS Bank Ltd. 0.27 Term Deposits - Total 0.27 Collateral Borrowing & Lending obligation 1.48 Net Current Assets/(Liabilities) 6.89 Grand Total 100.00
Note: Term Deposit as provided above is towards margin for derivatives transactions
This product is suitable for investors who are seeking*:� Long term capital growth� Investment in equity & equity related securities balanced with income generation
by investing in debt & money market instruments* Investors should consult their financial advisors if in doubt about whether the product is suitable for them.
PRODUCT LABEL
Investors understand that their principal will be at moderately high risk
Riskometer
yletaredo
M
Moderate
Low
High
Low
High
LOW HIGH
Moderately
SECTOR ALLOCATION (%)
23.73
15.886.27
5.33
5.13
11.1630.67
15.426.61
5.715
4.84.77
9.31
For last three dividends, please refer page no 56-58. For scheme performance, please refer page no 45-53 * For Fund Manager experience, please refer page 54-55.
SYSTEMATIC INVESTMENT PLAN (SIP)
Scheme Inception : - November 25,1999. The returns are calculated by XIRR approach assuming investment of 10,000/- on the 1st working `day of every month. XIRR helps in calculating return on investments given an initial and final value and a series of cash inflows and outflows and taking the time of investment into consideration. Since inception returns are assumed to be starting from the beginning of the subsequent month from the date of inception. # Benchmark ; Additional BenchmarkKotak Balance NAV as on June 30, 2017: 16.738 (Dividend Option), 17.915 (Direct Dividend Option), 23.046 (Growth Option) 24.303 (Direct Growth Option)
13
20.7
14.6
9.436.02
5.184.96
4.72
18.38
Monthly SIP of Rs 10000
Total amount invested (Rs)
Total Value as on June 30, 2017 (Rs)
Scheme Returns (%)
CRISIL Balanced Fund (Rs)#
CRISIL Balanced Fund Returns (%)
Nifty 50 (Rs)^
Nifty 50 Returns (%)
1 year 3 years 5 years 7 years 10 years Since Inception
120,000 360,000 600,000 840,000 1,200,000 2,120,000
129,793 437,240 853,606 1,331,931 2,236,493 9,579,561
15.59 13.06 14.09 12.95 11.97 15.24
128,873 416,739 794,425 1,218,979 2,012,569 NA
14.09 9.76 11.18 10.47 9.98 NA
130,496 412,973 798,527 1,221,347 2,020,097 7,718,121
16.73 9.14 11.39 10.52 10.06 13.19
Systematic Investment Plan (SIP) If you had invested `10,000 every month
(As on June 30, 2017)
Debentures and Bonds
Banks
Government Dated SecuritiesAuto Media and Entertainment
Finance
PharmaceuticalsIndustrial Products
Software
Consumer Non DurablesOthers
12.98
12.52
11.57
6.255.295.105.05
4.70
3.62
3.55
29.37

KOTAK EQUITY ARBITRAGEAn Open - Ended Equity Growth Scheme
EQUITY SCHEMES
14
INVESTMENT STYLE
Short Medium Long Volatility
Low
Medium
High
Maturity
Value Blend Growth Size
Large
Mid
Small
Style
Investment Objective
The investment objective of the scheme is to generate capital appreciation and income by predominantly investing in arbitrage opportunities in the cash and derivatives segment of the equity market, and by investing the balance in debt and money market instruments. However, there is no assurance that the objective of the scheme will be realized.
Allotment Date
September 29, 2005
Fund Manager
Mr. Deepak Gupta*
Benchmark
Nifty 50 Arbitrage
AAUM (` In Crores)
AAUM as on June 30, 2017:
`7036.33
AUM (` In Crores)
AUM as on June 30, 2017:
`6506.42
Available Plans/Options
A) B) Direct Plan Regular Plan
Options: Dividend Payout, Dividend Reinvestment & Growth (applicable for all plans)
Dividend Frequency
Fortnightly (Every alternate Monday from the 1st record date), Monthly (Monday preceding the last Thursday of the month), Bimonthly (Monday preceding the last Thursday of the following months - January, March, May, July, September, November)
Ratio
Portfolio Turnover: 397.10% $Beta: 0.48$ ##Sharpe : 1.17$Standard Deviation : 0.49%
$Source: ICRA MFI Explorer.
## Risk rate assumed to be 6.25% ( FBIL Overnight MIBOR rate as on 30th June 2017)
Minimum Investment Amount
Initial Investment: 5000 and in multiple of `1 for purchase and for 0.01 for switches
Additional Investment: `1000 & in multiples of 1
Ideal Investments Horizon: 3 months & above
Load Structure
Entry Load: Nil. (applicable for all plans)
Exit Load:
I) For redemptions/switch outs (including SIP/STP) within 30 days from the date of allotment of units, irrespective of the amount of investment: 0.25%
II) For redemptions/switch outs (including SIP/STP) after 30 days from the date of allotment of units, irrespective of the amount of investment: Nil
Note - 1) Any exit load charged (net off Service Tax, if any ) shall be credited back to the Scheme.
2) Units issued on reinvestment of dividends shall not be subject to exit load (applicable for all plans)
Total Expense Ratio**
Regular: 0.89%
Direct: 0.41%
**Total Expense Ratio excludes applicable B15 fee and service tax.
PORTFOLIO
Issuer/Instrument Industry/Rating % to Net Assets % to Net Assets Derivatives
Equity & Equity related (Listed/Awaiting listing on Stock Exchange)
Hedged Infosys Ltd. Software 2.92 -2.93 Hindustan Zinc Ltd. Non - Ferrous Metals 1.91 -1.92 Vedanta Ltd. Non - Ferrous Metals 1.88 -1.89 Indiabulls Housing Finance Ltd. Finance 1.82 -1.82 Yes Bank Ltd Banks 1.65 -1.66 Oil & Natural Gas Corporation Ltd. Oil 1.59 -1.60 Federal Bank Ltd. Banks 1.37 -1.37 Mahindra & Mahindra Ltd. Auto 1.36 -1.35 IDFC Bank Limited Banks 1.27 -1.26 Glenmark Pharmaceuticals Ltd Pharmaceuticals 1.26 -1.26 Bank Of Baroda Banks 1.24 -1.24 State Bank Of India Banks 1.22 -1.23 Bharat Electronics Ltd Industrial Capital Goods 1.18 -1.18 Power Finance Corporation Ltd. Finance 1.17 -1.18 Tata Steel Limited. Ferrous Metals 1.08 -1.06 UPL Ltd Pesticides 1.07 -1.08 JSW Steel Ltd. Ferrous Metals 1.04 -1.05 Zee Entertainment Enterprises Ltd Media and Entertainment 1.04 -1.04 Shriram Transport Finance Co Ltd. Finance 1.03 -1.04 HDFC Ltd. Finance 1.02 -1.01 Max Financial Services Ltd. Finance 1.02 -1.02 Bajaj Finserv Ltd. Finance 0.89 -0.90 Asian Paints Ltd. Consumer Non Durables 0.88 -0.88 Sun Pharmaceuticals Industries Ltd. Pharmaceuticals 0.88 -0.89 Castrol (India ) Ltd. Petroleum Products 0.87 -0.88 Bajaj Finance Limited Finance 0.84 -0.84 Ultratech Cement Ltd. Cement 0.83 -0.83 Century Textiles & Industries Ltd. Cement 0.79 -0.79 Hindalco Industries Ltd Non - Ferrous Metals 0.77 -0.77 Apollo Tyres Ltd. Auto Ancillaries 0.76 -0.76 DLF Limited Construction 0.75 -0.76 Sun TV Limited. Media and Entertainment 0.75 -0.75 Escorts Ltd. Auto 0.68 -0.69 Tata Communications Ltd Telecom - Services 0.67 -0.67 Tata Global Beverages Limited Consumer Non Durables 0.67 -0.66 Titan Company Ltd. Consumer Durables 0.65 -0.65 Aditya Birla Nuvo Limited Services 0.64 -0.65 Piramal Enterprises Limited Pharmaceuticals 0.63 -0.63 Tata Motors Ltd - DVR Auto 0.61 -0.61 Mahindra & Mahindra Financial Services Ltd. Finance 0.58 -0.58 IDFC Limited Finance 0.56 -0.56 Tata Motors Ltd. Auto 0.56 -0.56 The South Indian Bank Ltd. Banks 0.56 -0.55 Dewan Housing Finance Corporation Ltd. Finance 0.54 -0.53 Divi s Laboratories Limited Pharmaceuticals 0.54 -0.54 Strides Shasun Ltd. Pharmaceuticals 0.53 -0.54 India Cements Ltd. Cement 0.52 -0.53 Bharat Forge Ltd. Industrial Products 0.51 -0.51 Bosch Limited Auto Ancillaries 0.51 -0.51 Fortis Healthcare India Ltd Healthcare Services 0.51 -0.52 Adani Port and Special Economic Zone Limited Transportation 0.48 -0.48 NMDC Ltd. Minerals/Mining 0.48 -0.48 GAIL (India) Ltd. Gas 0.47 -0.47 Can Fin Homes Ltd. Finance 0.46 -0.46 Hero MotoCorp Ltd. Auto 0.46 -0.46 Exide Industries Ltd Auto Ancillaries 0.44 -0.43 Maruti Suzuki India Limited Auto 0.42 -0.42 Gujarat State Fertilizers & Chemicals Ltd. Fertilisers 0.41 -0.42 Bajaj Auto Ltd. Auto 0.40 -0.39 Reliance Capital Ltd. Finance 0.40 -0.41 Tata Chemicals Ltd. Chemicals 0.40 -0.40 Muthoot Finance Ltd Finance 0.39 -0.39 Ashok Leyland Ltd. Auto 0.38 -0.37 Jain Irrigation Systems Ltd. Industrial Products 0.38 -0.38 Jindal Steel & Power Ltd. Ferrous Metals 0.38 -0.38 Karnataka Bank Ltd Banks 0.36 -0.35 PVR Ltd Media and Entertainment 0.36 -0.36 IRB Infrastructure Developers Ltd Construction 0.35 -0.35 NCC Limited Construction Project 0.35 -0.35 Bata India Ltd. Consumer Durables 0.34 -0.34 Bharat Petroleum Corporation Ltd. Petroleum Products 0.34 -0.34 Havells India Ltd. Consumer Durables 0.33 -0.33 JSW Energy Ltd. Power 0.32 -0.32 Reliance Power Ltd Power 0.32 -0.33 Apollo Hospitals Enterprises Ltd. Healthcare Services 0.30 -0.30 Rural Electrification Corporation Ltd Finance 0.30 -0.30 Tata Elxsi Ltd. Software 0.30 -0.30 Indian Bank Banks 0.29 -0.29 CESC Ltd. Power 0.28 -0.29
* For Fund Manager experience, please refer page 54-55. For last three dividends, please refer page no 56-58. For scheme performance, please refer page no 45-53
(As on June 30, 2017)

KOTAK EQUITY ARBITRAGE
EQUITY SCHEMES
15
An Open - Ended Equity Growth Scheme
PORTFOLIO
Issuer/Instrument Industry/Rating % to Net Assets % to Net Assets Derivatives
TV18 Broadcast Ltd Media and Entertainment 0.28 -0.28 Aurobindo Pharma Ltd. Pharmaceuticals 0.27 -0.27 GMR Infrastructure Ltd. Construction Project 0.27 -0.28 Indraprastha Gas Ltd. Gas 0.27 -0.27 Balrampur Chini Mills Ltd Consumer Non Durables 0.25 -0.25 Bharat Heavy Electricals Ltd. Industrial Capital Goods 0.25 -0.25 Cadila Healthcare Ltd. Pharmaceuticals 0.25 -0.25 Reliance Defence & Engineering Ltd Industrial Capital Goods 0.25 -0.26 Torrent Power Ltd Power 0.25 -0.25 Dr Reddys Laboratories Ltd Pharmaceuticals 0.24 -0.24 Reliance Infrastructure Ltd Power 0.24 -0.24 Tech Mahindra Ltd. Software 0.24 -0.23 Indiabulls Real Estate Ltd Construction 0.23 -0.24 National Buildings Construction Corporation Limited Construction 0.23 -0.23 Raymond Limited Textile Products 0.23 -0.23 Engineers India Ltd. Construction Project 0.21 -0.21 IFCI Ltd. Finance 0.21 -0.21 ITC Ltd. Consumer Non Durables 0.21 -0.21 Britannia Industries Ltd. Consumer Non Durables 0.20 -0.20 Godfrey Phillips India Ltd. Consumer Non Durables 0.20 -0.20 Hindustan Construction Co.Ltd Construction Project 0.20 -0.20 Granules India Ltd. Pharmaceuticals 0.19 -0.19 Oil India Limited Oil 0.19 -0.20 PTC India Ltd. Power 0.19 -0.19 Shree Cement Ltd. Cement 0.19 -0.19 Suzlon Energy Ltd. Industrial Capital Goods 0.19 -0.20 Balkrishna Industries Ltd Auto Ancillaries 0.18 -0.18 Marico Ltd. Consumer Non Durables 0.18 -0.18 PC Jeweller Ltd Consumer Durables 0.18 -0.18 Bharat Earth Movers Ltd. Industrial Capital Goods 0.17 -0.17 Jaiprakash Associates Ltd Cement 0.17 -0.17 Adani Power Ltd Power 0.16 -0.16 Berger Paints (I) Ltd. Consumer Non Durables 0.16 -0.16 Coal India Ltd. Minerals/Mining 0.16 -0.16 Container Corporation of India Ltd. Transportation 0.16 -0.16 Housing Development and Infrastructure Limited Construction 0.15 -0.15 Bharat Financial Inclusion Limited Finance 0.14 -0.14 MindTree Ltd. Software 0.14 -0.14 Ujjivan Financial Services Ltd Finance 0.14 -0.14 Biocon Ltd. Pharmaceuticals 0.13 -0.13 CG Power and Industrial Solutions Limited Industrial Capital Goods 0.13 -0.13 Dalmia Bharat Ltd. Cement 0.13 -0.13 Indian Oil Corporation Ltd Petroleum Products 0.13 -0.13 Jet Airways (India) Ltd. Transportation 0.13 -0.13 KPIT Technologies LImited Software 0.13 -0.13 The Ramco Cements Ltd Cement 0.13 -0.13 United Spirits Ltd. Consumer Non Durables 0.13 -0.13 Equitas Holdings Ltd Finance 0.12 -0.12 Godrej Industries Ltd Consumer Non Durables 0.12 -0.12 Grasim Industries Ltd. Cement 0.12 -0.12 L&T Finance Holdings Ltd Finance 0.12 -0.12 Wockhardt Ltd. Pharmaceuticals 0.12 -0.12 ACC Ltd. Cement 0.10 -0.10 Sintex Industries Ltd. Industrial Products 0.10 -0.10 V-Guard Industries Ltd. Industrial Capital Goods 0.10 -0.10 Andhra Bank Banks 0.09 -0.09 Bharti Infratel Ltd. Telecom - Equipment & Accessories 0.09 -0.09 Pidilite Industries Ltd. Chemicals 0.09 -0.09 Siemens Ltd. Industrial Capital Goods 0.09 -0.09 SREI Infrastructure Finance Ltd Finance 0.09 -0.09 United Breweries Ltd. Consumer Non Durables 0.09 -0.09 Capital First Ltd Finance 0.08 -0.08 Cholamandalam Investment and Finance Company Ltd Finance 0.08 -0.08 Power Grid Corporation Of India Ltd Power 0.08 -0.08 Adani Enterprises Ltd Trading 0.07 -0.07 Ajanta Pharma Ltd. Pharmaceuticals 0.07 -0.07 Nestle India Ltd. Consumer Non Durables 0.07 -0.07 NHPC Limited Power 0.07 -0.07 Indo Count Industries Ltd. Textiles - Cotton 0.06 -0.06 IndusInd Bank Ltd. Banks 0.06 -0.06 Kajaria Ceramics Ltd. Construction 0.06 -0.06 Motherson Sumi Systems Ltd. Auto Ancillaries 0.06 -0.06 Syndicate Bank Banks 0.06 -0.06 Tata Power Co. Ltd. Power 0.06 -0.06 SRF Ltd. Textile Products 0.05 -0.05 Mahanagar Gas Ltd Gas 0.04 -0.04 Manappuram Finance Ltd Finance 0.04 -0.04 Reliance Industries Ltd. Petroleum Products 0.04 -0.04 Voltas Ltd. Construction Project 0.04 -0.04 ICICI Prudential Life Insurance Company Ltd Finance 0.03 -0.03 National Aluminium Company Ltd Non - Ferrous Metals 0.03 -0.03 Reliance Communications Ltd. Telecom - Services 0.03 -0.03 Ambuja Cements Ltd Cement 0.02 -0.02
(As on June 30, 2017)
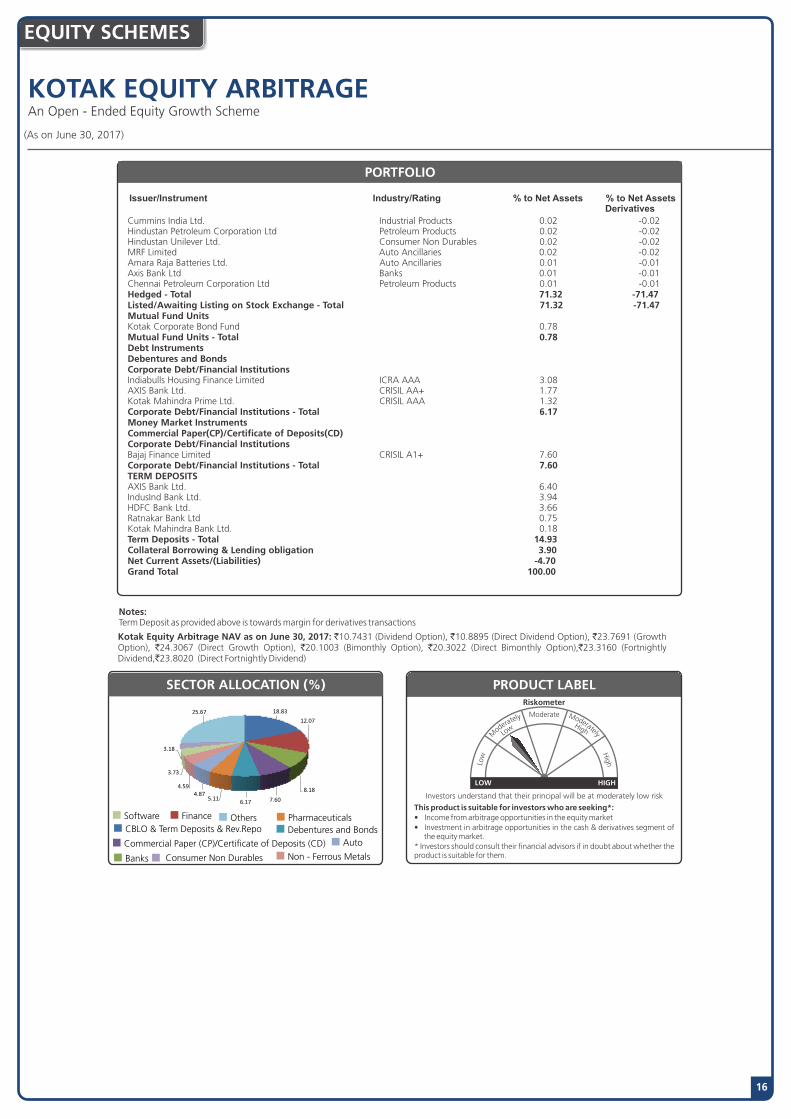
EQUITY SCHEMES
KOTAK EQUITY ARBITRAGE
16
An Open - Ended Equity Growth Scheme
Notes:Term Deposit as provided above is towards margin for derivatives transactions
Kotak Equity Arbitrage NAV as on June 30, 2017: `10.7431 (Dividend Option), `10.8895 (Direct Dividend Option), `23.7691 (Growth Option), `24.3067 (Direct Growth Option), `20.1003 (Bimonthly Option), `20.3022 (Direct Bimonthly Option),`23.3160 (Fortnightly Dividend,`23.8020 (Direct Fortnightly Dividend)
This product is suitable for investors who are seeking*:� Income from arbitrage opportunities in the equity market� Investment in arbitrage opportunities in the cash & derivatives segment of
the equity market.* Investors should consult their financial advisors if in doubt about whether the product is suitable for them.
PRODUCT LABEL
Investors understand that their principal will be at moderately low risk
Riskometer
yletaredo
M
Moderate
Low
High
Low
High
LOW HIGH
Moderately
PORTFOLIO
Issuer/Instrument Industry/Rating % to Net Assets % to Net Assets Derivatives
SECTOR ALLOCATION (%)
(As on June 30, 2017)
Cummins India Ltd. Industrial Products 0.02 -0.02 Hindustan Petroleum Corporation Ltd Petroleum Products 0.02 -0.02 Hindustan Unilever Ltd. Consumer Non Durables 0.02 -0.02 MRF Limited Auto Ancillaries 0.02 -0.02 Amara Raja Batteries Ltd. Auto Ancillaries 0.01 -0.01 Axis Bank Ltd Banks 0.01 -0.01 Chennai Petroleum Corporation Ltd Petroleum Products 0.01 -0.01 Hedged - Total 71.32 -71.47 Listed/Awaiting Listing on Stock Exchange - Total 71.32 -71.47 Mutual Fund Units Kotak Corporate Bond Fund 0.78 Mutual Fund Units - Total 0.78 Debt Instruments Debentures and Bonds Corporate Debt/Financial Institutions Indiabulls Housing Finance Limited ICRA AAA 3.08 AXIS Bank Ltd. CRISIL AA+ 1.77 Kotak Mahindra Prime Ltd. CRISIL AAA 1.32 Corporate Debt/Financial Institutions - Total 6.17 Money Market Instruments Commercial Paper(CP)/Certificate of Deposits(CD) Corporate Debt/Financial Institutions Bajaj Finance Limited CRISIL A1+ 7.60 Corporate Debt/Financial Institutions - Total 7.60 TERM DEPOSITS AXIS Bank Ltd. 6.40 IndusInd Bank Ltd. 3.94 HDFC Bank Ltd. 3.66 Ratnakar Bank Ltd 0.75 Kotak Mahindra Bank Ltd. 0.18 Term Deposits - Total 14.93 Collateral Borrowing & Lending obligation 3.90 Net Current Assets/(Liabilities) -4.70 Grand Total 100.00
CBLO & Term Deposits & Rev.RepoFinance
Debentures and Bonds
Banks
PharmaceuticalsSoftware
Auto
Non - Ferrous Metals
Others
18.83
12.07
8.18
7.606.175.11
4.874.59
3.73
3.18
25.67
Commercial Paper (CP)/Certi�cate of Deposits (CD)
Consumer Non Durables

KOTAK EQUITY SAVINGS FUNDAn Open Ended Equity Fund
Investment Objective
The investment objective of the scheme is to generate capital appreciation and income by predominantly investing in arbitrage opportunities in the cash and derivatives segment of the equity market, and enhance returns with a moderate exposure in equity & equity related instruments. However, there is no assurance that the objective of the scheme will be realized.
Allotment Date
October 13, 2014
Fund Managers
Mr. Deepak Gupta & Mr. Abhishek Bisen*
Benchmark
75% of Nifty 50 Arbitrage index and 25% in Nifty 50
AAUM (` In Crores)
AAUM as on June 30, 2017:
754.87
AUM (` In Crores)
AUM as on June 30, 2017:
767.25
Available Plans/Options
A) Regular Plan B) Direct Plan
Options: Dividend Payout, Dividend Reinvestment & Growth (applicable for all plans)
Dividend Frequency
Monthly (12th of every month) Quarterly (20th of March, June, September and December of every year)
RatiosPortfolio Turnover: 207.18%
Minimum Investment AmountInitial Investment: `5000 and in multiple of `1 for purchase and for `0.01 for switchesAdditional Investment: `1000 & in multiples of `1 for purchase and for `0.01 for switchesIdeal Investments Horizon: 3 years & above
Load Structure
Entry Load: Nil.
Exit Load:I) For redemption / switch out of upto 10% of the initial investment amount (limit) purchased or switched in within 1 year from the date of allotment: Nil. ii) If units redeemed or switched out are in excess of the limit within 1 year from the date of allotment: 1%.iii) If units are redeemed or switched out on or after 1 year from the date of allotment: Nil.iv) Any exit load charged (net off Service Tax, if any) shall be credited back to the respective Scheme. Units issued on reinvestment of dividends shall not be subject to entry and exit load.
Total Expense Ratio**
Regular: 2.08%Direct: 1.64%
**Total Expense Ratio excludes applicable B15 fee and service tax.
EQUITY SCHEMES
17
INVESTMENT STYLE
Short Medium Long Volatility
Low
Medium
High
Maturity
Value Blend Growth Size
Large
Mid
Small
Style
Issuer/Instrument Industry/Rating % to Net Assets % to Net Assets - Derivatives
PORTFOLIO
Equity & Equity related (Listed/Awaiting listing on Stock Exchange) Non-HedgeITC Ltd. Consumer Non Durables 2.43 HDFC Ltd. Warrants Finance 1.46 HDFC Ltd. Finance -1.65 CNX NIFTY-JUL2017 -1.40 IndusInd Bank Ltd. Banks 1.11 Power Grid Corporation Of India Ltd Power 1.08 Bharat Petroleum Corporation Ltd. Petroleum Products 1.07 Varun Beverages Ltd Consumer Non Durables 1.03 Reliance Industries Ltd. Petroleum Products 0.92 Yes Bank Ltd Banks 0.89 Infosys Ltd. Software 0.82 Aditya Birla Nuvo Limited Services 0.81 National Thermal Power Corporation Limited Power 0.79 Bharat Earth Movers Ltd. Industrial Capital Goods 0.71 Bajaj Finance Limited Finance 0.65 Tata Motors Ltd - DVR Auto 0.63 Godfrey Phillips India Ltd.-JUL2017 Consumer Non Durables 0.52 Maruti Suzuki India Limited Auto 0.62 Laurus Labs Ltd Pharmaceuticals 0.59 Tata Steel Limited. Ferrous Metals 0.58 Eris Lifesciences Ltd Pharmaceuticals 0.55 Hero MotoCorp Ltd. Auto 0.49 0.18 Zee Entertainment Enterprises Ltd Media and Entertainment 0.49 Mcleod Russel India Ltd Consumer Non Durables 0.46 Petronet LNG Ltd. Gas 0.46 The Ramco Cements Ltd Cement 0.38 Indraprastha Gas Ltd. Gas 0.34 0.15 Tata Consultancy Services Ltd. Software 0.34 Muthoot Finance Ltd Finance 0.30 Piramal Enterprises Limited Pharmaceuticals 0.30 Hindustan Unilever Ltd. Consumer Non Durables 0.28 JSW Steel Ltd. Ferrous Metals 0.28 Vedanta Ltd. Non - Ferrous Metals 0.28 Colgate Palmolive (India ) Ltd. Consumer Non Durables 0.27 GAIL (India) Ltd. Gas 0.26 HCL Technologies Ltd. Software 0.24 Bajaj Finserv Ltd. Finance 0.23 ICICI Bank Ltd. Banks 0.23 Indian Oil Corporation Ltd Petroleum Products 0.23 Housing & Urban Development Corporation Ltd Finance 0.17 RBL Bank Ltd-JUL2017 0.17 Oil & Natural Gas Corporation Ltd. Oil 0.15 Wipro Ltd. Software 0.15 Hindustan Petroleum Corporation Ltd Petroleum Products 0.11 Central Depository Services (India) Ltd Finance 0.09 Tata Communications Ltd Telecom - Services 0.09 Tata Motors Ltd. Auto 0.08 Tech Mahindra Ltd. Software 0.08 State Bank Of India-JUL2017 -0.08 HDFC Bank Ltd. Banks 0.07 1.91 Grasim Industries Ltd. Cement 0.05 Axis Bank Ltd Banks 0.04 0.40 S Chand And Company Ltd Media and Entertainment 0.04 Sun Pharmaceuticals Industries Ltd. Pharmaceuticals 0.04 Chennai Super Kings Cricket Ltd. Media and Entertainment 0.02 Biocon Ltd. Pharmaceuticals 0.01 0.51 Non-Hedged- Total 23.79 0.71 Hedged Fortis Healthcare India Ltd Healthcare Services 3.97 -3.99 Vedanta Ltd. Non - Ferrous Metals 3.64 -3.64 Hindalco Industries Ltd Non - Ferrous Metals 3.13 CNX NIFTY-JUL2017 -3.15 GMR Infrastructure Ltd. Construction Project 2.57 -2.60 Jaiprakash Associates Ltd Cement 2.20 -2.22 Jain Irrigation Systems Ltd. Industrial Products 2.15 -2.16 Bharat Electronics Ltd Industrial Capital Goods 1.69 -1.69 Infosys Ltd. Software 1.44 -1.44 IDFC Bank Limited Banks 1.32 -1.32 Reliance Capital Ltd. Finance 1.30 -1.30 IDFC Limited Finance 1.05 -1.04 Tata Communications Ltd Telecom - Services 1.03 -1.03 The South Indian Bank Ltd. Banks 1.01 -1.00 Century Textiles & Industries Ltd. Cement 1.00 -1.01 India Cements Ltd. Cement 0.69 -0.70 Ashok Leyland Ltd. Auto 0.64 -0.63 Bata India Ltd. Consumer Durables 0.62 -0.62 Indiabulls Real Estate Ltd Construction 0.60 -0.60 JSW Energy Ltd. Power 0.60 -0.60 HDFC Ltd. Finance 0.57 -0.57 Dewan Housing Finance Corporation Ltd. Finance 0.54 -0.54 Aditya Birla Nuvo Limited Services 0.45 -0.45 Kaveri Seed Company Ltd. Consumer Non Durables 0.43 -0.44 Dalmia Bharat Ltd. Cement 0.41 -0.41 Tata Elxsi Ltd. Software 0.37 -0.37 Wockhardt Ltd. Pharmaceuticals 0.36 -0.36 Castrol (India ) Ltd. Petroleum Products 0.34 -0.34 Yes Bank Ltd Banks 0.33 -0.33
* For Fund Manager experience, please refer page 54-55. For last three dividends, please refer page no 56-58. For scheme performance, please refer page no 45-53
(As on June 30, 2017)

EQUITY SCHEMES
18
KOTAK EQUITY SAVINGS FUNDAn Open Ended Equity Fund
Issuer/Instrument Industry/Rating % to Net Assets % to Net Assets - Derivatives
PORTFOLIO
Grasim Industries Ltd. Cement 0.30 -0.30 Tata Steel Limited. Ferrous Metals 0.22 -0.22 Oil & Natural Gas Corporation Ltd. Oil 0.21 -0.21 Ujjivan Financial Services Ltd Finance 0.21 -0.21 CESC Ltd. Power 0.19 -0.19 Sun Pharmaceuticals Industries Ltd. Pharmaceuticals 0.19 -0.19 Escorts Ltd. Auto 0.18 -0.19 Mahindra & Mahindra Financial Services Ltd. Finance 0.17 -0.17 Aurobindo Pharma Ltd. Pharmaceuticals 0.16 -0.16 Hindustan Zinc Ltd. Non - Ferrous Metals 0.15 -0.15 Glenmark Pharmaceuticals Ltd Pharmaceuticals 0.14 -0.14 IRB Infrastructure Developers Ltd Construction 0.14 -0.14 Apollo Tyres Ltd. Auto Ancillaries 0.13 -0.13 Bajaj Finance Limited Finance 0.13 -0.13 Housing Development and Infrastructure Limited Construction 0.13 -0.13 Tata Global Beverages Limited Consumer Non Durables 0.13 -0.13 Asian Paints Ltd. Consumer Non Durables 0.12 -0.12 Indian Bank Banks 0.11 -0.11 Sun TV Limited. Media and Entertainment 0.11 -0.11 UPL Ltd Pesticides 0.11 -0.11 Adani Power Ltd Power 0.10 -0.10 Hindalco Industries Ltd Non - Ferrous Metals 0.10 -0.10 Maruti Suzuki India Limited Auto 0.10 -0.10 NCC Limited Construction Project 0.10 -0.10 Capital First Ltd Finance 0.09 -0.09 Bajaj Auto Ltd. Auto 0.08 -0.08 Britannia Industries Ltd. Consumer Non Durables 0.08 -0.08 Exide Industries Ltd Auto Ancillaries 0.08 -0.08 IFCI Ltd. Finance 0.08 -0.08 Voltas Ltd. Construction Project 0.08 -0.08 Pidilite Industries Ltd. Chemicals 0.07 -0.07 Reliance Power Ltd Power 0.07 -0.07 Andhra Bank Banks 0.06 -0.06 Tata Motors Ltd. Auto 0.06 -0.06 The Ramco Cements Ltd Cement 0.05 -0.05 Bosch Limited Auto Ancillaries 0.04 -0.04 Granules India Ltd. Pharmaceuticals 0.04 -0.04 Gujarat State Fertilizers & Chemicals Ltd. Fertilisers 0.04 -0.04 Jindal Steel & Power Ltd. Ferrous Metals 0.04 -0.04 KPIT Technologies LImited Software 0.04 -0.04 Oracle Financial Services Software Ltd Software 0.04 -0.04 Power Finance Corporation Ltd. Finance 0.04 -0.04 TV18 Broadcast Ltd Media and Entertainment 0.04 -0.04 Bajaj Finserv Ltd. Finance 0.03 -0.03 Bharat Heavy Electricals Ltd. Industrial Capital Goods 0.03 -0.03 Federal Bank Ltd. Banks 0.03 -0.03 ITC Ltd. Consumer Non Durables 0.03 -0.03 JSW Steel Ltd. Ferrous Metals 0.03 -0.03 Balrampur Chini Mills Ltd Consumer Non Durables 0.02 -0.02 Siemens Ltd. Industrial Capital Goods 0.02 -0.02 PC Jeweller Ltd Consumer Durables 0.01 -0.01 Rural Electrification Corporation Ltd Finance 0.01 -0.01 Hedged - Total 39.41 -39.52 Listed/Awaiting Listing on Stock Exchange - Total 63.20 -38.81 Preference Shares (Listed/Awaiting listing on Stock Exchange) 3DPLM Software Solutions Ltd Software 0.12 7.50% Vedanta Reedemable Preference Shares Non - Ferrous Metals 0.62 Preference Shares - Total 0.74 Mutual Fund Units Kotak Floater Short Term Direct Growth Mutual Fund Units 7.82 Mutual Fund Units - Total 7.82 Debt Instruments Debentures and Bonds Corporate Debt/Financial Institutions HDFC Bank Ltd. CRISIL AA+ 3.31 Kotak Mahindra Prime Ltd. CRISIL AAA 3.30 Indiabulls Housing Finance Limited CARE AAA 2.70 Corporate Debt/Financial Institutions - Total 9.31 Government Dated Securities 8.53% State Government SOV 0.68 Government Dated Securities - Total 0.68 TERM DEPOSITS AXIS Bank Ltd. 4.54 HDFC Bank Ltd. 3.22 IndusInd Bank Ltd. 2.33 Kotak Mahindra Bank Ltd. 0.26 Term Deposits - Total 10.35 Collateral Borrowing & Lending obligation 2.26 Net Current Assets/(Liabilities) 5.64 Grand Total 100.00
(As on June 30, 2017)
Kotak Equity Savings Fund NAV as on June 30, 2017: `12.5160 (Growth Option), `11.0119 (Monthly Dividend Option), `10.9483 Quarterly Dividend Option), `12.7471 (Direct Growth Option), `11.2342 (Direct Monthly Dividend Option), `11.0215 (Direct Quarterly Dividend Option)
Notes:Term Deposit as provided above is towards margin for derivatives transactions

EQUITY SCHEMES
19
KOTAK EQUITY SAVINGS FUNDAn Open Ended Equity Fund
(As on June 30, 2017)
This product is suitable for investors who are seeking*:� Income from arbitrage opportunities in the equity market & long term
capital growth� Investment predominantly in arbitrage opportunities in the cash &
derivatives segment of the equity market and equity & equity related securities
* Investors should consult their financial advisors if in doubt about whether the product is suitable for them.
PRODUCT LABEL
Investors understand that their principal will be at moderately high risk
Riskometer
yletaredo
M
Moderate
Low
High
Low
High
LOW HIGH
Moderately
SECTOR ALLOCATION (%)
22.18
11.19
30.03
SYSTEMATIC INVESTMENT PLAN (SIP)Monthly SIP of Rs 10000
Total amount invested (Rs)
Total Value as on June 30, 2017 (Rs)
Scheme Returns (%)
75% NIFTY 50 ARBITRAGE + 25% Nifty 50 (Rs)#
75% NIFTY 50 ARBITRAGE + 25% Nifty 50 Returns (%)
Nifty 50 (Rs)^
Nifty 50 Returns (%)
1 year Since Inception
1,20,000 3,30,000
1,26,628 3,72,213
10.47 8.74
1,24,932 3,63,382
7.76 6.96
1,30,496 3,76,213
16.73 9.53
Systematic Investment Plan (SIP) If you had invested `10,000 every month
SYSTEMATIC INVESTMENT PLAN (SIP)
Scheme Inception : - October 13, 2014. The returns are calculated by XIRR approach assuming investment of 10,000/- on the 1st working day `of every month. XIRR helps in calculating return on investments given an initial and final value and a series of cash inflows and outflows and taking the time of investment into consideration. Since inception returns are assumed to be starting from the beginning of the subsequent month from the date of inception. # Benchmark ; Additional Benchmark
Mutual Fund Units CBLO & Term Deposits & Rev.RepoNon - Ferrous Metals
Finance Software
Banks
CementConsumer Non Durables Pharmaceuticals
Others
12.619.31
7.92
7.82
7.125.28
5.25.08
3.97
3.64
32.05
Healthcare Services

EQUITY SCHEMES
KOTAK INDIA GROWTH FUND SERIES I3 years Close- Ended Equity Scheme
Issuer/Instrument Industry/Rating % to Net Assets
Issuer/Instrument Industry/Rating % to Net Assets
Investment Objective
The investment objective of the scheme is to generate capital appreciation from a diversified portfolio of equity & equity related instruments across market capitalisation and sectors. However, there is no assurance that the objective of the scheme will be realized.
Allotment Date
May 06, 2015
Fund Manager
Mr. Harish Krishnan
Benchmark
Nifty 200
AAUM (` In Crores)
AAUM as on June 30, 2017:
443.95
AUM (` In Crores)
AUM as on June 30, 2017:
440.16
Available Plans/Options
A) Regular Plan B) Direct Plan
Options: Dividend Payout & Growth (applicable for all plans)
Dividend Frequency
Trustee�s Discretion
Ratios
Portfolio Turnover: 36.45%
Minimum Investment Amount
The scheme is a close ended scheme. The units of the scheme can be traded on the stock exchange.
Load Structure
Entry Load: Nil. (applicable for all plans)
Exit Load: Nil. (applicable for all plans)
Total Expense Ratio**
Regular: 2.48%Direct: 1.98%
**Total Expense Ratio excludes applicable B15 fee and service tax.
Equity & Equity related (Listed/Awaiting listing on Stock Exchange) HDFC Bank Ltd. Banks 8.44 ICICI Bank Ltd. Banks 7.96 Reliance Industries Ltd. Petroleum Products 6.11 IndusInd Bank Ltd. Banks 6.05 Maruti Suzuki India Limited Auto 5.49 Larsen And Toubro Ltd. Construction Project 5.18 Hero MotoCorp Ltd. Auto 5.05 Shree Cement Ltd. Cement 4.31 Britannia Industries Ltd. Consumer Non Durables 4.19 Infosys Ltd. Software 4.04 Tata Motors Ltd - DVR Auto 3.73 State Bank Of India Banks 3.68 Axis Bank Ltd Banks 3.53 Sun TV Limited. Media and Entertainment 3.15 Bharat Earth Movers Ltd. Industrial Capital Goods 3.14 Persistent Systems Limited Software 3.10 Kajaria Ceramics Ltd. Construction 2.97 GAIL (India) Ltd. Gas 2.89 Laurus Labs Ltd Pharmaceuticals 2.83 Motherson Sumi Systems Ltd. Auto Ancillaries 2.10
Equitas Holdings Ltd Finance 1.99 Sun Pharmaceuticals Industries Ltd. Pharmaceuticals 1.89 Ultratech Cement Ltd. Cement 1.80 Entertainment Network (India) Ltd. Media and Entertainment 1.41 Zee Entertainment Enterprises Ltd Media and Entertainment 1.12 BSE Ltd Finance 0.83 Godfrey Phillips India Ltd. Consumer Non Durables 0.09 Avenue Supermarts Ltd Retailing 0.03 Listed/Awaiting Listing on Stock Exchange - Total 97.10 Futures Godfrey Phillips India Ltd.-JUL2017 1.07 Zee Entertainment Enterprises Ltd-JUL2017 0.45 Futures (Market value represents Notional Value) - Total 1.52 TERM DEPOSITS AXIS Bank Ltd. 0.45 Term Deposits - Total 0.45 Collateral Borrowing & Lending obligation 0.71 Net Current Assets/(Liabilities) 0.22 Grand Total 100.00
PORTFOLIO
Kotak India Growth Fund Series I NAV as on June 30, 2017: 12.4570 (Dividend Option), 12.6034 (Direct Dividend Option), 12.4570 (Growth Option), 12.6034 (Direct Growth Option)
INVESTMENT STYLE
Value Blend Growth Size
Large
Mid
Small
Style
SECTOR ALLOCATION (%)
32.53
14.699.36
7.53
7.09
7.03
4.8129.12
14.3
10.617.49
6.94
6.9
5.64
26.28
15.93
14.76.48
5.55
5.07
4.954.3
This product is suitable for investors who are seeking*:� Long term capital growth� Investment in equity and equity related securities across market
capitalisation and sectors* Investors should consult their financial advisors if in doubt about whether the product is suitable for them.
PRODUCT LABEL
Investors understand that their principal will be at moderately high risk
Riskometer
yletaredo
M
Moderate
Low
High
Low
High
LOW HIGH
Moderately
27.37
16.83
14.74
6.44
5.83
5.46
5.32
20
26.35
16.68
13.656.74
6.46
5.97
5.45
(As on June 30, 2017)
25.63
17.4
13.167.5
7.1
5.82
5.76
Note: Term Deposit as provided above is towards margin for derivatives transactions
BanksAuto
SoftwareCement
Petroleum ProductsPharmaceuticalsConstruction Project
Media and EntertainmentConsumer Non Durables
Others
29.66
14.27
7.146.11
6.11
5.68
5.18
4.72
4.28
3.14
13.71
Industrial Capital Goods
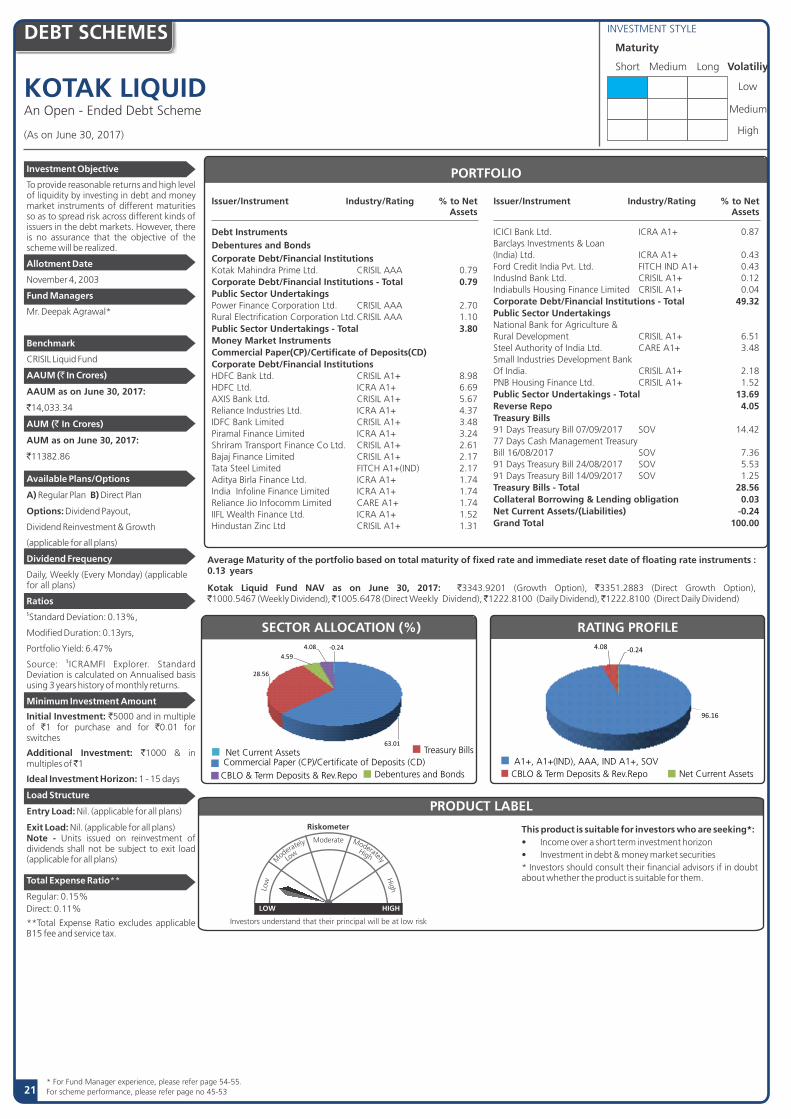
20
KOTAK LIQUIDAn Open - Ended Debt Scheme
Issuer/Instrument Industry/Rating % to Net Assets
Debt Instruments Debentures and Bonds Corporate Debt/Financial Institutions Kotak Mahindra Prime Ltd. CRISIL AAA 0.79Corporate Debt/Financial Institutions - Total 0.79Public Sector Undertakings Power Finance Corporation Ltd. CRISIL AAA 2.70Rural Electrification Corporation Ltd. CRISIL AAA 1.10Public Sector Undertakings - Total 3.80Money Market Instruments Commercial Paper(CP)/Certificate of Deposits(CD) Corporate Debt/Financial Institutions HDFC Bank Ltd. CRISIL A1+ 8.98HDFC Ltd. ICRA A1+ 6.69AXIS Bank Ltd. CRISIL A1+ 5.67Reliance Industries Ltd. ICRA A1+ 4.37IDFC Bank Limited CRISIL A1+ 3.48Piramal Finance Limited ICRA A1+ 3.24Shriram Transport Finance Co Ltd. CRISIL A1+ 2.61Bajaj Finance Limited CRISIL A1+ 2.17Tata Steel Limited FITCH A1+(IND) 2.17Aditya Birla Finance Ltd. ICRA A1+ 1.74India Infoline Finance Limited ICRA A1+ 1.74Reliance Jio Infocomm Limited CARE A1+ 1.74IIFL Wealth Finance Ltd. ICRA A1+ 1.52Hindustan Zinc Ltd CRISIL A1+ 1.31
Issuer/Instrument Industry/Rating % to Net Assets
ICICI Bank Ltd. ICRA A1+ 0.87Barclays Investments & Loan (India) Ltd. ICRA A1+ 0.43Ford Credit India Pvt. Ltd. FITCH IND A1+ 0.43IndusInd Bank Ltd. CRISIL A1+ 0.12Indiabulls Housing Finance Limited CRISIL A1+ 0.04Corporate Debt/Financial Institutions - Total 49.32Public Sector Undertakings National Bank for Agriculture & Rural Development CRISIL A1+ 6.51Steel Authority of India Ltd. CARE A1+ 3.48Small Industries Development Bank Of India. CRISIL A1+ 2.18PNB Housing Finance Ltd. CRISIL A1+ 1.52Public Sector Undertakings - Total 13.69Reverse Repo 4.05Treasury Bills 91 Days Treasury Bill 07/09/2017 SOV 14.4277 Days Cash Management Treasury Bill 16/08/2017 SOV 7.3691 Days Treasury Bill 24/08/2017 SOV 5.5391 Days Treasury Bill 14/09/2017 SOV 1.25Treasury Bills - Total 28.56Collateral Borrowing & Lending obligation 0.03Net Current Assets/(Liabilities) -0.24Grand Total 100.00
PORTFOLIO
INVESTMENT STYLEDEBT SCHEMES
Investment Objective
To provide reasonable returns and high level of liquidity by investing in debt and money market instruments of different maturities so as to spread risk across different kinds of issuers in the debt markets. However, there is no assurance that the objective of the scheme will be realized.
Allotment Date
November 4, 2003
Fund Managers
Mr. Deepak Agrawal*
Benchmark
CRISIL Liquid Fund
AAUM (` In Crores)
AAUM as on June 30, 2017:
`14,033.34
AUM (` In Crores)
AUM as on June 30, 2017:
`11382.86
Available Plans/Options
A) Regular Plan B) Direct Plan
Options: Dividend Payout,
Dividend Reinvestment & Growth
(applicable for all plans)
Dividend Frequency
Daily, Weekly (Every Monday) (applicable for all plans)
Ratios$Standard Deviation: 0.13%,
Modified Duration: 0.13yrs,
Portfolio Yield: 6.47% $Source: ICRAMFI Explorer. Standard
Deviation is calculated on Annualised basis using 3 years history of monthly returns.
Minimum Investment Amount
Initial Investment: `5000 and in multiple of `1 for purchase and for `0.01 for switches
Additional Investment: `1000 & in multiples of 1
Ideal Investment Horizon: 1 - 15 days
Load Structure
Entry Load: Nil. (applicable for all plans)
Exit Load: Nil. (applicable for all plans)Note - Units issued on reinvestment of dividends shall not be subject to exit load (applicable for all plans)
Total Expense Ratio**
Regular: 0.15%Direct: 0.11%
**Total Expense Ratio excludes applicable B15 fee and service tax.
Investors understand that their principal will be at low risk
Riskometer
yletaredo
M
Moderate
Low
High
Low
High
LOW HIGH
Moderately
This product is suitable for investors who are seeking*:� Income over a short term investment horizon� Investment in debt & money market securities* Investors should consult their financial advisors if in doubt about whether the product is suitable for them.
PRODUCT LABEL
Short Medium Long Volatiliy
Low
Medium
High
Maturity
Average Maturity of the portfolio based on total maturity of fixed rate and immediate reset date of floating rate instruments : 0.13 years
Kotak Liquid Fund NAV as on June 30, 2017: `3343.9201 (Growth Option), `3351.2883 (Direct Growth Option),`1000.5467 (Weekly Dividend), 1005.6478 (Direct Weekly Dividend), 1222.8100 (Daily Dividend), 1222.8100 (Direct Daily Dividend)
For scheme performance, please refer page no 45-53 * For Fund Manager experience, please refer page 54-55.
(As on June 30, 2017)
SECTOR ALLOCATION (%) RATING PROFILE
DEBT SCHEMES
21
90.38
75.74
15.55
90.22
8.396.85
64.44
19.74
15.57
Net Current AssetsCommercial Paper (CP)/Certificate of Deposits (CD)
CBLO & Term Deposits & Rev.Repo CBLO & Term Deposits & Rev.RepoDebentures and Bonds
Treasury BillsNet Current Assets63.01
28.56
4.59
4.08 ‐0.24
96.16
4.08 ‐0.24
A1+, A1+(IND), AAA, IND A1+, SOV

22
KOTAK FLOATER SHORT TERMAn Open - Ended Debt Scheme
Issuer/Instrument Industry/Rating % to Net AssetsDebt InstrumentsDebentures and BondsCorporate Debt/Financial Institutions Kotak Mahindra Prime Ltd. CRISIL AAA 1.85Fullerton India Credit Co. Ltd. CARE AAA 1.08Bhanu Vyapaar Private Limited ( Secured by Equity shares of Emami Ltd ) FITCH IND AA- 0.44LIC Housing Finance Ltd. CARE AAA 0.41Corporate Debt/Financial Institutions - Total 3.78Money Market Instruments Commercial Paper(CP)/Certificate of Deposits(CD) Corporate Debt/Financial Institutions Reliance Industries Ltd. ICRA A1+ 8.94HDFC Bank Ltd. CRISIL A1+ 7.86Piramal Finance Limited ICRA A1+ 5.60Muthoot Finance Ltd CRISIL A1+ 5.37HDFC Ltd. ICRA A1+ 5.01IndusInd Bank Ltd. CRISIL A1+ 4.79Tata Steel Limited FITCH IND A1+ 4.52Suraksha Realty Ltd ( Secured by Equity shares of Sun Pharmaceuticals Industries Ltd ) ICRA A1+(SO) 4.05ECL Finance Limited CRISIL A1+ 3.58AXIS Bank Ltd. CRISIL A1+ 3.22Reliance Jio Infocomm Limited CARE A1+ 2.92Dewan Housing Finance Corporation Ltd. CRISIL A1+ 2.71India Infoline Finance Limited ICRA A1+ 2.69Suraksha Realty Ltd ( Secured by Equity shares of Sun Pharmaceuticals Industries Ltd ) CARE A1+(SO) 2.64IIFL Wealth Finance Ltd. ICRA A1+ 2.26Bajaj Finance Limited CRISIL A1+ 2.24Tata Steel Limited FITCH A1+(IND) 2.24Suraksha Realty Ltd ( Secured by Equity shares of Sun
Issuer/Instrument Industry/Rating % to Net Assets
Pharmaceuticals Industries Ltd ) CRISIL A1+(SO) 1.77Manappuram Finance Ltd CRISIL A1+ 1.70Hindustan Zinc Ltd CRISIL A1+ 1.35Tata Power Company Ltd. ICRA A1+ 1.34Shriram City Union Finance Ltd. CARE A1+ 1.12IDFC Bank Limited ICRA A1+ 0.99Nirma Ltd. CRISIL A1+ 0.90Adani Transmission Ltd FITCH IND A1+(SO) 0.89Tata Motors Finance Solutions Private Limited CARE A1+ 0.89Indostar Capital Finance Private Limited CRISIL A1+ 0.45Trapti Trading & Investments Private Limited ICRA A1+ 0.45Hero Cycles Ltd. CRISIL A1+ 0.27Corporate Debt/Financial Institutions - Total 82.76Public Sector Undertakings National Bank for Agriculture & Rural Development CRISIL A1+ 6.76Steel Authority of India Ltd. CARE A1+ 3.59Small Industries Development Bank Of India. CRISIL A1+ 2.25Public Sector Undertakings - Total 12.60Treasury Bills 63 Days Cash Management Bill 08/08/2017 SOV 7.3891 Days Treasury Bill 24/08/2017 SOV 5.7077 Days Cash Management Treasury Bill 16/08/2017 SOV 4.4991 Days Treasury Bill 10/08/2017 SOV 2.6391 Days Treasury Bill 07/09/2017 SOV 2.11Treasury Bills - Total 22.31Collateral Borrowing & Lending obligation 0.23Net Current Assets/(Liabilities) -21.68Grand Total 100.00
PORTFOLIO
INVESTMENT STYLEDEBT SCHEMES
Investment Objective
To reduce the interest rate risk associated with investments in fixed rate instruments by investing predominantly in floating rate securities, money market instruments and using appropriate derivatives. However, there is no assurance that the objective of the scheme will be realized.
Allotment Date
July 14, 2003
Fund Managers
Mr. Deepak Agrawal*
Benchmark
CRISIL Liquid Fund
AAUM (` In Crores)
AAUM as on June 30, 2017: `14,025.70
AUM (` In Crores)
AUM as on June 30, 2017: `10979.66
Available Plans/Options
A) Regular Plan B) Direct Plan
Options: Dividend Payout (w.e.f May 15, 2017, Under Monthly Dividned option only), Dividend Reinvestment & Growth (applicable for all plans
Dividend Frequency
Daily, Weekly (Every Monday) and Monthly (12th of every Month)
Ratios$Standard Deviation: 0.13%,
Modified Duration:0.14 yrs,
Portfolio Yield: 6.57% $Source: ICRAMFI Explorer. Standard
Deviation is calculated on Annualised basis using 3 years history of monthly returns.
Minimum Investment Amount
Initial Investment: ` 5 0 0 0 U n d e r growth, weekly dividend and monthly dividend option & `1,00,000 under Daily Dividend Reinvestment option,
Additional Investment: `1000 & in multiples of 1
Ideal Investment Horizon: 1-15 days
Load Structure
Entry Load: Nil. (applicable for all plans)
Exit Load: Nil (applicable for all plans) Note - Units issued on reinvestment of dividends shall not be subject to exit load (applicable for all plans)
Total Expense Ratio**
Regular: 0.19%Direct: 0.13%
**Total Expense Ratio excludes applicable B15 fee and service tax.
Short Medium Long Volatiliy
Low
Medium
High
Maturity
Average Maturity of the portfolio based on total maturity of fixed rate and immediate reset date of floating rate instruments : 0.14 years
Kotak Floater Short Term Fund NAV as on June 30, 2017: `2707.1438 (Growth Option), `2713.1460 (Direct Growth Option),`1012.4986 (Weekly Dividend), `1022.1659 (Direct Weekly Dividend), `1004.5504 (Monthly Dividend), `1009.8951 (Direct Monthly Dividend), 1011.6200 (Daily Dividend), 1011.6200 (Direct Daily Dividend)
Investors understand that their principal will be at low risk
Riskometer
yletaredo
M
Moderate
Low
High
Low
High
LOW HIGH
Moderately
This product is suitable for investors who are seeking*:� Income over a short term investment horizon� Investment in floating rate securities, debt & money
market securities* Investors should consult their financial advisors if in doubt about whether the product is suitable for them.
PRODUCT LABEL
SECTOR ALLOCATION (%)SECTOR ALLOCATION (%)
* For Fund Manager experience, please refer page 54-55. For scheme performance, please refer page no 45-53. For last three dividends, please refer page no 56-58
(As on June 30, 2017)
RATING PROFILE (%)
95.58 97.08
92.95
4.56
Net Current AssetsCommercial Paper (CP)/Certificate of Deposits (CD)
Debentures and Bonds CBLO & Term Deposits & Rev.RepoCBLO & Term Deposits & Rev.Repo
Net Current Assets Treasury Bills
95.36
22.31
3.78
0.23‐21.68
121.01
0.44
0.23‐21.68
A1+, A1+(IND), A1+(SO), AAA, IND A1+, IND, A1+(SO), SOV
IND AA-

23
KOTAK TREASURY ADVANTAGE FUND(Formerly Known as Kotak Floater Long Term Scheme)An Open � Ended Debt Scheme
Issuer/Instrument Industry/Rating % to Net Assets
Debt Instruments Debentures and Bonds Corporate Debt/Financial InstitutionsReliance Jio Infocomm Limited(^) CRISIL AAA 9.04HDFC Ltd.(^) CRISIL AAA 4.36Nabha Power Ltd. ( backed by unconditional and irrevocable guarantee by Larsen & Toubro Ltd ) (^) ICRA AAA 4.25Shriram Transport Finance Co Ltd. FITCH IND AA+ 3.74Kotak Mahindra Prime Ltd.(^) CRISIL AAA 3.43Indiabulls Housing Finance Limited CARE AAA 2.70Sheba Properties Ltd. CARE AA+ 2.51Indiabulls Housing Finance Limited(^) ICRA AAA 2.48ICICI Home Finance Company Limited(^) ICRA AAA 2.37Mahindra & Mahindra Financial Services Ltd. FITCH IND AAA 2.31LIC Housing Finance Ltd. CRISIL AAA 2.05Tata Motors Finance Ltd CRISIL AA 1.38Tata Motors Finance Ltd CARE AA+ 1.26Kotak Mahindra Investments Ltd. CRISIL AAA 1.25Vedanta Ltd. CRISIL AA 1.07Tata Capital Financial Services Limited ICRA AA+ 0.93IDFC Bank Limited ICRA AAA 0.92LIC Housing Finance Ltd. CARE AAA 0.65Tata Motors Ltd.(^) CARE AA+ 0.63Family Credit Ltd. CARE AA+ 0.50Mandava Holdings Private Limited ( backed by unconditional and irrevocable undertaking by Axis Capital ) ICRA AAA 0.42Cholamandalam Investment and Finance Company Ltd ICRA AA 0.06Tata Sons Ltd. CRISIL AAA 0.02Corporate Debt/Financial Institutions - Total 48.33Public Sector Undertakings National Bank for Agriculture & Rural Development(^) CRISIL AAA 10.24Power Finance Corporation Ltd.(^) CRISIL AAA 5.74Canara Bank CRISIL AAA 0.75Export-Import Bank of India. CRISIL AAA 0.38PNB Housing Finance Ltd.(^) CARE AAA 0.32Rural Electrification Corporation Ltd. CRISIL AAA 0.32National Housing Bank CRISIL AAA 0.10
Issuer/Instrument Industry/Rating % to Net Assets
Allahabad Bank CRISIL AA- 0.09Indian Railway Finance Corporation Ltd. CRISIL AAA 0.07Power Grid Corporation of India Ltd. CRISIL AAA 0.06Public Sector Undertakings - Total 18.07Government Dated Securities 7.61% Central Government SOV 2.638.75% State Government SOV 0.357.75% State Government SOV 0.138.52% State Government SOV 0.138.0% State Government SOV 0.096.79% Central Government SOV 0.01Government Dated Securities - Total 3.34Futures 7.61% GS 09/05/2030-JUL2017 -2.62Futures (Market value represents Notional Value) - Total -2.62Money Market Instruments Commercial Paper(CP)/Certificate of Deposits(CD) Corporate Debt/Financial Institutions Nabha Power Ltd. ( Backed by Letter of Comfort from L&T ) ICRA A1+ 4.83Larsen and Toubro Ltd. CRISIL A1+ 3.67Tata Motors Ltd. ICRA A1+ 3.54HDFC Ltd. ICRA A1+ 3.13Tata Capital Financial Services Limited CRISIL A1+ 2.38Tata Motors Ltd. CRISIL A1+ 2.37IndusInd Bank Ltd. CRISIL A1+ 0.90HDFC Bank Ltd. CARE A1+ 0.60Canfin Homes Ltd ICRA A1+ 0.37IDFC Bank Limited ICRA A1+ 0.06AXIS Bank Ltd. CRISIL A1+ 0.01Corporate Debt/Financial Institutions - Total 21.86Public Sector UndertakingsIndian Railway Finance Corporation Ltd. CRISIL A1+ 2.45Power Finance Corporation Ltd. CRISIL A1+ 1.76Andhra Bank CARE A1+ 0.04Public Sector Undertakings - Total 4.25Reverse Repo 2.41Treasury Bills 91 Days Treasury Bill 07/09/2017 SOV 2.1591 Days Treasury Bill 21/09/2017 SOV 0.63Treasury Bills - Total 2.78Collateral Borrowing & Lending obligation 0.36Net Current Assets/(Liabilities) 1.22Grand Total 100.00
PORTFOLIO
INVESTMENT STYLEDEBT SCHEMES
Investment Objective
The investment objective of the Scheme is to generate returns through investments in debt and money market instruments with a view to reduce the interest rate risk. However, there is no assurance or guarantee that the investment objective of the scheme will be achieved.
Allotment Date
August 13, 2004
Fund Manager
Mr. Deepak Agrawal*
Benchmark
CRISIL Liquid Fund
AAUM (` In Crores)
AAUM as on June 30, 2017: `8,285.47
AUM (` In Crores)
AUM as on June 30, 2017: `8055.00
Available Plans/Options
A) Regular Plan B) Direct Plan
Options: Dividend Payout, Dividend Reinvestment & Growth (applicable for all plans)
Dividend Frequency
Daily, Monthly (12th of every Month) and Weekly (Every Monday)
Ratios$Standard Deviation:0.46%,
Modified Duration:0.55 yrs,
Portfolio Yield: 7.09%$Source: ICRAMFI Explorer. Standard
Deviation is calculated on Annualised basis using 3 years history of monthly returns.
Minimum Investment Amount
Initial Investment: (i) Dividend Re-investment & Growth- `5000 & above (ii) Dividend Payout (Weekly) - 1,00,00,000 & above
Additional Investment: `1000 & in multiples of 1
Ideal Investment Horizon: 1-3 months
Load Structure
Entry Load: Nil. (applicable for all plans)
Exit Load: Nil.(applicable for all plans) Note - Units issued on reinvestment of dividends shall not be subject to exit load (applicable for all plans)
Total Expense Ratio**
Regular: 0.60%Direct: 0.25%
**Total Expense Ratio excludes applicable B15 fee and service tax.
Short Medium Long Volatiliy
Low
Medium
High
Maturity
Average Maturity of the portfolio based on total maturity of fixed rate and immediate reset date of floating rate instruments : 0.65 years.
Kotak Treasury Advantage Fund NAV as on June 30 , 2017: `10.0798 (Da i l y D iv idend Opt ion ) ,`10.0805 (Daily Dividend - Direct), `26.5060 (Growth Option), `10.2117 (Monthly Dividend Option), `10.1466 (Weekly Dividend Option), `12.1387 (Monthly Dividend - Direct), 10.1627 (Weekly Dividend - Direct), 26.8530 (Growth - Direct Option)
Investors understand that their principal will be at moderately low risk
Riskometer
yletaredo
M
Moderate
Low
High
Low
High
LOW HIGH
Moderately
This product is suitable for investors who are seeking*:� Income over a short term investment horizon� Investment in debt & money market securities* Investors should consult their financial advisors if in doubt about whether the product is suitable for them.
PRODUCT LABEL
RATING PROFILE
* For Fund Manager experience, please refer page 54-55. For scheme performance, please refer page no 45-53. For last three dividends, please refer page no 56-58
(As on June 30, 2017)
SECTOR ALLOCATION (%)
Notes: ^ Fully or Party blocked against Interest Rate Swap (IRS),Hedging Position through Interest Rate Swaps as on 30 Jun 2017 is 24.83% of the net assets.
Net Current Assets
Commercial Paper (CP)/Certificate of Deposits (CD)
Debentures and Bonds
Net Current Assets
Derivatives
CBLO & Term Deposits & Rev.Repo
CBLO & Term Deposits & Rev.RepoGovernment Dated Securities
Derivatives
66.40
26.11
3.34
2.782.77 1.22 ‐2.62
Treasury Bills 86.46
12.17
2.771.22 ‐2.62
A1+, AAA, IND AAA, SOV
AA+, IND AA+, AA, AA-

KOTAK BANKING AND PSU DEBT FUNDEarlier known as Kotak Mahindra Gilt Savings Scheme - 98 - Savings Plan.An Open - Ended Debt Scheme
INVESTMENT STYLEDEBT SCHEMES
Average Maturity of the portfolio based on total maturity of fixed rate and immediate reset date of floating rate instruments 2.97 years.
Kotak Banking And PSU Debt Fund NAV as on June 30, 2017: `37.6455 (Growth Option), `38.0416 (Direct Growth Option),`10.6017(Monthly Dividend), 10.7040 (Direct Monthly Dividend), 10.1879 (Daily Dividend Reinvestment), 10.2597 (Direct Daily Dividend Reinvestment), 15.9167 (Annual Dividend), 16.8469 (Direct Annual Dividend)
Short Medium Long Volatiliy
Low
Medium
High
Maturity
24
Issuer/Instrument Industry/Rating % to Net AssetsDebt Instruments Debentures and Bonds Corporate Debt/Financial Institutions AXIS Bank Ltd. CRISIL AA+ 3.99Corporate Debt/Financial Institutions - Total 3.99Public Sector Undertakings U P Power Corporation Ltd ( Guaranteed By UP State Government ) FITCH IND AA(SO) 11.83Bank Of Baroda CARE AA 9.13Power Finance Corporation Ltd. CRISIL AAA 5.64National Highways Authority Of India CRISIL AAA 5.01State Bank Of India. CRISIL AA+ 4.61Union Bank of India CRISIL AAA 3.56State Bank of Travancore CRISIL AAA 3.52State Bank Of India. CRISIL AAA 3.07Canara Bank CRISIL AAA 3.04Punjab National Bank CARE AA 3.01Union Bank of India CARE AA 2.54Andhra Bank CRISIL AA- 2.48Indian Railway Finance Corporation Ltd. CRISIL AAA 2.48
Issuer/Instrument Industry/Rating % to Net Assets
Oriental Bank of Commerce ICRA A 2.44Bank Of Baroda CARE AA+ 2.32Power Finance Corporation Ltd. ICRA AAA 2.07Rural Electrification Corporation Ltd. CRISIL AAA 1.91Powergrid Vizag Transminssion Ltd. ( backed by unconditional and irrevocable guarantee by Powergrid Corp ) CRISIL AAA(SO) 1.35National Bank for Agriculture & Rural Development CRISIL AAA 0.51Steel Authority of India Ltd. FITCH IND AA 0.40Power Grid Corporation of India Ltd. CRISIL AAA 0.10Public Sector Undertakings - Total 71.02Government Dated Securities 8.53% State Government SOV 3.678.52% State Government SOV 2.258.0% State Government SOV 0.50Government Dated Securities - Total 6.42Collateral Borrowing & Lending obligation 19.48Net Current Assets/(Liabilities) -0.91Grand Total 100.00
PORTFOLIOInvestment Objective
To generate income by predominantly investing in debt & money market securities issued by Banks & PSUs and Reverse repos in such securities, sovereign securities issued by the Central Government and State Governments, and / or any security unconditionally guaranteed by the Govt. of India. However, there is no assurance that the objective of the scheme will be realized.
Allotment Date
December 29,1998
Fund Manager
Mr. Deepak Agrawal*
Benchmark
CRISIL Short Term Bond Fund Index(w.e.f February 1, 2017 )
AAUM (` In Crores)
AAUM as on June 30, 2017:
`1,033.87
AUM (` In Crores)
AUM as on June 30, 2017:
`1000.82
Available Plans/Options
A) Regular Plan B) Direct Plan
Options: Dividend Payout, Dividend Reinvestment & Growth (applicable for all plans)
Dividend Frequency
Daily, Monthly (12th of every Month) & Annual
Ratios$Standard Deviation: 2.15%,
Modified Duration: 2.31 yrs,
Portfolio Yield: 7.67%$Source: ICRAMFI Explorer. Standard
Deviation is calculated on Annualised basis using 3 years history of monthly returns.
Minimum Investment Amount
Initial Investment: Dividend Payout, Dividend Re-investment & Growth 5000 & above.
Additional Investment: `1000 & in multiples of 1.
Ideal Investment Horizon: 1-3 months
Load Structure
Entry Load: Nil. (applicable for all plans)
Exit Load: Nil (applicable for all plans) Note - Units issued on reinvestment of dividends shall not be subject to exit load (applicable for all plans)
Total Expense Ratio**
Regular:0.50%Direct: 0.15%
**Total Expense Ratio excludes applicable B15 fee and service tax.
Investors understand that their principal will be at moderately low risk
Riskometer
yletaredo
M
Moderate
Low
High
Low
High
LOW HIGH
Moderately
This product is suitable for investors who are seeking*:� Income over a short to medium term investment horizon� Investment in debt & money market securities of PSUs,
Banks & government securities* Investors should consult their financial advisors if in doubt about whether the product is suitable for them.
PRODUCT LABEL
* For Fund Manager experience, please refer page 54-55. For scheme performance, please refer page no 45-53. For last three dividends, please refer page no 56-58
(As on June 30, 2017)
Net Current Assets CBLO & Term Deposits & Rev.RepoDebentures and BondsNet Current Assets
Government Dated SecuritiesCBLO & Term Deposits & Rev.Repo
A
75.01
19.48
6.42 ‐0.91
40.31
38.68
19.48
2.44 ‐0.91
AA+, AA, IND AA, IND AA(SO), AA-
AAA, AAA(SO), SOV

25
KOTAK LOW DURATION FUND An Open - Ended Debt Scheme
Issuer/Instrument Industry/Rating % to Net Assets
Debt Instruments Debentures and Bonds Corporate Debt/Financial Institutions Vedanta Ltd. CRISIL AA 10.60HDFC Ltd. CRISIL AAA 6.53S D Corporation Private Limited ( DSRA Guarantee from Shapoorji Pallonji and Company Private Limited) CARE AA+(SO) 5.96Manappuram Finance Ltd(^) ICRA AA- 5.00Piramal Finance Limited ICRA AA 4.74Innovador Traders Pvt Ltd ( backed by unconditional and irrevocable undertaking by Piramal ) ICRA AA-(SO) 4.22Sahyadri Agencies Ltd ( Secured by Equity shares of Jyothy Laboratories Ltd ) BRICKWORK BWR A(SO) 3.63Muthoot Finance Ltd(^) CRISIL AA 3.56Nirma Ltd.(^) CRISIL AA 3.55Varun Beverages Limited CRISIL AA- 2.94Karelides Traders Private Ltd..( backed by unconditional and irrevocable undertaking by a wholly owned subsidiary of Piramal Enterprises Ltd ) ICRA AA-(SO) 2.81Adani Power Ltd ( Secured by Equity shares of Adani Ports and SEZ Ltd, Adani Transmission and Adani Enterprises) BRICKWORK BWR AA-(SO) 2.18Indiabulls Housing Finance Limited ICRA AAA 1.96Nuvoco Vistas Corporation Ltd.(^) CRISIL AA 1.80Pune Solapur Expressways Pvt. Ltd. ( toll road project of Tata Realty & Infrastructure Ltd, 100 subsidiary of Tata Sons ) ICRA A 1.73ECL Finance Limited CARE AA 1.61AXIS Bank Ltd.(^) CRISIL AA+ 1.37Altico Capital India Pvt Ltd FITCH IND AA-(SO) 1.28Intime Properties Ltd. FITCH IND AAA 1.17HPCL Mittal Energy Ltd. ICRA AA 0.88India Infoline Housing Finance Ltd. ICRA AA 0.79Indiabulls Housing Finance Limited CARE AAA 0.70Altico Capital India Pvt Ltd FITCH IND AA- 0.69Mandava Holdings Private Limited ( backed by unconditional and irrevocable undertaking by Axis Capital ) ICRA AAA 0.67Muthoot Fincorp Ltd. CRISIL A- 0.61Trends In Vogue Pvt Ltd. ( backed by unconditional and irrevocable undertaking by Axis Capital ) ICRA AAA(SO) 0.55Vedanta Ltd. CRISIL AA- 0.50Indostar Capital Finance Private Limited CARE AA- 0.46Edelweiss Agri Value Chain Limited ( Unconditional and irrevocable guarantee from Edelweiss Financial Services Limited) CARE AA(SO) 0.38LIC Housing Finance Ltd.(^) CRISIL AAA 0.38
Issuer/Instrument Industry/Rating % to Net Assets
SP Jammu Udhampur Highway Ltd. ( backed by unconditional and irrevocable guarantee of Shapoorji Pallonji & Co Pvt Ltd ) ICRA AAA 0.26Reliance Jio Infocomm Limited CRISIL AAA 0.20HDB Financial Services Ltd. CRISIL AAA 0.10Nabha Power Ltd. ( backed by unconditional and irrevocable guarantee by Larsen & Toubro Ltd ) ICRA AAA 0.10Aspire Home Finance Corporation Ltd ICRA AA- 0.06Shapoorji Pallonji Energy Gujarat Private Limited ( backed by unconditional and irrevocable guarantee of Shapoorji Pallonji & Co Pvt Ltd ) ICRA AA(SO) 0.06Grand View Estates Pvt Ltd ( backed by unconditional and irrevocable guarantee of Shapoorji Pallonji & Co Pvt Ltd ) ICRA AA 0.02Corporate Debt/Financial Institutions - Total 74.05Public Sector Undertakings National Bank for Agriculture & Rural Development(^) CRISIL AAA 4.41National Highways Authority Of India CRISIL AAA 2.48Power Finance Corporation Ltd. CRISIL AAA 2.44Bank Of Baroda(^) CARE AA 2.09Oriental Bank of Commerce(^) ICRA A 2.05Andhra Bank(^) CRISIL AA- 1.97Export-Import Bank of India. CRISIL AAA 0.87Allahabad Bank CRISIL AA- 0.38Rural Electrification Corporation Ltd. CRISIL AAA 0.23Public Sector Undertakings - Total 16.92Government Dated Securities 8.15% State Government SOV 2.238.39% State Government SOV 0.14Government Dated Securities - Total 2.37Money Market Instruments Commercial Paper(CP)/Certificate of Deposits(CD) Corporate Debt/Financial Institutions S D Corporation Private Limited ( DSRA Guarantee from Shapoorji Pallonji and Company Private Limited) CARE A1+(SO) 2.96Shapoorji Pallonji and Company Private Limited ICRA A1+ 2.88IndusInd Bank Ltd. CRISIL A1+ 2.34JM Financial Products Limited CRISIL A1+ 2.34Reliance Infrastructure Ltd ( Backed by SBLC of ICICI Bank) FITCH IND A1+(SO) 0.57HDFC Ltd. ICRA A1+ 0.48Canfin Homes Ltd ICRA A1+ 0.37Corporate Debt/Financial Institutions - Total 11.94Public Sector Undertakings PNB Housing Finance Ltd. CARE A1+ 5.06Public Sector Undertakings - Total 5.06Collateral Borrowing & Lending obligation 0.13Net Current Assets/(Liabilities) -10.47Grand Total 100.00
PORTFOLIO
INVESTMENT STYLEDEBT SCHEMES
Investment Objective
The primary objective of the Scheme is to generate income through investment primarily in low duration debt & money market securities. However, there is no assurance that the objective of the scheme will be realized.
Allotment Date
March 6, 2008
Fund Manager
Mr. Deepak Agrawal *
Benchmark
CRISIL Liquid Fund
AAUM (` In Crores)
AAUM as on June 30, 2017:
`5,759.11
AUM (` In Crores)
AUM as on June 30, 2017:
`5096.78
Available Plans/Options
A) Regular B) Direct Plan
Options: Dividend Payout, Dividend Reinvestment & Growth (dividend payout is available under monthly dividend only) (applicable for all plans)
Dividend Frequency
Weekly (every Monday), Monthly (12th of every month)and Normal (as decided by Trustees)
Ratios$Standard Deviation: 0.77%,
Modified Duration: 1.03 yrs,
Portfolio Yield: 8.12% $Source: ICRAMFI Explorer. Standard
Deviation is calculated on Annualised basis using 3 years history of monthly returns.
Minimum Investment Amount
Initial Investment: `5000 and in multiple of `1 for purchase and for `0.01 for switches
Additional Investment: `1000 & in multiples of `1 for purchase and for `0.01 for switches.
Ideal Investment Horizon: 1-3 months
Load Structure
Entry Load: Nil.
Exit Load: Nil.
Any exit load charged (net off Service Tax, if any) shall be credited back to the Scheme;
Note - Units issued on reinvestment of dividends shall not be subject to entry and exit load.
Total Expense Ratio**
Regular: 0.99%Direct: 0.24%
**Total Expense Ratio excludes applicable B15 fee and service tax.
Short Medium Long Volatiliy
Low
Medium
High
Maturity
Average Maturity of the portfolio based on total maturity of fixed rate and immediate reset date of floating rate instruments : 1.22 years
Kotak Low Duration Fund NAV as on `1053.7181 (Normal Dividend), ` 2019.1038 (Standard Plan-Growth Option), June 30, 2017: `1014.6659 (Standard Plan-Weekly Dividend), `1020.9969 (Standard Plan-Monthly Dividend), ` 2071.9756 (Direct Plan- Growth Option), `1199.1938 (Direct Plan- Weekly Dividend), 1036.3742 (Direct Plan- Monthly Dividend)
Investors understand that their principal will be at moderate risk
Riskometer
yletaredo
M
Moderate
Low
High
Low
High
LOW HIGH
Moderately
This product is suitable for investors who are seeking*:� Regular income over short term� Income by focusing on low duration securities* Investors should consult their financial advisors if in doubt about whether the product is suitable for them.
PRODUCT LABEL
SECTOR ALLOCATION (%) RATING PROFILE
* For Fund Manager experience, please refer page 54-55. For scheme performance, please refer page no 45-53. For last three dividends, please refer page no 56-58
(As on June 30, 2017)
Debentures and Bonds
Note: Fully or Party blocked against Interest Rate Swap (IRS),Hedging Position through Interest Rate Swaps as on 30 Jun 2017 is 17.61% of the net assets.
CBLO & Term Deposits & Rev.Repo
Net Current Assets Government Dated Securities A1+, A1+(SO), AAA, AAA(SO), IND A1+(SO), IND, AAA, SOV
90.97
17.00
2.37
0.13‐10.47
59.90
42.42
8.020.13
‐10.47
AA+, AA+(SO), AA, AA(SO), AA-, AA-(SO), BWR AA- (SO), IND AA-, IND AA-(SO)
Net Current AssetsA, BWR A(SO), A-
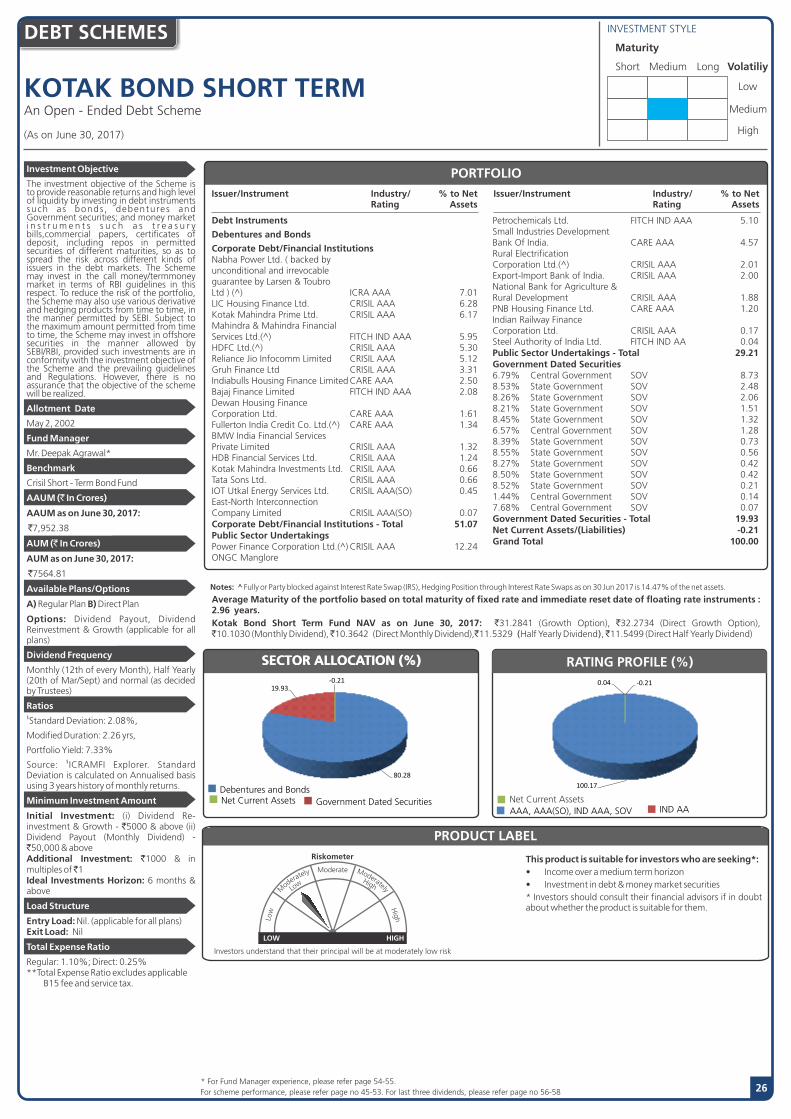
KOTAK BOND SHORT TERMAn Open - Ended Debt Scheme
Issuer/Instrument Industry/ % to Net Rating Assets
Investment Objective
The investment objective of the Scheme is to provide reasonable returns and high level of liquidity by investing in debt instruments such as bonds , debentures and Government securities; and money market i n s t r u m e n t s s u c h a s t r e a s u r y bills,commercial papers, certificates of deposit, including repos in permitted securities of different maturities, so as to spread the risk across different kinds of issuers in the debt markets. The Scheme may invest in the call money/termmoney market in terms of RBI guidelines in this respect. To reduce the risk of the portfolio, the Scheme may also use various derivative and hedging products from time to time, in the manner permitted by SEBI. Subject to the maximum amount permitted from time to time, the Scheme may invest in offshore securities in the manner allowed by SEBI/RBI, provided such investments are in conformity with the investment objective of the Scheme and the prevailing guidelines and Regulations. However, there is no assurance that the objective of the scheme will be realized.
Allotment Date
May 2, 2002
Fund Manager
Mr. Deepak Agrawal*
Benchmark
Crisil Short - Term Bond Fund
AAUM (` In Crores)
AAUM as on June 30, 2017:
7,952.38
AUM (` In Crores)
AUM as on June 30, 2017:
7564.81
Available Plans/Options
A) Regular Plan B) Direct Plan
Options: Dividend Payout, Dividend Reinvestment & Growth (applicable for all plans)
Dividend Frequency
Monthly (12th of every Month), Half Yearly (20th of Mar/Sept) and normal (as decided by Trustees)
Ratios$Standard Deviation: 2.08%,
Modified Duration: 2.26 yrs,
Portfolio Yield: 7.33%$Source: ICRAMFI Explorer. Standard
Deviation is calculated on Annualised basis using 3 years history of monthly returns.
Minimum Investment Amount
Initial Investment: (i) Dividend Re-investment & Growth - `5000 & above (ii) Dividend Payout (Monthly Dividend) - `50,000 & aboveAdditional Investment: `1000 & in multiples of 1Ideal Investments Horizon: 6 months & above
Load Structure
Entry Load: Nil. (applicable for all plans)Exit Load: Nil
Total Expense Ratio
Regular: 1.10%; Direct: 0.25%**Total Expense Ratio excludes applicable B15 fee and service tax.
Issuer/Instrument Industry/ % to Net Rating Assets
PORTFOLIO
INVESTMENT STYLE
Short Medium Long Volatiliy
Maturity
Low
Medium
High
DEBT SCHEMES
Average Maturity of the portfolio based on total maturity of fixed rate and immediate reset date of floating rate instruments : 2.96 years.Kotak Bond Short Term Fund NAV as on June 30, 2017: `31.2841 (Growth Option), `32.2734 (Direct Growth Option),`10.1030 (Monthly Dividend), 10.3642 (Direct Monthly Dividend),`11.5329 (Half Yearly Dividend), 11.5499 (Direct Half Yearly Dividend)
23
Investors understand that their principal will be at moderately low risk
Riskometer
yletaredo
M
Moderate
Low
High
Low
High
LOW HIGH
Moderately
This product is suitable for investors who are seeking*:� Income over a medium term horizon� Investment in debt & money market securities* Investors should consult their financial advisors if in doubt about whether the product is suitable for them.
PRODUCT LABEL
DEBT SCHEMES
26
SECTOR ALLOCATION (%)
* For Fund Manager experience, please refer page 54-55. For scheme performance, please refer page no 45-53. For last three dividends, please refer page no 56-58
(As on June 30, 2017)
Net Current Assets
IND AAGovernment Dated Securities
Debt Instruments
Debentures and Bonds
Corporate Debt/Financial Institutions Nabha Power Ltd. ( backed by unconditional and irrevocable guarantee by Larsen & Toubro Ltd ) (^) ICRA AAA 7.01LIC Housing Finance Ltd. CRISIL AAA 6.28Kotak Mahindra Prime Ltd. CRISIL AAA 6.17Mahindra & Mahindra Financial Services Ltd.(^) FITCH IND AAA 5.95HDFC Ltd.(^) CRISIL AAA 5.30Reliance Jio Infocomm Limited CRISIL AAA 5.12Gruh Finance Ltd CRISIL AAA 3.31Indiabulls Housing Finance Limited CARE AAA 2.50Bajaj Finance Limited FITCH IND AAA 2.08Dewan Housing Finance Corporation Ltd. CARE AAA 1.61Fullerton India Credit Co. Ltd.(^) CARE AAA 1.34BMW India Financial Services Private Limited CRISIL AAA 1.32HDB Financial Services Ltd. CRISIL AAA 1.24Kotak Mahindra Investments Ltd. CRISIL AAA 0.66Tata Sons Ltd. CRISIL AAA 0.66IOT Utkal Energy Services Ltd. CRISIL AAA(SO) 0.45East-North Interconnection Company Limited CRISIL AAA(SO) 0.07Corporate Debt/Financial Institutions - Total 51.07Public Sector Undertakings Power Finance Corporation Ltd.(^) CRISIL AAA 12.24ONGC Manglore
Petrochemicals Ltd. FITCH IND AAA 5.10Small Industries Development Bank Of India. CARE AAA 4.57Rural Electrification Corporation Ltd.(^) CRISIL AAA 2.01Export-Import Bank of India. CRISIL AAA 2.00National Bank for Agriculture & Rural Development CRISIL AAA 1.88PNB Housing Finance Ltd. CARE AAA 1.20Indian Railway Finance Corporation Ltd. CRISIL AAA 0.17Steel Authority of India Ltd. FITCH IND AA 0.04Public Sector Undertakings - Total 29.21Government Dated Securities 6.79% Central Government SOV 8.738.53% State Government SOV 2.488.26% State Government SOV 2.068.21% State Government SOV 1.518.45% State Government SOV 1.326.57% Central Government SOV 1.288.39% State Government SOV 0.738.55% State Government SOV 0.568.27% State Government SOV 0.428.50% State Government SOV 0.428.52% State Government SOV 0.211.44% Central Government SOV 0.147.68% Central Government SOV 0.07Government Dated Securities - Total 19.93Net Current Assets/(Liabilities) -0.21Grand Total 100.00
Notes: Fully or Party blocked against Interest Rate Swap (IRS), Hedging Position through Interest Rate Swaps as on 30 Jun 2017 is 14.47% of the net assets.
Debentures and Bonds
80.28
19.93‐0.21
Net Current Assets
100.17
0.04 ‐0.21
AAA, AAA(SO), IND AAA, SOV

27
KOTAK FLEXI DEBTAn Open - Ended Debt Scheme
Issuer/Instrument Industry/Rating % to Net Assets
Debt Instruments
Debentures and Bonds
Corporate Debt/Financial Institutions Bajaj Finance Limited CARE AAA 10.75Mahindra & Mahindra Financial Services Ltd.(^) CARE AAA 7.52Bhopal Dhule Transmission Company Ltd. CRISIL AAA 4.50Reliance Ports And Terminals Limited CRISIL AAA 3.15Reliance Jio Infocomm Limited(^) CRISIL AAA 1.91AXIS Bank Ltd. CRISIL AA+ 0.45Indiabulls Housing Finance Limited CARE AAA 0.45SP Jammu Udhampur Highway Ltd. ( backed by unconditional and irrevocable guarantee of Shapoorji Pallonji & Co Pvt Ltd ) ICRA AAA 0.14Corporate Debt/Financial Institutions - Total 28.87Public Sector Undertakings Bank Of Baroda CARE AA 2.29Power Grid Corporation of India Ltd. CRISIL AAA 1.40PNB Housing Finance Ltd. CARE AAA 0.46
Issuer/Instrument Industry/Rating % to Net Assets
Export-Import Bank of India. CRISIL AAA 0.09Power Finance Corporation Ltd. CRISIL AAA 0.05Rural Electrification Corporation Ltd. CRISIL AAA 0.04Public Sector Undertakings - Total 4.33Government Dated Securities 7.68% Central Government SOV 23.598.53% State Government SOV 9.626.57% Central Government SOV 9.588.27% State Government SOV 6.578.26% State Government SOV 4.688.06% State Government SOV 4.658.45% State Government SOV 2.011.44% Central Government SOV 1.438.21% State Government SOV 0.989.59% State Government SOV 0.609.49% State Government SOV 0.509.40% State Government SOV 0.18Government Dated Securities - Total 64.39Collateral Borrowing & Lending obligation 1.24Net Current Assets/(Liabilities) 1.17Grand Total 100.00
PORTFOLIO
INVESTMENT STYLEDEBT SCHEMES
Investment Objective
To maximize returns through an active management of a portfolio of debt and money market securities. However, there is no assurance that the objective of the scheme will be realized.
Allotment Date
May 26, 2008
Fund Manager
Mr. Deepak Agrawal*
Benchmark
CRISIL Composite Bond Fund
AAUM (` In Crores)
AAUM as on June 30, 2017:
1,090.86
AUM (` In Crores)
AUM as on June 30, 2017:
1110.88
Available Plans/Options
A)Regular Plan B)Direct Plan
Options: Dividend Payout, Dividend Reinvestment & Growth
(applicable for all plans)
Dividend Frequency
Daily Dividend Reinvestment, Weekly Dividend Reinvestment (Every Monday), Monthly Dividend Payout and Reinvestment (12th of every Month) (w.e.f June 1, 2017), Quarterly Dividend Payout and Reinvestment (20th of March, June, September and December of every year) (applicable for all plans)
Ratios$Standard Deviation: 4.53%,
Modified Duration: 4.81yrs,
Portfolio Yield: 7.46% $Source: ICRAMFI Explorer. Standard
Deviation is calculated on Annualised basis using 3 years history of monthly returns.
Minimum Investment Amount
Initial Investment: `5000 and in multiple of `1 for purchase and for `0.01 for switches
Additional Investment: `1000 & in multiples of 1
Ideal Investment Horizon: 6 months & above
Load Structure
Entry Load: Nil. (applicable for all plans)
Exit Load: Nil
Total Expense Ratio**
Regular:0.90%Direct: 0.35%
**Total Expense Ratio excludes applicable B15 fee and service tax.
Short Medium Long Volatiliy
Low
Medium
High
Maturity
Average Maturity of the portfolio based on total maturity of fixed rate and immediate reset date of floating rate instruments : 6.86 years
Kotak Flexi Debt Fund NAV as on June 30, 2017: `21.5473 (Growth Option), `22.1545 (Direct Growth Option),`10.5313 (Weekly Dividend), `12.8631(Direct Weekly Dividend), `10.0297 (Daily Dividend), `10.0966 (Direct Daily Dividend), `10.8060 (Quarterly Dividend), 10.5954 (Direct Quarterly Dividend)
Investors understand that their principal will be at moderately low risk
Riskometer
yletaredo
M
Moderate
Low
High
Low
High
LOW HIGH
Moderately
This product is suitable for investors who are seeking*:� Income over a medium term investment horizon� Investment in debt & money market securities* Investors should consult their financial advisors if in doubt about whether the product is suitable for them.
PRODUCT LABEL
RATING PROFILESECTOR ALLOCATION (%)
Net Current AssetsGovernment Dated Securities Debentures and Bonds
Net Current Assets
* For Fund Manager experience, please refer page 54-55. For scheme performance, please refer page no 45-53. For last three dividends, please refer page no 56-58
(As on June 30, 2017)
AAA, SOV
Note: ^ Fully or Party blocked against Interest Rate Swap (IRS),Hedging Position through Interest Rate Swaps as on 30 Jun 2017 is 8.95% of the net assets.
AA+, AA
64.39
33.20
1.24 1.17
CBLO & Term Deposits & Rev.Repo
94.85
2.741.24 1.17
CBLO & Term Deposits & Rev.Repo

AA-,
KOTAK INCOME OPPORTUNITIES FUNDAn Open - Ended Debt Scheme
Investment Objective
The investment objective of the scheme is to generate income by investing in debt /and money market securities across the yield curve and credit spectrum. The scheme would also seek to maintain reasonable liquidity within the fund. However, there is no assurance that the objective of the scheme will be realized.
Allotment Date
May 11, 2010
Fund Managers
Mr. Deepak Agrawal*
Benchmark
Crisil Short Term Bond Fund
AAUM (` In Crores)
AAUM as on June 30, 2017:
4,215.09
AUM (` In Crores)
AUM as on June 30, 2017:
4312.34
Available Plans/Options
A) Regular Plan B) Direct Plan
Options: Dividend Payout, Dividend Reinvestment & Growth (applicable for all plans)
Dividend Frequency
Weekly (Every Monday), Monthly (12th of every Month), Quarterly (20th of Mar, Jun, Sep and Dec of every Year), Annual (12th of March).
Ratios$Standard Deviation: 2.02%,
Modified Duration:2.00yrs,
Portfolio Yield: 8.42%$Source: ICRAMFI Explorer. Standard
Deviation is calculated on Annualised basis using 3 years history of monthly returns.
Minimum Investment Amount
Initial Investment: `5000 and in multiple of `1 for purchase and for `0.01 for switches
Additional Investment: `1000 & in multiples of 1
Ideal Investments Horizon: 1 year & above
Load Structure
Entry Load: Nil. (applicable for all plans)
Exit Load: I) For redemption / switch out of upto 10% of the initial investment amount (limit) purchased or switched in within 1 year from the date of allotment: Nil.
II) If units redeemed or switched out are in excess of the limit within 1 year from the date of allotment: 1%.
iii) If units are redeemed or switched out on or after 1 year from the date of allotment: Nil.
iv) Any exit load charged (net off Service Tax, if any) shall be credited back to the respective Scheme. Units issued on reinvestment of dividends shall not be subject to entry and exit load.
Total Expense Ratio**
Regular: 1.60%Direct: 0.90%
**Total Expense Ratio excludes applicable B15 fee and service tax.
INVESTMENT STYLEDEBT SCHEMES
28
Issuer/Instrument Industry/ % to Net Rating Assets
Debt Instruments Debentures and Bonds Corporate Debt/Financial InstitutionsVedanta Ltd.(^) CRISIL AA 9.58Innovador Traders Pvt Ltd ( backed by unconditional and irrevocable undertaking by Piramal ) ICRA AA-(SO) 4.64HPCL Mittal Pipelines Ltd. ICRA AA 4.55Reliance Jio Infocomm Limited(^) CRISIL AAA 3.90HPCL Mittal Energy Ltd. ICRA AA 3.80Tata Power Renewable Energy Ltd. ( Guaranteed by Tata Power Company Ltd) CARE AA(SO) 3.28India Infoline Housing Finance Ltd. ICRA AA 2.79Karelides Traders Private Ltd. ( backed by unconditional and irrevocable undertaking by a wholly owned subsidiary of Piramal Enterprises Ltd ) ICRA AA-(SO) 2.43DLF Emporio Ltd(^) CRISIL AA 2.40AU Small Finance Bank Ltd. FITCH IND A+ 2.34Nirma Ltd.(^) CRISIL AA 2.33Indiabulls Housing Finance Limited ICRA AAA 2.32Janalakshami Financial Services Ltd.(^) ICRA A 2.32K Raheja IT Park (Hyderabad) Ltd. FITCH IND AAA(SO) 2.32Vizag General Cargo Berth Private Limited ( backed by unconditional and irrevocable guarantee of Vedanta Ltd ) CRISIL AA(SO) 2.10Nuvoco Vistas Corporation Ltd. CRISIL AA 2.02ECL Finance Limited(^) ICRA AA 1.90Tata Power Company Ltd. CRISIL AA- 1.83Indiabulls Housing Finance Limited CARE AAA 1.82HDFC Ltd. CRISIL AAA 1.77Prestige Estates Projects Limited ICRA A+ 1.76Reliance Ports And Terminals Limited(^) CRISIL AAA 1.40Muthoot Finance Ltd CRISIL AA 1.35ECL Finance Limited BRICKWORK BWR AA 1.29Ananta Landmarks Pvt Ltd. UNRATED 1.17Edelweiss Agri Value Chain Limited ( Unconditional and irrevocable guarantee from Edelweiss Financial Services Limited) CARE AA(SO) 1.17Tata Steel Limited(^) BRICKWORK BWR AA 1.16AXIS Bank Ltd.(^) CRISIL AA+ 1.04Asirvad Microfinance Private Limited ( 85 subsidiary of Manappuram Finance Ltd ) CRISIL A+ 0.82Dalmia Cement (Bharat) Ltd ICRA AA 0.80ECL Finance Limited CARE AA 0.61Piramal Finance Limited(^) ICRA AA 0.61Kolte-Patil Developers Limited CRISIL A+ 0.59Manappuram Finance Ltd CRISIL AA- 0.59SP Jammu Udhampur Highway Ltd. ( backed by unconditional and irrevocable guarantee of Shapoorji Pallonji & Co Pvt Ltd ) ICRA AAA 0.59SBK Properties Pvt Ltd. ( Guaranteed by a Kalyani Group
Issuer/Instrument Industry/ % to Net Rating Assets
company ) ICRA AA- 0.55Bhopal Dhule Transmission Company Ltd. CRISIL AAA 0.42Continental Drug Company P Ltd ( Secured by Equity shares of Zee Entertainment Enterprises Ltd ) BRICKWORK BWR A+ 0.37Nabha Power Ltd. ( backed by unconditional and irrevocable guarantee by Larsen & Toubro Ltd ) ICRA AAA 0.35Tata Capital Financial Services Limited ICRA AA+ 0.35Essel Lucknow Raebareli Toll Roads Limited CARE AAA 0.34Family Credit Ltd. CARE AA+ 0.23Piramal Enterprises Limited ICRA AA 0.23Mandava Holdings Private Limited ( backed by unconditional and irrevocable undertaking by Axis Capital ) ICRA AAA 0.19Indostar Capital Finance Private Limited CARE AA- 0.05Shriram Transport Finance Co Ltd. CRISIL AA+ 0.05LIC Housing Finance Ltd. CRISIL AAA 0.02Corporate Debt/Financial Institutions - Total 78.54Public Sector Undertakings U P Power Corporation Ltd ( Guaranteed By UP State Government ) (^) FITCH IND AA(SO) 2.71Union Bank of India CARE AA 1.51Indian Railway Finance Corporation Ltd. CRISIL AAA 1.50Oriental Bank of Commerce ICRA A 1.27Corporation Bank CRISIL A 1.25PNB Housing Finance Ltd. CARE AAA 1.18Punjab & Sind Bank ICRA A+ 1.15Bank of India CRISIL A+ 0.96Power Grid Corporation of India Ltd. CRISIL AAA 0.84Bank Of Baroda CARE AA 0.82Power Finance Corporation Ltd. CRISIL AAA 0.81Syndicate Bank CARE AA- 0.53Allahabad Bank CRISIL AA- 0.23Canara Bank CRISIL AAA 0.23Bank of India BRICKWORK BWR AA- 0.15Konkan Railway Corporation Ltd. ICRA AAA 0.12Steel Authority of India Ltd. FITCH IND AA 0.02Public Sector Undertakings - Total 15.28Money Market Instruments Commercial Paper(CP)/Certificate of Deposits(CD) Corporate Debt/Financial Institutions JM Financial Products Limited CRISIL A1+ 2.20S D Corporation Private Limited ( DSRA Guarantee from Shapoorji Pallonji and Company Private Limited) CARE A1+(SO) 1.02Corporate Debt/Financial Institutions - Total 3.22Public Sector Undertakings PNB Housing Finance Ltd. CARE A1+ 0.11Public Sector Undertakings - Total 0.11Collateral Borrowing & Lending obligation 0.54Net Current Assets/(Liabilities) 2.31Grand Total 100.00
PORTFOLIO
Short Medium Long Volatiliy
Maturity
Low
Medium
High
Note: Fully or Party blocked against Interest Rate Swap (IRS),Hedging Position through Interest Rate Swaps as on 30 Jun 2017 is 16.17% of the net assets.
Average Maturity of the portfolio based on total maturity of fixed rate and immediate reset date of floating rate instruments : 2.59 years.Kotak Income Opportunities Fund NAV as on June 30, 2017: `18.2690 (Growth Option), `19.0531 (Direct Growth Option),`10.0025 (Weekly Dividend), `10.4271 (Direct Weekly Dividend), `10.3112 (Monthly Dividend), `10.5325 (Direct Monthly Dividend), `10.6702(Quarterly Dividend), 10.0510 (Direct Quarterly Dividend), 10.4522 (Annual Dividend), 14.3104 (Direct Annual Dividend).
Investors understand that their principal will be at moderately low risk
Riskometer
yletaredo
M
Moderate
Low
High
Low
High
LOW HIGH
Moderately
This product is suitable for investors who are seeking*:� Income over a medium term investment horizon� Investment in debt & money market securities* Investors should consult their financial advisors if in doubt about whether the product is suitable for them.
PRODUCT LABEL
SECTOR ALLOCATION (%)
Net Current Assets
* For Fund Manager experience, please refer page 54-55. For scheme performance, please refer page no 45-53. For last three dividends, please refer page no 56-58
(As on June 30, 2017)
Net Current AssetsCBLO & Term Deposits & Rev.Repo
Commercial Paper (CP)/Certi�cate of Deposits (CD) UnratedA1+, A1+(SO), AAA, IND AAA(SO)
A+, BWR A+, IND A+, A
Debentures and Bonds 93.82
3.33 2.310.54
59.7023.45
12.83
2.31 1.17 0.54
AA+, AA, AA(SO), BWR AA, IND AA, IND AA(SO),AA-(SO), BWR AA-

Net Current AssetsCBLO & Term Deposits & Rev.Repo
29
KOTAK CORPORATE BOND FUNDAn Open - Ended Debt Scheme
Issuer/Instrument Industry/Rating % to Net Assets
Debt InstrumentsDebentures and Bonds Corporate Debt/Financial Institutions Bhopal Dhule Transmission Company Ltd. CRISIL AAA 7.80Mahindra & Mahindra Financial Services Ltd.(^) FITCH IND AAA 7.59Reliance Jio Infocomm Limited(^) CRISIL AAA 7.34Nabha Power Ltd. ( backed by unconditional and irrevocable guarantee by Larsen & Toubro Ltd ) ICRA AAA 4.79Indiabulls Housing Finance Limited CARE AAA 4.22Dewan Housing Finance Corporation Ltd. CARE AAA 2.82ICICI Home Finance Company Limited ICRA AAA 2.61LIC Housing Finance Ltd. CRISIL AAA 0.99SP Jammu Udhampur Highway Ltd. ( backed by unconditional and irrevocable guarantee of Shapoorji Pallonji & Co Pvt Ltd ) ICRA AAA 0.65HDFC Ltd. CRISIL AAA 0.55IOT Utkal Energy Services Ltd. CRISIL AAA(SO) 0.53Bajaj Finance Limited FITCH IND AAA 0.24Ultratech Cement Ltd. CRISIL AAA 0.17Corporate Debt/Financial Institutions - Total 40.30Public Sector Undertakings
Issuer/Instrument Industry/Rating % to Net Assets
National Highways Authority Of India CRISIL AAA 8.84National Bank for Agriculture & Rural Development CRISIL AAA 7.92Power Finance Corporation Ltd.(^) CRISIL AAA 7.90Power Grid Corporation of India Ltd. CRISIL AAA 6.74PNB Housing Finance Ltd. CARE AAA 4.64Export-Import Bank of India. CRISIL AAA 3.98ONGC Manglore Petrochemicals Ltd. FITCH IND AAA 3.97Canara Bank CRISIL AAA 2.02Rural Electrification Corporation Ltd. CRISIL AAA 0.98National Housing Bank CRISIL AAA 0.75Powergrid Vizag Transminssion Ltd. ( backed by unconditional and irrevocable guarantee by Powergrid Corp ) CRISIL AAA(SO) 0.67Airports Authority of India CRISIL AAA 0.09Public Sector Undertakings - Total 48.50Money Market Instruments Commercial Paper(CP)/Certificate of Deposits(CD) Corporate Debt/Financial Institutions BMW India Financial Services Private Limited CRISIL A1+ 4.09Corporate Debt/Financial Institutions - 4.09Collateral Borrowing & Lending obligation 5.80Net Current Assets/(Liabilities) 1.31Grand Total 100.00
PORTFOLIO
INVESTMENT STYLEDEBT SCHEMES
Investment Objective
The Fund seeks to generate income and capital appreciation largely through a focus on investments in corporate debt securities. However, there is no assurance or guarantee that the investment objective of the scheme will be achieved.
Allotment Date
September 21, 2007
Fund Manager
Mr. Deepak Agrawal*
Benchmark
CRISIL Composite Bond Fund
AAUM (` In Crores)
AAUM as on June 30, 2017:
754.95
AUM (` In Crores)
AUM as on June 30, 2017:
1026.25
Available Plans/Options
A) Regular Plan B) Direct Plan
Options: Dividend Payout, Dividend Reinvestment & Growth (applicable for all plans)
Dividend Frequency
Monthly (12th of every Month), Quarterly (20th of Mar, Jun, Sep and Dec of every Year)
Ratios$Standard Deviation: 1.33%,
Modified Duration: 1.85yrs,
Portfolio Yield: 7.28% $Source: ICRAMFI Explorer.
Standard Deviation is calculated on Annualised basis using 3 years history of monthly returns.
Minimum Investment Amount
Initial Investment: `5000 and in multiple of `1 for purchase and for `0.01 for switches
Additional Investment: `1000 & in multiples of `1for purchase and for `0.01 for switches.
Ideal Investment Horizon: 1 Year & Above
Load Structure
Entry Load: Nil. (applicable for all plans)
Exit Load: Nil
Total Expense Ratio**
Regular: 0.50%Direct: 0.30%
**Total Expense Ratio excludes applicable B15 fee and service tax.
Short Medium Long Volatiliy
Low
Medium
High
Maturity
Note: (^) Fully or Party blocked against Interest Rate Swap (IRS), Hedging Position through Interest Rate Swaps as on 30 Jun 2017 is 9.27% of the net assets.
Average Maturity of the portfolio based on total maturity of fixed rate and immediate reset date of floating rate instruments : 2.23 years
Kotak Corporate Bond Fund NAV as on June 30, 2017: `2177.3099 (Standard Plan-Growth Option), `1048.6344 (Standard Plan-Monthly Dividend), `1049.3155 (Standard Plan-Quarterly Dividend), `2215.7766 (Direct Plan- Growth Option), `1102.2765 (Direct Plan- Monthly Dividend)
Investors understand that their principal will be at moderately low risk
Riskometer
yletaredo
M
Moderate
Low
High
Low
High
LOW HIGH
Moderately
This product is suitable for investors who are seeking*:� Regular income over short term� Income by investing in fixed income securities of varying
maturities & credit* Investors should consult their financial advisors if in doubt about whether the product is suitable for them.
PRODUCT LABEL
* For Fund Manager experience, please refer page 54-55. For scheme performance, please refer page no 45-53. For last three dividends, please refer page no 56-58
(As on June 30, 2017)
Debentures and Bonds
CBLO & Term Deposits & Rev.RepoNet Current Assets
88.80
5.804.09 1.31
Commercial Paper (CP)/Certi�cate of Deposits (CD)
92.89
5.801.31
A1+, AAA, AAA(SO), IND AAA

EQUITY SCHEMES
Equity Fund Ready Reckoner (as on June 30, 2017)
Benchmark
Overweight
Mcap (%)
Monthly AAUM (Rs. Crs)
Product Posi�oning
Kotak 50
Large cap
Invest with industry leaders
29‐Dec‐98
Large cap
Long term wealth creators
27‐Jul‐05
ELSS
Tax advantage with poten�al equity growth
23‐Nov‐05
Mul� Cap
Focus on few selected sectors
11‐Sep‐09
Diversified
Spo�ng the hidden gems
09‐Sep‐04
Scheme
Investment Theme
Incep�on Date
Kotak Classic Equity
Kotak Opportuni�es
Kotak Select Focus Fund
Fund Manager
Kotak Tax Saver
Mr. Harish Krishnan
Ni�y 50
1,378.71
74.82% Large Cap23.31% Mid Cap 0.45% Small Cap1.42% Cash
1. Industrial Manufacturing2. Media & Entertainment
3. Cement & Cement Products
Mr. Deepak Gupta
Ni�y 100
104.35
87.49% Large Cap11.24% Mid Cap0.54% Small Cap0.72% Cash
1. Energy 2. Metals
3. IT
Mr. Harsha Upadhyaya Mr. Harsha Upadhyaya
Ni�y 500 Ni�y 200
1,625.55 11,378.20
69.46% Large Cap21.61% Mid Cap4.41% Small Cap4.52% Cash
76.04% Large Cap15.75% Mid Cap1.09% Small Cap7.11% Cash
1. Cement & Cement Products
2. Fer�lisers & Pes�cides3. Energy
1. Cement & Cement Products 2. Energy
3. Automobile
Mr. Harsha Upadhyaya
Ni�y 500
652.51
63.01% Large Cap28.91% Mid Cap6.74% Small Cap1.34% Cash
1. Cement & Cement Products 2. Energy
3. Chemicals
Underweight 1. Financial Services
2. IT3. Metals
1. Financial Services2. Consumer Goods
3. Construc�ons
1. Informa�on technology2. Metals
3. Consumer Goods
1. Informa�on technology2. Metals
3.Consumer Goods
1. Consumer Goods2. Informa�on technology
3. Metals
Beta 1.00 0.97 1.02 1.02 1.09
Sharpe 0.52 0.34 0.80 0.86 0.73
Standard Devia�on 13.41% 12.88% 13.88% 13.98% 14.99%
Key Features
a. Favours industry leaders in cost,innova�on, brand, competence, etc. with a
proven execu�on track record across cycles
b. High convic�on and long term calls taken
a. Focus on sustainable large cap stories which can withstand
market shocks b. These are companies with
pricing power for their compe��ve advantage
or entry barriers
Iden�fies investment
opportuni�es across market capitalisa�on and sectors
a. Invests in a few sectors as the various sectors of
the economy tend to perform differently at different points
of �meb. Flexibility to move across market caps depending on their a�rac�veness during
the economic phase
a. Por�olio is diversified across sectors and
market capitaliza�on segments
b. Offers dual benefits of growth and tax savings
Details provided are as on June 30, 2017. Ratio Source: ICRA MFI Explorer. Risk rate assumed to be 6.25% . *For Kotak Midcap Fund & Kotak Emerging Equity Fund the stocks falling within the mcap range in Nifty Midcap 100 & S&P BSE Mid Small Cap, respectively, would be considered as midcap stocks. Any stock which would have mcap above the highest mcap of these benchmarks would be considered as largecap, and any stock would have mcap below the lowest mcap would be considered as smallcap. N/A: Field not applicable to the scheme owing to its investment theme. Risk Factor: Mutual Fund investments are subject to market risks, read all scheme related documents carefully. Continuous offer of units of all schemes available at NAV based prices. Large cap (>23515 crs)*Mid cap (23515 to 1881 crs)*Small cap (<1881 crs)*
Mr. Deepak Gupta & Mr. Abhishek Bisen
75% of Ni�y 50 Arbitrage Index + 25% of Ni�y 50
754.87
N/A
N/A
Mr. Deepak Gupta
Ni�y 50 Arbitrage Index
7,036.33
N/A
N/AN/A
Crisil Balanced Fund
1,619.16
33.23% Large Cap26.41% Mid Cap7.15% Small Cap33.21% Debt and Cash
Mr. Pankaj Tibrewal & Mr. Abhishek Bisen
N/A
Mr. Harish Krishnan
289.68
N/A
S&P BSE 100S&P BSE Mid Small Cap
2,025.81
13.98% Large Cap64.19% Mid Cap17.27% Small Cap4.56% Cash
Mr. Pankaj Tibrewal
Equity Savings
MIP with equity tax efficiency
13‐Oct‐14
Equity Arbitrage
Arbitrage opportuni�es
29‐Sep‐05
Thema�c: Infrastructure
True to label
25‐Feb‐08
Balanced
Best of both worlds: equity & debt
25‐Nov‐99
Mid and Small Cap
Emerging leaders
30‐Mar‐07
Kotak Equity Savings Fund
Kotak Equity Arbitrage Fund
Kotak Infrastructure & Economic Reform Fund
Kotak Balance FundKotak Emerging Equity Scheme
1. Industrial Manufacturing2. Media & Entertainment
3. Chemicals
N/AN/A
1.Energy2. Consumer Goods
3. AutomobileN/AN/A
0.960.481.170.910.93
0.471.170.520.681.17
3.360.49%10.74%14.92%15.05%
a.Iden�fies the hidden growth poten�al of mid‐cap sized
companiesb. Por�olio exhibits higher vola�lity than large caps however tends to have a
larger return basec. Buy and hold strategy
Mid cap
Spot them young, watch them grow
24‐Feb‐05
Kotak Midcap
Mr. Pankaj Tibrewal
Ni�y Midcap 100
689.72
22.95% Large Cap54.65% Mid Cap20.25% Small Cap2.15% Cash
1. Media & Entertainment2. Industrial Manufacturing
3. Chemicals
1. Energy2. Consumer Goods
3. Informa�on technology
1.01
1.00
15.33%
a. Iden�fies "flow related" companies ‐ These benefit
from spending from government, private and household (in terms of proper�es). They are not asset owners. b. Focus on high quality
companies exhibi�ng superior ROE, posi�ve
cash flow, low leverage in an otherwise
challenging environment
a. Stands for winning investment ideas across the
mid & small cap range offering decent growth
trajectory over the medium to long term horizon
b. Buy and hold strategyc. Riskier than a large cap
fund but offers faster growth rate since it has a smaller based. 15%‐20% alloca�on to large
cap opportuni�es as tac�cal plays
Conserva�ve por�olio with a blend of: a. Income genera�on ‐ through
arbitrage opportuni�es & debt investment
b. Growth poten�al ‐through moderate
par�cipa�on in equity markets
c. Tax efficiency ‐ through equity orienta�on
a. Discovers arbitrage opportuni�es by simultaneously
entering transac�ons of long posi�on in
cash and exactly off‐se�ng short
posi�on in futuresb. Equity posi�on is completely hedged
a. Equity por�on: Mul� cap strategy to iden�fy outstanding companies having well managed
and durable businesses with predictable earnings power
b. Debt por�on: Ac�vely managed with medium to long term
maturityc. Lower vola�lity than a pure
equity or debt fund

DEBT SCHEMES
Dynamic strategy,no cap on dura�on
7.11
19.00
9.61
Nil
Dynamic strategy,no cap on dura�on
7.50
14.89
8.19
Nil
7.33
Nil
Gilt‐Aggressive
585.05
100% Gilt
1 Year and above
9.40% AAA74.04% Gilt13.78% AA
Income‐Aggressive
3,111.25
1 Year and above
7,952.38
2.96
2.26
Kotak BondShort Term
6 Months and above
Avg Mat between1‐3 years
80.05% AAA,19.91% Gilt0.04% AA
STP^^‐Conserva�ve
Kotak GiltInvestment
Kotak Bond Fund
YTM %
ExitLoad
Modified Dura�on(years)
Average Maturity(years)
MonthlyAvg. AUM (Rs crores)
Kotak LiquidScheme
Liquid‐Conserva�ve
14,033.34
100% AAA
1‐15 days
Liquid‐Aggressive
14,025.70
99.56% AAA 0.44%AA
1‐15 days
50.81% AAA,6.43% Gilt40.32% AA
Banking and PSU
1,033.87
6 Months and above
100% AAA
UST^‐Aggressive
754.95
6 Months and above
32.13% AAA59.86% AA51.23% AA
UST^‐Aggressive
5,759.11
1‐3 Months
87.83% AAA12.17% AA
UST^‐Conserva�ve
8,285.47
1‐3 Months
Scheme
Current SchemePosi�oning
Current Por�olioQuality**
Ideal InvestmentHorizon
Kotak FloaterShort Term
Kotak TreasuryAdvantage #
Kotak Low Dura�onFund
Key Differen�ator
Kotak CorporateBond Fund
Kotak Banking & PSUDebt Fund
Maturity< 91 days
6.47
0.13
0.13
Nil
Maturity< 91 days
6.57
0.14
0.14
Nil
Modified dura�on< 6 months
Modified dura�on between6 – 12 months
7.09 8.12
0.65 1.22
0.55 1.03
Nil Nil
80‐100% corporatebond exposure
High quality Banking& PSU assets
7.28 7.67
2.23 2.97
1.85 2.31
Nil Nil
Debt Fund Ready Reckoner (as on June 30, 2017)
ISEC CompositeCrisil Composite
Bond Fund
Withdrawal up to 15% ofinvestment amt within
1 yr: Nil Within 18 months : 2% , A�er 18
months : Nil
Avg Mat between3‐7 years
3.55
2.67
8.47
33.21% AAA,55.60% AA,0.36% Gilt
Accrual
4,333.07
2.5 Years and above
Kotak MediumTerm
CRISIL Composite Bond Fund
Nil
7.46
6.86
4.81
Dynamic strategy, dura�on hasnever gone above 5 years.
32.89% AAA64.38% Gilt2.73% AA
Dynamic STP
1,090.86
6 Months and above
Kotak Flexi Debt
CRISIL Composite Bond
Withdrawal up to 10% ofinvestment amt within
1 yr: NilWithin 1 year : 1% , A�er 1 year : Nil
8.42
2.59
2.00
Upto 65% in > 1 yr papers, try tocapitalize on mispriced credits
26.30% AAA59.70% AA
Accrual
4,215.09
1 Year and above
Kotak IncomeOpportuni�es Fund
Crisil Short Term Bond FundCrisil Short ‐ Term Bond Fund
BenchmarkCrisil Liquid Fund Index
Crisil Liquid Fund Index
Crisil Short Term Bond Fund Index
CRISIL Composite Bond Fund
CRISIL Liquid FundCrisil Liquid Fund Index
Note: ^UST = Ultra Short Term plan, ^^STP= Short Term plan. **AAA also includes A1+,A1+(SO), AAA(SO), IND AAA , Net current Assets, CBLO, Term Deposit and Rev repo. For Kotak Gilt Fund: Cash and Cash Equivalent is included under Gilt. For Liquid schemes ( Kotak Liquid Scheme and Kotak Floater Short Term ) and Liquid plus schemes (Kotak Treasury Advantage and Kotak Low Dura�on) T‐bill is included in AAA. “AA” includes AA,AA+,AA‐.
Risk Factor: Mutual Fund investments are subject to market risks, read all scheme related documents carefully. Con�nuous Offer of units of all schemes available at NAV based prices.

Issuer/Instrument Industry/Rating % to Net Assets
Debt InstrumentsDebentures and BondsCorporate Debt/Financial InstitutionsReliance Jio Infocomm Limited(^) CRISIL AAA 8.39K Raheja IT Park (Hyderabad) Ltd. FITCH IND AAA(SO) 4.56Nuvoco Vistas Corporation Ltd.(^) CRISIL AA 4.54HPCL Mittal Energy Ltd. ICRA AA 3.32Piramal Finance Limited(^) ICRA AA 3.29Vizag General Cargo Berth Private Limited ( backed by unconditional and irrevocable guarantee of Vedanta Ltd ) CRISIL AA(SO) 3.09Dalmia Cement (Bharat) Ltd ICRA AA 3.07Tata Power Company Ltd.(^) CRISIL AA- 2.54Vedanta Ltd.(^) CRISIL AA 2.44Sundaram BNP Paribas Home Finance Ltd ICRA AA+ 2.27inance Ltd ICRA AA+ 2.27Birla Corporation Ltd. CARE AA 2.06Nirma Ltd.(^) CRISIL AA 2.05AXIS Bank Ltd. CRISIL AA+ 2.04ECL Finance Limited ICRA AA 1.86Prestige Estates Projects Limited ICRA A+ 1.73Reliance Utilities And Power Private Limited CRISIL AAA 1.67Tata Steel Limited CARE AA 1.54The Indian Hotels Company Ltd. CARE AA+ 1.48HPCL Mittal Pipelines Ltd. ICRA AA 1.28Ananta Landmarks Pvt Ltd. UNRATED 1.15Edelweiss Agri Value Chain Limited ( Unconditional and irrevocable guarantee from Edelweiss Financial Services Limited) CARE AA(SO) 1.13Bhopal Dhule Transmission Company Ltd. CRISIL AAA 1.09Indiabulls Housing Finance Limited CARE AAA 1.03Tata Steel Limited BRICKWORK BWR AA 1.02Muthoot Finance Ltd CRISIL AA 0.92Janalakshami Financial Services Ltd. ICRA A 0.90Essel Lucknow Raebareli Toll Roads Limited CARE AAA 0.81Tata Power Renewable Energy Ltd. ( Guaranteed by Tata Power Company Ltd) CARE AA(SO) 0.77SBK Properties Pvt Ltd. ( Guaranteed by a Kalyani Group company ) ICRA AA- 0.62AU Small Finance Bank Ltd. FITCH IND A+ 0.61East-North Interconnection Company Limited CRISIL AAA(SO) 0.59Bajaj Finance Limited CARE AAA 0.58L & T Housing Finance Ltd. CARE AA+ 0.57Reliance Ports And Terminals Limited(^) CRISIL AAA 0.57ECL Finance Limited BRICKWORK BWR AA 0.46Asirvad Microfinance Private
Issuer/Instrument Industry/Rating % to Net Assets
Limited ( 85 subsidiary of Manappuram Finance Ltd ) CRISIL A+ 0.44Intime Properties Ltd. FITCH IND AAA 0.33IOT Utkal Energy Services Ltd. CRISIL AAA(SO) 0.23Nabha Power Ltd. ( backed by unconditional and irrevocable guarantee by Larsen & Toubro Ltd ) ICRA AAA 0.23Tata Capital Financial Services Limited ICRA AA+ 0.23Edelweiss Housing Finance Limited ICRA AA 0.21Mandava Holdings Private Limited ( backed by unconditional and irrevocable undertaking by Axis Capital ) ICRA AAA 0.14LIC Housing Finance Ltd. CRISIL AAA 0.11SP Jammu Udhampur Highway Ltd. ( backed by unconditional and irrevocable guarantee of Shapoorji Pallonji & Co Pvt Ltd ) ICRA AAA 0.11Corporate Debt/Financial Institutions - Total 68.07Public Sector Undertakings U P Power Corporation Ltd ( Guaranteed By UP State Government ) FITCH IND AA(SO) 6.32Power Finance Corporation Ltd. CRISIL AAA 3.54PNB Housing Finance Ltd.(^) CARE AAA 3.04Indian Railway Finance Corporation Ltd. CRISIL AAA 1.92Bank Of Baroda CARE AA 1.73Andhra Bank(^) CRISIL AA- 1.65Union Bank of India CARE AA 1.39Oriental Bank of Commerce ICRA A 1.37Bank of India CRISIL A+ 1.18Punjab & Sind Bank ICRA A+ 1.13Corporation Bank CRISIL A 1.00IDBI Bank Ltd ICRA BBB- 0.83Syndicate Bank CARE AA- 0.59Export-Import Bank of India. CRISIL AAA 0.57Union Bank of India FITCH IND AA 0.57Bank of India BRICKWORK BWR AA- 0.52Bank of Maharashtra CRISIL A- 0.50State Bank of Travancore CRISIL AAA 0.26Konkan Railway Corporation Ltd. ICRA AAA 0.12Bank Of Baroda CARE AA+ 0.05Public Sector Undertakings - Total 28.28Government Dated Securities 1.44% Central Government SOV 0.36Government Dated Securities - Total 0.36Money Market Instruments Commercial Paper(CP)/Certificate of Deposits(CD) Corporate Debt/Financial Institutions BMW India Financial Services Private Limited CRISIL A1+ 0.11Corporate Debt/Financial Institutions - Total 0.11Collateral Borrowing & Lending obligation 0.20Net Current Assets/(Liabilities) 2.98Grand Total 100.00
PORTFOLIOInvestment Objective
The investment objective of the scheme is to generate regular income and capital appreciation by investing in a portfolio of medium term debt and money market instruments. However, there is no assurance that the objective of the scheme will be realized.
Allotment Date
March 21, 2014
Fund Manager
Mr. Deepak Agrawal*
Benchmark
CRISIL Composite Bond Fund
AAUM (` In Crores)
AAUM as on June 30, 2017:
4,333.07
AUM (` In Crores)
AUM as on June 30, 2017:
4397.77
Available Plans/Options
A) Regular Plan B) Direct Plan
Options: Dividend Payout, Dividend Reinvestment & Growth (applicable for all plans)
Dividend Frequency
Quarterly (20th of Mar, Jun, Sep and Dec of every Year), Annually (12th of March)
Ratios$Standard Deviation: 2.52%,
Modified Duration: 2.67yrs,
Portfolio Yield: 8.47%$Source: ICRAMFI Explorer. Standard
Deviation is calculated on Annualised basis using 3 years history of monthly returns.
Minimum Investment Amount
Initial Purchase: `5,000/- and in multiples of 1 for purchases and for `0.01 for switches.
Additional Purchase: `1000 & in multiples of 1.for purchases and for 0.01 for switches.
Ideal Investment Horizon: 2.5 years & above
Load Structure
Entry Load: Nil. (applicable for all plans)
Exit Load: i) For redemption / switch out of upto 15% of the initial investment amount (limit) purchased or switched in within 18 months from the date of allotment: Nil.
ii) If units redeemed or switched out are in excess of the limit within 18 months from the date of allotment: 2%.
iii) If units are redeemed or switched out on or after 18 months from the date of allotment: Nil.
iv) Any exit load charged (net off Service Tax, if any) shall be credited back to the respective Scheme. Units issued on reinvestment of dividends shall not be subject to entry and exit load.
Total Expense Ratio**Regular: 1.70%Direct: 0.96%**Total Expense Ratio excludes applicable B15 fee and service tax.
Average Maturity of the portfolio based on total maturity of fixed rate and immediate reset date of floating rate instruments : 3.55 years
Kotak Medium Term Fund NAV as on June 30, 2017: `13.8068 (Growth Option), `14.2533 (Direct Growth Option),`10.5184 (Quarterly Dividend), 10.5244 (Direct Quarterly Dividend), 10.7037 (Annual Dividend), 14.2878 (Direct Annual Dividend).
PRODUCT LABEL
RATING PROFILE
Net Current Assets
30
KOTAK MEDIUM TERM FUNDAn Open - Ended Debt Scheme
INVESTMENT STYLEDEBT SCHEMES
Short Medium Long Volatiliy
Low
Medium
High
Maturity
Investors understand that their principal will be at moderate risk
Riskometer
yletaredo
M
Moderate
Low
High
Low
High
LOW HIGH
Moderately
This product is suitable for investors who are seeking*:� Income over a medium term investment horizon� Investment in debt, government securities & money
market instruments with a portfolio weighted average maturity between 3-7 years
* Investors should consult their financial advisors if in doubt about whether the product is suitable for them.
* For Fund Manager experience, please refer page 54-55. For scheme performance, please refer page no 45-53. For last three dividends, please refer page no 56-58
(As on June 30, 2017)
CBLO & Term Deposits & Rev.Repo
Note: ^ Fully or Party blocked against Interest Rate Swap (IRS),Hedging Position through Interest Rate Swaps as on 30 Jun 2017 is 16.97% of the net assets.
Government Dated Securities
Debentures and Bonds
Net Current AssetsUnrated
96.35
2.980.36 0.20
0.11
Commercial Paper (CP)/Certi�cate of Deposits (CD)
55.6230.36
8.86
2.981.15 0.83
0.20
AA+, AA, AA(SO), BWR AA, IND AA, IND AA(SO), AA-, BWR AA-A1+, AAA, AAA(SO), IND AAA, IND AAA(SO), SOV
A+, IND A+, A, A- BBB-
CBLO & Term Deposits & Rev.Repo

KOTAK BONDAn Open - Ended Debt Scheme
Investment Objective
To create a portfolio of debt and money market instruments of different maturities so as to spread the risk across a wide maturity horizon & different kinds of issuers in the debt market. However, there is no assurance that the objective of the scheme will be realized.
Allotment Date
November 25, 1999
Fund Manager
Mr. Abhishek Bisen*
Benchmark
Crisil Composite Bond Fund
AAUM (` In Crores)
AAUM as on June 30, 2017:
`3,111.25
AUM (` In Crores)
AUM as on June 30, 2017:
`3100.25
Available Plans/Options
A) Regular Plan B) Direct Plan
Options: Dividend Payout, Dividend Reinvestment & Growth (applicable for all plans)
Dividend Frequency
Quarterly (20th of Mar/Jun/Sep/Dec), Half Yearly (20th of Mar/Sept), Annual (12th of Mar) (applicable for all plans)
Ratios$Standard Deviation: 7.33%
Modified Duration: 8.19yrs
Portfolio Yield: 7.50%$Source: ICRAMFI Explorer. Standard
Deviation is calculated on Annualised basis using 3 years history of monthly returns.
Minimum Investment Amount
Initial Investment: `5000 and in multiple of `1 for purchase and for `0.01 for switches
Additional Investment: `1000 & in multiples of 1
Ideal Investments Horizon: 1 year & above
Load Structure
Entry Load: Nil. (applicable for all plans)
Exit Load: Nil.
Note - Units issued on reinvestment of dividends shall not be subject to exit load (applicable for all plans)
Total Expense Ratio**
Regular: 1.80%Direct: 0.90%
**Total Expense Ratio excludes applicable B15 fee and service tax.
DEBT SCHEMES
31
Issuer/Instrument Industry/ % to Net Rating Assets
Debt InstrumentsDebentures and Bonds Corporate Debt/Financial Institutions Bajaj Finance Limited CRISIL AAA 6.47East-North Interconnection Company Limited CRISIL AAA(SO) 0.76HDFC Ltd. CRISIL AAA 0.03Vedanta Ltd. CRISIL AA 0.03Hindalco Industries Ltd. CRISIL AA- 0.01Corporate Debt/Financial Institutions - Total 7.30Public Sector Undertakings U P Power Corporation Ltd ( Guaranteed By UP State Government ) FITCH IND AA(SO) 8.39Andhra Bank CRISIL AA- 2.84Allahabad Bank FITCH IND A 1.65Bank Of Baroda CARE AA+ 1.51Syndicate Bank CARE AA- 0.99Bank of India CRISIL A+ 0.87National Bank for Agriculture &
PORTFOLIO
INVESTMENT STYLE
Short Medium Long Volatiliy
Maturity
Low
Medium
High
Average Maturity of the portfolio based on total maturity of fixed rate and immediate reset date of floating rate instruments : 14.89 years.Kotak Bond Fund NAV as on June 30, 2017: `47.8309 (Growth Option), `49.4551 (Direct Growth Option),`10.8615 (Quarterly Dividend), 13.3842 (Direct Quarterly Dividend), 29.3044 (Annual Dividend), 22.3530 (Direct Annual Dividend)
Investors understand that their principal will be at moderate risk
Riskometer
yletaredo
M
Moderate
Low
High
Low
High
LOW HIGH
Moderately
This product is suitable for investors who are seeking*:� Income over long term investment horizon� Investment in debt & money market securities* Investors should consult their financial advisors if in doubt about whether the product is suitable for them.
PRODUCT LABEL
SECTOR ALLOCATION (%)
* For Fund Manager experience, please refer page 54-55. For scheme performance, please refer page no 45-53. For last three dividends, please refer page no 56-58
(As on June 30, 2017)
Net Current Assets
Government Dated SecuritiesDebentures and Bonds
Issuer/Instrument Industry/ % to Net Rating Assets
Rural Development CRISIL AAA 0.30IDBI Bank Ltd ICRA BBB- 0.26State Bank Of India. CRISIL AA+ 0.01Public Sector Undertakings - Total 16.82Government Dated Securities 7.61% Central Government SOV 29.346.79% Central Government SOV 10.866.57% Central Government SOV 10.616.62% Central Government SOV 9.977.73% Central Government SOV 7.077.06% Central Government SOV 4.987.88% Central Government SOV 0.521.44% Central Government SOV 0.347.70% State Government SOV 0.238.72% State Government SOV 0.098.13% Central Government SOV 0.04Government Dated Securities - Total 74.05Collateral Borrowing & Lending obligation 0.36Net Current Assets/(Liabilities) 1.47Grand Total 100.00
CBLO & Term Deposits & Rev.RepoCBLO & Term Deposits & Rev.Repo
AAA, AAA(SO), SOVA+, IND ABBB-
Net Current Assets74.05
24.12
1.470.36
81.61
13.78
2.52 1.47 0.36 0.26
AA+, AA, IND AA(SO), AA-

KOTAK GILT INVESTMENTAn Open - Ended Dedicated Gilt Unit Scheme
Investment Objective
To generate risk-free returns through investments in sovereign securities issued by the Central and /or State Government(s) and/ or reverse repos in such securities. However, there is no assurance that the objective of the scheme will be realized.
Allotment Date
Regular Plan - December 29, 1998;
PF & Trust Plan - November 11, 2003
Fund Manager
Mr. Abhishek Bisen*
Benchmark
ISEC Composite
AAUM (` In Crores)
AAUM as on June 30, 2017:
` 585.05
AUM (` In Crores)
AUM as on June 30, 2017:
`603.02
Available Plans/Options
A) Regular Non Direct Plan,
B) PF & Trust Non Direct Plan,
C) Regular Direct Plan, D) PF & Trust Direct Plan/
Options: Dividend Payout, Dividend Reinvestment & Growth (applicable for all plans)
Dividend Frequency
Quarterly (20th of Mar/Jun/Sep/Dec)
Ratios$Standard Deviation: A) Regular Plan: 8.32%, B) PF & Trust Plan: 8.32%,
Modified Duration: 9.61 yrs,
Portfolio Yield:7.11%$Source: ICRAMFI Explorer. Standard
Deviation is calculated on Annualised basis using 3 years history of monthly returns.
Minimum Investment Amount
Initial Investment: `5000 and in multiple of `1 for purchase and for `0.01 for switches
Additional Investment: `1000 & in multiples of 1
Ideal Investments Horizon: 1 year & above
Load Structure
Entry Load: (a) Regular Plan - Entry: Nil. (b) PF & Trust Plan - Entry: Nil. (applicable for all plans)
Exit Load: (a) Regular Plan - Exit: Nil. (b) PF&Trust Plan - Exit: Nil. (applicable for all plans)
Note - Units issued on reinvestment of dividends shall not be subject to exit load (applicable for all plans)
Total Expense Ratio**
Regular: 1.40%Direct: 0.40%
**Total Expense Ratio excludes applicable
INVESTMENT STYLE
Short Medium Long Volatiliy
Maturity
Low
Medium
High
PORTFOLIOIssuer/Instrument Industry/ % to Net Rating Assets
Government Dated Securities
7.73% Central Government SOV 19.50
7.61% Central Government SOV 18.42
6.79% Central Government SOV 17.43
6.62% Central Government SOV 16.30
7.06% Central Government SOV 11.53
6.57% Central Government SOV 11.23
7.73% State Government SOV 1.69
8.27% State Government SOV 0.86
8.52% State Government SOV 0.61
7.7% State Government SOV 0.51
7.86% State Government SOV 0.34
8.43% State Government SOV 0.17
8.21% State Government SOV 0.08
Issuer/Instrument Industry/ % to Net Rating Assets
8.39% State Government SOV 0.07
Government Dated Securities - Total 98.74
Net Current Assets/(Liabilities) 1.26
Grand Total 100.00
DEBT SCHEMES
Average Maturity of the portfolio based on total maturity of fixed rate and immediate reset date of floating rate instruments : 19.00 years.
Kotak Gilt Investment Fund NAV as on June 30, 2017: `58.9069 (Regular-Growth), `61.5715 (Regular-Growth-Direct),`13.1258(Quarterly-Dividend), 113.9020 (Quarterly-Dividend Direct), 60.2655 (PF & Trust-Growth), 63.0469 (PF & Trust-Growth Direct), `11.7341 (PF & Trust-Quarterly Dividend ),
Investors understand that their principal will be at moderate risk
Riskometer
yletaredo
M
Moderate
Low
High
Low
High
LOW HIGH
Moderately
This product is suitable for investors who are seeking*:� Income over a long investment horizon� Investments in sovereign securities issued by the Central
and/or State Government(s) and / or reverse repos in such securities.
* Investors should consult their financial advisors if in doubt about whether the product is suitable for them.
PRODUCT LABEL
SECTOR ALLOCATION (%)
Net Current Assets SOV
32* For Fund Manager experience, please refer page 54-55. For scheme performance, please refer page no 45-53. For last three dividends, please refer page no 56-58
(As on June 30, 2017)
98.74
1.26
Government Dated SecuritiesNet Current Assets
98.74
1.26

KOTAK MONTHLY INCOME PLANAn Open Ended Income Scheme. Monthly Income is not assured & is subject to availability of distributable surplus
Investment Objective
To enhance returns over a portfolio of Debt Instruments with a moderate exposure in Equity and Equity related Instruments. However, there is no assurance that the objective of the scheme will be realized.
Allotment Date
December 02, 2003
Fund Managers
Mr. Devender Singhal &
Mr. Abhishek Bisen*
Benchmark
CRISIL MIP Blended
AAUM (` In Crores)
AAUM as on June 30, 2017:
297.34
AUM (` In Crores)
AUM as on June 30, 2017:
307.31
Available Plans/Options
A) Regular Plan B) Direct Plan
Options: Dividend Payout, Dividend Reinvestment & Growth (applicable for all plans)
Dividend Frequency
Monthly (12th of every Month) Quarterly (20th of Mar/Jun/Sep/Dec)
Ratios$Standard Deviation:4.56%
Modified Duration: 4.44yrs
Portfolio Yield: 7.71%$Source: ICRAMFI Explorer. Standard
Deviation is calculated on Annualised basis using 3 years history of monthly returns.
Minimum Investment Amount
Initial Investment: (i) Dividend Re-investment & Growth and Dividend Payout (Quarterly) - `5000 & above (ii) Dividend Payout (Monthly) - `50,000 & above Additional Investment: `1000 & in multiples of 1
Ideal Investments Horizon - 1 year & above
Load Structure
Entry Load: Nil. (applicable for all plans)
Exit Load:
i) For redemption / switch out of upto 10% of the initial investment amount (limit) purchased or switched in within 1 year from the date of allotment: Nil.
ii) If units redeemed or switched out are in excess of the limit within 1 year from the date of allotment: 1%.
iii) If units are redeemed or switched out on or after 1 year from the date of allotment: Nil.
iv) Any exit load charged (net off Service Tax, if any) shall be credited back to the respective Scheme. Units issued on reinvestment of dividends shall not be subject to entry and exit load.
Total Expense Ratio**
Regular: 2.28%Direct: 1.78%**Total Expense Ratio excludes applicable B15 fee and service tax.
DEBT SCHEMES
33
INVESTMENT STYLE
Short Medium Long Volatility
Low
Medium
High
Maturity
Value Blend Growth Size
Large
Mid
Small
Style
Issuer/Instrument Industry/ % to Net Rating Assets
Equity & Equity related (Listed/Awaiting listing on Stock Exchange)ITC Ltd. Consumer Non Durables 2.11ICICI Bank Ltd. Banks 1.04Bata India Ltd. Consumer Durables 0.96Tata Communications Ltd Telecom - Services 0.94Sun TV Limited. Media and Entertainment 0.93Eris Lifesciences Ltd Pharmaceuticals 0.91Infosys Ltd. Software 0.91State Bank Of India Banks 0.89Tata Motors Ltd. Auto 0.89Hero MotoCorp Ltd. Auto 0.83Colgate Palmolive (India ) Ltd. Consumer Non Durables 0.76Maruti Suzuki India Limited Auto 0.68Whirlpool of India Ltd. Consumer Durables 0.66Bombay Burmah Trading Corporation Ltd. Consumer Non Durables 0.60Manpasand Beverages Ltd. Consumer Non Durables 0.60Godfrey Phillips India Ltd. Consumer Non Durables 0.56MindTree Ltd. Software 0.53DR.Lal Pathlabs Ltd Healthcare Services 0.51Federal Bank Ltd. Banks 0.49VST Industries Limited Consumer Non Durables 0.43Phillips Carbon Black Ltd. Chemicals 0.40GP Petroleums Limited Petroleum Products 0.39GAIL (India) Ltd. Gas 0.37Tata Steel Limited. Ferrous Metals 0.36Bharat Earth Movers Ltd. Industrial Capital Goods 0.35HDFC Ltd. Warrants Finance 0.35ICICI Prudential Life Insurance Company Ltd Finance 0.31Mcleod Russel India Ltd Consumer Non Durables 0.28Tech Mahindra Ltd. Software 0.26The Ramco Cements Ltd Cement 0.25Granules India Ltd. Pharmaceuticals 0.17AU Small Finance Bank Ltd. Banks 0.16Bharat Electronics Ltd Industrial Capital Goods 0.15Tata Motors Ltd - DVR Auto 0.11JK Cement Ltd. Cement 0.01Listed/Awaiting Listing on Stock Exchange - Total 20.15
Issuer/Instrument Industry/ % to Net Rating Assets
Debt Instruments Debentures and Bonds Corporate Debt/Financial Institutions LIC Housing Finance Ltd. CRISIL AAA 0.84Corporate Debt/Financial Institutions - Total 0.84Public Sector Undertakings Punjab & Sind Bank ICRA A+ 4.85Vijaya Bank ICRA AA- 3.98Syndicate Bank CARE AA- 3.37Canara Bank CRISIL AAA 1.66Rural Electrification Corporation Ltd. CRISIL AAA 0.03Public Sector Undertakings - Total 13.89Government Dated Securities 7.61% Central Government SOV 30.988.18% State Government SOV 6.766.57% Central Government SOV 6.308.27% State Government SOV 3.396.79% Central Government SOV 3.268.72% State Government SOV 2.83Government Dated Securities - Total 53.52TERM DEPOSITS AXIS Bank Ltd. 0.20Term Deposits - Total 0.20Collateral Borrowing & Lending obligation 1.22Net Current Assets/(Liabilities) 10.18Grand Total 100.00
PORTFOLIO
Average Maturity of the portfolio based on total maturity of fixed rate and immediate reset date of floating rate instruments 6.75 years.Kotak Monthly Income Plan Fund NAV as on June 30, 2017: `28.9243 (Growth Option), `30.134 (Direct Growth Option),`13.1991 (Monthly Dividend), 13.5259 (Direct Monthly Dividend), 14.3297 (Quarterly Dividend), 14.800 (Direct Quarterly Dividend)
Investors understand that their principal will be at moderate risk
Riskometer
yletaredo
M
Moderate
Low
High
Low
High
LOW HIGH
Moderately
This product is suitable for investors who are seeking*:� Income & capital growth over a long term horizon� Investment in a portfolio of debt instruments with a
moderate exposure in equity & equity related Instruments.
* Investors should consult their financial advisors if in doubt about whether the product is suitable for them.
PRODUCT LABEL
SECTOR ALLOCATION (%) RATING PROFILE
CBLO & Term Deposits & Rev.RepoCBLO & Term Deposits & Rev.Repo
* For Fund Manager experience, please refer page 54-55. For scheme performance, please refer page no 45-53. For last three dividends, please refer page no 56-58
(As on June 30, 2017)
Net Current Assets
Notes: Term Deposit as provided above is towards margin for derivatives transactions
AAA, SOVEquitiesAA-
53.5220.15
14.73
10.181.42
56.0520.15
10.187.35
4.851.42
A+

KOTAK MULTI ASSETALLOCATION FUNDAn Open - Ended Hybrid Scheme
Investment Objective
The investment objective of the scheme is to generate income by investing predominantly in debt and money market securities, to generate growth by taking moderate exposure to equity and equity re lated inst ruments and prov ide diversification by investing in Gold ETFs. However, there is no assurance that the objective of the scheme will be realized.
Allotment Date
January 21, 2011
Fund Managers Mr. Deepak Gupta &Mr. Abhishek Bisen*
Benchmark
65% CRISIL Short Term Bond Fund,
25% Nifty 50 and 10% Price of Gold.
(w.e.f April 12, 2017)
AAUM (` In Crores)
AAUM as on June 30, 2017:
16.02
AUM (` In Crores)
AUM as on June 30, 2017:
`15.77
Available Plans/Options
A) Regular Plan B) Direct Plan
Options: Dividend Payout, Dividend Reinvestment & Growth (applicable for all plans))
Dividend Frequency
Monthly (12th of Every Month), Quarterly (20th of Mar/Jun/Sep/Dec), Annual (12th of March)
Ratios$Standard Deviation: 3.47%,
Modified Duration: 2.20yrs,
Portfolio Yield: 7.31%$Source: ICRAMFI Explorer. Standard
Deviation is calculated on Annualised basis using 3 years history of monthly returns.
Minimum Investment Amount
Initial Investment: `10000 and in multiple of `1 for purchase and for `0.01 for switches
Additional Investment: `1000 & in multiples of 1
Ideal Investments Horizon: 1 year & above
Load Structure
Entry Load: Nil. (applicable for all plans)
Exit Load: i) For exit within 1 year from the date of allotment of units: 1%. ii) For exit after 1 year from the date of allotment
of units: Nil. iii) Any exit load charged (net off Service Tax, if any) shall be credited back to the Scheme.
Note - Units issued on reinvestment of dividends shall not be subject to exit load (applicable for all plans)
Total Expense Ratio**
Regular:2.38%Direct: 0.53%
**Total Expense Ratio excludes applicable B15 fee and service tax.
DEBT SCHEMES
34
INVESTMENT STYLE
Short Medium Long Volatility
Low
Medium
High
Maturity
Value Blend Growth Size
Large
Mid
Small
Style
Issuer/Instrument Industry/ % to Net Rating Assets
Equity & Equity related (Listed/Awaiting listing on Stock Exchange)ITC Ltd. Consumer Non Durables 0.94Bharat Petroleum Corporation Ltd. Petroleum Products 0.89Power Grid Corporation Of India Ltd Power 0.89Grasim Industries Ltd. Cement 0.81Tata Steel Limited. Ferrous Metals 0.80IndusInd Bank Ltd. Banks 0.79Hindalco Industries Ltd Non - Ferrous Metals 0.74Yes Bank Ltd Banks 0.73Reliance Industries Ltd. Petroleum Products 0.70National Thermal Power Corporation Limited Power 0.69Infosys Ltd. Software 0.68Hero MotoCorp Ltd. Auto 0.57Bajaj Finance Limited Finance 0.55Laurus Labs Ltd Pharmaceuticals 0.54Hindustan Unilever Ltd. Consumer Non Durables 0.46Maruti Suzuki India Limited Auto 0.42Petronet LNG Ltd. Gas 0.37HDFC Ltd. Finance 0.36Tata Motors Ltd. Auto 0.32The Ramco Cements Ltd Cement 0.31ICICI Bank Ltd. Banks 0.29Zee Entertainment Enterprises Ltd Media and Entertainment 0.29Axis Bank Ltd Banks 0.28Piramal Enterprises Limited Pharmaceuticals 0.27Tata Consultancy Services Ltd. Software 0.27Eicher Motors Ltd Auto 0.26JSW Steel Ltd. Ferrous Metals 0.23Vedanta Ltd. Non - Ferrous Metals 0.20Housing & Urban Development Corporation Ltd Finance 0.19Larsen And Toubro Ltd. Construction Project 0.19Bajaj Finserv Ltd. Finance 0.18Muthoot Finance Ltd Finance 0.18State Bank Of India Banks 0.17Tata Motors Ltd - DVR Auto 0.16HCL Technologies Ltd. Software 0.15Indian Oil Corporation Ltd Petroleum Products 0.14S Chand And Company Ltd Media and Entertainment 0.12Wipro Ltd. Software 0.12HDFC Bank Ltd. Banks 0.10Oil & Natural Gas Corporation Ltd. Oil 0.10Central Depository Services (India) Ltd Finance 0.09Indraprastha Gas Ltd. Gas 0.09
Issuer/Instrument Industry/ % to Net Rating Assets
Hindustan Petroleum Corporation Ltd Petroleum Products 0.08Tata Communications Ltd Telecom - Services 0.07Tech Mahindra Ltd. Software 0.06Biocon Ltd. Pharmaceuticals 0.05Hindustan Zinc Ltd. Non - Ferrous Metals 0.03Sun Pharmaceuticals Industries Ltd. Pharmaceuticals 0.02Listed/Awaiting Listing on Stock Exchange - Total 16.94Mutual Fund Units Kotak Mutual Fund - Kotak Gold ETF Mutual Fund Units 9.85Mutual Fund Units - Total 9.85Futures CNX NIFTY-JUL2017 -1.36Futures (Market value represents Notional Value) - Total -1.36Debt Instruments Debentures and Bonds Corporate Debt/Financial Institutions Hindalco Industries Ltd. CRISIL AA- 5.41Corporate Debt/Financial Institutions - Total 5.41Government Dated Securities 8.45% State Government SOV 19.978.53% State Government SOV 19.968.72% State Government SOV 10.04Government Dated Securities - Total 49.97TERM DEPOSITS AXIS Bank Ltd. 1.59Term Deposits - Total 1.59Collateral Borrowing & Lending obligation 6.59Net Current Assets/(Liabilities) 11.01Grand Total 100.00
PORTFOLIO
Average Maturity of the portfolio based on total maturity of fixed rate and immediate reset date of floating rate instruments: 2.80 years.Kotak Multi Asset Allocation Fund NAV as on June 30, 2017: `16.5744 (Growth Option), `17.4665 (Direct Growth Option),`13.8210 (Monthly Dividend), 12.2759 (Quarterly Dividend), 12.7476 (Direct Quarterly Dividend), 11.6548 (Annual Dividend), 12.4008 (Direct Annual Dividend)
Investors understand that their principal will be at moderate risk
Riskometer
yletaredo
M
Moderate
Low
High
Low
High
LOW HIGH
Moderately
This product is suitable for investors who are seeking*:� Income & capital growth over a long term horizon� Investment in a portfolio of diversified asset classes of
debt, equity & gold
* Investors should consult their financial advisors if in doubt about whether the product is suitable for them.
PRODUCT LABEL
Net Current Assets AA-
* For Fund Manager experience, please refer page 54-55. For scheme performance, please refer page no 45-53. For last three dividends, please refer page no 56-58
(As on June 30, 2017)
Government Dated SecuritiesSOV
Notes: Term Deposit as provided above is towards margin for derivatives transactions
Debentures and BondsMutual Fund Units
Derivatives
DerivativesMutual Fund Units
49.97
16.94
11.01
9.858.18
5.41 ‐1.36
49.97
16.94
11.01
9.858.18
5.41 ‐1.36

35
Details of exposure across all Debt Funds of Kotak Mahindra Mutual Fund as on June 30, 2017
Issuer Name%age of Exposure
to Debt AUM $ Issuer Name%age of Exposure
to Debt AUM $AU Small Finance Bank Ltd. 0.18AXIS Bank Ltd. 1.83Aasan Corporate Solutions Private Limited ( Guaranteed by a Piramal Group Company ) 0.10Adani Power Ltd ( Secured by Equity shares of Adani Ports and SEZ Ltd, Adani Transmission and Adani Enterprises) 0.30Adani Transmission Ltd 0.14Aditya Birla Finance Ltd. 0.29Airports Authority of India 0.04Allahabad Bank 0.14Altico Capital India Pvt Ltd 0.14Ananta Landmarks Pvt Ltd. 0.15Andhra Bank 0.43Asirvad Microfinance Private Limited ( 85% subsidiary of Manappuram Finance Ltd ) 0.08Aspire Home Finance Corporation Ltd 0.10BMW India Financial Services Private Limited 0.22Bajaj Capital Ventures Pvt. Ltd. ( Secured by Equity shares of Bajaj Corp. Ltd ) 0.11Bajaj Finance Limited 1.95Bank Of Baroda 0.59Bank of India 0.27Bank of Maharashtra 0.03Barclays Investments & Loan (India) Ltd. 0.07Bhanu Vyapaar Private Limited ( Secured by Equity shares of Emami Ltd ) 0.07Bhopal Dhule Transmission Company Ltd. 0.29Birla Corporation Ltd. 0.13CBLO/REVERSE REPO 1.97Camden Industries Ltd. ( backed by unconditional and irrevocable undertaking of Axis Capital ) 0.07Canara Bank 0.18Canfin Homes Ltd 0.07Central Government 15.16Cholamandalam Investment and Finance Company Ltd 0.01Continental Drug Company P Ltd ( Secured by Equity shares of Zee Entertainment Enterprises Ltd ) 0.33Corporation Bank 0.14DLF Emporio Ltd 0.15Dalmia Cement (Bharat) Ltd 0.29Dewan Housing Finance Corporation Ltd. 0.65ECL Finance Limited 1.10East-North Interconnection Company Limited 0.08Edelweiss Agri Value Chain Limited ( Unconditional and irrevocable guarantee from Edelweiss Financial Services Limited) 0.42Edelweiss Commodities Services Ltd. 0.32Edelweiss Housing Finance Limited 0.06Edisons Utility Works Pvt.Ltd. ( Secured by Equity shares of Zee Entertainment Enterprises Ltd ) 0.17Emami Enclave Makers Pvt Ltd. ( Secured by Equity shares of Emami Ltd ) 0.07Essel Lucknow Raebareli Toll Roads Limited 0.07Export-Import Bank of India. 0.52Family Credit Ltd. 0.13Ford Credit India Pvt. Ltd. 0.07Fullerton India Credit Co. Ltd. 0.33Grand View Estates Pvt Ltd ( backed by unconditional and irrevocable guarantee of Shapoorji Pallonji & Co Pvt Ltd ) 0.27Gruh Finance Ltd 0.36HDB Financial Services Ltd. 0.29HDFC Bank Ltd. 2.80HDFC Ltd. 4.28HPCL Mittal Energy Ltd. 0.51HPCL Mittal Pipelines Ltd. 0.36Hero Cycles Ltd. 0.04High Point Properties Pvt LTD ( backed by unconditional and irrevocable guarantee of Shapoorji Pallonji & Co Pvt Ltd ) 0.12Hindalco Industries Ltd. 0.00Hinduja Leyland Finance Ltd. 0.15Hindustan Zinc Ltd 0.43ICICI Bank Ltd. 0.14ICICI Home Finance Company Limited 0.45IDBI Bank Ltd 0.06IDFC Bank Limited 0.84IIFL Wealth Finance Ltd. 0.61IL & FS Transportation Networks Limited ( Secured by Equity shares of IL & FS Ltd ) 0.11IOT Utkal Energy Services Ltd. 0.12India Infoline Finance Limited 0.72India Infoline Housing Finance Ltd. 0.28Indiabulls Housing Finance Limited 1.48Indian Oil Corporation Ltd. 0.02Indian Railway Finance Corporation Ltd. 0.66Indostar Capital Finance Private Limited 0.22IndusInd Bank Ltd. 1.07Innovador Traders Pvt Ltd ( backed by unconditional and irrevocable undertaking by Piramal ) 0.60Intime Properties Ltd. 0.11JM Financial Products Limited 0.34Janalakshami Financial Services Ltd. 0.22K Raheja IT Park (Hyderabad) Ltd. 0.43Karelides Traders Private Ltd. ( backed by unconditional and irrevocable undertaking by a wholly owned subsidiary of Piramal Enterprises Ltd ) 0.36
Kolte-Patil Developers Limited 0.06Konkan Railway Corporation Ltd. 0.02Kotak Mahindra Investments Ltd. 0.22Kotak Mahindra Prime Ltd. 1.72L & T Housing Finance Ltd. 0.04LIC Housing Finance Ltd. 1.48Larsen and Toubro Ltd. 0.43MA MULTI TRADE PVT LTD ( Secured by Equity shares of Bajaj Corp. Ltd ) 0.11Mahindra & Mahindra Financial Services Ltd. 1.46Manappuram Finance Ltd 0.96Mandava Holdings Private Limited ( backed by unconditional and irrevocable undertaking by Axis Capital ) 0.20Muthoot Finance Ltd 1.27Muthoot Fincorp Ltd. 0.04Nabha Power Ltd. ( Backed by Letter of Comfort from L&T ) 0.56Nabha Power Ltd. ( backed by unconditional and irrevocable guarantee by Larsen & Toubro Ltd ) 1.78National Bank for Agriculture & Rural Development 4.29National Highways Authority Of India 0.39National Housing Bank 0.18Nirma Ltd. 0.70Nuvoco Vistas Corporation Ltd. 0.58ONGC Manglore Petrochemicals Ltd. 0.65Oriental Bank of Commerce 0.35PNB Housing Finance Ltd. 1.15Piramal Enterprises Limited 0.01Piramal Finance Limited 2.16Power Finance Corporation Ltd. 4.02Power Grid Corporation of India Ltd. 0.37Powergrid Vizag Transminssion Ltd. ( backed by unconditional and irrevocable guarantee by Powergrid Corp ) 0.03Prestige Estates Projects Limited 0.29Pune Solapur Expressways Pvt. Ltd. ( toll road project of Tata Realty & Infrastructure Ltd, 100% subsidiary of Tata Sons ) 0.13Punjab & Sind Bank 0.22Punjab National Bank 0.04Reliance Industries Ltd. 2.14Reliance Infrastructure Ltd ( Backed by SBLC of ICICI Bank) 0.04Reliance Jio Infocomm Limited 3.34Reliance Ports And Terminals Limited 0.17Reliance Utilities And Power Private Limited 0.11Rural Electrification Corporation Ltd. 0.83S D Corporation Private Limited ( DSRA Guarantee from Shapoorji Pallonji and Company Private Limited) 0.72SBK Properties Pvt Ltd. ( Guaranteed by a Kalyani Group company ) 0.07SP Jammu Udhampur Highway Ltd. ( backed by unconditional and irrevocable guarantee of Shapoorji Pallonji & Co Pvt Ltd ) 0.11Sahyadri Agencies Ltd ( Secured by Equity shares of Jyothy Laboratories Ltd ) 0.27Shapoorji Pallonji Energy Gujarat Private Limited ( backed by unconditional and irrevocable guarantee of Shapoorji Pallonji & Co Pvt Ltd ) 0.09Shapoorji Pallonji and Company Private Limited 0.21Sheba Properties Ltd. 0.29Shriram City Union Finance Ltd. 0.18Shriram Transport Finance Co Ltd. 0.87Small Industries Development Bank Of India. 1.39Sneha Abasan Pvt Ltd ( Secured by Equity shares of Emami Ltd ) 0.06Sneha Enclave Pvt Ltd ( Secured by Equity shares of Emami Ltd ) 0.03State Bank Of India. 0.18State Bank of Travancore 0.07State Government 2.67Steel Authority of India Ltd. 1.45Sundaram BNP Paribas Home Finance Ltd 0.22Sundaram Finance Ltd. 0.01Suraksha Realty Ltd ( Secured by Equity shares of Sun Pharmaceuticals Industries Ltd ) 1.35Syndicate Bank 0.17Tata Capital Financial Services Limited 0.49Tata Capital Housing Finance Ltd; 0.09Tata Motors Finance Ltd 0.31Tata Motors Finance Solutions Private Limited 0.14Tata Motors Ltd. 0.76Tata Power Company Ltd. 0.49Tata Power Renewable Energy Ltd. ( Guaranteed by Tata Power Company Ltd) 0.25Tata Sons Ltd. 0.11Tata Steel Limited 1.69The Indian Hotels Company Ltd. 0.09Trapti Trading & Investments Private Limited 0.07Trends In Vogue Pvt Ltd. ( backed by unconditional and irrevocable undertaking by Axis Capital ) 0.25U P Power Corporation Ltd ( Guaranteed By UP State Government ) 1.22Ultratech Cement Ltd. 0.02Union Bank of India 0.31Varun Beverages Limited 0.22Vedanta Ltd. 1.69Vijaya Bank 0.06Vizag General Cargo Berth Private Limited ( backed by unconditional and irrevocable guarantee of Vedanta Ltd ) 0.33Total 100.00
Industry / Sector %age of Exposure to Debt AUM $
BANK 10.12CASH(CBLO/REVERSE REPO) 1.97CORPORATES 28.94FINANCIAL SERVICES 22.69GOI/TBILLS 17.83NBFC 17.37REAL ESTATE 1.08Total 100.00
$ - Includes Hybrid schemes - debt schemes having equity exposure

KOTAK ASSET ALLOCATOR FUNDAn Open � Ended Fund of Funds Scheme(Earlier known as Kotak Equity FOF Scheme)
Issuer/Instrument Industry/Rating % to Net Assets
Issuer/Instrument Industry/Rating % to Net Assets
Investment Objective
The investment objective of the scheme is to generate long-term capital appreciation from a portfolio created by investing in specified open-ended equity, and debt schemes of Kotak Mahindra Mutual Fund. However, there is no assurance that the investment objective of the Scheme will be realized.
Allotment Date
August 9, 2004
Fund Manager
Mr. Deepak Gupta*
Benchmark
Crisil Balanced Fund
AAUM (` In Crores)
AAUM as on June 30, 2017:
31.93
AUM (` In Crores)
AUM as on June 30, 2017: 31.93
Available Plans/Options
A) B) Regular Plan Regular Plan
Options: Dividend Payout, Dividend Reinvestment & Growth (applicable for all plans)
Dividend Frequency
Trustee�s Discretion
Minimum Investment Amount
Initial Investment: `5000 and in multiple of `1 for purchase and for `0.01 for switches
Additional Investment: `1000 & in multiples of 1
Ideal Investments Horizon: 3 years & above
Load Structure
Entry Load: Nil. (applicable for all plans)
Exit Load: I) 1% if exit before 1 year from date of allotment.
II) Nil if exit after 1 year from the date of allotment.
Exit Load shall be applicable incase of switch from Regular Plan (where broker code is mentioned) to Direct Plan
Exit Load shall not be applicable:
Incase of switch from Regular Plan (where no b roker code i s mentioned) to Direct Plan
In case of switch from Direct Plan to Regular Plan.
III) Any exit load charged (net off Service Tax, if any) shall be credited back to the Scheme (applicable for all plans).
Note - Units issued on reinvestment of dividends shall not be subject to entry and exit load. (applicable for all plans)
Total Expense Ratio**
Regular: 1.70%
Direct: 1.11%
**Total Expense Ratio excludes applicable B15 fee and service tax.
FUND OF FUNDS INVESTMENT STYLE
Short Medium Long Volatility
Low
Medium
High
Maturity
Value Blend Growth Size
Large
Mid
Small
Style
PORTFOLIO
Equity & Equity related (Listed/Awaiting listing on Stock Exchange)
Mutual Fund Units
Kotak Treasury Advantage Fund
Direct Growth Debt Scheme 60.45
Kotak Mahindra Bond Plan Debt Scheme 19.66
Kotak Select Focus Fund
Direct Growth Equity Scheme 9.60
Kotak Liquid Regular
Direct Growth Debt Scheme 8.56
Mutual Fund Units - Total 98.27
Net Current Assets/(Liabilities) 1.73
Grand Total 100.00
This product is suitable for investors who are seeking*:� Long term capital growth� Investment in open-ended diversified equity schemes and debt schemes of
Kotak Mahindra Mutual Fund* Investors should consult their financial advisors if in doubt about whether the product is suitable for them.
PRODUCT LABEL
Investors understand that their principal will be at moderate risk
Riskometer
yletaredo
M
Moderate
Low
High
Low
High
LOW HIGH
Moderately
SECTOR ALLOCATION (%)
For scheme performance, please refer page no 45-53. For last three dividends, please refer page no 56-58 * For Fund Manager experience, please refer page 54-55.
36
(As on June 30, 2017)
Kotak Asset Allocator Fund NAV as on June 30, 2017: `71.749 (Dividend Option), `73.334 (Direct Dividend Option), `73.709(Growth Option), `74.677 (Direct Growth Option)
Equity Scheme Debt Scheme Others
9.60
88.67
1.73

An Open Ended Fund of Funds Scheme Investing Overseas
INVESTMENT STYLE
Investment Objective
The primary investment objective of the scheme is to provide long term capital appreciation by investing in units of a fund that invests predominantly in equity and equity related securities of companies having assets, products or operations in the United States. However, there is no assurance that the investment objective of the Scheme will be realized.
Allotment Date
December 20, 2013
Fund Manager
Mr. Deepak Gupta*
Benchmark
Standard & Poor's 500 Total Return Net Index in USD is the benchmark of the underlying scheme. The same converted into INR using RBI reference rate will be the benchmark for the scheme.
AAUM (` In Crores)
AAUM as on June 30, 2017: 4.77
AUM (` In Crores)
AUM as on June 30, 2017: 4.71
Available Plans/Options
A) B) Direct Plan Regular Plan
Options: Dividend Payout, Dividend Reinvestment & Growth (applicable for all plans)
Dividend Frequency
Trustee�s Discretion
Minimum Investment Amount
Initial Investment: `5000 and in multiple of `1 for purchase and for `0.01 for switches
Additional Investment: `1000 & in multiples of 1
Ideal Investments Horizon: 3 years & above
Load Structure
Entry Load: Nil. (applicable for all plans)
Exit Load: I) For redemptions / switch outs (including SIP/STP) within 1 year from the date of allotment of units, irrespective of the amount of investment � 1%;
ii) For redemptions / switch outs (including SIP/STP) after 1 year from the date of allotment of units, irrespective of the amount of investment � NIL;
iii) Any exit load charged (net off Service Tax, if any) shall be credited back to the Scheme;
Note - Units issued on reinvestment of dividends shall not be subject to entry and exit load.
Total Expense Ratio**
Regular:1.40%
Direct: 0.62%
**Total Expense Ratio excludes applicable B15 fee and service tax.
KOTAK US EQUITY FUND
FUND OF FUNDS
37
Value Blend Growth Size
Large
Mid
Small
Style
Issuer/Instrument Industry/Rating % to Net Assets
Issuer/Instrument Industry/Rating % to Net Assets
PORTFOLIO
Equity & Equity related (Listed/Awaiting listing on Stock Exchange)
Mutual Fund Units
Pinebridge US Large Cap Research
Enhance Fund Overseas Mutual Fund 95.37
Mutual Fund Units - Total 95.37
Net Current Assets/(Liabilities) 4.63
Grand Total 100.00
This product is suitable for investors who are seeking*:� Long term capital growth� Long term capital appreciation by investing in Units of PineBridge US Large
Cap Research Enhanced Fund which in turn invests in equity and equity related securities of companies having assets, products or operations in the United States.
* Investors should consult their financial advisors if in doubt about whether the product is suitable for them.
PRODUCT LABEL
Investors understand that their principal will be at high risk
Riskometer
yletaredo
M
Moderate
Low
High
Low
High
LOW HIGH
Moderately
Overseas Mutual Fund
SECTOR ALLOCATION (%)
For scheme performance, please refer page no 45-53. * For Fund Manager experience, please refer page 54-55.
(As on June 30, 2017)
Kotak US Equity Fund NAV as on June 30, 2017: `13.377 (Dividend Option), `13.743 (Direct Dividend Option), `13.375 (Growth Option), `13.742 (Direct Growth Option)
Others
95.37
4.63

KOTAK GLOBAL EMERGING MARKET FUNDAn Open - Ended Equity Scheme
Issuer/Instrument Industry/Rating % to Net Assets
Issuer/Instrument Industry/Rating % to Net Assets
PORTFOLIOInvestment Objective
The investment objective of the scheme is to generate long-term capital appreciation by investing in an overseas mutual fund scheme that invest in a diversified portfolio of securities as prescribed by SEBI from time to time in global emerging markets. However, there is no assurance that the objective of the scheme will be realized.
Allotment Date
September 26, 2007
Fund Managers
Mr. Deepak Gupta (Dedicated fund manager for Fund Managers overseas investment) & Mr.Abhishek Bisen*
Benchmark
MSCI Emerging Market
AAUM (` In Crores)
AAUM as on June 30, 2017:
27.47
AUM (` In Crores)
AUM as on June 30, 2017: 27.47
Available Plans/Options
A) B) Direct Plan Regular Plan
Options: Dividend Payout, Dividend Reinvestment & Growth (applicable for all plans)
Dividend Frequency
Trustee�s Discretion
Minimum Investment Amount
Initial Investment: `5000 and in multiple of `1 for purchase and for `0.01 for switches
Additional Investment: `1000 & in multiples of 1
Ideal Investments Horizon: 3 years & above
Load Structure
Entry Load: Nil. (applicable for all plans)
Exit Load: I) For exit within 1 year from the date of allotment of units: 1%.
ii) For exit after 1 year from the date of allotment of units: Nil
iii) Any exit load charged (net off Service Tax, if any) shall be credited back to the Scheme. (applicable for all plans)
Note - Units issued on reinvestment of dividends shall not be subject to exit load (applicable for all plans)
Total Expense Ratio**
Regular: 1.84%
Direct: 0.71%
**Total Expense Ratio excludes applicable B15 fee and service tax.
FUND OF FUNDS
38
Kotak Global Emerging Market Fund NAV as on June 30, 2017: 14.014 (Dividend Option), 14.536 (Direct Dividend Option), 14.014 (Growth Option), 14.488 (Direct Growth Option)
INVESTMENT STYLE
Value Blend Growth Size
Large
Mid
Small
Style
Equity & Equity related (Listed/Awaiting listing on Stock Exchange)
Mutual Fund Units
MGF Asian Small Equity
Fund Class I Overseas Mutual Fund 73.13
ishares MSCI Emerging
Markets ETF Overseas Mutual Fund 25.55
Mutual Fund Units - Total 98.68
Net Current Assets/(Liabilities) 1.32
Grand Total 100.00
This product is suitable for investors who are seeking*:� Long term capital growth� Investment in overseas mutual fund schemes that invest in a diversified portfolio of securities in global emerging markets * Investors should consult their financial advisors if in doubt about whether the product is suitable for them.
PRODUCT LABEL
Investors understand that their principal will be at high risk
Riskometer
yletaredo
M
Moderate
Low
High
Low
High
LOW HIGH
Moderately
Overseas Mutual Fund Others
SECTOR ALLOCATION (%)
For scheme performance, please refer page no 45-53. * For Fund Manager experience, please refer page 54-55.
(As on June 30, 2017)
98.68
1.32

FUND OF FUNDS
KOTAK WORLD GOLD FUND
Issuer/Instrument Industry/Rating % to Net Assets
Issuer/Instrument Industry/Rating % to Net Assets
INVESTMENT STYLE
Investment Objective
The primary investment objective of the Scheme is to provide long term capital appreciation by investing predominantly in units of Falcon Gold Equity Fund. The Scheme may, at the discretion of the Investment Manager, also invest in the units of other similar overseas mutual fund schemes. The Scheme may also invest a certain portion of its corpus in debt and money market securities and/or units of debt/liquid schemes of Mutual Funds, in order to meet liquidity requirements from time to time. However, there is no assurance that the investment objective of the Scheme will be realized.
Allotment Date
June 6, 2008
Fund Manager
Mr. Deepak Gupta*
Benchmark
Financial Times Gold Mines Total Price Index, in USD is the benchmark of Falcon Gold Equity Fund. The above translated to INR using the RBI Reference Rate will be the benchmark of Kotak World Gold Fund.
AAUM (` In Crores)
AAUM as on June 30, 2017:
42.45
AUM (` In Crores)
AUM as on June 30, 2017:`41.50
Available Plans/Options
A) B) Direct Plan Regular Plan
Options: Dividend Payout, Dividend Reinvestment & Growth (applicable for all plans)
Dividend Frequency
Trustee�s Discretion
Minimum Investment Amount
Initial Investment: `5000 and in multiple of `1 for purchase and for `0.01 for switches
Additional Investment: `1000 & in multiples of `1 for purchase and for `0.01 for switches
Ideal Investments Horizon: 3 years & above
Load Structure
Entry Load: Nil. (applicable for all plans)
Exit Load:
I) For redemptions / switch outs (including SIP/STP) within 1 year from the date of allotment of units, irrespective of the amount of investment � 1%;
ii) For redemptions / switch outs (including SIP/STP) after 1 year from the date of allotment of units, irrespective of the amount of investment � NIL;
iii) Any exit load charged (net off ServiceTax, if any) shall be credited back to the Scheme;
Note - Units issued on reinvestment of dividends shall not be subject to entry and exit load.
Total Expense Ratio**
Regular: 1.90%
Direct: 1.14%
**Total Expense Ratio excludes applicable B15 fee and service tax.
Style
An Open � Ended Fund of Funds Scheme
39
Value Blend Growth Size
Large
Mid
Small
Equity & Equity related (Listed/Awaiting listing on Stock Exchange)
Mutual Fund Units
Falcon Gold Equity ASIA Overseas Mutual Fund 101.12
Mutual Fund Units - Total 101.12
Net Current Assets/(Liabilities) -1.12
Grand Total 100.00
PORTFOLIO
Kotak World Gold Fund NAV as on June 30, 2017: `7.444 (Dividend Option), `7.706 (Direct Dividend Option), `8.980 (Growth Option), `9.254 (Direct Growth Option)
This product is suitable for investors who are seeking*:� Long term capital growth� Long term capital appreciation by investing in units of Falcon Gold Equity
Fund which in turn invests in international securities of gold production, processing and marketing companies
* Investors should consult their financial advisors if in doubt about whether the product is suitable for them.
PRODUCT LABEL
Investors understand that their principal will be at high risk
Riskometer
yletaredo
M
Moderate
Low
High
Low
High
LOW HIGH
Moderately
Overseas Mutual Fund Others
SECTOR ALLOCATION (%)
98.43
4.53‐
For scheme performance, please refer page no 45-53. * For Fund Manager experience, please refer page 54-55.
99.03102.15
97.71100.05
(As on June 30, 2017)
101.12
‐1.12
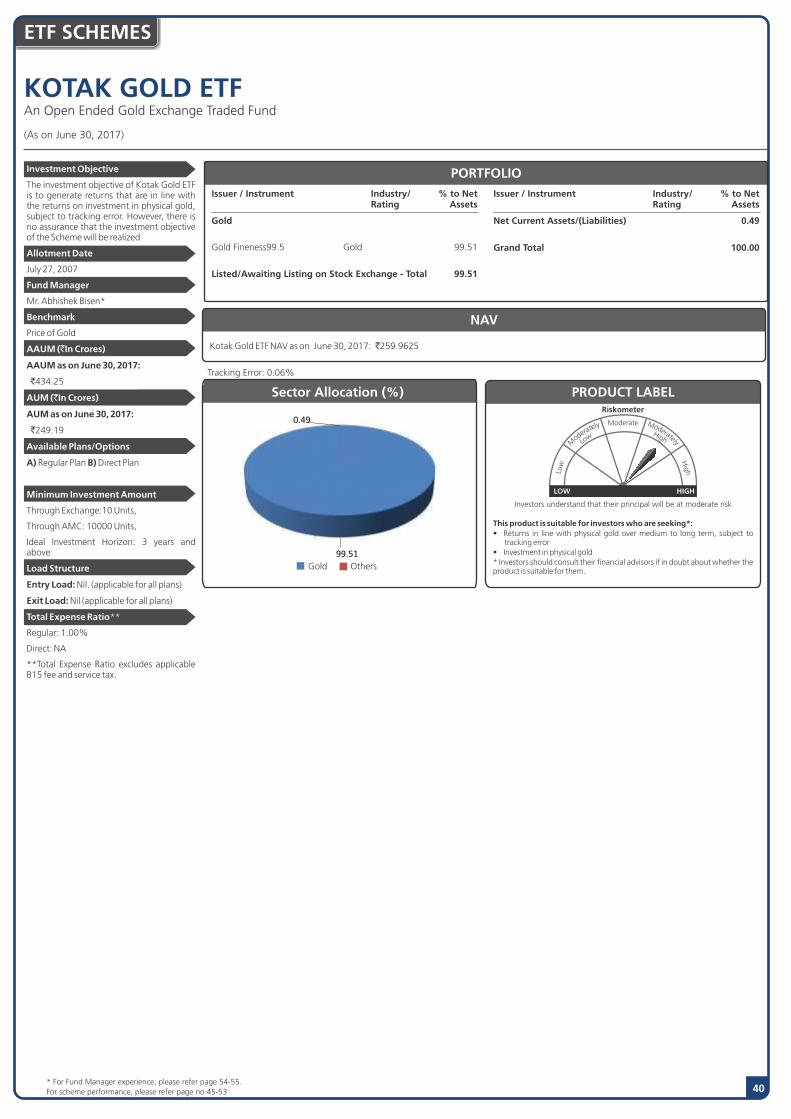
40
KOTAK GOLD ETFAn Open Ended Gold Exchange Traded Fund
ETF SCHEMES
For scheme performance, please refer page no 45-53 * For Fund Manager experience, please refer page 54-55.
Issuer / Instrument Industry/ % to Net Rating Assets
Gold
Gold Fineness99.5 Gold 99.51
Listed/Awaiting Listing on Stock Exchange - Total 99.51
Issuer / Instrument Industry/ % to Net Rating Assets
Net Current Assets/(Liabilities) 0.49
Grand Total 100.00
PORTFOLIO
NAV
Kotak Gold ETF NAV as on June 30, 2017: 259.9625
Investment Objective
The investment objective of Kotak Gold ETF is to generate returns that are in line with the returns on investment in physical gold, subject to tracking error. However, there is no assurance that the investment objective of the Scheme will be realized
Allotment Date
July 27, 2007
Fund Manager
Mr. Abhishek Bisen*
Benchmark
Price of Gold
AAUM (`In Crores)
AAUM as on June 30, 2017:
434.25
AUM (`In Crores)
AUM as on June 30, 2017:
249.19
Available Plans/Options
A) Regular Plan B) Direct Plan
Minimum Investment Amount
Through Exchange:10 Units,
Through AMC: 10000 Units,
Ideal Investment Horizon: 3 years and above
Load Structure
Entry Load: Nil. (applicable for all plans)
Exit Load: Nil (applicable for all plans)
Total Expense Ratio**
Regular: 1.00%
Direct: NA
**Total Expense Ratio excludes applicable B15 fee and service tax.
This product is suitable for investors who are seeking*:� Returns in line with physical gold over medium to long term, subject to
tracking error� Investment in physical gold* Investors should consult their financial advisors if in doubt about whether the product is suitable for them.
PRODUCT LABEL
Investors understand that their principal will be at moderate risk
Riskometer
yletaredo
M
Moderate
Low
High
Low
High
LOW HIGH
Moderately
Sector Allocation (%)
Gold Others
Tracking Error: 0.06%
(As on June 30, 2017)
99.51
0.49

41
KOTAK NIFTY ETFAn Open Ended Exchange Traded Fund[Eligible scheme under Rajiv Gandhi Equity Savings Scheme (RGESS)]
ETF SCHEMES
* For Fund Manager experience, please refer page 54-55. For scheme performance, please refer page no 45-53. For last three dividends, please refer page no 56-58
Issuer / Instrument Industry/ % to Net Rating Assets
Equity & Equity related (Listed/Awaiting listing on Stock Exchange)
HDFC Bank Ltd. Banks 9.28
ITC Ltd. Consumer Non Durables 7.63
HDFC Ltd. Finance 7.11
Reliance Industries Ltd. Petroleum Products 6.34
Infosys Ltd. Software 5.18
ICICI Bank Ltd. Banks 5.15
Larsen And Toubro Ltd. Construction Project 3.84
Tata Consultancy Services Ltd. Software 3.48
Kotak Mahindra Bank Ltd. Banks 3.22
State Bank Of India Banks 2.81
Maruti Suzuki India Limited Auto 2.66
Axis Bank Ltd Banks 2.44
Tata Motors Ltd. Auto 2.25
Hindustan Unilever Ltd. Consumer Non Durables 2.14
IndusInd Bank Ltd. Banks 2.06
Mahindra & Mahindra Ltd. Auto 1.74
Sun Pharmaceuticals
Industries Ltd. Pharmaceuticals 1.70
Yes Bank Ltd Banks 1.48
Bharti Airtel Ltd. Telecom - Services 1.39
Asian Paints Ltd. Consumer Non Durables 1.38
HCL Technologies Ltd. Software 1.35
Hero MotoCorp Ltd. Auto 1.33
Power Grid Corporation
Of India Ltd Power 1.28
Vedanta Ltd. Non - Ferrous Metals 1.28
Oil & Natural Gas
Corporation Ltd. Oil 1.23
Ultratech Cement Ltd. Cement 1.14
Indian Oil Corporation Ltd Petroleum Products 1.09
National Thermal Power
Issuer / Instrument Industry/ % to Net Rating Assets
Corporation Limited Power 1.09
Bajaj Auto Ltd. Auto 1.05
Tata Steel Limited. Ferrous Metals 1.01
Eicher Motors Ltd Auto 1.00
Indiabulls Housing Finance Ltd. Finance 0.96
Bharat Petroleum
Corporation Ltd. Petroleum Products 0.92
Wipro Ltd. Software 0.91
Dr Reddys Laboratories Ltd Pharmaceuticals 0.90
Coal India Ltd. Minerals/Mining 0.88
Adani Port and Special
Economic Zone Limited Transportation 0.81
Cipla Ltd. Pharmaceuticals 0.78
Hindalco Industries Ltd Non - Ferrous Metals 0.77
Zee Entertainment
Enterprises Ltd Media and Entertainment 0.75
Bharti Infratel Ltd. Telecom - Equipment & Accessories 0.73
Lupin Ltd. Pharmaceuticals 0.70
Tech Mahindra Ltd. Software 0.66
GAIL (India) Ltd. Gas 0.64
Bosch Limited Auto Ancillaries 0.59
Aurobindo Pharma Ltd. Pharmaceuticals 0.53
Ambuja Cements Ltd Cement 0.50
Bank Of Baroda Banks 0.42
Tata Power Co. Ltd. Power 0.40
ACC Ltd. Cement 0.37
Tata Motors Ltd - DVR Auto 0.37
Listed/Awaiting Listing on Stock Exchange - Total 99.72
Net Current Assets/(Liabilities) 0.28
Grand Total 100.00
PORTFOLIO
NAV
Kotak Nifty ETF NAV as on June 30, 2017: 958.6496
Investment Objective
The investment objective of the scheme is to provide returns before expenses that closely correspond to the total returns of the CNX Nifty subject to tracking errors. However, there is no assurance that the investment objective of the Scheme will be realized.
Allotment Date
February 2, 2010
Fund Manager
Mr. Deepak Gupta*
Benchmark
Nifty 50
AAUM (`In Crores)
AAUM as on June 30, 2017:
516.54
AUM (`In Crores)
AUM as on June 30, 2017:
526.20
Available Plans/Options
A) Regular Plan B) Direct Plan
Ratios
Portfolio Turnover:75.87%
Tracking Error: 0.08%
Minimum Investment Amount
Through Exchange:1 Unit,
Through AMC: 5000 Units,
Ideal Investment Horizon: 3 years and above
Load Structure
Entry Load: Nil. (applicable for all plans)
Exit Load: Nil (applicable for all plans)
Total Expense Ratio**
Regular:0.10%
Direct: NA
**Total Expense Ratio excludes applicable B15 fee and service tax.
This product is suitable for investors who are seeking*:� Long term capital growth� Investment in stocks comprising the underlying index and endeavours to
track the benchmark index* Investors should consult their financial advisors if in doubt about whether the product is suitable for them.
PRODUCT LABEL
Investors understand that their principal will be at moderate risk
Riskometer
yletaredo
M
Moderate
Low
High
Low
High
LOW HIGH
Moderately
Sector Allocation (%)
(As on June 30, 2017)
Banks Software Consumer Non DurablesAuto Petroleum Products
Finance
Pharmaceuticals Construction ProjectPower
Others
26.86
11.58
11.1510.40
8.35
8.07
4.61
3.84
2.77 2.0510.32
Non - Ferrous Metals

42
KOTAK SENSEX ETFAn Open Ended Exchange Traded Fund[Eligible scheme under Rajiv Gandhi Equity Savings Scheme (RGESS)]
ETF SCHEMES
* For Fund Manager experience, please refer page 54-55. For scheme performance, please refer page no 45-53. For last three dividends, please refer page no 56-58
Issuer / Instrument Industry/ % to Net Rating Assets
Issuer / Instrument Industry/ % to Net Rating Assets
PORTFOLIO
NAV
Kotak Sensex ETF NAV as on June 30, 2017: 311.5915
Investment Objective
The investment objective of the scheme is to provide returns before expenses that closely correspond to the total returns of the BSE SENSEX subject to tracking errors. However, there is no assurance that the investment objective of the Scheme will be realized.
Allotment Date
June 6, 2008
Fund Manager
Mr. Deepak Gupta*
Benchmark
S&P BSE SENSEX
AAUM (`In Crores)
AAUM as on June 30, 2017:
11.98
AUM (`In Crores)
AUM as on June 30, 2017: 11.90
Available Plans/Options
A) Regular Plan B) Direct Plan
Ratios
Portfolio Turnover: 20.06%
Tracking Error: 0.12%
Minimum Investment Amount
Through Exchange:1 Unit,
Through AMC: 10000 Units,
Ideal Investment Horizon: 3 years and above
Load Structure
Entry Load: Nil. (applicable for all plans)
Exit Load: Nil (applicable for all plans)
Total Expense Ratio**
Regular: 0.25%
Direct: NA
**Total Expense Ratio excludes applicable B15 fee and service tax.
PORTFOLIO
This product is suitable for investors who are seeking*:� Long term capital growth� Investment in stocks comprising the underlying index and endeavours to
track the benchmark index* Investors should consult their financial advisors if in doubt about whether the product is suitable for them.
PRODUCT LABEL
Investors understand that their principal will be at moderate risk
Riskometer
yletaredo
M
Moderate
Low
High
Low
High
LOW HIGH
Moderately
Sector Allocation (%)
22.68
16.44
10.5510.12
10.06
8.1
6.115.68
5.65
22.67
17.4
10.510.29
9.87
8.28
6.155.2
5.4 22.46
16.58
10.7410.4
9.83
8.41
6.644.9
5.79
Equity & Equity related (Listed/Awaiting listing on Stock Exchange)
HDFC Bank Ltd. Banks 11.37
ITC Ltd. Consumer Non Durables 9.34
HDFC Ltd. Finance 8.71
Reliance Industries Ltd. Petroleum Products 7.76
Infosys Ltd. Software 6.34
ICICI Bank Ltd. Banks 6.31
Larsen And Toubro Ltd. Construction Project 4.59
Tata Consultancy Services Ltd. Software 4.27
Kotak Mahindra Bank Ltd. Banks 3.52
Maruti Suzuki India Limited Auto 3.26
State Bank Of India Banks 3.20
Axis Bank Ltd Banks 2.94
Tata Motors Ltd. Auto 2.84
Hindustan Unilever Ltd. Consumer Non Durables 2.62
Mahindra & Mahindra Ltd. Auto 2.13
Sun Pharmaceuticals
Industries Ltd. Pharmaceuticals 2.03
Bharti Airtel Ltd. Telecom - Services 1.70
Asian Paints Ltd. Consumer Non Durables 1.69
Hero MotoCorp Ltd. Auto 1.60
Power Grid Corporation
Of India Ltd Power 1.57
Oil & Natural Gas
Corporation Ltd. Oil 1.44
National Thermal Power
Corporation Limited Power 1.33
Bajaj Auto Ltd. Auto 1.29
Tata Steel Limited. Ferrous Metals 1.24
Dr Reddys Laboratories Ltd Pharmaceuticals 1.12
Wipro Ltd. Software 1.11
Adani Port and Special Economic
Zone Limited Transportation 1.09
Coal India Ltd. Minerals/Mining 1.03
Cipla Ltd. Pharmaceuticals 0.95
Lupin Ltd. Pharmaceuticals 0.86
Tata Motors Ltd - DVR Auto 0.45
Listed/Awaiting Listing on Stock Exchange - Total 99.70
Net Current Assets/(Liabilities) 0.30
Grand Total 100.00
(As on June 30, 2017)
Banks Consumer Non Durables SoftwareAuto Finance
Petroleum ProductsConstruction ProjectPharmaceuticals
Power
Telecom - Services Others
27.34
13.65
11.72
11.57
8.71
7.76
4.96
4.59 2.90 1.70 5.10

43
KOTAK BANKING ETFAn Open Ended Exchange Traded Fund
ETF SCHEMES
* For Fund Manager experience, please refer page 54-55. For scheme performance, please refer page no 45-53. For last three dividends, please refer page no 56-58
Issuer / Instrument Industry/ % to Net Rating Assets
Equity & Equity related (Listed/Awaiting listing on Stock Exchange)
HDFC Bank Ltd. Banks 32.85
ICICI Bank Ltd. Banks 18.25
Kotak Mahindra Bank Ltd. Banks 11.40
State Bank Of India Banks 9.97
Axis Bank Ltd Banks 8.64
IndusInd Bank Ltd. Banks 7.29
Yes Bank Ltd Banks 5.25
Federal Bank Ltd. Banks 1.91
Bank Of Baroda Banks 1.50
Issuer / Instrument Industry/ % to Net Rating Assets
Punjab National Bank Banks 1.00
IDFC Bank Limited Banks 0.71
Canara Bank Banks 0.65
Listed/Awaiting Listing on Stock Exchange - Total 99.42
Futures
CNX BANK INDEX-JUL2017 0.50
Futures (Market value represents Notional Value) - Total 0.50
Net Current Assets/(Liabilities) 0.08
Grand Total 100.00
PORTFOLIO
NAV
Kotak Banking ETF NAV as on June 30, 2017: 236.7164
Investment Objective
The investment objective of the scheme is to provide returns before expenses that closely correspond to the total returns of stocks as represented by the CNX Bank Index subject to tracking errors. There can be no assurance or guarantee that the investment objective of the scheme will be achieved.
Allotment Date
December 04, 2014
Fund Manager
Mr. Deepak Gupta*
Benchmark
Nifty Bank
AAUM (`In Crores)
AAUM as on June 30, 2017:
3571.29
AUM (`In Crores)
AUM as on June 30, 2017:
3537.89
Available Plans/Options
Option - Dividend Payout
Ratios
Portfolio Turnover: 39.28%
Tracking Error: 0.08%
Minimum Investment Amount
Through Exchange:1 Unit,
Through AMC: 15000 Units,
Ideal Investment Horizon: 3 years and above
Load Structure
Entry Load: Nil. (applicable for all plans)
Exit Load: Nil (applicable for all plans)
Total Expense Ratio**
Regular:0.20%
Direct: NA
**Total Expense Ratio excludes applicable B15 fee and service tax.
This product is suitable for investors who are seeking*:� Long term capital growth� Investment in stocks comprising the underlying index and endeavours to
track the benchmark index* Investors should consult their financial advisors if in doubt about whether the product is suitable for them.
PRODUCT LABEL
Investors understand that their principal will be at moderate risk
Riskometer
yletaredoM
ModerateLo
w
High
Low
High
LOW HIGH
Moderately
Sector Allocation (%)
(As on June 30, 2017)
99.42
0.500.08
Banks Derivatives Others
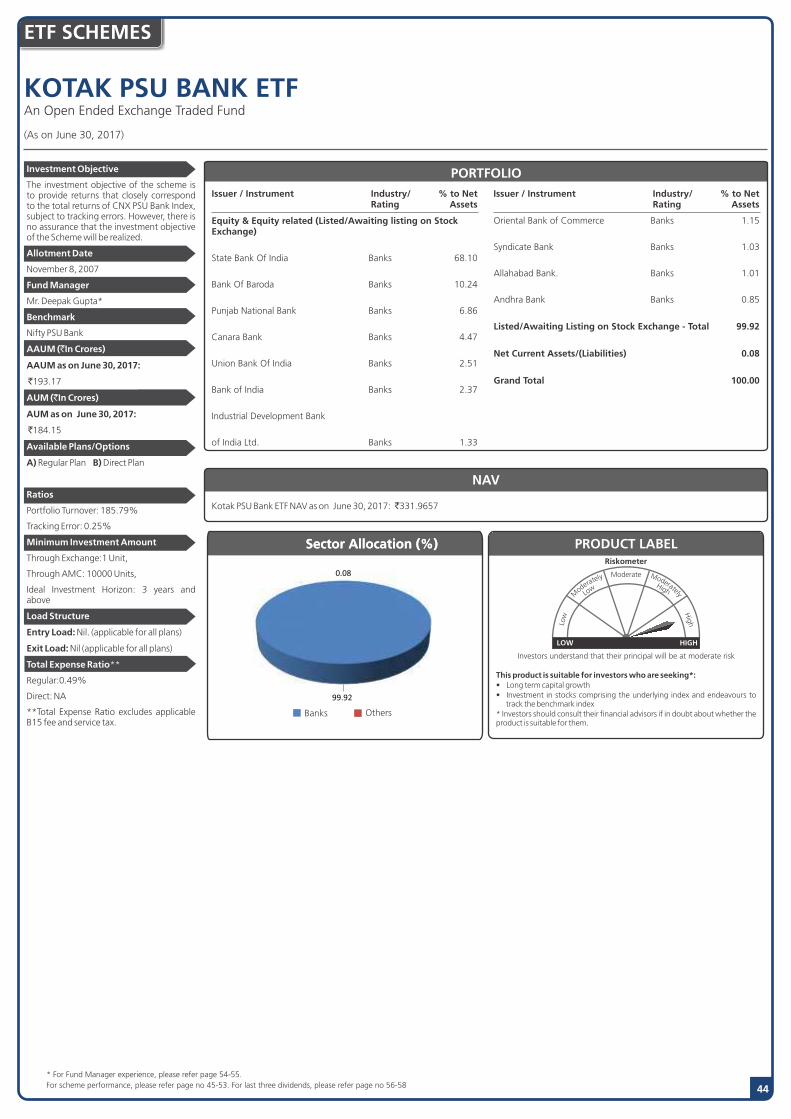
44
KOTAK PSU BANK ETFAn Open Ended Exchange Traded Fund
ETF SCHEMES
* For Fund Manager experience, please refer page 54-55. For scheme performance, please refer page no 45-53. For last three dividends, please refer page no 56-58
Issuer / Instrument Industry/ % to Net Rating Assets
Equity & Equity related (Listed/Awaiting listing on Stock Exchange)
State Bank Of India Banks 68.10
Bank Of Baroda Banks 10.24
Punjab National Bank Banks 6.86
Canara Bank Banks 4.47
Union Bank Of India Banks 2.51
Bank of India Banks 2.37
Industrial Development Bank
of India Ltd. Banks 1.33
Issuer / Instrument Industry/ % to Net Rating Assets
Oriental Bank of Commerce Banks 1.15
Syndicate Bank Banks 1.03
Allahabad Bank. Banks 1.01
Andhra Bank Banks 0.85
Listed/Awaiting Listing on Stock Exchange - Total 99.92
Net Current Assets/(Liabilities) 0.08
Grand Total 100.00
PORTFOLIO
NAV
Kotak PSU Bank ETF NAV as on June 30, 2017: 331.9657
Investment Objective
The investment objective of the scheme is to provide returns that closely correspond to the total returns of CNX PSU Bank Index, subject to tracking errors. However, there is no assurance that the investment objective of the Scheme will be realized.
Allotment Date
November 8, 2007
Fund Manager
Mr. Deepak Gupta*
Benchmark
Nifty PSU Bank
AAUM (`In Crores)
AAUM as on June 30, 2017:
193.17
AUM (`In Crores)
AUM as on June 30, 2017:
184.15
Available Plans/Options
A) Regular Plan B) Direct Plan
Ratios
Portfolio Turnover: 185.79%
Tracking Error: 0.25%
Minimum Investment Amount
Through Exchange:1 Unit,
Through AMC: 10000 Units,
Ideal Investment Horizon: 3 years and above
Load Structure
Entry Load: Nil. (applicable for all plans)
Exit Load: Nil (applicable for all plans)Total
Total Expense Ratio**
Regular:0.49%
Direct: NA
**Total Expense Ratio excludes applicable B15 fee and service tax.
Sector Allocation (%)
This product is suitable for investors who are seeking*:� Long term capital growth� Investment in stocks comprising the underlying index and endeavours to
track the benchmark index* Investors should consult their financial advisors if in doubt about whether the product is suitable for them.
PRODUCT LABEL
Investors understand that their principal will be at moderate risk
Riskometer
yletaredo
MModerate
Low
High
Low
High
LOW HIGH
Moderately
Sector Allocation (%)
100.00
(As on June 30, 2017)
Banks Others
99.96
99.92
0.08

Scheme Performances as on June 30, 2017
45
Kotak 50 - Dividend
Scheme Inception date is 29/12/1998. Mr. Harish Krishnan has been managing the fund since 01/01/2014Different plans have different expense structure. The performance details provided herein are of regular plan ^Past performance may or may not be sustained in future.*All payouts during the period have been reinvested in the units of the scheme at the then prevailing NAV. Returns >= 1 year: CAGR (Compounded Annualised Growth Rate). N.A stands for data not available. Note: Point to Point (PTP) Returns in INR shows the value of 10,000/- investment made at inception. Source: ICRA MFI Explorer. # Name of Scheme Benchmark. ## Name of Additional Benchmark.
SchemeReturns ^ (%) Nifty 50 # (%)
S&P BSE Sensex ## (%) Current Value of Standard Investment of ` 10000 in the
Scheme (`) Benchmark #(`)Additional
Benchmark # # (`)
Since Inception(Dec 29, 1998) 19.67 13.78 13.33 2,77,834 1,09,103 1,01,506
Last 1 Year 15.32 14.88 14.53
Last 3 Years 13.10 7.74 6.75 N.A.
Last 5 Years 16.21 12.50 12.13
Kotak Classic Equity Fund - Growth
Scheme Inception date is 27/07/2005. Mr. Deepak Gupta has been managing the fund since 01/01/2017.
Different plans have different expense structure. The performance details provided herein are of regular plan
^Past performance may or may not be sustained in future.*All payouts during the period have been reinvested in the units of the scheme at the then prevailing NAV. Returns >= 1 year: CAGR (Compounded Annualised Growth Rate). N.A stands for data not available. Note: Point to Point (PTP) Returns in INR shows the value of 10,000/- investment made at inception. Source: ICRA MFI Explorer. # Name of Scheme Benchmark. ## Name of Additional Benchmark.
SchemeReturns ^ (%)
Nifty 100# (%)
Nifty 50## (%) Current Value of Standard Investment of ` 10000 in the
Scheme (`) Benchmark #(`)Additional
Benchmark # # (`)
Since Inception(Jul 27, 2005) 12.77 12.93 12.56 41,970 42,692 41,054
Last 1 Year 18.29 16.86 14.88
Last 3 Years 10.30 9.11 7.74 N.A.
Last 5 Years 15.20 13.76 12.50
Kotak Opportunities - Growth
SchemeReturns ^ (%) Nifty 500 # (%) Nifty 50 ## (%) Current Value of Standard Investment of ` 10000 in the
Scheme (`) Benchmark #(`)Additional
Benchmark # # (`)
Since Inception(Sep 09, 2004) 20.30 14.95 14.66 1,06,779 59,582 57,737
Last 1 Year 25.54 19.35 14.88
Last 3 Years 17.76 10.50 7.74 N.A.
Last 5 Years 19.69 14.83 12.50
Scheme Inception date is 09/09/2004. Mr. Harsha Upadhyaya has been managing the fund since 04/08/2012.
Different plans have different expense structure. The performance details provided herein are of regular plan
^Past performance may or may not be sustained in future.*All payouts during the period have been reinvested in the units of the scheme at the then prevailing NAV. Returns >= 1 year: CAGR (Compounded Annualised Growth Rate). N.A stands for data not available. Note: Point to Point (PTP) Returns in INR shows the value of 10,000/- investment made at inception. Source: ICRA MFI Explorer. # Name of Scheme Benchmark. ## Name of Additional Benchmark.
Kotak Select Focus Fund - Growth
Scheme Inception date is 11/09/2009. Mr. Harsha Upadhyaya has been managing the fund since 04/08/2012.
Different plans have different expense structure. The performance details provided herein are of regular plan
^Past performance may or may not be sustained in future.*All payouts during the period have been reinvested in the units of the scheme at the then prevailing NAV. Returns >= 1 year: CAGR (Compounded Annualised Growth Rate). N.A stands for data not available. Note: Point to Point (PTP) Returns in INR shows the value of 10,000/- investment made at inception. Source: ICRA MFI Explorer. # Name of Scheme Benchmark. ## Name of Additional Benchmark.
SchemeReturns ^ (%)
Nifty 200 # (%) Nifty 50## (%) Current Value of Standard Investment of ` 10000 in the
Scheme (`) Benchmark #(`)Additional
Benchmark # # (`)
Since Inception(Sep 11, 2009) 15.24 9.69 9.08 30,248 20,585 19,714
Last 1 Year 24.06 18.12 14.88
Last 3 Years 18.67 9.64 7.74
Last 5 Years 21.64 14.10 12.50
N.A.

46
Kotak Emerging Equity - Growth
Scheme Inception date is 30/03/2007. Mr. Pankaj Tibrewal has been managing the fund since 27/05/2010.
Different plans have different expense structure. The performance details provided herein are of regular plan
^Past performance may or may not be sustained in future.*All payouts during the period have been reinvested in the units of the scheme at the then prevailing NAV. Returns >= 1 year: CAGR (Compounded Annualised Growth Rate). N.A stands for data not available. Note: Point to Point (PTP) Returns in INR shows the value of 10,000/- investment made at inception. Source: ICRA MFI Explorer. # Name of Scheme Benchmark. ## Name of Additional Benchmark.
SchemeReturns^ (%)
S&P BSE MidSmallCap# (%)
Nifty 50## (%) Current Value of Standard Investment of ` 10000 in the
Scheme (`) Benchmark #(`)Additional
Benchmark # # (`)
Since Inception(Mar 30, 2007) 13.37 11.95 9.30 36,246 31,846 24,914
Last 1 Year 25.56 28.23 14.88
Last 3 Years 25.27 17.25 7.74 N.A.
Last 5 Years 26.70 19.58 12.50
Kotak Tax Saver Scheme - Growth
Scheme Inception date is 23/11/2005. Mr. Harsha Upadhyaya has been managing the fund since 25/08/2015.
Different plans have different expense structure. The performance details provided herein are of regular plan
^Past performance may or may not be sustained in future.*All payouts during the period have been reinvested in the units of the scheme at the then prevailing NAV. Returns >= 1 year: CAGR (Compounded Annualised Growth Rate). N.A stands for data not available. Note: Point to Point (PTP) Returns in INR shows the value of 10,000/- investment made at inception. Source: ICRA MFI Explorer. # Name of Scheme Benchmark. ## Name of Additional Benchmark.
SchemeReturns^ (%)
Nifty 500# (%)
Nifty 50## (%) Current Value of Standard Investment of ` 10000 in the
Scheme (`) Benchmark #(`)Additional
Benchmark # # (`)
Since Inception(Nov 23, 2005) 12.37 11.91 11.80 38,731 36,939 36,498
Last 1 Year 23.92 19.35 14.88
Last 3 Years 17.42 10.50 7.74 N.A.
Last 5 Years 17.26 14.83 12.50
Kotak Midcap - Growth
Scheme Inception date is 24/02/2005. Mr. Pankaj Tibrewal has been managing the fund since 21/01/2010.
Different plans have different expense structure. The performance details provided herein are of regular plan
^Past performance may or may not be sustained in future.*All payouts during the period have been reinvested in the units of the scheme at the then prevailing NAV. Returns >= 1 year: CAGR (Compounded Annualised Growth Rate). N.A stands for data not available. Note: Point to Point (PTP) Returns in INR shows the value of 10,000/- investment made at inception. Source: ICRA MFI Explorer. # Name of Scheme Benchmark. ## Name of Additional Benchmark.
SchemeReturns ^ (%)
Nifty Midcap 100 # (%) Nifty 50 ## (%) Current Value of Standard Investment of ` 10000 in the
Scheme (`) Benchmark #(`)Additional
Benchmark # # (`)
Since Inception(Feb 24, 2005) 17.37 15.56 13.21 72,330 59,704 46,324
Last 1 Year 26.80 28.32 14.88 N.A.
Last 3 Years 22.42 16.89 7.74
Last 5 Years 24.05 19.23 12.50
Kotak Infrastructure and Economic Reform Fund - Growth
Scheme Inception date is 25/02/2008. Mr. Harish Krishnan has been managing the fund since 01/02/2015.
Different plans have different expense structure. The performance details provided herein are of regular plan
^Past performance may or may not be sustained in future.*All payouts during the period have been reinvested in the units of the scheme at the then prevailing NAV. Returns >= 1 year: CAGR (Compounded Annualised Growth Rate). N.A stands for data not available. Note: Point to Point (PTP) Returns in INR shows the value of 10,000/- investment made at inception. Source: ICRA MFI Explorer. # Name of Scheme Benchmark. ## Name of Additional Benchmark.
SchemeReturns^ (%)
S&P BSE 100 # (%) Nifty 50 ## (%) Current Value of Standard Investment of ` 10000 in the
Scheme (`) Benchmark #(`)Additional
Benchmark # # (`)
Since Inception(Feb 25, 2008) 7.65 6.56 6.68 19,924 18,119 18,307
Last 1 Year 21.66 16.88 14.88
Last 3 Years 16.47 8.36 7.74 N.A.
Last 5 Years 19.56 13.28 12.50

47
Scheme Inception date is 25/11/1999. Mr. Abhishek Bisen has been managing the fund since 15/04/2008. Mr. Pankaj Tibrewal has been managing the fund since 25/08/2015.
Different plans have different expense structure. The performance details provided herein are of regular plan
^Past performance may or may not be sustained in future.*All payouts during the period have been reinvested in the units of the scheme at the then prevailing NAV. Returns >= 1 year: CAGR (Compounded Annualised Growth Rate). N.A stands for data not available. Note: Point to Point (PTP) Returns in INR shows the value of 10,000/- investment made at inception. Source: ICRA MFI Explorer. # Name of Scheme Benchmark. ## Name of Additional Benchmark.
Kotak Balance
SchemeReturns ^ (%)
CRISIL Balanced Fund #(%) Nifty 50 ## (%) Current Value of Standard Investment of ` 10000 in the
Scheme (`) Benchmark #(`)Additional
Benchmark # # (`)
Since Inception(Nov 25, 1999) 15.12 N.A. 11.46 1,19,307 N.A. 67,589
Last 1 Year 18.04 13.85 14.88
Last 3 Years 11.87 9.08 7.74 N.A.
Last 5 Years 14.07 11.73 12.50
Kotak Equity Arbitrage Fund - Growth
Scheme Inception date is 29/09/2005. Mr. Deepak Gupta has been managing the fund since 01/09/2008.
Different plans have different expense structure. The performance details provided herein are of regular plan
^Past performance may or may not be sustained in future.*All payouts during the period have been reinvested in the units of the scheme at the then prevailing NAV. Returns >= 1 year: CAGR (Compounded Annualised Growth Rate). N.A stands for data not available. Note: Point to Point (PTP) Returns in INR shows the value of 10,000/- investment made at inception. Source: ICRA MFI Explorer. # Name of Scheme Benchmark. ## Name of Additional Benchmark.
SchemeReturns ^ (%)
Nifty 50 Arbitrage Index # (%)
Nifty 50## (%) Current Value of Standard Investment of ` 10000 in the
Scheme (`) Benchmark #(`)Additional
Benchmark # # (`)
Since Inception(Sep 29, 2005) 7.64 N.A. 11.63 23,769 N.A. 36,462
Last 1 Year 6.31 5.43 14.88
Last 3 Years 7.03 6.74 7.74 N.A.
Last 5 Years 7.89 7.46 12.50
Kotak Equity Savings Fund - Growth
SchemeReturns ^ (%)
75% NIFTY 50 ARBITRAGE
+ 25% Nifty 50 # (%)
Nifty 50 # # (%) Current Value of Standard Investment of ` 10000 in the
Scheme (`) Benchmark #(`)Additional
Benchmark ## (`)
Since Inception(Oct 13, 2014) 8.62 6.99 7.19 12,516 12,015 12,076
Last 1 Year 10.50 7.84 14.88 N.A.
Scheme Inception date is 13/10/2014. Mr. Deepak Gupta has been managing the fund since 13/10/2014. Mr. Abhishek Bisen has been managing the fund since 13/10/2014.
Different plans have different expense structure. The performance details provided herein are of regular plan
^Past performance may or may not be sustained in future.*All payouts during the period have been reinvested in the units of the scheme at the then prevailing NAV. Returns >= 1 year: CAGR (Compounded Annualised Growth Rate). N.A stands for data not available. Note: Point to Point (PTP) Returns in INR shows the value of 10,000/- investment made at inception. Source: ICRA MFI Explorer. # Name of Scheme Benchmark. ## Name of Additional Benchmark.
The scheme has been existence since Oct 13, 2014 i.e. more than 1year but less than 3 years/5years. Hence, the performance of less than 1 year and since inception has been disclosed herewith.
OTHER PERFORMANCE
Kotak India Growth Fund - Series I - Regular Plan - Growth
SchemeReturns ^ (%)
Nifty 200 # (%) Nifty 50 ## (%) Current Value of Standard Investment of ` 10000 in the
Scheme (`) Benchmark #(`)Additional
Benchmark ## (`)
Since Inception(May 06, 2015) 10.74 9.73 7.81 12,457 12,215 11,759
Last 1 Year 15.90 18.12 14.88 N.A.
Scheme Inception date is 06/05/2015. Mr. Harish Krishnan has been managing the fund since 06/05/2015
Different plans have different expense structure. The performance details provided herein are of regular plan
^Past performance may or may not be sustained in future.*All payouts during the period have been reinvested in the units of the scheme at the then prevailing NAV. Returns >= 1 year: CAGR (Compounded Annualised Growth Rate). N.A stands for data not available. Note: Point to Point (PTP) Returns in INR shows the value of 10,000/- investment made at inception. Source: ICRA MFI Explorer. # Name of Scheme Benchmark. ## Name of Additional Benchmark.
The scheme has been existence since May 06, 2015 i.e. more than 1year but less than 3 years/5years. Hence, the performance of less than 1 year and since inception has been disclosed herewith.

48
Kotak Liquid - Regular Plan - Growth
Scheme Inception date is 04/11/2003. Mr. Deepak Agrawal has been managing the fund since 01/05/2007.
Different plans have different expense structure. The performance details provided herein are of regular plan
^Past performance may or may not be sustained in future.*All payouts during the period have been reinvested in the units of the scheme at the then prevailing NAV. Returns >= 1 year: CAGR (Compounded Annualised Growth Rate). N.A stands for data not available. Note: Point to Point (PTP) Returns in INR shows the value of 10,000/- investment made at inception. Source: ICRA MFI Explorer. # Name of Scheme Benchmark. ## Name of Additional Benchmark.
SchemeReturns^ (%)
CRISIL Liquid Fund # (%)
CRISIL 1 Year TBill## (%) Current Value of Standard Investment of ` 10000 in the
Scheme (`) Benchmark #(`)Additional
Benchmark # # (`)
Since Inception(Nov 04, 2003) 7.48 6.96 5.95 26,797 25,063 22,021
Last 1 Year 6.88 6.86 6.53
Last 3 Years 7.91 7.83 7.57 N.A.
Last 5 Years 8.43 8.25 7.36
Kotak Floater - Short Term - Growth
Scheme Inception date is 14/07/2003. Mr. Deepak Agrawal has been managing the fund since 01/11/2006.
Different plans have different expense structure. The performance details provided herein are of regular plan
^Past performance may or may not be sustained in future.*All payouts during the period have been reinvested in the units of the scheme at the then prevailing NAV. Returns >= 1 year: CAGR (Compounded Annualised Growth Rate). N.A stands for data not available. Note: Point to Point (PTP) Returns in INR shows the value of 10,000/- investment made at inception. Source: ICRA MFI Explorer. # Name of Scheme Benchmark. ## Name of Additional Benchmark.
SchemeReturns^ (%)
Crisil Liquid Fund# (%)
CRISIL 1 Year T-Bill## (%) Current Value of Standard Investment of ` 10000 in the
Scheme (`) Benchmark #(`)Additional
Benchmark # # (`)
Since Inception(Jul 14, 2003) 7.39 6.89 5.93 27,071 25,382 22,375
Last 1 Year 6.94 6.86 6.53
Last 3 Years 7.98 7.83 7.57 N.A.
Last 5 Years 8.50 8.25 7.36
Kotak Treasury Advantage Fund - Growth
Scheme Inception date is 13/08/2004. Mr. Deepak Agrawal has been managing the fund since 01/04/2008.
Different plans have different expense structure. The performance details provided herein are of regular plan
^Past performance may or may not be sustained in future.*All payouts during the period have been reinvested in the units of the scheme at the then prevailing NAV. Returns >= 1 year: CAGR (Compounded Annualised Growth Rate). N.A stands for data not available. Note: Point to Point (PTP) Returns in INR shows the value of 10,000/- investment made at inception. Source: ICRA MFI Explorer. # Name of Scheme Benchmark. ## Name of Additional Benchmark.
SchemeReturns ^ (%)
CRISIL Liquid Fund# (%)
CRISIL 1 Year TBill## (%) Current Value of Standard Investment of ` 10000 in the
Scheme (`) Benchmark #(`)Additional
Benchmark # # (`)
Since Inception(Aug 13, 2004) 7.86 7.14 6.06 26,506 24,316 21,352
Last 1 Year 7.68 6.86 6.53
Last 3 Years 8.33 7.83 7.57 N.A.
Last 5 Years 8.69 8.25 7.36
Kotak Banking and PSU Debt Fund - Growth
Scheme Inception date is 29/12/1998. Mr. Deepak Agrawal has been managing the fund since 01/08/2008.
Different plans have different expense structure. The performance details provided herein are of regular plan
^Past performance may or may not be sustained in future.*All payouts during the period have been reinvested in the units of the scheme at the then prevailing NAV. Returns >= 1 year: CAGR (Compounded Annualised Growth Rate). N.A stands for data not available. Note: Point to Point (PTP) Returns in INR shows the value of 10,000/- investment made at inception. Source: ICRA MFI Explorer. # Name of Scheme Benchmark. ## Name of Additional Benchmark.
SchemeReturns^ (%)
CRISIL Short Term Bond Fund #(%)
CRISIL 1 Year Tbill##(%)
Current Value of Standard Investment of ` 10000 in the
Scheme (`) Benchmark #(`)Additional
Benchmark # # (`)
Since Inception(Dec 29, 1998) 7.42 N.A. 6.65 37,646 N.A. 32,931
Last 1 Year 9.48 8.88 6.53
Last 3 Years 8.88 9.12 7.57 N.A.
Last 5 Years 8.95 9.09 7.36
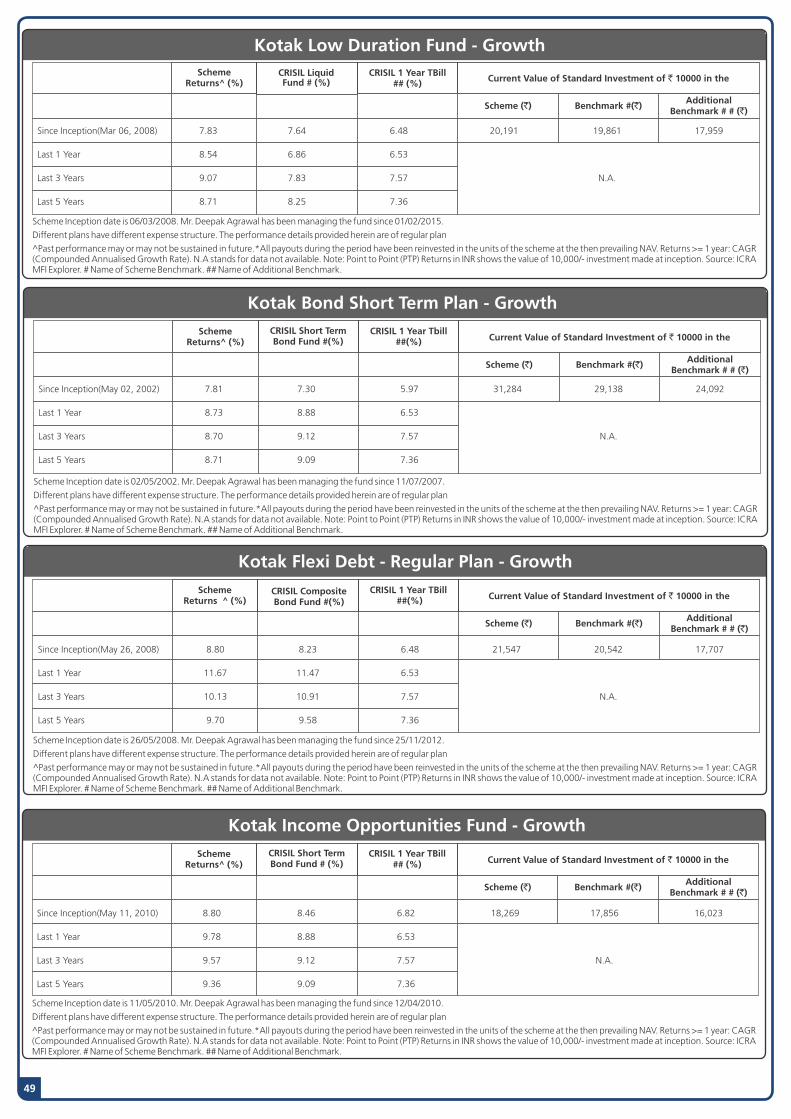
Kotak Low Duration Fund - Growth
Scheme Inception date is 06/03/2008. Mr. Deepak Agrawal has been managing the fund since 01/02/2015.
Different plans have different expense structure. The performance details provided herein are of regular plan
^Past performance may or may not be sustained in future.*All payouts during the period have been reinvested in the units of the scheme at the then prevailing NAV. Returns >= 1 year: CAGR (Compounded Annualised Growth Rate). N.A stands for data not available. Note: Point to Point (PTP) Returns in INR shows the value of 10,000/- investment made at inception. Source: ICRA MFI Explorer. # Name of Scheme Benchmark. ## Name of Additional Benchmark.
SchemeReturns^ (%)
CRISIL Liquid Fund # (%)
CRISIL 1 Year TBill## (%) Current Value of Standard Investment of ` 10000 in the
Scheme (`) Benchmark #(`)Additional
Benchmark # # (`)
Since Inception(Mar 06, 2008) 7.83 7.64 6.48 20,191 19,861 17,959
Last 1 Year 8.54 6.86 6.53
Last 3 Years 9.07 7.83 7.57 N.A.
Last 5 Years 8.71 8.25 7.36
49
Kotak Bond Short Term Plan - Growth
Scheme Inception date is 02/05/2002. Mr. Deepak Agrawal has been managing the fund since 11/07/2007.
Different plans have different expense structure. The performance details provided herein are of regular plan
^Past performance may or may not be sustained in future.*All payouts during the period have been reinvested in the units of the scheme at the then prevailing NAV. Returns >= 1 year: CAGR (Compounded Annualised Growth Rate). N.A stands for data not available. Note: Point to Point (PTP) Returns in INR shows the value of 10,000/- investment made at inception. Source: ICRA MFI Explorer. # Name of Scheme Benchmark. ## Name of Additional Benchmark.
SchemeReturns^ (%)
CRISIL Short Term Bond Fund #(%)
CRISIL 1 Year Tbill##(%) Current Value of Standard Investment of ` 10000 in the
Scheme (`) Benchmark #(`)Additional
Benchmark # # (`)
Since Inception(May 02, 2002) 7.81 7.30 5.97 31,284 29,138 24,092
Last 1 Year 8.73 8.88 6.53
Last 3 Years 8.70 9.12 7.57 N.A.
Last 5 Years 8.71 9.09 7.36
Kotak Flexi Debt - Regular Plan - Growth
Scheme Inception date is 26/05/2008. Mr. Deepak Agrawal has been managing the fund since 25/11/2012.
Different plans have different expense structure. The performance details provided herein are of regular plan
^Past performance may or may not be sustained in future.*All payouts during the period have been reinvested in the units of the scheme at the then prevailing NAV. Returns >= 1 year: CAGR (Compounded Annualised Growth Rate). N.A stands for data not available. Note: Point to Point (PTP) Returns in INR shows the value of 10,000/- investment made at inception. Source: ICRA MFI Explorer. # Name of Scheme Benchmark. ## Name of Additional Benchmark.
SchemeReturns ^ (%)
CRISIL Composite Bond Fund #(%)
CRISIL 1 Year TBill ##(%) Current Value of Standard Investment of ` 10000 in the
Scheme (`) Benchmark #(`)Additional
Benchmark # # (`)
Since Inception(May 26, 2008) 8.80 8.23 6.48 21,547 20,542 17,707
Last 1 Year 11.67 11.47 6.53
Last 3 Years 10.13 10.91 7.57 N.A.
Last 5 Years 9.70 9.58 7.36
Kotak Income Opportunities Fund - Growth
SchemeReturns^ (%)
CRISIL Short Term Bond Fund # (%)
CRISIL 1 Year TBill## (%) Current Value of Standard Investment of ` 10000 in the
Scheme (`) Benchmark #(`)Additional
Benchmark # # (`)
Since Inception(May 11, 2010) 8.80 8.46 6.82 18,269 17,856 16,023
Last 1 Year 9.78 8.88 6.53
Last 3 Years 9.57 9.12 7.57 N.A.
Last 5 Years 9.36 9.09 7.36
Scheme Inception date is 11/05/2010. Mr. Deepak Agrawal has been managing the fund since 12/04/2010.
Different plans have different expense structure. The performance details provided herein are of regular plan
^Past performance may or may not be sustained in future.*All payouts during the period have been reinvested in the units of the scheme at the then prevailing NAV. Returns >= 1 year: CAGR (Compounded Annualised Growth Rate). N.A stands for data not available. Note: Point to Point (PTP) Returns in INR shows the value of 10,000/- investment made at inception. Source: ICRA MFI Explorer. # Name of Scheme Benchmark. ## Name of Additional Benchmark.

50
Kotak Corporate Bond Fund - Growth
Scheme Inception date is 21/09/2007. Mr. Deepak Agrawal has been managing the fund since 01/02/2015.
Different plans have different expense structure. The performance details provided herein are of regular plan
^Past performance may or may not be sustained in future.*All payouts during the period have been reinvested in the units of the scheme at the then prevailing NAV. Returns >= 1 year: CAGR (Compounded Annualised Growth Rate). N.A stands for data not available. Note: Point to Point (PTP) Returns in INR shows the value of 10,000/- investment made at inception. Source: ICRA MFI Explorer. # Name of Scheme Benchmark. ## Name of Additional Benchmark.
SchemeReturns^ (%)
CRISIL Composite Bond Fund #(%)
CRISIL 1 Year Tbill##(%)
Current Value of Standard Investment of ` 10000 in the
Scheme (`) Benchmark #(`)Additional
Benchmark # # (`)
Since Inception(Sep 21, 2007) 8.28 8.12 6.43 21,773 21,456 18,402
Last 1 Year 9.05 11.47 6.53
Last 3 Years 10.07 10.91 7.57 N.A.
Last 5 Years 8.76 9.58 7.36
Kotak Medium Term Fund - Regular Plan - Growth
Scheme Inception date is 21/03/2014. Mr. Deepak Agrawal has been managing the fund since 22/06/2015.
Different plans have different expense structure. The performance details provided herein are of regular plan
^Past performance may or may not be sustained in future.*All payouts during the period have been reinvested in the units of the scheme at the then prevailing NAV. Returns >= 1 year: CAGR (Compounded Annualised Growth Rate). N.A stands for data not available. Note: Point to Point (PTP) Returns in INR shows the value of 10,000/- investment made at inception. Source: ICRA MFI Explorer. # Name of Scheme Benchmark. ## Name of Additional Benchmark.
SchemeReturns ^(%)
CRISIL Composite Bond Fund # (%)
CRISIL 10 Year Gilt## (%) Current Value of Standard Investment of ` 10000 in the
Scheme (`) Benchmark #(`)Additional
Benchmark # # (`)
Since Inception(Mar 21, 2014) 10.34 11.34 11.06 13,807 14,221 14,105
Last 1 Year 10.30 11.47 11.69
Last 3 Years 10.01 10.91 11.15 N.A.
Last 5 Years N.A. 9.58 8.46
Scheme Inception date is 25/11/1999. Mr. Abhishek Bisen has been managing the fund since 01/04/2008.
Different plans have different expense structure. The performance details provided herein are of regular plan
^Past performance may or may not be sustained in future.*All payouts during the period have been reinvested in the units of the scheme at the then prevailing NAV. Returns >= 1 year: CAGR (Compounded Annualised Growth Rate). N.A stands for data not available. Note: Point to Point (PTP) Returns in INR shows the value of 10,000/- investment made at inception. Source: ICRA MFI Explorer. # Name of Scheme Benchmark. ## Name of Additional Benchmark.
SchemeReturns ^ (%)
CRISIL Composite Bond Fund #(%)
CRISIL 10 Year Gilt##(%) Current Value of Standard Investment of ` 10000 in the
Scheme (`) Benchmark #(`)Additional
Benchmark # # (`)
Since Inception(Nov 25, 1999) 9.30 N.A. N.A. 47,831 N.A. N.A.
Last 1 Year 10.75 11.47 11.69
Last 3 Years 10.00 10.91 11.15 N.A.
Last 5 Years 8.70 9.58 8.46
Kotak Bond - Regular Plan - Growth
Kotak Gilt - Investment - Regular - Growth
SchemeReturns (%) ^ (%)
I-SEC Composite Gilt Index # (%)
CRISIL 10 Year Gilt## (%) Current Value of Standard Investment of ` 10000 in the
Scheme (`) Benchmark #(`)Additional
Benchmark # # (`)
Since Inception(Dec 29, 1998) 10.05 N.A. N.A. 58,907 N.A. N.A.
Last 1 Year 13.14 11.04 11.69
Last 3 Years 11.55 11.17 11.15 N.A.
Last 5 Years 9.28 9.88 8.46
Scheme Inception date is 29/12/1998. Mr. Abhishek Bisen has been managing the fund since 15/04/2008.
Different plans have different expense structure. The performance details provided herein are of regular plan
^Past performance may or may not be sustained in future.*All payouts during the period have been reinvested in the units of the scheme at the then prevailing NAV. Returns >= 1 year: CAGR (Compounded Annualised Growth Rate). N.A stands for data not available. Note: Point to Point (PTP) Returns in INR shows the value of 10,000/- investment made at inception. Source: ICRA MFI Explorer. # Name of Scheme Benchmark. ## Name of Additional Benchmark.
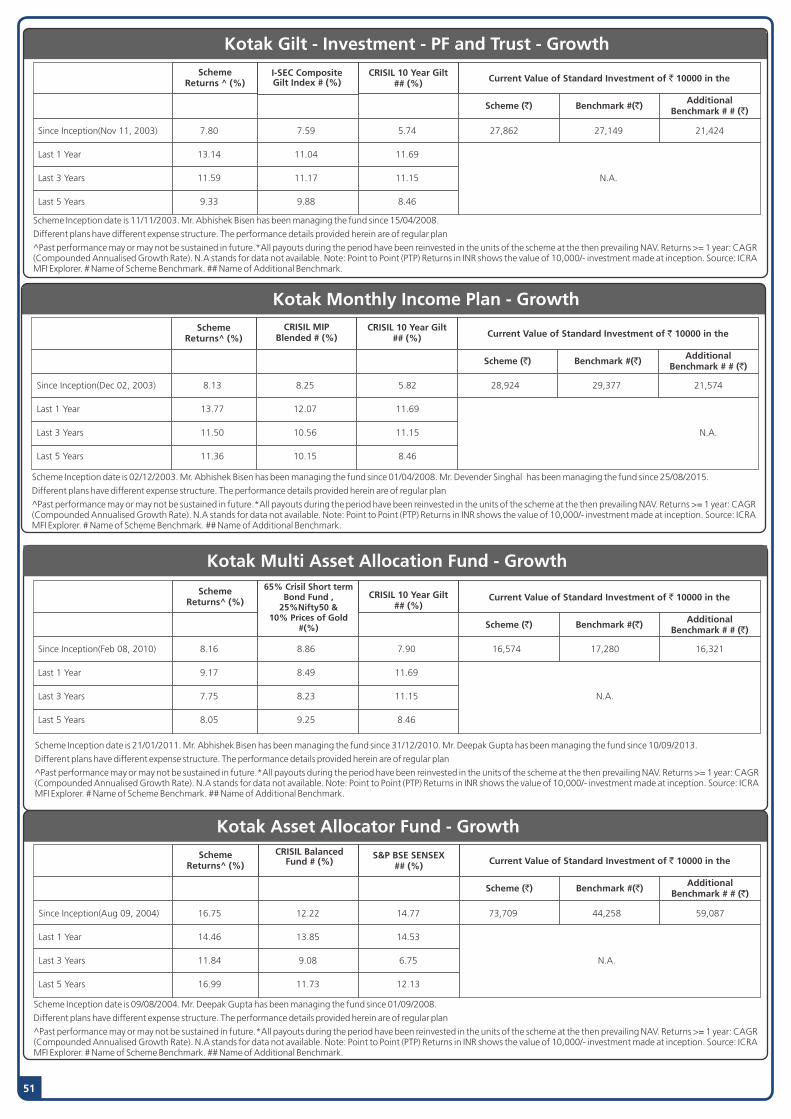
51
Kotak Monthly Income Plan - Growth
Scheme Inception date is 02/12/2003. Mr. Abhishek Bisen has been managing the fund since 01/04/2008. Mr. Devender Singhal has been managing the fund since 25/08/2015.
Different plans have different expense structure. The performance details provided herein are of regular plan
^Past performance may or may not be sustained in future.*All payouts during the period have been reinvested in the units of the scheme at the then prevailing NAV. Returns >= 1 year: CAGR (Compounded Annualised Growth Rate). N.A stands for data not available. Note: Point to Point (PTP) Returns in INR shows the value of 10,000/- investment made at inception. Source: ICRA MFI Explorer. # Name of Scheme Benchmark. ## Name of Additional Benchmark.
SchemeReturns^ (%)
CRISIL MIP Blended # (%)
CRISIL 10 Year Gilt## (%) Current Value of Standard Investment of ` 10000 in the
Scheme (`) Benchmark #(`)Additional
Benchmark # # (`)
Since Inception(Dec 02, 2003) 8.13 8.25 5.82 28,924 29,377 21,574
Last 1 Year 13.77 12.07 11.69
Last 3 Years 11.50 10.56 11.15 N.A.
Last 5 Years 11.36 10.15 8.46
Kotak Multi Asset Allocation Fund - Growth
SchemeReturns^ (%)
65% Crisil Short term Bond Fund ,
25%Nifty50 & 10% Prices of Gold
#(%)
CRISIL 10 Year Gilt## (%)
Current Value of Standard Investment of ` 10000 in the
Scheme (`) Benchmark #(`)Additional
Benchmark # # (`)
Since Inception(Feb 08, 2010) 8.16 8.86 7.90 16,574 17,280 16,321
Last 1 Year 9.17 8.49 11.69
Last 3 Years 7.75 8.23 11.15 N.A.
Last 5 Years 8.05 9.25 8.46
Scheme Inception date is 21/01/2011. Mr. Abhishek Bisen has been managing the fund since 31/12/2010. Mr. Deepak Gupta has been managing the fund since 10/09/2013.
Different plans have different expense structure. The performance details provided herein are of regular plan
^Past performance may or may not be sustained in future.*All payouts during the period have been reinvested in the units of the scheme at the then prevailing NAV. Returns >= 1 year: CAGR (Compounded Annualised Growth Rate). N.A stands for data not available. Note: Point to Point (PTP) Returns in INR shows the value of 10,000/- investment made at inception. Source: ICRA MFI Explorer. # Name of Scheme Benchmark. ## Name of Additional Benchmark.
Kotak Asset Allocator Fund - Growth
Scheme Inception date is 09/08/2004. Mr. Deepak Gupta has been managing the fund since 01/09/2008.
Different plans have different expense structure. The performance details provided herein are of regular plan
^Past performance may or may not be sustained in future.*All payouts during the period have been reinvested in the units of the scheme at the then prevailing NAV. Returns >= 1 year: CAGR (Compounded Annualised Growth Rate). N.A stands for data not available. Note: Point to Point (PTP) Returns in INR shows the value of 10,000/- investment made at inception. Source: ICRA MFI Explorer. # Name of Scheme Benchmark. ## Name of Additional Benchmark.
SchemeReturns^ (%)
CRISIL Balanced Fund # (%)
S&P BSE SENSEX## (%) Current Value of Standard Investment of ` 10000 in the
Scheme (`) Benchmark #(`)Additional
Benchmark # # (`)
Since Inception(Aug 09, 2004) 16.75 12.22 14.77 73,709 44,258 59,087
Last 1 Year 14.46 13.85 14.53
Last 3 Years 11.84 9.08 6.75 N.A.
Last 5 Years 16.99 11.73 12.13
Kotak Gilt - Investment - PF and Trust - Growth
Scheme Inception date is 11/11/2003. Mr. Abhishek Bisen has been managing the fund since 15/04/2008.
Different plans have different expense structure. The performance details provided herein are of regular plan
^Past performance may or may not be sustained in future.*All payouts during the period have been reinvested in the units of the scheme at the then prevailing NAV. Returns >= 1 year: CAGR (Compounded Annualised Growth Rate). N.A stands for data not available. Note: Point to Point (PTP) Returns in INR shows the value of 10,000/- investment made at inception. Source: ICRA MFI Explorer. # Name of Scheme Benchmark. ## Name of Additional Benchmark.
SchemeReturns ^ (%)
I-SEC Composite Gilt Index # (%)
CRISIL 10 Year Gilt## (%) Current Value of Standard Investment of ` 10000 in the
Scheme (`) Benchmark #(`)Additional
Benchmark # # (`)
Since Inception(Nov 11, 2003) 7.80 7.59 5.74 27,862 27,149 21,424
Last 1 Year 13.14 11.04 11.69
Last 3 Years 11.59 11.17 11.15 N.A.
Last 5 Years 9.33 9.88 8.46
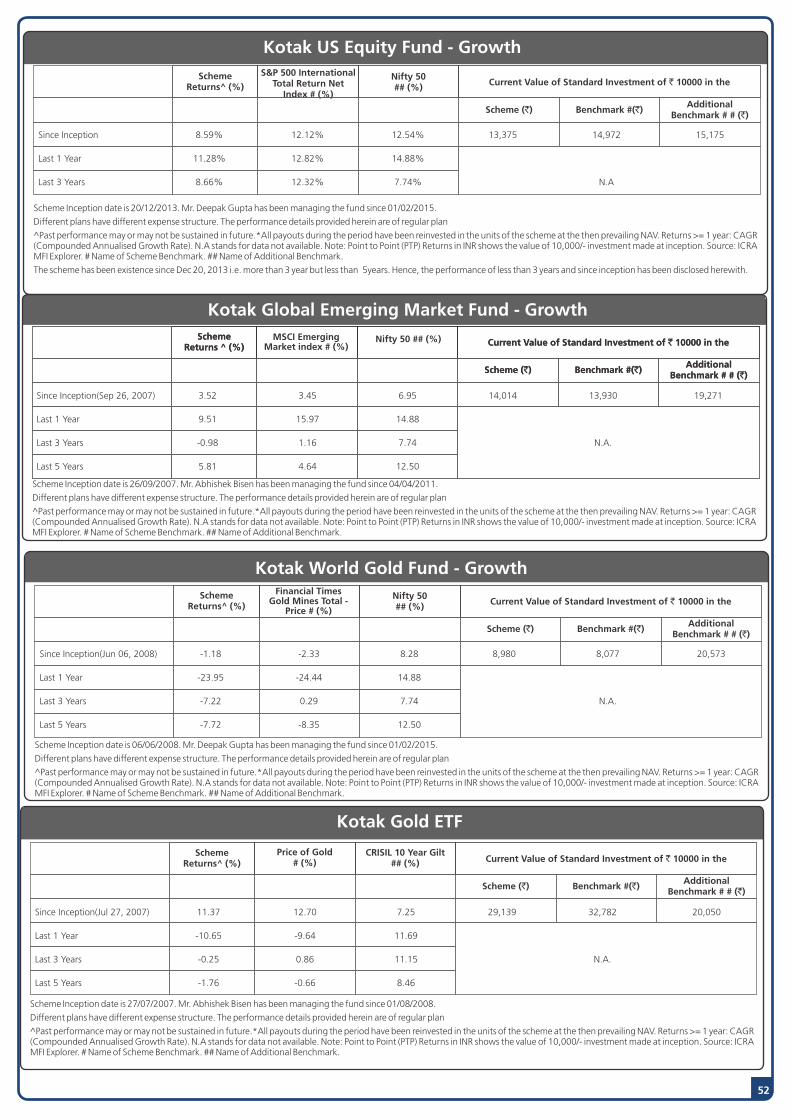
52
Kotak World Gold Fund - Growth
Scheme Inception date is 06/06/2008. Mr. Deepak Gupta has been managing the fund since 01/02/2015.
Different plans have different expense structure. The performance details provided herein are of regular plan
^Past performance may or may not be sustained in future.*All payouts during the period have been reinvested in the units of the scheme at the then prevailing NAV. Returns >= 1 year: CAGR (Compounded Annualised Growth Rate). N.A stands for data not available. Note: Point to Point (PTP) Returns in INR shows the value of 10,000/- investment made at inception. Source: ICRA MFI Explorer. # Name of Scheme Benchmark. ## Name of Additional Benchmark.
SchemeReturns^ (%)
Financial Times Gold Mines Total -
Price # (%)
Nifty 50## (%) Current Value of Standard Investment of ` 10000 in the
Scheme (`) Benchmark #(`)Additional
Benchmark # # (`)
Since Inception(Jun 06, 2008) -1.18 -2.33 8.28 8,980 8,077 20,573
Last 1 Year -23.95 -24.44 14.88
Last 3 Years -7.22 0.29 7.74 N.A.
Last 5 Years -7.72 -8.35 12.50
Kotak Global Emerging Market Fund - Growth
Scheme Inception date is 26/09/2007. Mr. Abhishek Bisen has been managing the fund since 04/04/2011.
Different plans have different expense structure. The performance details provided herein are of regular plan
^Past performance may or may not be sustained in future.*All payouts during the period have been reinvested in the units of the scheme at the then prevailing NAV. Returns >= 1 year: CAGR (Compounded Annualised Growth Rate). N.A stands for data not available. Note: Point to Point (PTP) Returns in INR shows the value of 10,000/- investment made at inception. Source: ICRA MFI Explorer. # Name of Scheme Benchmark. ## Name of Additional Benchmark.
SchemeReturns ^ (%)
MSCI Emerging Market index # (%)
Nifty 50 ## (%) Current Value of Standard Investment of ` 10000 in the
Scheme (`) Benchmark #(`)Additional
Benchmark # # (`)
SchemeReturns ^ (%) Current Value of Standard Investment of ` 10000 in the
Scheme (`) Benchmark #(`)Additional
Benchmark # # (`)
Since Inception(Sep 26, 2007) 3.52 3.45 6.95 14,014 13,930 19,271
Last 1 Year 9.51 15.97 14.88
Last 3 Years -0.98 1.16 7.74 N.A.
Last 5 Years 5.81 4.64 12.50
Kotak Gold ETF
SchemeReturns^ (%)
Price of Gold# (%)
CRISIL 10 Year Gilt## (%) Current Value of Standard Investment of ` 10000 in the
Scheme (`) Benchmark #(`)Additional
Benchmark # # (`)
Since Inception(Jul 27, 2007) 11.37 12.70 7.25 29,139 32,782 20,050
Last 1 Year -10.65 -9.64 11.69
Last 3 Years -0.25 0.86 11.15 N.A.
Last 5 Years -1.76 -0.66 8.46
Scheme Inception date is 27/07/2007. Mr. Abhishek Bisen has been managing the fund since 01/08/2008.
Different plans have different expense structure. The performance details provided herein are of regular plan
^Past performance may or may not be sustained in future.*All payouts during the period have been reinvested in the units of the scheme at the then prevailing NAV. Returns >= 1 year: CAGR (Compounded Annualised Growth Rate). N.A stands for data not available. Note: Point to Point (PTP) Returns in INR shows the value of 10,000/- investment made at inception. Source: ICRA MFI Explorer. # Name of Scheme Benchmark. ## Name of Additional Benchmark.
Kotak US Equity Fund - Growth S&P 500 International
Total Return Net Index # (%)
SchemeReturns^ (%)
Nifty 50## (%) Current Value of Standard Investment of ` 10000 in the
Scheme (`) Benchmark #(`)Additional
Benchmark # # (`)
Since Inception 8.59% 12.12% 12.54% 13,375 14,972 15,175
Last 1 Year 11.28% 12.82% 14.88%
Last 3 Years 8.66% 12.32% 7.74% N.A
Scheme Inception date is 20/12/2013. Mr. Deepak Gupta has been managing the fund since 01/02/2015.
Different plans have different expense structure. The performance details provided herein are of regular plan
^Past performance may or may not be sustained in future.*All payouts during the period have been reinvested in the units of the scheme at the then prevailing NAV. Returns >= 1 year: CAGR (Compounded Annualised Growth Rate). N.A stands for data not available. Note: Point to Point (PTP) Returns in INR shows the value of 10,000/- investment made at inception. Source: ICRA MFI Explorer. # Name of Scheme Benchmark. ## Name of Additional Benchmark.
The scheme has been existence since Dec 20, 2013 i.e. more than 3 year but less than 5years. Hence, the performance of less than 3 years and since inception has been disclosed herewith.

53
Kotak Banking ETF
Scheme Inception date is 10/12/2014. Mr. Deepak Gupta has been managing the fund since 24/11/2014.
Different plans have different expense structure. The performance details provided herein are of regular plan
^Past performance may or may not be sustained in future.*All payouts during the period have been reinvested in the units of the scheme at the then prevailing NAV. Returns >= 1 year: CAGR (Compounded Annualised Growth Rate). N.A stands for data not available. Note: Point to Point (PTP) Returns in INR shows the value of 10,000/- investment made at inception. Source: ICRA MFI Explorer. # Name of Scheme Benchmark. ## Name of Additional Benchmark.
The scheme has been existence since Dec 10, 2014 i.e. more than 1year but less than 3 years/5years. Hence, the performance of less than 1 year and since inception has been disclosed herewith.
Nifty Bank#(%)
Kotak Sensex ETF
Scheme Inception date is 06/06/2008. Mr. Deepak Gupta has been managing the fund since 25/02/2011.Different plans have different expense structure. The performance details provided herein are of regular plan ^Past performance may or may not be sustained in future.*All payouts during the period have been reinvested in the units of the scheme at the then prevailing NAV. Returns >= 1 year: CAGR (Compounded Annualised Growth Rate). N.A stands for data not available. Note: Point to Point (PTP) Returns in INR shows the value of 10,000/- investment made at inception. Source: ICRA MFI Explorer. # Name of Scheme Benchmark. ## Name of Additional Benchmark.
SchemeReturns ^ (%)
S&P BSE SENSEX# (%)
Nifty 50## (%) Current Value of Standard Investment of ` 10000 in the
Scheme (`) Benchmark #(`)Additional
Benchmark # # (`)
Since Inception(Jun 06, 2008) 8.97 7.86 8.28 21,792 19,857 20,573
Last 1 Year 15.60 14.53 14.88
Last 3 Years 7.93 6.75 7.74 N.A.
Last 5 Years 13.37 12.13 12.50
Kotak PSU Bank ETF
Scheme Inception date is 08/11/2007. Mr. Deepak Gupta has been managing the fund since 25/02/2011.Different plans have different expense structure. The performance details provided herein are of regular plan ^Past performance may or may not be sustained in future.*All payouts during the period have been reinvested in the units of the scheme at the then prevailing NAV. Returns >= 1 year: CAGR (Compounded Annualised Growth Rate). N.A stands for data not available. Note: Point to Point (PTP) Returns in INR shows the value of 10,000/- investment made at inception. Source: ICRA MFI Explorer. # Name of Scheme Benchmark. ## Name of Additional Benchmark.
SchemeReturns ^ (%)
Nifty 50 ## (%)Nifty PSU Bank#(%) Current Value of Standard Investment of ` 10000 in the
Scheme (`) Benchmark #(`)Additional
Benchmark # # (`)
Since Inception(Nov 08, 2007) 3.28 1.41 5.46 13,651 11,444 16,707
Last 1 Year 21.39 21.19 14.88
Last 3 Years -4.65 -5.19 7.74 N.A.
Last 5 Years 2.56 0.26 12.50
Kotak Nifty ETF
Scheme Inception date is 08/02/2010. Mr. Deepak Gupta has been managing the fund since 25/02/2011.
Different plans have different expense structure. The performance details provided herein are of regular plan
^Past performance may or may not be sustained in future.*All payouts during the period have been reinvested in the units of the scheme at the then prevailing NAV. Returns >= 1 year: CAGR (Compounded Annualised Growth Rate). N.A stands for data not available. Note: Point to Point (PTP) Returns in INR shows the value of 10,000/- investment made at inception. Source: ICRA MFI Explorer. # Name of Scheme Benchmark. ## Name of Additional Benchmark.
SchemeReturns^ (%) Nifty 50 # (%)
S&P BSE SENSEX## (%) Current Value of Standard Investment of ` 10000 in the
Scheme (`) Benchmark #(`)Additional
Benchmark # # (`)
Since Inception(Feb 08, 2010) 10.98 9.83 9.38 21,612 20,000 19,404
Last 1 Year 16.09 14.88 14.53
Last 3 Years 9.02 7.74 6.75 N.A.
Last 5 Years 13.74 12.50 12.13
SchemeReturns ^ (%)
Nifty 50 ## (%) Current Value of Standard Investment of ` 10000 in the
Scheme (`) Benchmark #(`)Additional
Benchmark # # (`)
Since Inception(Dec 10, 2014)) 10.19 9.37 5.24 12,815 12,572 11,395
Last 1 Year 29.94 29.42 14.88 N.A.
Kotak Banking ETF
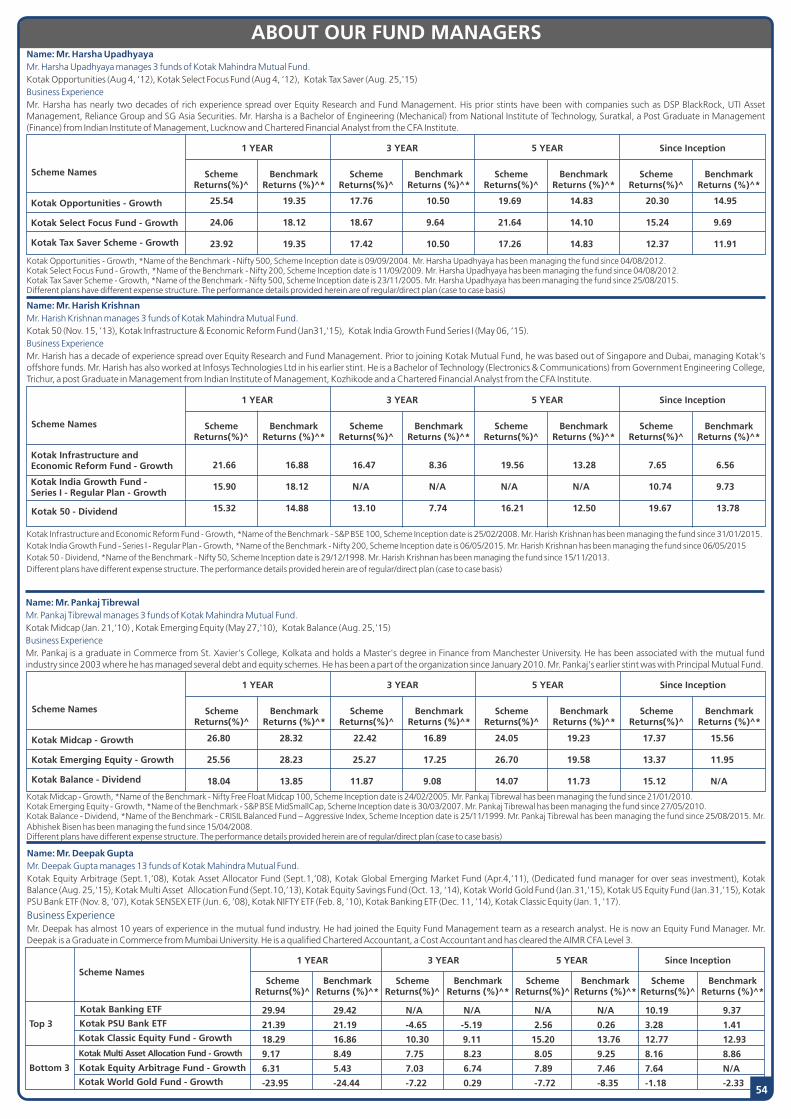
Scheme Names
Kotak Midcap - Growth
Kotak Emerging Equity - Growth
Kotak Balance - Dividend
1 YEAR 3 YEAR 5 YEAR Since Inception
SchemeReturns(%)^
BenchmarkReturns (%)^*
SchemeReturns(%)^
BenchmarkReturns (%)^*
SchemeReturns(%)^
BenchmarkReturns (%)^*
SchemeReturns(%)^
BenchmarkReturns (%)^*
Scheme Names
Kotak PSU Bank ETF
Kotak Banking ETF
Kotak Classic Equity Fund - Growth
1 YEAR 3 YEAR 5 YEAR Since Inception
SchemeReturns(%)^
BenchmarkReturns (%)^*
SchemeReturns(%)^
BenchmarkReturns (%)^*
SchemeReturns(%)^
BenchmarkReturns (%)^*
SchemeReturns(%)^
BenchmarkReturns (%)^*
Kotak World Gold Fund - Growth
Kotak Multi Asset Allocation Fund - Growth
Kotak Equity Arbitrage Fund - Growth
Top 3
Bottom 3
ABOUT OUR FUND MANAGERS
54
Name: Mr. Harsha UpadhyayaMr. Harsha Upadhyaya manages 3 funds of Kotak Mahindra Mutual Fund.Kotak Opportunities (Aug 4, �12), Kotak Select Focus Fund (Aug 4, �12), Kotak Tax Saver (Aug. 25,'15)Business ExperienceMr. Harsha has nearly two decades of rich experience spread over Equity Research and Fund Management. His prior stints have been with companies such as DSP BlackRock, UTI Asset Management, Reliance Group and SG Asia Securities. Mr. Harsha is a Bachelor of Engineering (Mechanical) from National Institute of Technology, Suratkal, a Post Graduate in Management (Finance) from Indian Institute of Management, Lucknow and Chartered Financial Analyst from the CFA Institute.
Name: Mr. Harish KrishnanMr. Harish Krishnan manages 3 funds of Kotak Mahindra Mutual Fund.Kotak 50 (Nov. 15, �13), Kotak Infrastructure & Economic Reform Fund (Jan31,'15), Kotak India Growth Fund Series I (May 06, �15).Business ExperienceMr. Harish has a decade of experience spread over Equity Research and Fund Management. Prior to joining Kotak Mutual Fund, he was based out of Singapore and Dubai, managing Kotak's offshore funds. Mr. Harish has also worked at Infosys Technologies Ltd in his earlier stint. He is a Bachelor of Technology (Electronics & Communications) from Government Engineering College, Trichur, a post Graduate in Management from Indian Institute of Management, Kozhikode and a Chartered Financial Analyst from the CFA Institute.
Name: Mr. Pankaj TibrewalMr. Pankaj Tibrewal manages 3 funds of Kotak Mahindra Mutual Fund.Kotak Midcap (Jan. 21,�10) , Kotak Emerging Equity (May 27,'10), Kotak Balance (Aug. 25,'15)Business ExperienceMr. Pankaj is a graduate in Commerce from St. Xavier's College, Kolkata and holds a Master's degree in Finance from Manchester University. He has been associated with the mutual fund industry since 2003 where he has managed several debt and equity schemes. He has been a part of the organization since January 2010. Mr. Pankaj's earlier stint was with Principal Mutual Fund.
Scheme Names
Kotak Opportunities - Growth
Kotak Select Focus Fund - Growth
Kotak Tax Saver Scheme - Growth
1 YEAR 3 YEAR 5 YEAR Since Inception
SchemeReturns(%)^
BenchmarkReturns (%)^*
SchemeReturns(%)^
BenchmarkReturns (%)^*
SchemeReturns(%)^
BenchmarkReturns (%)^*
SchemeReturns(%)^
BenchmarkReturns (%)^*
Kotak Opportunities - Growth, *Name of the Benchmark - Nifty 500, Scheme Inception date is 09/09/2004. Mr. Harsha Upadhyaya has been managing the fund since 04/08/2012. Kotak Select Focus Fund - Growth, *Name of the Benchmark - Nifty 200, Scheme Inception date is 11/09/2009. Mr. Harsha Upadhyaya has been managing the fund since 04/08/2012. Kotak Tax Saver Scheme - Growth, *Name of the Benchmark - Nifty 500, Scheme Inception date is 23/11/2005. Mr. Harsha Upadhyaya has been managing the fund since 25/08/2015. Different plans have different expense structure. The performance details provided herein are of regular/direct plan (case to case basis)
Scheme Names
Kotak Infrastructure and Economic Reform Fund - Growth
Kotak India Growth Fund - Series I - Regular Plan - Growth
Kotak 50 - Dividend
1 YEAR 3 YEAR 5 YEAR Since Inception
SchemeReturns(%)^
BenchmarkReturns (%)^*
SchemeReturns(%)^
BenchmarkReturns (%)^*
SchemeReturns(%)^
BenchmarkReturns (%)^*
SchemeReturns(%)^
BenchmarkReturns (%)^*
Kotak Infrastructure and Economic Reform Fund - Growth, *Name of the Benchmark - S&P BSE 100, Scheme Inception date is 25/02/2008. Mr. Harish Krishnan has been managing the fund since 31/01/2015. Kotak India Growth Fund - Series I - Regular Plan - Growth, *Name of the Benchmark - Nifty 200, Scheme Inception date is 06/05/2015. Mr. Harish Krishnan has been managing the fund since 06/05/2015 Kotak 50 - Dividend, *Name of the Benchmark - Nifty 50, Scheme Inception date is 29/12/1998. Mr. Harish Krishnan has been managing the fund since 15/11/2013. Different plans have different expense structure. The performance details provided herein are of regular/direct plan (case to case basis)
Kotak Midcap - Growth, *Name of the Benchmark - Nifty Free Float Midcap 100, Scheme Inception date is 24/02/2005. Mr. Pankaj Tibrewal has been managing the fund since 21/01/2010.Kotak Emerging Equity - Growth, *Name of the Benchmark - S&P BSE MidSmallCap, Scheme Inception date is 30/03/2007. Mr. Pankaj Tibrewal has been managing the fund since 27/05/2010.Kotak Balance - Dividend, *Name of the Benchmark - CRISIL Balanced Fund � Aggressive Index, Scheme Inception date is 25/11/1999. Mr. Pankaj Tibrewal has been managing the fund since 25/08/2015. Mr. Abhishek Bisen has been managing the fund since 15/04/2008.Different plans have different expense structure. The performance details provided herein are of regular/direct plan (case to case basis)
Name: Mr. Deepak GuptaMr. Deepak Gupta manages 13 funds of Kotak Mahindra Mutual Fund.Kotak Equity Arbitrage (Sept.1,�08), Kotak Asset Allocator Fund (Sept.1,�08), Kotak Global Emerging Market Fund (Apr.4,�11), (Dedicated fund manager for over seas investment), Kotak Balance (Aug. 25,'15), Kotak Multi Asset Allocation Fund (Sept.10,�13), Kotak Equity Savings Fund (Oct. 13, '14), Kotak World Gold Fund (Jan.31,�15), Kotak US Equity Fund (Jan.31,�15), Kotak PSU Bank ETF (Nov. 8, �07), Kotak SENSEX ETF (Jun. 6, �08), Kotak NIFTY ETF (Feb. 8, �10), Kotak Banking ETF (Dec. 11, �14), Kotak Classic Equity (Jan. 1, '17).
Business ExperienceMr. Deepak has almost 10 years of experience in the mutual fund industry. He had joined the Equity Fund Management team as a research analyst. He is now an Equity Fund Manager. Mr. Deepak is a Graduate in Commerce from Mumbai University. He is a qualified Chartered Accountant, a Cost Accountant and has cleared the AIMR CFA Level 3.
25.54 19.35 17.76 10.50 19.69 14.83 20.30 14.95
24.06 18.12 18.67 9.64 21.64 14.10 15.24 9.69
23.92 19.35 17.42 10.50 17.26 14.83 12.37 11.91
21.66 16.88 16.47 8.36 19.56 13.28 7.65 6.56
15.90 18.12 N/A N/A N/A N/A 10.74 9.73
15.32 14.88 13.10 7.74 16.21 12.50 19.67 13.78
26.80 28.32 22.42 16.89 24.05 19.23 17.37 15.56
25.56 28.23 25.27 17.25 26.70 19.58 13.37 11.95
18.04 13.85 11.87 9.08 14.07 11.73 15.12 N/A
29.94 29.42 N/A N/A N/A N/A 10.19 9.37
21.39 21.19 -4.65 -5.19 2.56 0.26 3.28 1.41
18.29 16.86 10.30 9.11 15.20 13.76 12.77 12.93
9.17 8.49 7.75 8.23 8.05 9.25 8.16 8.86
6.31 5.43 7.03 6.74 7.89 7.46 7.64 N/A
-23.95 -24.44 -7.22 0.29 -7.72 -8.35 -1.18 -2.33

Kotak Balance - Dividend, *Name of the Benchmark - CRISIL Balanced Fund � Aggressive Index, Scheme Inception date is 25/11/1999. Mr. Pankaj Tibrewal has been managing the fund since 25/08/2015. Mr. Abhishek Bisen has been managing the fund since 15/04/2008.Kotak Monthly Income Plan - Growth, *Name of the Benchmark - CRISIL MIP Blended, Scheme Inception date is 02/12/2003. Mr. Abhishek Bisen has been managing the fund since 01/04/2008. Mr. Devender Singhal has been managing the fund since 25/08/2015.Kotak Gilt - Investment - Regular - Growth, *Name of the Benchmark - I-SEC Composite Gilt Index, Scheme Inception date is 29/12/1998. Mr. Abhishek Bisen has been managing the fund since 15/04/2008.Kotak Multi Asset Allocation Fund - Growth, *Name of the Benchmark - 65% Crisil Short term Bond Fund ,25% Nifty 50 & 10% Prices of Gold, Scheme Inception date is 21/01/2011. Mr. Abhishek Bisen has been managing the fund since 31/12/2010. Mr. Deepak Gupta has been managing the fund since 10/09/2013.Kotak Gold Fund - Growth, *Name of the Benchmark - Price of Gold, Scheme Inception date is 25/03/2011. Mr. Abhishek Bisen has been managing the fund since 04/03/2011.Kotak Gold ETF, *Name of the Benchmark - Price of Gold, Scheme Inception date is 27/07/2007. Mr. Abhishek Bisen has been managing the fund since 01/08/2008.Different plans have different expense structure. The performance details provided herein are of regular/direct plan (case to case basis)
Scheme Names
Kotak Balance - Dividend
Kotak Monthly Income Plan - Growth
Kotak Gilt - Investment - Regular - Growth
1 YEAR 3 YEAR 5 YEAR Since Inception
SchemeReturns(%)^
BenchmarkReturns (%)^*
SchemeReturns(%)^
BenchmarkReturns (%)^*
SchemeReturns(%)^
BenchmarkReturns (%)^*
SchemeReturns(%)^
BenchmarkReturns (%)^*
Kotak Multi Asset Allocation Fund - Growth
Kotak Gold ETF
Kotak Gold Fund - Growth
Top 3
Bottom 3
Kotak Banking ETF, *Name of the Benchmark - Nifty Bank, Scheme Inception date is 10/12/2014. Mr. Deepak Gupta has been managing the fund since 24/11/2014.Kotak PSU Bank ETF, *Name of the Benchmark - Nifty PSU Bank , Scheme Inception date is 08/11/2007. Mr. Deepak Gupta has been managing the fund since 25/02/2011.Kotak Classic Equity Fund - Growth, *Name of the Benchmark - Nifty 100, Scheme Inception date is 27/07/2005. Mr. Deepak Gupta has been managing the fund since 01/01/2017.Kotak Multi Asset Allocation Fund - Growth, *Name of the Benchmark - 65% Crisil Short term Bond Fund ,25% Nifty 50 & 10% Prices of Gold, Scheme Inception date is 21/01/2011. Mr. Abhishek Bisen has been managing the fund since 31/12/2010. Mr. Deepak Gupta has been managing the fund since 10/09/2013.Kotak Equity Arbitrage Fund - Growth, *Name of the Benchmark - Nifty 50 Arbitrage Index, Scheme Inception date is 29/09/2005. Mr. Deepak Gupta has been managing the fund since 01/09/2008.Kotak World Gold Fund - Growth, *Name of the Benchmark - Financial Times Gold Mines Total - Price, Scheme Inception date is 06/06/2008. Mr. Deepak Gupta has been managing the fund since 01/02/2015.Different plans have different expense structure. The performance details provided herein are of regular/direct plan (case to case basis)
Name: Mr. Abhishek Bisen
Mr. Abhishek Bisen manages 9 funds of Kotak Mahindra Mutual Fund.
Kotak Balance (Apr. 15, 2008), Kotak Monthly Income Plan (Apr. 15, �08), Kotak Bond (Regular Plan) (Apr. 15, �08), Kotak Gilt Investment (Regular & PF-Trust) (Apr. 15, �08), Kotak Global Emerging Market Fund (Apr. 15, �08), Kotak Multi Asset Allocation Fund (Jan. 21, �11), Kotak Equity Savings Fund (Oct. 13, '14), Kotak Gold ETF (Jul. 27, �07), Kotak Gold Fund (Mar. 25, '11)
Business Experience
Mr. Abhishek has been associated with the company since October 2006 and his key responsibilities include fund management of debt schemes. Prior to joining Kotak AMC, Me, Abhishek was working with Securities Trading Corporation Of India Ltd where he was looking at Sales & Trading of Fixed Income Products apart from doing Portfolio Advisory. He has been awarded twice as one of the Highly Commended Investors in Indian Rupees Bonds from the Asset magazine Hong Kong. His educational background is B.A (Management) and MBA (Finance).
Name: Mr. Deepak Agrawal
Mr. Deepak Agrawal manages 10 & All FMPs funds of Kotak Mahindra Mutual Fund.
(Kotak Bond Short Term (Apr. 14, �08), Kotak Flexi Debt (Jul. 11, �07), Kotak Floater Short Term (Nov. 25, �07), Kotak Liquid (Jul. 11, �12), Kotak Kotak Banking and PSU Debt Fund (Apr. 14, �08), Kotak Treasury Advantage Fund (Formerly Known as Kotak Floater Long Term Scheme) (Jul. 11, �07), Kotak Income Opportunities Fund (May 11, '10), Kotak Medium Term Fund (Mar. 21, �14), Kotak Low Duration Fund (Jan. 31, �15), Kotak Corporate Bond Fund (Jan. 31, �15), All Fixed Maturity Plans in existence (Aug. 13,'15),
Business Experience
Mr. Deepak's career has started from Kotak AMC when he joined the organization in December 2002 where he was initially in Research, Dealing and then moved into Fund Management from November 2006. Mr. Deepak is a Post Graduate in Commerce, Chartered Account and Company Secretary.
Scheme Names
Kotak Flexi Debt - Regular Plan - Growth
Kotak Medium Term Fund -Regular Plan - Growth
1 YEAR 3 YEAR 5 YEAR Since Inception
SchemeReturns(%)^
BenchmarkReturns (%)^*
SchemeReturns(%)^
BenchmarkReturns (%)^*
SchemeReturns(%)^
BenchmarkReturns (%)^*
SchemeReturns(%)^
BenchmarkReturns (%)^*
Kotak Treasury Advantage Fund - Growth
Kotak Floater - Short Term - Growth
Kotak Liquid - Regular Plan - Growth
Top 3
Bottom 3
Kotak Income Opportunities Fund - Growth
Kotak Flexi Debt - Regular Plan - Growth, *Name of the Benchmark - CRISIL Composite Bond Fund, Scheme Inception date is 26/05/2008. Mr. Deepak Agrawal has been managing the fund since 25/11/2012. Kotak Medium Term Fund - Regular Plan - Growth, *Name of the Benchmark - CRISIL Composite Bond Fund, Scheme Inception date is 21/03/2014. Mr. Deepak Agrawal has been managing the fund since 22/06/2015. Kotak Income Opportunities Fund - Growth, *Name of the Benchmark - CRISIL Short Term Bond Fund, Scheme Inception date is 11/05/2010. Mr. Deepak Agrawal has been managing the fund since 12/04/2010. Kotak Treasury Advantage Fund - Growth, *Name of the Benchmark - CRISIL Liquid Fund, Scheme Inception date is 13/08/2004. Mr. Deepak Agrawal has been managing the fund since 01/04/2008. Kotak Floater - Short Term - Growth, *Name of the Benchmark - CRISIL Liquid Fund, Scheme Inception date is 14/07/2003. Mr. Deepak Agrawal has been managing the fund since 01/11/2006. Kotak Liquid - Regular Plan - Growth, *Name of the Benchmark - CRISIL Liquid Fund, Scheme Inception date is 04/11/2003. Mr. Deepak Agrawal has been managing the fund since 01/05/2007. Different plans have different expense structure. The performance details provided herein are of regular/direct plan (case to case basis)
55
Kotak Monthly Income Plan - Growth, *Name of the Benchmark - CRISIL MIP Blended, Scheme Inception date is 02/12/2003. Mr. Abhishek Bisen has been managing the fund since 01/04/2008. Mr. Devender Singhal has been managing the fund since 25/08/2015. Different plans have different expense structure. The performance details provided herein are of regular/direct plan (case to case basis)
Scheme Names
Kotak Monthly IncomePlan - Growth
1 YEAR 3 YEAR 5 YEAR Since Inception
SchemeReturns(%)^
BenchmarkReturns (%)^*
SchemeReturns(%)^
BenchmarkReturns (%)^*
SchemeReturns(%)^
BenchmarkReturns (%)^*
SchemeReturns(%)^
BenchmarkReturns (%)^*
Name: Mr. Devender Singhal
Mr. Devender Singhal manages 1 fund of Kotak Mahindra Mutual Fund.
Kotak Monthly Income Plan (Aug. 25,�15)
Business Experience
Mr. Devender has been associated with the Kotak Group since July 2007. He is responsible for the research coverage of FMCG, Automobiles and Media sectors at Kotak AMC since Feb 2009. Devender has an overall working experience of 14 years in equity research and fund management. Prior to joining Kotak AMC, Devender worked with the PMS divisions of Kotak, Religare, Karvy and P N Vijay Financial Services.
18.04 13.85 11.87 9.08 14.07 11.73 15.12 N/A
13.77 12.07 11.50 10.56 11.36 10.15 8.13 8.25
13.14 11.04 11.55 11.17 9.28 9.88 10.05 N/A
9.17 8.49 7.75 8.23 8.05 9.25 8.16 8.86
-6.77 -9.64 -1.18 0.86 -2.48 -0.66 3.18 5.17
-10.65 -9.64 -0.25 0.86 -1.76 -0.66 11.37 12.70
11.67 11.47 10.13 10.91 9.70 9.58 8.80 8.23
10.30 11.47 10.01 10.91 N/A N/A 10.34 11.34
9.78 8.88 9.57 9.12 9.36 9.09 8.80 8.46
7.68 6.86 8.33 7.83 8.69 8.25 7.86 7.14
6.94 6.86 7.98 7.83 8.50 8.25 7.39 6.89
6.88 6.86 7.91 7.83 8.43 8.25 7.48 6.96
13.77 12.07 11.50 10.56 11.36 10.15 8.13 8.25
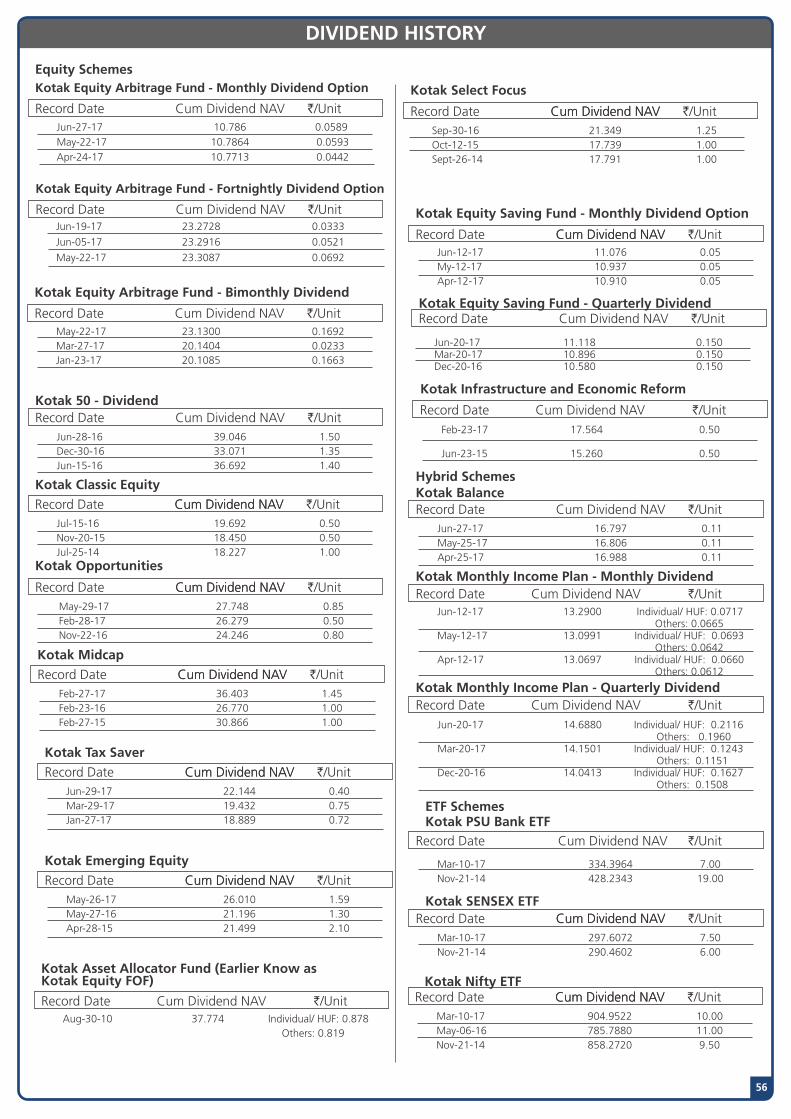
Kotak Asset Allocator Fund (Earlier Know asKotak Equity FOF)
Record Date Cum Dividend NAV `/UnitAug-30-10 37.774 Individual/ HUF: 0.878 Others: 0.819
DIVIDEND HISTORY
54
May-29-17 27.748 0.85Feb-28-17 26.279 0.50Nov-22-16 24.246 0.80
Kotak Opportunities
Record Date Cum Dividend NAVCum Dividend NAV `/Unit
Record Date Cum Dividend NAV `/UnitJun-28-16 39.046 1.50Dec-30-16 33.071 1.35Jun-15-16 36.692 1.40
Kotak Classic Equity
Record Date Cum Dividend NAVCum Dividend NAV `/UnitJul-15-16 19.692 0.50Nov-20-15 18.450 0.50Jul-25-14 18.227 1.00
Kotak 50 - Dividend
Equity Schemes
Record Date Cum Dividend NAV `/UnitJun-27-17 10.786 0.0589May-22-17 10.7864 0.0593Apr-24-17 10.7713 0.0442
Kotak Equity Arbitrage Fund - Monthly Dividend Option
Kotak Midcap
Record Date Cum Dividend NAVCum Dividend NAV `/UnitFeb-27-17 36.403 1.45Feb-23-16 26.770 1.00Feb-27-15 30.866 1.00
Kotak Tax Saver
Record Date Cum Dividend NAVCum Dividend NAV `/UnitJun-29-17 22.144 0.40Mar-29-17 19.432 0.75Jan-27-17 18.889 0.72
Kotak Emerging Equity
Record Date Cum Dividend NAVCum Dividend NAV `/UnitMay-26-17 26.010 1.59May-27-16 21.196 1.30Apr-28-15 21.499 2.10
Kotak Select Focus
Record Date Cum Dividend NAVCum Dividend NAV `/UnitSep-30-16 21.349 1.25Oct-12-15 17.739 1.00Sept-26-14 17.791 1.00
Record Date Cum Dividend NAV `/Unit
Kotak Equity Arbitrage Fund - Bimonthly Dividend
May-22-17 23.1300 0.1692Mar-27-17 20.1404 0.0233Jan-23-17 20.1085 0.1663
DIVIDEND HISTORY
56
Kotak SENSEX ETFRecord Date Cum Dividend NAVCum Dividend NAV `/Unit
Kotak PSU Bank ETF
Mar-10-17 297.6072 7.50Nov-21-14 290.4602 6.00
Mar-10-17 334.3964 7.00Nov-21-14 428.2343 19.00
Cum Dividend NAVRecord Date `/Unit
ETF Schemes
Kotak Infrastructure and Economic Reform
Jun-12-17 11.076 0.05My-12-17 10.937 0.05Apr-12-17 10.910 0.05
Kotak Equity Saving Fund - Monthly Dividend Option
Record Date Cum Dividend NAVCum Dividend NAV `/Unit
Jun-12-17 13.2900 Individual/ HUF: 0.0717 Others: 0.0665May-12-17 13.0991 Individual/ HUF: 0.0693 Others: 0.0642Apr-12-17 13.0697 Individual/ HUF: 0.0660 Others: 0.0612
Record Date Cum Dividend NAV `/UnitKotak Equity Saving Fund - Quarterly Dividend
Kotak Monthly Income Plan - Monthly Dividend
Kotak Monthly Income Plan - Quarterly Dividend
Record Date
Record Date
Cum Dividend NAV
Cum Dividend NAV
`/Unit
`/UnitJun-20-17 14.6880 Individual/ HUF: 0.2116 Others: 0.1960Mar-20-17 14.1501 Individual/ HUF: 0.1243 Others: 0.1151Dec-20-16 14.0413 Individual/ HUF: 0.1627 Others: 0.1508
Hybrid Schemes
Record Date Cum Dividend NAV `/UnitJun-27-17 16.797 0.11May-25-17 16.806 0.11Apr-25-17 16.988 0.11
Kotak Balance
Jun-20-17 11.118 0.150 Mar-20-17 10.896 0.150 Dec-20-16 10.580 0.150
Record Date Cum Dividend NAV `/UnitFeb-23-17 17.564 0.50
Jun-23-15 15.260 0.50
Kotak Nifty ETFRecord Date Cum Dividend NAVCum Dividend NAV `/Unit
Mar-10-17 904.9522 10.00May-06-16 785.7880 11.00Nov-21-14 858.2720 9.50
Jun-19-17 23.2728 0.0333
Jun-05-17 23.2916 0.0521
May-22-17 23.3087 0.0692
Record Date Cum Dividend NAV `/Unit
Kotak Equity Arbitrage Fund - Fortnightly Dividend Option
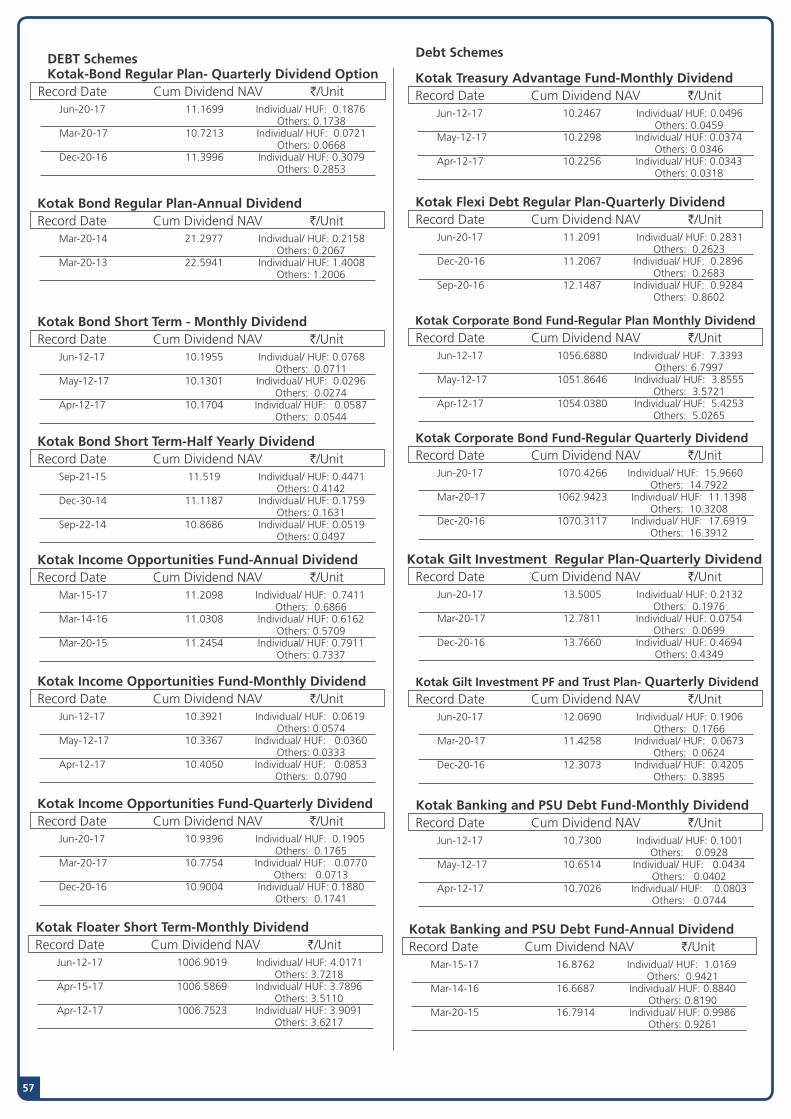
Kotak Bond Regular Plan-Annual DividendRecord Date Cum Dividend NAV `/Unit
Mar-20-14 21.2977 Individual/ HUF: 0.2158 Others: 0.2067Mar-20-13 22.5941 Individual/ HUF: 1.4008 Others: 1.2006
57
Kotak Bond Short Term - Monthly DividendRecord Date Cum Dividend NAV `/Unit
Jun-12-17 10.1955 Individual/ HUF: 0.0768 Others: 0.0711May-12-17 10.1301 Individual/ HUF: 0.0296 Others: 0.0274Apr-12-17 10.1704 Individual/ HUF: 0.0587 Others: 0.0544
Kotak Bond Short Term-Half Yearly DividendRecord Date Cum Dividend NAV `/Unit
Sep-21-15 11.519 Individual/ HUF: 0.4471 Others: 0.4142Dec-30-14 11.1187 Individual/ HUF: 0.1759 Others: 0.1631Sep-22-14 10.8686 Individual/ HUF: 0.0519 Others: 0.0497
Kotak Income Opportunities Fund-Annual DividendRecord Date Cum Dividend NAV `/Unit
Mar-15-17 11.2098 Individual/ HUF: 0.7411 Others: 0.6866Mar-14-16 11.0308 Individual/ HUF: 0.6162 Others: 0.5709Mar-20-15 11.2454 Individual/ HUF: 0.7911 Others: 0.7337
Kotak Income Opportunities Fund-Monthly DividendRecord Date Cum Dividend NAV `/Unit
Jun-12-17 10.3921 Individual/ HUF: 0.0619 Others: 0.0574May-12-17 10.3367 Individual/ HUF: 0.0360 Others: 0.0333Apr-12-17 10.4050 Individual/ HUF: 0.0853 Others: 0.0790
Kotak Income Opportunities Fund-Quarterly DividendRecord Date Cum Dividend NAV `/Unit
Jun-20-17 10.9396 Individual/ HUF: 0.1905 Others: 0.1765Mar-20-17 10.7754 Individual/ HUF: 0.0770 Others: 0.0713Dec-20-16 10.9004 Individual/ HUF: 0.1880 Others: 0.1741
Kotak Floater Short Term-Monthly DividendRecord Date Cum Dividend NAV `/Unit
Jun-12-17 1006.9019 Individual/ HUF: 4.0171 Others: 3.7218Apr-15-17 1006.5869 Individual/ HUF: 3.7896 Others: 3.5110Apr-12-17 1006.7523 Individual/ HUF: 3.9091 Others: 3.6217
Kotak Treasury Advantage Fund-Monthly DividendRecord Date Cum Dividend NAV `/Unit
Jun-12-17 10.2467 Individual/ HUF: 0.0496 Others: 0.0459May-12-17 10.2298 Individual/ HUF: 0.0374 Others: 0.0346Apr-12-17 10.2256 Individual/ HUF: 0.0343 Others: 0.0318
Debt Schemes
Kotak Flexi Debt Regular Plan-Quarterly Dividend Record Date Cum Dividend NAV `/Unit
Jun-20-17 11.2091 Individual/ HUF: 0.2831 Others: 0.2623Dec-20-16 11.2067 Individual/ HUF: 0.2896 Others: 0.2683Sep-20-16 12.1487 Individual/ HUF: 0.9284 Others: 0.8602
Kotak Corporate Bond Fund-Regular Plan Monthly Dividend
Record Date Cum Dividend NAV `/UnitJun-12-17 1056.6880 Individual/ HUF: 7.3393 Others: 6.7997May-12-17 1051.8646 Individual/ HUF: 3.8555 Others: 3.5721Apr-12-17 1054.0380 Individual/ HUF: 5.4253 Others: 5.0265
Kotak Corporate Bond Fund-Regular Quarterly DividendRecord Date Cum Dividend NAV `/Unit
Jun-20-17 1070.4266 Individual/ HUF: 15.9660 Others: 14.7922Mar-20-17 1062.9423 Individual/ HUF: 11.1398 Others: 10.3208Dec-20-16 1070.3117 Individual/ HUF: 17.6919 Others: 16.3912
Kotak Gilt Investment Regular Plan-Quarterly DividendRecord Date Cum Dividend NAV `/Unit
Jun-20-17 13.5005 Individual/ HUF: 0.2132 Others: 0.1976Mar-20-17 12.7811 Individual/ HUF: 0.0754 Others: 0.0699Dec-20-16 13.7660 Individual/ HUF: 0.4694 Others: 0.4349
Kotak Gilt Investment PF and Trust Plan- Quarterly Dividend
Record Date Cum Dividend NAV `/UnitJun-20-17 12.0690 Individual/ HUF: 0.1906 Others: 0.1766Mar-20-17 11.4258 Individual/ HUF: 0.0673 Others: 0.0624Dec-20-16 12.3073 Individual/ HUF: 0.4205 Others: 0.3895
Kotak Banking and PSU Debt Fund-Monthly DividendRecord Date Cum Dividend NAV `/Unit
Jun-12-17 10.7300 Individual/ HUF: 0.1001 Others: 0.0928May-12-17 10.6514 Individual/ HUF: 0.0434 Others: 0.0402Apr-12-17 10.7026 Individual/ HUF: 0.0803 Others: 0.0744
Kotak-Bond Regular Plan- Quarterly Dividend OptionRecord Date Cum Dividend NAV `/Unit
Jun-20-17 11.1699 Individual/ HUF: 0.1876 Others: 0.1738Mar-20-17 10.7213 Individual/ HUF: 0.0721 Others: 0.0668Dec-20-16 11.3996 Individual/ HUF: 0.3079 Others: 0.2853
DEBT Schemes
Kotak Banking and PSU Debt Fund-Annual DividendRecord Date Cum Dividend NAV `/Unit
Mar-15-17 16.8762 Individual/ HUF: 1.0169 Others: 0.9421Mar-14-16 16.6687 Individual/ HUF: 0.8840 Others: 0.8190Mar-20-15 16.7914 Individual/ HUF: 0.9986 Others: 0.9261

5658
Debt Schemes
Kotak Multi Asset Allocation Fund-Annual DividendRecord Date Cum Dividend NAV `/Unit
Mar-15-17 12.4159 Individual/ HUF: 0.8339 Others: 0.7726Mar-13-16 11.4291 Individual/ HUF: 0.1276 Others: 0.1182Mar-20-15 12.0308 Individual/ HUF: 0.6000 Others: 0.5564
Debt Schemes
Kotak Multi Asset Allocation Fund-Monthly DividendRecord Date Cum Dividend NAV `/Unit
Oct-13-16 13.3724 Individual/ HUF: 0.0505 Others: 0.0468Jun-12-15 11.8504 Individual/ HUF: 0.0288 Others: 0.0267Apr-13-15 12.2623 Individual/ HUF: 0.0612 Others: 0.0567
Kotak Medium Term Fund-Quarterly DividendRecord Date Cum Dividend NAV `/Unit
Jun-20-17 10.8122 Individual/ HUF: 0.0505 Others: 0.0468Mar-20-17 10.5845 Individual/ HUF: 0.0505 Others: 0.0468Dec-20-16 10.6838 Individual/ HUF: 0.1487 Others: 0.1378
Kotak Medium Term Fund-Annual DividendRecord Date Cum Dividend NAV `/Unit
Mar-15-17 11.2826 Individual/ HUF: 0.6428 Others: 0.5956Mar-14-16 11.0913 Individual/ HUF: 0.6217 Others: 0.5760
Kotak Multi Asset Allocation Fund-Quarterly DividendRecord Date Cum Dividend NAV `/Unit
Jun-20-17 12.5111 Individual/ HUF: 0.1632 Others: 0.1512Mar-20-17 12.2925 Individual/ HUF: 0.1180 Others: 0.1094Dec-20-16 12.1481 Individual/ HUF: 0.1220 Others: 0.1130
Kotak Low Duration Fund-Regular Plan Monthly DividendRecord Date Cum Dividend NAV `/Unit
Jun-12-17 1024.9588 Individual/ HUF: 5.1778 Others: 4.7971May-12-17 1023.402 Individual/ HUF: 4.0534 Others: 3.7554Apr-12-17 1025.1986 Individual/ HUF: 5.3510 Others: 4.9576

How to read Fact Sheet
For details contact us at:KOTAK MAHINDRA ASSET MANAGEMENT COMPANY LIMITED: 6th Floor, Kotak Infiniti, Building No. 21, Infinity Park, Off Western Express Highway, Gen. A. K. Vaidya Marg, Malad (East), Mumbai � 400 097. Tel.: 91-22-66056825 Fax: 91-22-6638 4455 E-mail: [email protected] . Corporate Office of Website: assetmanagement.kotak.comAsset Management Company: 2nd Floor, 12-BKC, Plot No C-12, G Block, BKC, Bandra (East),Mumbai - 400 051
Agra: 0562-4009647Ahmedabad: 079-26779888/ 26766077Ajmer: 0145-2628881Aligarh: 0571-6453223Allahabad: 0532-6456177Ambala: 0171-6451570/71Amritsar: 0183-6575777/ 6576777Anand: 02692-650281Aurangabad: 0240-6611189Bangalore: 080-66128050/ 51Bareilly: 0581-6452934Bhavnagar: 0278-2569511Bhilai: 0788-2225385Bhopal: 0755-6461018Bhubaneshwar: 0674-6510250/9583340099Bhuj: 02832-653976Calicut: 495-6576552Chandigarh: 0172-4671885/ 5049476Chennai: 044-28221333/ 45038171Cochin: 0484-6533110/ 4064646Coimbatore: 422-6572165Cuttack: 0671-6510166/ 9776000093Dehradun: 135-2742900/ 6453000Dhanbad: 0326-6450798/09709157970Durgapur: 0343-6456038/ 2544609Goa: 0832-6650490
Gorakpur: 0551-2204127Gurgaon: 0124-6464077Guwahati: 0361-2734784Hubli: 0836-6450140Hyderabad: 040-66178140/ 41/ 42Indore: 0731-6453390Jaipur:141-6503339/ 2373879Jalandhar: 0181-2233481Jalgaon: 0257-2237131/ 32Jammu: 0191-2470779Jamnagar: 0288-6540129Jamshedpur: 0657-2317041/6543474/9570000685Jodhpur: 0291-2630625Kanpur: 0512-6454641/ 2541017Kolhapur: 0231-6610390/ 91Kolkata: 033-22822411/ 12/ 13/ 14Kottayam: 0481-6452922Lucknow: 522-4021168/ 4021169Ludhiana: 0161-4646602/ 4646604Mangalore: 0824-6452006Meerut: 0121-4007753Mumbai: 022-66056825Mumbai: (Thane): 022-65970185/ 186Muradabad: 0591-6456667Mysore: 0821-6541192Nagpur: 0712-2425052/8577
Nashik: 253-6574255New Delhi: 011-66306900/ 02Panipat: 0180-2632062Patiala: 0175-6451766Patna: 0612-6451120Pondicherry: 9962029229Pune: 020-20251526/27/29Raipur: 0771-4270917Rajkot: 0281-6620735Ranchi: 0651-6454629/ 2332274/9709001533Rourkela: 0661-6450114/ 9776640098Salem: 0427-6450115Shimla: 0177-6451211/ 2807911Silliguri: 0353-2522012Surat: 0261-6450004/ 6536677Trichur: 0487-2430115Trichy: 0431-6460668Trivandrum: 0471-4470134Udaipur: 0294-6451094Vadodara: 0265-6533957/ 6560167Vapi: 260-6534863/ 260-6453920Varanasi: 0542-6456985Vijayawada: 0866-6459930Vishakapatnam: 0891-6452145
Contact Details
Mutual Fund investments are subject to market risks, read all scheme related documents carefully.*The rating indicates highest degree of safety regarding timely receipt of payments from the investments that the Scheme has made. The ratings should, however, not be construed as an indication of expected returns, prospective performance of the Mutual Fund Scheme, NAV or of volatility in its returns.Disclaimer on market outlooks:The outlook provided is only a subjective understanding of an uncertain market phenomena, which may or may not occur, and may also not have any effect on the performance of the scheme, clement or otherwise. This outlook should not be construed as a reason for investment into the scheme based on prospect of future performance, which may not accrue as anticipated by the statement.
RISK FACTORS
Fund ManagerAn employee of the asset management company such as mutual fund or life insurer, who manages investments of the scheme. He is usually part of larger team of fund managers and research analysts.Application amount for fresh subscriptionThis is the minimum investment amount for a new investor in a mutual fund schemeMinimum Additional AmountThis is the minimum investment amount for an existing investor in a mutual fund schemeYield to MaturityThe yield to maturity or the YTM is the rate of return anticipated on a bond if held until maturity. YTM is expressed as an annual rate. The YTM factors in the bond�s current market price, par value, couple interest rate and time to maturitySIPSIP or systematic investment plan works on the principle of making periodic investments of a fixed sum. It works similar to a recurring bank deposit. For instance, an investor may opt for an SIP that invests Rs 500 every 15th of the month in an equity fund for a period of three years.NAVThe NAV or net asset value is the total asset value per unit of the mutual fund after deducting all related and permissible expenses. The NAV is calculated at the end of every business day. It is the value at which investors enter or exit the mutual fundBenchmarkA group of securities , usually a market index, whose performance is used as a standard or benchmark to measure investment performance of mutual funds, among other investments. Some typical benchmark include the Nifty, Sensex, BSE 200, BSE 500, 10-year GsecEntry LoadA mutual fund may have a sales charge or load at the time of entry and/or exit to compensate the distributor /agent. Entry load is charged at the time an investor purchases the units of a mutual fund. The entry load is added to the prevailing NAV at the time of investment. For instance, if the NAV is Rs 100 and the entry load is 1%, the investor will enter the fund at Rs 101.Note: SEBI, vide circular dated June 30, 2009 has abolished entry load and mandated that the upfront commission to distributors will be paid by the investor directly to the distributor, based on his assessment of various factors including the service rendered by the distributor.Exit loadExit load is charged at the time an investor redeems the units of a mutual fund. The exit load is deducted from the prevailing NAV at the time of redemption. For instance, if the NAV is RS 100and an exit load is 1%, the redemption price would be Rs. 99 per unit Modified DurationModified duration is the price sensitivity and the percentage change in price for a unit change in yield.Standard deviationStandard deviation is statistical measure of the range of an investment�s performance. When a mutual fund has a high standard deviation, it means its range of performance is wide, implying greater volatility.Sharp RatioThe Sharpe Ratio, named after its founder the Noble laureate William Sharpe, is measure of risk-adjusted returns. It is calculated using standard deviation and excess return to determine reward per unit of risk.BetaBeta is a measure of an investment�s volatility vis-à-vis the market. Beta of less than 1 means that the security will be less volatile than the market. A beta of greater than 1 implies that the security�s price will be more volatile than the market.AUMAUM or assets under management refers to the recent / updated cumulative market value of investments managed by Mutual fund or any investment firm.HoldingsThe holdings or the portfolio is a mutual fund�s latest or updated reported statement of investments/securities. These are usually displayed in terms of percentage to net assets or the rupee value or both. The objective is to give investors an idea of where their money is being invested by the fund manager.Nature of SchemeThe investment objective and underlying investments determine the nature of the mutual fund scheme. For instance, a mutual fund that aims at generating capital appreciation by investing in stock markets is an equity fund or growth fund. Likewise, a mutual fund that aims at capital preservation by investing in debt markets is a debt fund or income fund. Each of these categories may have sub-categories.Rating ProfileMutual funds invest in securities after evaluating their credit worthiness as disclosed by the ratings. A depiction of the mutual fund in various investments based on their rating becomes the rating profile of the fund. Typically, this is a feature of debt funds.