june 3, 2011 the state of retailing online 2011: marketing...
TRANSCRIPT

Making Leaders Successful Every Day
June 3, 2011
The State Of Retailing Online 2011: Marketing, Social, And Mobileby Sucharita Mulpurufor eBusiness & Channel Strategy Professionals

© 2011 Forrester Research, Inc. All rights reserved. Forrester, Forrester Wave, RoleView, Technographics, TechRankings, and Total Economic Impact are trademarks of Forrester Research, Inc. All other trademarks are the property of their respective owners. Reproduction or sharing of this content in any form without prior written permission is strictly prohibited. To purchase reprints of this document, please email [email protected]. For additional reproduction and usage information, see Forrester’s Citation Policy located at www.forrester.com. Information is based on best available resources. Opinions reflect judgment at the time and are subject to change.
For eBusiness & Channel Strategy Professionals
ExECuTivE SuMMARyWhile eCommerce continues to grow and take market share from the physical retail channel, retailers also look to experiment with new approaches to their web businesses such as social commerce and mobile selling. Both of those tactics have generated only single digits in sales for most retailers but promise to capture more marketing dollars in the year to come as web retailers anticipate big gains from those channels in the coming months. Many retailers said they were planning to add custom stores on social networks and incorporate features like ratings and reviews onto their mobile sites.
TABlE OF COnTEnTSOnline Growth Accelerates For Multichannel Retailers
Social network Marketing Emerges As An Area Of investment in Spite Of little ROi
Mobile Strategies Expand To incorporate More Objectives
RECOMMEndATiOnS
Don’t Be Swept Up By The Hype Around Social And Even Mobile
Supplemental Material
nOTES & RESOuRCESThis report uses data from the “The State of Retailing Online,” an annual survey conducted by Forrester Research and executed in conjunction with Shop.org. Respondents include online retailers that transact with consumers by selling products via the internet.
Related Research Documents“Will Facebook Ever drive eCommerce?”April 7, 2011
“The State Of Retailing Online 2010: Key Metrics And Multichannel And Global Strategies”October 28, 2010
“The State Of Retailing Online 2010: Marketing, Social Commerce, And Mobile”July 29, 2010
June 3, 2011
The State Of Retailing Online 2011: Marketing, Social, And Mobileby Sucharita Mulpuruwith Ben Zeidler and doug Roberge
2
17
18

© 2011, Forrester Research, inc. Reproduction ProhibitedJune 3, 2011
The State Of Retailing Online 2011: Marketing, Social, And Mobile For eBusiness & Channel Strategy Professionals
2
OnlinE GROwTH AccElERATES FOR MUlTicHAnnEl RETAilERS
Forrester Research reported that annual web sales in 2010 totaled $176 billion, an 11% increase over the previous year. Our annual survey with web retailers conducted in partnership with Shop.org exhibited that multichannel retailers and manufacturers fared particularly well (see Figure 1). This growth points to the Web as an increasingly mainstream retail channel. As such, the Web is also a channel that demands retailers’ attention (and budget) as it expands sales in global markets and — via mobile devices — is increasingly integrated with the physical retail store.
Figure 1 year-Over-year Growth Of Web Retailers
Source: Forrester Research, Inc.58625
Percent increase in web sales in 2010 over 2009 by type of retailer
Source: “The State of Retailing Online 2011,” a Shop.org study conducted by Forrester Research*Young: less than four years in operation; medium: four to 10 years in operation; mature: more than 10 years inoperation
†Small: less than $10 million revenue; medium: $10 million to $100 million revenue; large: more than $100million revenue
‡ Multichannel includes brick and mortar, catalogs, television, and other channels.
40%
91%
36%
21%
45% 49%
25% 22%
33%
79%
All companies
Young*
Medium*
Mature*
Small†
Medium†
Large†
Pure-p
lay‡
Multichannel‡
Manufacturer‡
Web tenure Web revenue Channels of operationBase: 68 online retailers
Social network Marketing Emerges As An Area Of investment in Spite Of little ROi
Traditional marketing tactics continue to capture the lion’s share of marketing budgets (see Figure 2). More than half of marketing spend by web retailers is in fact for search and email, the online marketing workhorses. Customer acquisition tactics also remain largely the same as in years past, with search engine marketing and affiliates driving the most value for web retailers. However, this year social networks surfaced higher in the data than ever before as an investment area. This year:

© 2011, Forrester Research, inc. Reproduction Prohibited June 3, 2011
The State Of Retailing Online 2011: Marketing, Social, And Mobile For eBusiness & Channel Strategy Professionals
3
· Social networks crept higher on the customer acquisition list. While the most successful customer acquisition tactics hands down are in search and affiliate marketing, retailers employ a “long tail” of tactics overall. Several retailers surveyed discovered some success with social networks in the past year, a level similar to those that are able to drive new customers through email prospecting (see Figure 3-1). Social networks ranked fourth on the list of successful customer acquisition tactics for manufacturers selling direct to consumer in particular, indicating that this sector is able to leverage social networks to drive engagement with their brands and promote peer-to-peer sharing (see Figure 3-2).
· Social network spending will grow significantly. For years, search was regarded as the stalwart of the web marketing world; however, the growth of sites like Facebook and Twitter has encouraged retailers to shift areas of focus. This year, more retailers say they will increase their spend levels in social networks than increase paid search spending (see Figure 4). This evolution marks a highly speculative shift in interest from retailers, as search continues to deliver strong figures for them: Fully 53% of retailers surveyed said that paid search in 2010 was more effective than in 2009.1
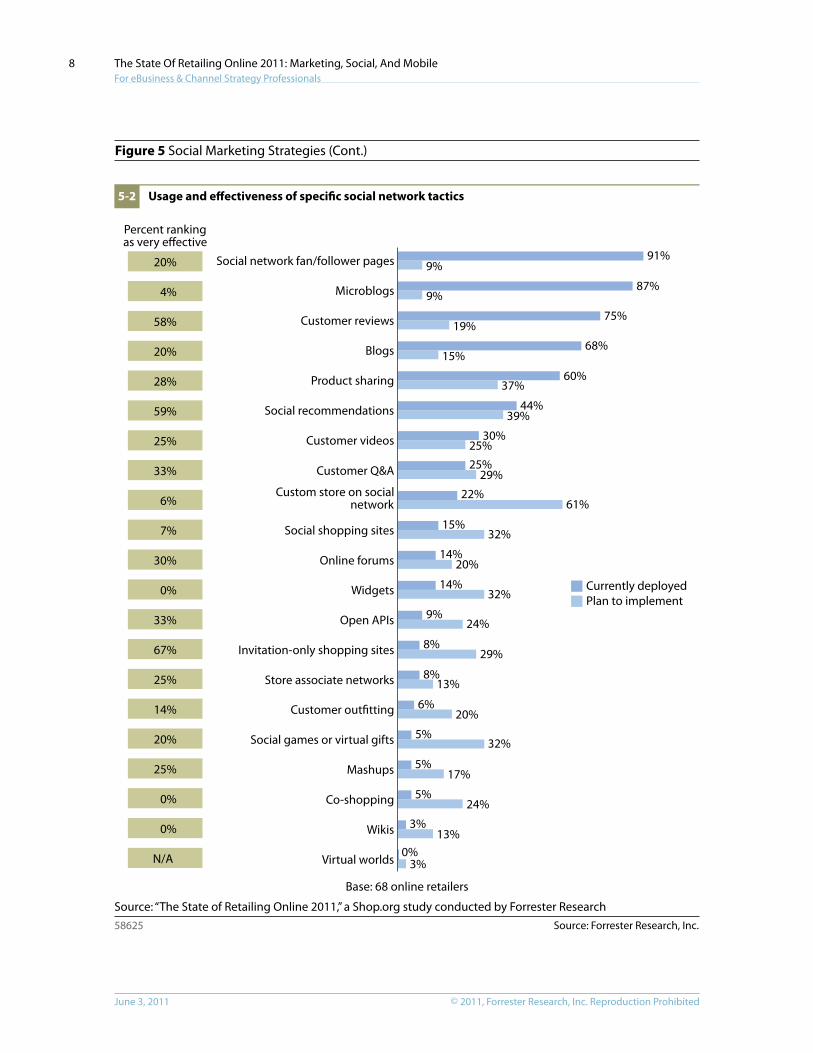
· Social network presence continues to underwhelm. Despite pinning their hopes for future growth on social networks, social activity continues to deliver little other than qualitative feedback for retailers. On average, retailers report that only a small single-digit percent of sales can be attributed to social media at this juncture. Close to two-thirds (62% and 61%, respectively) of retailers surveyed also note that the ROI associated with social is unclear and that the primary ROI is around listening (see Figure 5). When evaluating Facebook in particular, retailers overall rank the social network low relative to paid search, email, and affiliate marketing. Furthermore, the majority of these retailers feel that, while it delivers better on brand building and listening to customers, Facebook excels neither at acquiring new, nor retaining existing, customers (see Figure 6).
· Mobile marketing exhibits promise. While mobile is not prominent on the overall web marketing spend list, 16% of retailers do say that they plan to increase their mobile marketing spend in the coming year. Marketer focus on the channel, however, may be underrepresented as some mobile focus falls into search. In fact, 22% of retailers surveyed said that they had explicit mobile search efforts and that approximately 3% of their search budgets were dedicated to mobile search.2

© 2011, Forrester Research, inc. Reproduction ProhibitedJune 3, 2011
The State Of Retailing Online 2011: Marketing, Social, And Mobile For eBusiness & Channel Strategy Professionals
4
Figure 2 Marketing Budgets in 2010
Source: Forrester Research, Inc.58625
Total Pure-play Multichannel Manufacturer
Average budget $5.5 million $4.3 million $7.3 million $2.7 million
Paid search 37% 38% 41% 28%
Email (house and prospecting) 17% 12% 15% 26%
A�liate programs 13% 16% 12% 12%
SEO/natural search 9% 13% 8% 6%
Comparison shopping engines 5% 5% 5% 3%
Remarketing/behavioral targeting 5% 1% 6% 11%
Social network ads 3% 2% 4% 4%
Traditional portal deals 2% 3% 1% 1%
Other 9% 10% 8% 9%
Source: “The State of Retailing Online 2011,” a Shop.org study conducted by Forrester Research
Base: 68 online retailers

© 2011, Forrester Research, inc. Reproduction Prohibited June 3, 2011
The State Of Retailing Online 2011: Marketing, Social, And Mobile For eBusiness & Channel Strategy Professionals
5
Figure 3 Top Customer Acquisition Sources
Source: Forrester Research, Inc.58625
Source: “The State of Retailing Online 2011,” a Shop.org study conducted by Forrester Research
90%
49%
44%
18%
18%
10%
10%
7%
7%
4%
4%
3%
3%
3%
1%
1%
1%
Search engine marketing
A�liate marketing
Organic tra�c
Email prospecting
Social network presence
Direct mail
Sweepstakes
Remarketing
O�ine ads
Online marketplaces
Flash sales
Behavioral marketing
Text ads
Coregistrations
Blogs
Microblogs (e.g., Twitter)
Alternative payments
“Which of the following were your top three most effective sources used to acquire customersin 2010?“
3-1
3-2
Rank Pure-play Multichannel Manufacturer1 SEM SEM SEM2 Organic A�liate A�liate
3 A�liate Organic Organic
4 Email prospecting Comparison shopping engines Social network presence
Search engine marketing was the top acquisition tactic in 2010
Top acquisition sources by type of web retailer
Base: 68 online retailers
Base: 68 online retailers

© 2011, Forrester Research, inc. Reproduction ProhibitedJune 3, 2011
The State Of Retailing Online 2011: Marketing, Social, And Mobile For eBusiness & Channel Strategy Professionals
6
Figure 4 Areas Of increase in Marketing Spend
Source: Forrester Research, Inc.58625
Source: “The State of Retailing Online 2011,” a Shop.org study conducted by Forrester Research
75%
61%
72%
61%
61%
61%
36%
33%
22%
16%
13%
13%
12%
9%
“For which marketing tactics are you spending more in 2011 versus 2010?”
SEO/natural search
Social networks
Email to house �le
Paid search
Remarketing
A�liate networks
Behavioral targeting
Comparison shopping engines
Microblogs
Wireless/mobile
Text ads
Online marketplaces
Blogs and message boards
Traditional portal deals
Base: 67 online retailers

© 2011, Forrester Research, inc. Reproduction Prohibited June 3, 2011
The State Of Retailing Online 2011: Marketing, Social, And Mobile For eBusiness & Channel Strategy Professionals
7
Figure 5 Social Marketing Strategies
Source: Forrester Research, Inc.58625
Source: “The State of Retailing Online 2011,” a Shop.org study conducted by Forrester Research
19%
29%
34%
36%
37%
45%
52%
61%
62%
82%
We are pursuing a social marketing strategybecause our senior management
has pressured us to do so
Social marketing strategies have helpedto grow our business to date
We use a speci�c set of metrics by which tomeasure social marketing initiatives
We are pursuing social marketing strategiesbecause our competitors are
We are pursuing social marketing strategiesbecause it is inexpensive to do so
We are pursuing social marketing strategiesbecause there is tremendous buzz about them
We are pursuing social marketing strategiesbecause we do not want to be late movers
We see the primary ROI from socialmarketing as listening to and better
understanding our customers
The returns on social marketingstrategies are unclear
We are pursuing social marketing strategiesbecause this is a great time to experiment
and learn more about what they can do
“To what extent do you agree with the following statements?“(Respondents who selected [5] Strongly agree or [4] Agree on a �ve-point scale)
Attitudes toward social marketing5-1
Base: 68 online retailers
© 2011, Forrester Research, inc. Reproduction ProhibitedJune 3, 2011
The State Of Retailing Online 2011: Marketing, Social, And Mobile For eBusiness & Channel Strategy Professionals
8
Figure 5 Social Marketing Strategies (Cont.)
Source: Forrester Research, Inc.58625
Source: “The State of Retailing Online 2011,” a Shop.org study conducted by Forrester Research
Percent rankingas very effective
20%
4%
58%
20%
28%
59%
25%
33%
6%
7%
30%
0%
33%
67%
25%
14%
20%
25%
0%
0%
N/A
91%Social network fan/follower pages
Microblogs
Customer reviews
Blogs
Product sharing
Social recommendations
Customer videos
Customer Q&A
Custom store on socialnetwork
Social shopping sites
Online forums
Widgets
Open APIs
Invitation-only shopping sites
Store associate networks
Customer outfitting
Social games or virtual gifts
Mashups
Co-shopping
Wikis
Virtual worlds
9%
9%87%
75%
68%
60%
44%
30%25%
22%
15%
14%
14%
9%
8%
8%
6%
5%
5%
5%
3%
0%
19%
15%
37%
39%
25%29%
61%
32%
20%
32%
24%
29%
13%
20%
32%
17%
24%
13%
3%
Currently deployedPlan to implement
Usage and effectiveness of specific social network tactics5-2
Base: 68 online retailers

© 2011, Forrester Research, inc. Reproduction Prohibited June 3, 2011
The State Of Retailing Online 2011: Marketing, Social, And Mobile For eBusiness & Channel Strategy Professionals
9
Figure 5 Social Marketing Strategies (Cont.)
Source: Forrester Research, Inc.58625
Source: “The State of Retailing Online 2011,” a Shop.org study conducted by Forrester Research
“How are you measuring the effectiveness of social media initiatives that youhave implemented to date?”
94%
72%
69%
69%
62%
59%
49%
38%
35%
34%
34%
29%
21%
21%
18%
18%
Growth rate of followers
Click-throughs to the retail site
Total subscribers
Sales attributable to links on socialnetworks
Total visits to social tool
Unique visitors
Requested action taken
More than one review
Return visits
Time spent
Improved SEO
Number of forwards
Market research
In�uencers reached
Media buzz
Sentiment analysis
Measurement of social network tactics5-3
Base: 68 online retailers

© 2011, Forrester Research, inc. Reproduction ProhibitedJune 3, 2011
The State Of Retailing Online 2011: Marketing, Social, And Mobile For eBusiness & Channel Strategy Professionals
10
Figure 6 Facebook is used For Brand Building not driving ROi
Source: Forrester Research, Inc.58625
Source: “The State of Retailing Online 2011,” a Shop.org study conducted by Forrester Research
40%
37%
16%
6%
1%
Brand building
Listening to customers
New fans or likes
Lifetime value of existing customers
Customer acquisition
68% of retailerssurveyed said that ifFacebook went awaytomorrow, it wouldnot adversely affectweb sales in 2011.
“Please rank the following four marketing tactics in terms of return on investment for your company.”
Key benefits of Facebook6-1
Rank order of ROI of key marketing tactics6-2
Facebook metrics for web retailers6-3
Facebook’s impact on email marketing6-4
Rank Total Pure plays Multichannel Manufacturers
1 Email Email Email Affiliate
2 Paid search Paid search Paid search Email
3 Affiliate Affiliate Affiliate Paid search
4 Facebook Facebook Facebook Facebook
Measure/KPI Average
Percent of sales attributable to “social” 2%
Percent of site customers who are also Facebook fans 11%
Percent of email subscribers who are also Facebook fans 11%
65%
63%
53%
32%
7%
1%
We plan to maintain both Facebook and email
Facebook is not a substitute for email
Facebook is a complement to email
Facebook will not be a substitute for email
Facebook will be a substitute for emailin the next 12 to 24 months
Facebook is a good substitute for email
The top metric formeasuring Facebookis the growth of fans/likes.
Base: 68 online retailers
Base: 67 online retailers
Base: 68 online retailers, 49 online retailers, 47 online retailers, respectively
Base: 68 online retailers
“In your experience to date, Facebook delivers better on:”(Please select one)
“Please indicate which statements below you agree with regarding Facebook as a substitute for email:” (Select all that apply)
© 2011, Forrester Research, inc. Reproduction Prohibited June 3, 2011
The State Of Retailing Online 2011: Marketing, Social, And Mobile For eBusiness & Channel Strategy Professionals
11
Mobile Strategies Expand To incorporate More Objectives
In “The State of Retailing Online 2011” study, we incorporate tablet investments and metrics in our discussion around mobile. As the number of households with smartphones and tablets has continued to grow in the past 12 months, retailers have also expanded their offerings to shoppers in these channels. Progress on numerous fronts is palpable: While a double-digit percent of retailers surveyed in last year’s survey said that they did not have a mobile strategy at all, progress can be measured by the fact that fewer than one in 10 responded the same this year (see Figure 7). Increasingly, web teams have come to own the mobile channel in many cases and are often turning to outside partners to develop products quickly across multiple devices and browsers. While mobile is well poised to be executed well, many challenges continue to exist.
· Many retailers still have not optimized their mobile presence. The availability of mobile-optimized web presences continues to wane in the retail world. While more retailers claim to have a mobile strategy in place, many simply have shrunk their existing sites on smartphones. Fully 44% of retailers surveyed said that they had nothing special about their mobile sites (see Figure 8).
· There is little differentiation in objectives for smartphones versus tablets. In spite of very different experiences that have the ability to serve shoppers in different states, retailers appear to want both devices to achieve all objectives to equal degree, versus defining distinct objectives that leverage the advantages of each. Whereas smartphones are best for real-time offers that supplement in-store experiences, tablets are able to enrich the brand experience in a consumer’s home, often substituting time away from a PC or laptop. In fact, the only difference in objectives is related to in-store usage of tablets for store associates, which is higher than for smartphones (see Figure 9-1).
· Retailers are saddling mobile platforms with traditional web-centric goals and features. Most retailers agreed on a key priority for their mobile efforts: revenue and sales (see Figure 9-2). Indeed, mobile functionality currently offered reflects largely “traditional” web-centric features such as product information, ratings and reviews, store locator info, and payment options, as well as sales alerts and coupons. With some exceptions, planned functionality enhancements center largely on much the same. However, in separate research with consumers, shoppers cite that usability and form factor issues are significant inhibitors to the mobile shopping experience. To date, in-store functionality such as in-store product availability, checkout, store maps/layouts, 2D bar codes, real-time coupons for shoppers who are already in the store, and in-store navigation have had little investment (see Figure 9-3). Even though some investment is planned for several of these features, it appears that the majority of retailers will not be investing here and thereby will miss the opportunity for palpable ROI for their mobile channels.
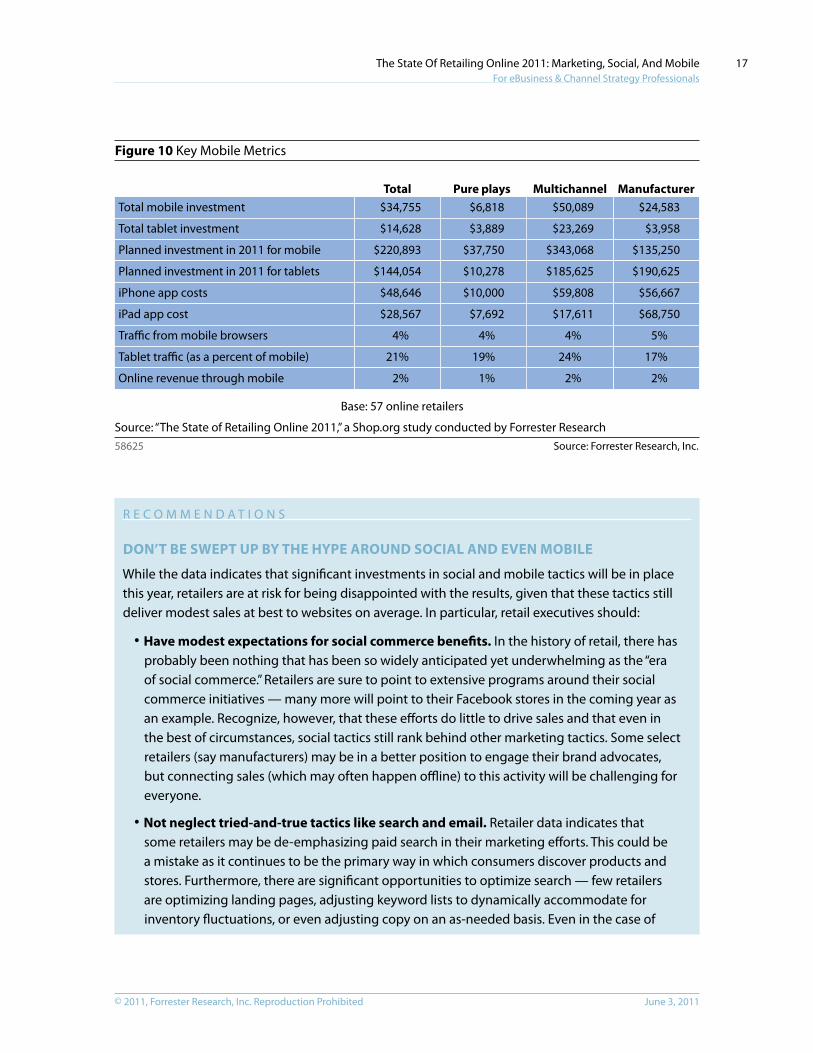
· Mobile retail metrics are mixed. One of the key arguments to invest in mobile programs in the past was that significant traffic was coming to retail websites even though sites were not optimized for the experience. In the past year, even with greater investment, the overall average

© 2011, Forrester Research, inc. Reproduction ProhibitedJune 3, 2011
The State Of Retailing Online 2011: Marketing, Social, And Mobile For eBusiness & Channel Strategy Professionals
12
metrics of traffic and revenue to sites from smartphones has not increased significantly (see Figure 10). Investment levels in fact may be altogether inadequate. Investments in mobile banking, for instance (where some banks now report 50% of their traffic even though mobile traffic to bank sites also experienced very slow adoption curves in the earlier part of the last decade), now measure millions of dollars annually for the most successful players. For the time being, select retailers like Amazon.com and eBay are likely to be the primary recipients of mobile shopping traffic because of the ease of use of their sites and simple purchasing capabilities.
Figure 7 development Process For Retailers’ Mobile Strategy
Source: Forrester Research, Inc.58625
Source: “The State of Retailing Online 2011,” a Shop.org study conducted by Forrester Research
“Which of the following best describes your mobile strategy today?”
“Who owns mobile strategy and management within your organization?”
Mobile strategy stage7-1
Owners of mobile strategy7-2
9%
34%
9%
19%
29%Have a strategy, implemented it,now re�ning it
Don’t have a strategy
Early stage; developing a strategy
Have a strategy
Have a strategy and starting work
More mature
Less mature
Web/eCommerceteam42%
Marketing/CMO24%
President or otherdivision head
18%
No one . . . yet9%
Other7%
44% of surveyrespondentshave one ormore employeesdedicated tomobile e�orts.
Base: 68 online retailers
Base: 67 online retailers

© 2011, Forrester Research, inc. Reproduction Prohibited June 3, 2011
The State Of Retailing Online 2011: Marketing, Social, And Mobile For eBusiness & Channel Strategy Professionals
13
Figure 7 development Process For Retailers’ Mobile Strategy (Cont.)
Source: Forrester Research, Inc.58625
Source: “The State of Retailing Online 2011,” a Shop.org study conducted by Forrester Research
“How did your company build its mobile site?”
Support for mobile development7-3
5%
5%
22%
25%
28%
Licensed a platform and built within-house resources
Outsourced to an interactive agency
Internally with our own developers
Outsourced to our eCommerce platform vendor
Opted for a mobile website service(e.g., UsableNet, Digby)
Base: 60 online retailers
Figure 8 Overall Mobile Presence
Source: Forrester Research, Inc.58625
Source: “The State of Retailing Online 2011,” a Shop.org study conducted by Forrester Research
“Which of the following best describe your mobile eCommerce?”
48%
44%
35%
15%
15%
13%
6%
5%
A special site optimized for mobile browsers
Nothing special; our site unoptimized
iPhone app
Android app
iPad
SMS
BlackBerry app
Third-party partnership (e.g., Cellfire)
Base: 62 online retailers

© 2011, Forrester Research, inc. Reproduction ProhibitedJune 3, 2011
The State Of Retailing Online 2011: Marketing, Social, And Mobile For eBusiness & Channel Strategy Professionals
14
Figure 9 Smartphones And Tablets Aim To drive Customers To Websites And Physical Stores
Source: Forrester Research, Inc.58625
Source: “The State of Retailing Online 2011,” a Shop.org study conducted by Forrester Research
“What are your company’s objectives for mobile?”
82%
63%
63%
62%
58%
54%
49%
49%
43%
37%
31%
28%
23%
14%
6%
87%
65%
65%
61%
57%
56%
46%
48%
41%
35%
22%
26%
19%
30%
6%
Drive revenue/sales to website
Improve customer satisfaction
Develop brand loyalty
Be a ready source of product andprice information for customers
Improve customer acquisition
Improve customer retention
Drive tra�c/sales in other channels(e.g., stores)
Keep up with competitors
Learn from and/or pilot mobile programs
Drive sign-ups/registrations
Location-based targeting
Real-time marketing
Drive 1:1 dialogue with customers
Provide store associates with toolsto improve selling
Reduce operations or marketing costs
SmartphonesTablets
Base: 65 online retailers
Objectives for smartphones and tablets9-1

© 2011, Forrester Research, inc. Reproduction Prohibited June 3, 2011
The State Of Retailing Online 2011: Marketing, Social, And Mobile For eBusiness & Channel Strategy Professionals
15
Figure 9 Smartphones And Tablets Aim To drive Customers To Websites And Physical Stores (Cont.)
Source: Forrester Research, Inc.58625
80%
75%
54%
32%
20%
20%
20%
14%
8%
Mobile site traffic
Revenue transacted directly via mobile devices
Average order value
Number of mobile app downloads
Product searches via mobile devices
Number of customers who have opted in for SMSalerts, coupons, daily deals, etc.
Repeat visits/logins
Mobile site/app satisfaction
Number of pickup alerts sent to mobile devices(e.g., for in-store pickup of orders placed online)
Source: “The State of Retailing Online 2011,” a Shop.org study conducted by Forrester ResearchBase: 59 online retailers
Mobile key performance indicators9-2
“Which KPIs/metrics do you use to measure the success/progress of your mobile strategy and business?” (Select all that apply)

© 2011, Forrester Research, inc. Reproduction ProhibitedJune 3, 2011
The State Of Retailing Online 2011: Marketing, Social, And Mobile For eBusiness & Channel Strategy Professionals
16
Figure 9 Smartphones And Tablets Aim To drive Customers To Websites And Physical Stores (Cont.)
Source: Forrester Research, Inc.58625Source: “The State of Retailing Online 2011,” a Shop.org study conducted by Forrester Research
Currently o�erPlan to o�er
“What kind of information and alerts does your company currently offer customers viaits mobile app/site?”
54%
42%
34%
27%
21%
21%
21%
18%
18%
16%
15%
14%
14%
10%
10%
8%
7%
7%
4%
4%
2%
2%
36%
26%
50%
38%
44%
43%
28%
18%
24%
44%
12%
36%
31%
25%
36%
24%
17%
9%
29%
24%
15%
2%
21%
Product information
Store information (e.g., hours, directions)
Customer ratings and reviews
Easy payment options
Alerts for online specials or sales
Coupons
Scanning a QR code
User manuals or other productinformation and instructions
Storing a shopping list
Shipping noti�cation
Price comparison information
In-store events
In-store product availability
Expert reviews
Checkout
The ability to access the loyalty programwhile shopping in a store
Alerts for in-store events, specials, or sales
Store maps/layouts
The ability to access gift registries forfriends and family members
2D bar code
Real-time coupons while customersare shopping in a store
In-store navigation (e.g., help�nding products in a store)
Sharing a shopping list
Base: 56 online retailers
Mobile features and functionality9-3
© 2011, Forrester Research, inc. Reproduction Prohibited June 3, 2011
The State Of Retailing Online 2011: Marketing, Social, And Mobile For eBusiness & Channel Strategy Professionals
17
Figure 10 Key Mobile Metrics
Source: Forrester Research, Inc.58625
Source: “The State of Retailing Online 2011,” a Shop.org study conducted by Forrester Research
Total Pure plays Multichannel ManufacturerTotal mobile investment $34,755 $6,818 $50,089 $24,583
Total tablet investment $14,628 $3,889 $23,269 $3,958
Planned investment in 2011 for mobile $220,893 $37,750 $343,068 $135,250
Planned investment in 2011 for tablets $144,054 $10,278 $185,625 $190,625
iPhone app costs $48,646 $10,000 $59,808 $56,667
iPad app cost $28,567 $7,692 $17,611 $68,750
Tra�c from mobile browsers 4% 4% 4% 5%
Tablet tra�c (as a percent of mobile) 21% 19% 24% 17%
Online revenue through mobile 2% 1% 2% 2%
Base: 57 online retailers
R E C O M M E n d A T i O n S
DOn’T BE SwEpT Up By THE HypE AROUnD SOciAl AnD EvEn MOBilE
While the data indicates that significant investments in social and mobile tactics will be in place this year, retailers are at risk for being disappointed with the results, given that these tactics still deliver modest sales at best to websites on average. in particular, retail executives should:
· Have modest expectations for social commerce benefits. in the history of retail, there has probably been nothing that has been so widely anticipated yet underwhelming as the “era of social commerce.” Retailers are sure to point to extensive programs around their social commerce initiatives — many more will point to their Facebook stores in the coming year as an example. Recognize, however, that these efforts do little to drive sales and that even in the best of circumstances, social tactics still rank behind other marketing tactics. Some select retailers (say manufacturers) may be in a better position to engage their brand advocates, but connecting sales (which may often happen offline) to this activity will be challenging for everyone.
· not neglect tried-and-true tactics like search and email. Retailer data indicates that some retailers may be de-emphasizing paid search in their marketing efforts. This could be a mistake as it continues to be the primary way in which consumers discover products and stores. Furthermore, there are significant opportunities to optimize search — few retailers are optimizing landing pages, adjusting keyword lists to dynamically accommodate for inventory fluctuations, or even adjusting copy on an as-needed basis. Even in the case of

© 2011, Forrester Research, inc. Reproduction ProhibitedJune 3, 2011
The State Of Retailing Online 2011: Marketing, Social, And Mobile For eBusiness & Channel Strategy Professionals
18
email, retailers still are continuing to batch and blast, particularly around the holidays when they need to customize their messages the most.
· Realize mobile matters more for some categories now than others. Mobile traffic has not taken significant share from overall PC/laptop-based web traffic to retail sites. However, retailers anecdotally report that some categories, particularly those with higher-ticket, higher-consideration goods are most vulnerable to the mobile influence, primarily because consumers price-compare in stores to ensure they are getting the best deal possible. While consumers may not be extensively exploring product information yet, basic store information, transparent pricing, and easy checkout capabilities are likely to be the most pressing opportunities for most sites in the near term. Multichannel retailers in particular should recognize that they need a twofold objective with their smartphone presences: enabling sales, but also serving store shoppers.
· Have different strategies for tablets and smartphones. While few retailers have expressed significant differences in their tablet and smartphone strategies, the two devices are extremely varied in their usage and benefits. To this end, retailers who view tablets as brand-building tools will be well served while retailers need to view their smartphone execution as one that needs to be extremely utilitarian. look to Forrester’s POST (people, objectives, strategy, technology) method as a framework to develop a defensible answer to whether a site requires a phone or tablet app or simply a mobile-optimized site experience. By distinguishing more clearly the specific business objectives for each device, retailers should be able to more clearly set development priorities, budgets, and metrics to evaluate the progress for each platform independently.
SUpplEMEnTAl MATERiAl
Methodology
The “State of Retailing Online” (SORO) annual survey is conducted by Forrester Research and executed in conjunction with Shop.org. Respondents include online retailers that transact with consumers by selling products via the Internet. The annual SORO survey is conducted in two waves. The first wave was fielded in March 2011 and included questions pertaining to online marketing and merchandising, social media budget and priorities, and mobile strategy and investment. The second wave will be conducted in June 2011.
For the first wave, we received 68 complete and partial responses across a variety of industries, including apparel, footwear, general merchandise, home furnishings, and personal care. In this report, web-based retailers generated the majority of their 2010 revenue through the online channel (including mobile), while store-based retailers generated the majority of their 2010 revenue through stores/wholesale. Fifty-three percent of participating companies were multichannel retailers, while 25% were web-based retailers and 22% manufacturers selling direct to consumer. Twenty-eight percent of the respondents generated more than $100 million in direct sales from their web channels in 2010, while 54% of respondents have been selling online for more than 10 years.

© 2011, Forrester Research, inc. Reproduction Prohibited June 3, 2011
The State Of Retailing Online 2011: Marketing, Social, And Mobile For eBusiness & Channel Strategy Professionals
19
EnDnOTES1 Source: “The State of Retailing Online 2011,” a Shop.org study conducted by Forrester Research.
2 Source: “The State of Retailing Online 2011,” a Shop.org study conducted by Forrester Research.

Forrester Research, Inc. (Nasdaq: FORR)
is an independent research company
that provides pragmatic and forward-
thinking advice to global leaders in
business and technology. Forrester
works with professionals in 19 key roles
at major companies providing
proprietary research, customer insight,
consulting, events, and peer-to-peer
executive programs. For more than 27
years, Forrester has been making IT,
marketing, and technology industry
leaders successful every day. For more
information, visit www.forrester.com.
Headquarters
Forrester Research, Inc.
400 Technology Square
Cambridge, MA 02139 USA
Tel: +1 617.613.6000
Fax: +1 617.613.5000
Email: [email protected]
Nasdaq symbol: FORR
www.forrester.com
M a k i n g l e a d e r s S u c c e s s f u l E v e r y d a y
58625
For information on hard-copy or electronic reprints, please contact Client Support
at +1 866.367.7378, +1 617.613.5730, or [email protected].
We offer quantity discounts and special pricing for academic and nonprofit institutions.
For a complete list of worldwide locationsvisit www.forrester.com/about.
Research and Sales Offices
Forrester has research centers and sales offices in more than 27 cities
internationally, including Amsterdam; Cambridge, Mass.; Dallas; Dubai;
Foster City, Calif.; Frankfurt; London; Madrid; Sydney; Tel Aviv; and Toronto.