july 2014 nhs choices satisfaction survey
TRANSCRIPT
Customer Insight Public Information 1
Customer Satisfaction Survey Wave 9, July/August 2014
NHS Choices Customer Insight

Customer Insight Public Information 2
Contents
1. Introduction
• Purpose of survey
• Sample and methodology
2. Headline messages
3. How do NHS Choices users get online?
4. Who is using NHS Choices?
• Profile of personal users
• Profile of professional users
5. How is NHS Choices used?
• Reasons for visiting
• Frequency of visit
• Channels used to access
NHS Choices
6. To what extent does NHS Choices meet user needs?
• Do users get what they want
from the site
• Search
• Rating the user experience
7. How likely are users to be satisfied with their visit to NHS Choices + recommend it and use it again?
8. What other online health and app resources do users access?

Customer Insight Public Information 3
Introduction

Customer Insight Public Information 4
Introduction
• This report gives the findings from the 9th wave of the NHSC
customer satisfaction survey. The findings are based data collected
over three mini-survey waves between 21st July and 17th August
2014
• The purpose of the survey is to:
• Track user satisfaction and advocacy over time
• Understand who is using the NHS Choices site
• Establish their main reasons for visiting the site
• Understand whether users found what they were looking for
• Identify what improvements are needed to enhance the site
• As well as covering satisfaction with, and use of the site, the survey
also covers:
• Internet usage including health websites used
• Mobile health app usage

Customer Insight Public Information 5
Sample and Methodology
Type of survey Online pop-up survey on selected pages of the NHS Choices website
Methodology Online self completion survey
Fieldwork dates 21st – 25th July, 4th – 10th August, 12th – 17th August 2014
Sample Total sample completes n=4,674, Personal users n=4,225 Professional users n=449
Sample distribution General public – all responding users of NHS Choices
Previous research
conducted
Previous waves of the customer satisfaction survey have been conducted as follows:
- Wave 1: Nov 2008 (Ipsos MORI)
- Wave 2: July 2010
- Wave 3: Nov/Dec 2010
- Wave 4: Apr 2011
- Wave 5: Dec 2011
- Wave 6: Jul/Aug 2012
- Wave 7: May 2013
- Wave 8: Dec 2013/Jan 2014
- Wave 9: Jul/Aug 2014
Other information Users completed the survey via a pop-up invitation hosted on the 40 most commonly
visited website pages
Where percentage results do not sum to 100%, this is due to computer rounding or
questions that permit multiple responses
The base sizes denote all respondents to each question/statement unless stated
Wave 1 of the survey was delivered by Ipsos MORI in November 2009. The survey content
changed after wave 1 to reflect COI requirements on how Government websites should
collect and measure user feedback. This means the results from survey wave 1 are not
directly comparable with subsequent waves.

Customer Insight Public Information 6
URLS from which the survey was launched (1)
Top 40 most popular URLs used as survey invite pages
Base: all respondents n =4,674
Participants joining survey
from each page
% Number
/symptomcheckers/pages/symptoms.aspx 18% 850
/Search/Pages/Results.aspx 18% 831
/Pages/HomePage.aspx 10% 455
/medicine-guides/pages/MedicineOverview.aspx 9% 419
/Services/GP/Overview/DefaultView.aspx 6% 286
/NHSEngland/Healthcareabroad/EHIC/Pages/about-the-ehic.aspx 4% 187
/Conditions/Pages/hub.aspx 3% 152
/Services/hospitals/Overview/DefaultView.aspx 3% 147
/medicine-guides/pages/MedicineSideEffects.aspx 3% 141
/Services/GP/ReviewsAndRatings/DefaultView.aspx 3% 122
/Services/dentists/Overview/DefaultView.aspx 2% 106
/Services/hospitals/ReviewsAndRatings/DefaultView.aspx 2% 101
/medicine-guides/pages/selectorshow.aspx 2% 93
/Services/Hospitals/Services/Service/DefaultView.aspx 1% 69
/services/hospitals/services/defaultview.aspx 1% 65
/Services/GP/Staff/DefaultView.aspx 1% 65
/Service-Search 1% 64
/Services/GP/MapsAndDirections/DefaultView.aspx 1% 61
/Conditions/Bites-insect/Pages/Symptoms.aspx 1% 55
/conditions/stomach-ache-abdominal-pain/Pages/Introduction.aspx 1% 50
/Services/hospitals/MapsAndDirections/DefaultView.aspx 1% 45

Customer Insight Public Information 7
Top 40 most popular URLs used as survey invite pages
Base: all respondents n =4,674
Participants joining survey
from each page
% Number
/Services/dentists/MapsAndDirections/DefaultView.aspx 1% 37
/conditions/urinary-tract-infection-adults/Pages/Introduction.aspx 1% 33
/Livewell/healthy-living/Pages/height-weight-chart.aspx 1% 32
/Livewell/tiredness-and-fatigue/Pages/medical-causes-of-tiredness.aspx 1% 31
/conditions/chickenpox/Pages/Introduction.aspx 1% 25
/conditions/crohns-disease/Pages/Introduction.aspx * 19
/Services/pharmacies/Overview/DefaultView.aspx * 19
/Conditions/Hay-fever/Pages/Symptoms.aspx * 16
/conditions/lumps-swellings/Pages/Introduction.aspx * 15
/Conditions/vaginal-discharge/Pages/Introduction.aspx * 11
/conditions/pregnancy-and-baby/pages/pregnancy-weeks-4-5-6-7-8.aspx * 11
/conditions/pregnancy-and-baby/pages/foods-to-avoid-pregnant.aspx * 7
/Conditions/Hay-fever/Pages/treatment.aspx * 7
/conditions/pregnancy-and-baby/pages/signs-and-symptoms-pregnancy.aspx * 4
/Tools/Pages/Healthyweightcalculator.aspx - -
/conditions/pregnancy-and-baby/pages/due-date-calculator.aspx - -
/Conditions/Pages/BodyMap.aspx - -
/Service-Search/GP/LocationSearch/4 - -
/Service-Search/UrgentCare/UrgentCareFinder - -
Unrecorded URL 1% 43
URLS from which the survey was launched (2)

Customer Insight Public Information 8
Headline messages

Customer Insight Public Information 9
There is a lot that users like about NHS Choices,
and the majority (over two in three) are satisfied with
their visit
“Easy to use and good
as a first port of call for
symptoms”
“Easy to navigate and uses
simple and straightforward
language.”
“Layout of website is clear
and easy to navigate.”
“Authoritative site I can
trust information from.”

Customer Insight Public Information 10
But…

Customer Insight Public Information 11
1 Visit satisfaction, likelihood to recommend and
likelihood to use again have all declined
Visit satisfaction = 68% (vs 76% in April 11)
Likelihood to recommend = 73% (vs 83% in July 10)
Likelihood to use again = 84% (vs 90% in April 11)
Visit satisfaction = % Very satisfied/satisfied / Likelihood to recommend = % Definitely/probably / Likelihood to use again = % Definitely/probably

Customer Insight Public Information 12
Users are also less positive about the NHS Choices
user experience – particularly information accuracy 2
Ease of using the site = 81% (vs 88% in April 11)
Attractiveness of design = 73% (vs 80% in April 11)
Ease of finding information/services = 72% (vs 79% in April 11)
Info that was clear and easy to understand = 78% (vs 85% in April 11)
Accurate and up-to-date information = 64% (vs 76% in April 11)
All user experience indicators = % Very good/good

Customer Insight Public Information 13
There has been a significant fall in the proportion
who say they used the main on-site search 3
49% of July/Aug 14 respondents used on-site search vs…
52% of Dec 13/Jan 14 respondents;
54% of May 13 respondents; and
58% of Aug 12 respondents
Customer Insight Public Information 14
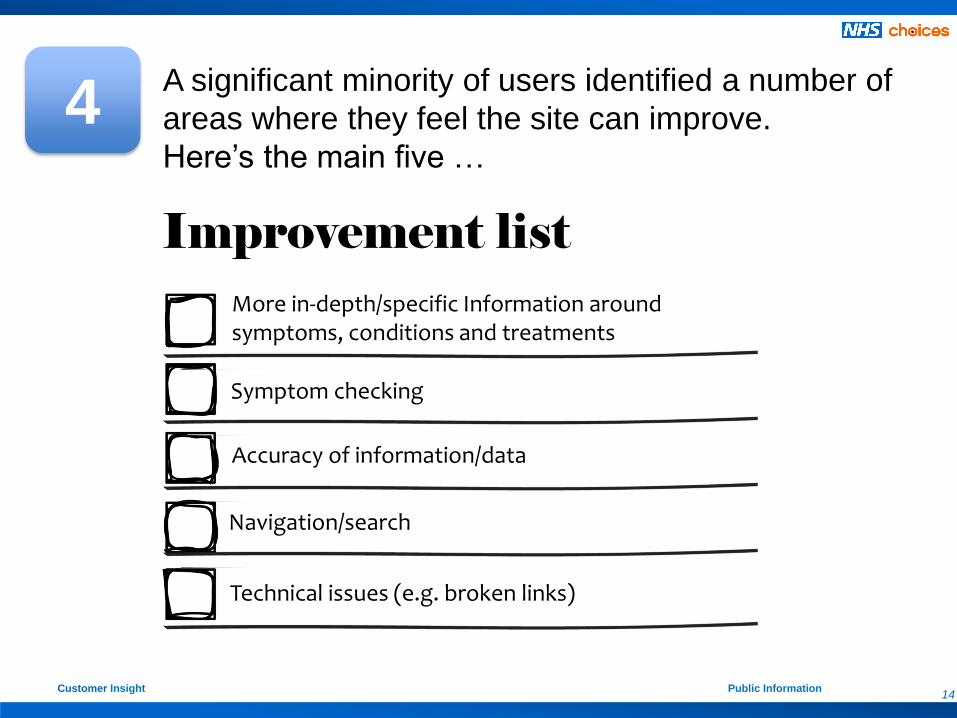
4 A significant minority of users identified a number of
areas where they feel the site can improve.
Here’s the main five …
More in-depth/specific Information around symptoms, conditions and treatments
Symptom checking
Accuracy of information/data
Navigation/search
Technical issues (e.g. broken links)
Improvement list

Customer Insight Public Information 15
5 If we’re not addressing these areas already then
we need to start now…it takes a while for site
changes to impact on user opinion, and we can
expect to see further KPI decline in the short-term

Customer Insight Public Information 16
Survey findings

Customer Insight Public Information 17
Understanding this report
Statistically significant % increase
Statistically significant % decrease
Significant differences between the latest survey wave (Jul/Aug 2013)
and the previous waves are highlighted throughout this report:
Base sizes are noted at each question, and for each wave of research
‘Single code’ questions permit a single response
Where percentage results do not sum to 100% this is due to computer
rounding or questions that permit multiple responses
‘Multicode’ questions permit one or more responses

Customer Insight Public Information 18
How do NHS Choices users
get online?

Customer Insight Public Information 19
Q. Where are you using the internet today?
Home
81% 10% 6% 1%
SINGLE CODE
Base: all responding personal users = 4,225
Base: all respondents personal users = 4,225
1%
1%
1%
1%
2%
9%
85%
Don’t know
About once a fortnight
About once a month
< once a month
About once a week
Every two or three days
Every day
Q. How often do you use the internet for personal use (i.e. not as part of your job?)
SINGLE CODE
1%
2%
5%
40%
41%
56%
63%
Other device not…
An internet-enabled TV
Another kind of mobile…
A mobile…
A tablet (e.g. iPad)
A desktop PC
A laptop/netbook
Q. Which of the following devices have you ever used to look up online health and social care information?
Base: all respondents = 4,674
MULTICODE
The majority use the internet at home, go online every day +
access via laptop/desktop (a sig. minority use mobile/tab)
Work On my mobile Friend/relative's house

Customer Insight Public Information 20
63%
56%
41% 40%
5% 2% 1% 0%
10%
20%
30%
40%
50%
60%
70%
80%
90%
100%
Dec-11(Base:3,352)
Jul/Aug 2012(Base:2,166)
May 13(Base:3,147)
Dec 13/Jan14
(Base:2,604)
Jul/Aug 14(Base:4,674)
A laptop/netbook
A desktop PC
A tablet (e.g. iPad)
A mobile phone/smartphone
Another kind of mobile device(e.g. iPod touch, PSP)
An internet-enabled TV
Other device not mentionedabove (please specify)
Q. Which of the following devices have you ever used to look up online health and
social care information?
MULTICODE
Laptop/desktop usage is declining (but these are still most
commonly used), while mobile/tablet usage is increasing

Customer Insight Public Information 21
Who is using NHS Choices?

Customer Insight Public Information 22
Personal use
90%
Professional use
10% Personal use
For myself 75%
For a member of family (adult) 10%
For a member of family (child) 4%
For a friend 2%
Professional use
As a health professional
(e.g. checking ratings for surgery/the local area,
to get information for my patient)
5%
Other professional use
(e.g. journalists research, teaching)
4%
As a professional looking for someone
else as part of my job
(e.g. librarian, local authority)
1%
Q. Were you mainly using the site for yourself, for someone else, or professionally today?
Personal users account for nine in every ten visitors
Base: all respondents = 4,674
SINGLE CODE

Customer Insight Public Information 23
26% - 1% 1% 1%
2% 2% 2% 3% 3% 3% 3%
5% 5% 5% 6%
9% 11% 11%
Other
School nurse
Health visitor
Health trainer
Medical student
Practice nurse
Midwife
Student nurse
Specialist nurse working in primary care
Community/district nurse
Pharmacist
Hospital-based doctor/consultant
GP
Hospital-based administrator
NHS management (e.g. PCT manager)
Practice manager
Hospital-based nurse
Other allied health professional
Medical receptionist/secretary / administrator
Allied health professionals, medical administrators and
hospital-based nurses are the top 3 professional user-types
Q. What is your job role? (Profile of healthcare professionals)
Base: all health professional users = 606
SINGLE CODE

Customer Insight Public Information 24
The majority of personal users are female and aged 25-64,
while significant minority are care providers & NHS workers
Gender Age
Care provider
Carer for family
member
26%
Carer for
friend/neighbour
4%
Profile of personal users (Note: customer satisfaction survey respondents are self-selecting, so the profile of site users recorded in NHS Choices omnibus research from January 2014 should be considered a truer reflection of the site’s user base. However, the profile of users recorded by this survey is broadly in-line with the omnibus research, so can be used for sub-group analysis)
3%
3%
10%
20%
21%
15%
15%
7%
5%
2%
Prefer not to answer
75+
65-74
55-64
45-54
35-44
25-34
20-24
16-19
15 and under
Base: all responding personal users = 4,225
Base: all responding personal users = 4,225 Base: all responding personal users = 4,225
24% (38% in NHSC nat rep
omnibus, Jan 14)
72% (62 % in NHSC nat
rep omnibus, Jan 14)
29%
66%
Connection with the NHS
Base: all responding personal users = 4,225
45%
57%
Yes – personally
work for NHS
9%
Yes – friends work 16%
Yes – members of
my family work
20% MULTICODE
MULTICODE
SINGLE CODE SINGLE CODE
SINGLE CODE SINGLE CODE (NO), MULTICODE (YES)

Customer Insight Public Information 25
17%
1%
1%
2%
4%
5%
7%
8%
15%
17%
20%
26%
37%
Other
Problems due to learning difficulties
Problems using a mouse
Cannot walk at all/use a wheelchair
Difficulty in speaking or communicating
Poor vision, partial sight or blindness
Poor hearing
Prefer not to say
Problems due to mental health…
Have difficulty managing stairs
Breathlessness/chest pains
Cannot walk very far
My condition does not limit my daily…
Yes 41%
No 52%
Prefer not to say 3%
Don't know 4%
41% of personal users have a LTC, and this is most likely
to affect their mobility, breathing &/or mental health
Long-term illness Impact of illness
Base: all responding personal users = 4,225 Base: all responding personal users with a long term condition = 1,724
Q. Do you have long-standing illness, disability or infirmity, for example, diabetes, asthma or heart disease that requires you to have regular medical care or check-ups?
Q. How, if at all, does this illness, disability or infirmity limit your activities?
SINGLE CODE MULTICODE
Customer Insight Public Information 26
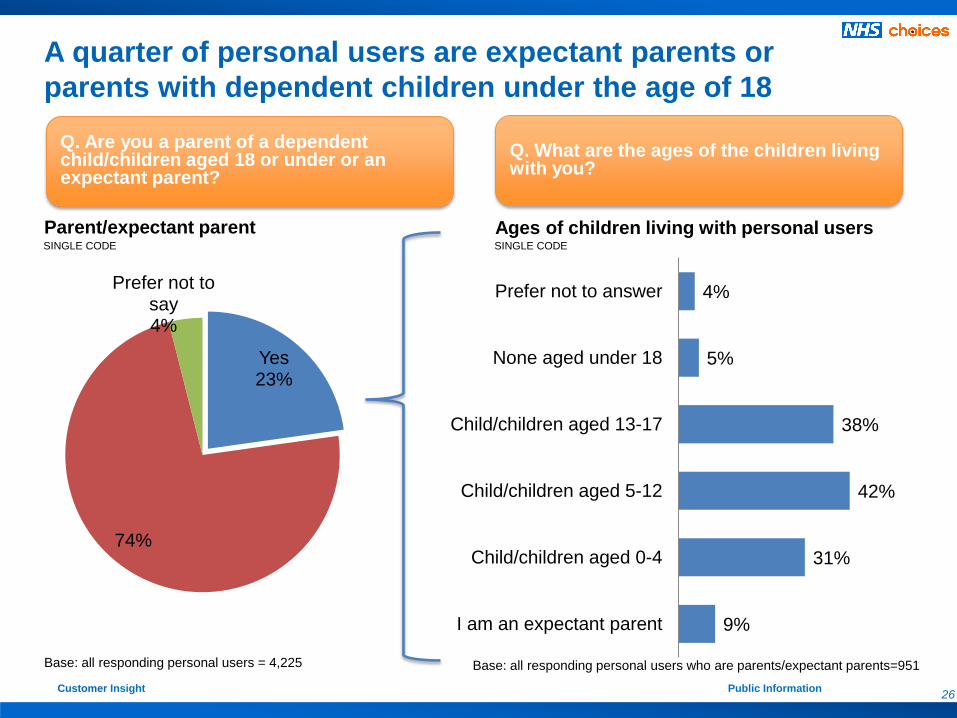
Yes 23%
74%
Prefer not to say 4%
A quarter of personal users are expectant parents or
parents with dependent children under the age of 18
Parent/expectant parent Ages of children living with personal users
Base: all responding personal users who are parents/expectant parents=951 Base: all responding personal users = 4,225
9%
31%
42%
38%
5%
4%
I am an expectant parent
Child/children aged 0-4
Child/children aged 5-12
Child/children aged 13-17
None aged under 18
Prefer not to answer
Q. Are you a parent of a dependent child/children aged 18 or under or an expectant parent?
Q. What are the ages of the children living with you?
SINGLE CODE SINGLE CODE

Customer Insight Public Information 27
Female users are more likely to be younger, have kids & visit
frequently, vs. men who tend to be older and first time visitors
Profile of personal users (demographic crossbreaks)
TOTAL
(N = 4,225)
Male
(1,018)
Female
(3,055)
24 and
under
(577)
25 –
54
(2,136)
55+
(1,378)
LTC –
Yes
(1,723)
LTC –
No
(2,207)
Child aged
18/under
(951)
No child
aged 18/
under (3,114)
Male 24% 13% 19% 38% 28% 22% 17% 27%
Female 72% 85% 79% 61% 70% 76% 81% 72%
24 and under 14% 7% 16% 9% 17% 5% 17%
25-54 51% 40% 55% 46% 56% 89% 40%
55+ 33% 52% 27% 44% 26% 6% 42%
LTC – Yes 41% 47% 39% 26% 37% 55% 32% 45%
LTC – No 52% 48% 55% 64% 58% 41% 64% 50%
Child aged 18/under 23% 16% 25% 8% 40% 4% 18% 27%
No child aged 18/under 74% 82% 73% 91% 59% 95% 80% 71%
At least monthly user 35% 23% 34% 52% 32% 20% 32% 30% 34% 30%
Less than monthly user 44% 46% 47% 36% 49% 47% 46% 48% 48% 46%
First time user 18% 27% 15% 8% 15% 28% 18% 19% 14% 20%
Care provider* 29% 28% 29% 22% 28% 35% 35% 25% 29% 29%
Not a care provider* 66% 67% 67% 73% 69% 62% 62% 72% 67% 68%
Works for NHS 9% 4% 11% 4% 13% 7% 9% 10% 11% 9%
Doesn’t work for NHS 89% 94% 89% 91% 88% 93% 91% 90% 90% 91%
How to read: find the column (female), read down (16%)
and then across (24 and under). This tells us 16% of
female users are aged 24 and under
* Please refer to dataset for base sizes

Customer Insight Public Information 28
Carers are more likely than non-carers to have an LTC,
while NHS workers visit more often than non-NHS workers
Profile of personal users (demographic crossbreaks)
TOTAL
(N = 4,225)
Monthly
user
(1,294)
Less than
monthly user
(1,974)
First time
user
(777)
Care
provider
(1,214)
Not a care
provider
(2,787)
Works for
NHS (393)
Doesn’t work
for NHS
(3,780)
Male 24% 18% 24% 36% 24% 25% 10% 25%
Female 72% 80% 73% 59% 74% 74% 87% 72%
24 and under 14% 23% 10% 6% 10% 15% 6% 14%
25-54 51% 53% 53% 40% 49% 53% 68% 50%
55+ 33% 22% 33% 49% 39% 30% 23% 34%
LTC – Yes 41% 42% 40% 39% 49% 39% 39% 42%
LTC – No 52% 52% 53% 53% 46% 57% 58% 52%
Child aged 18/under 23% 25% 23% 17% 23% 23% 25% 23%
No child aged 18/under 74% 72% 73% 78% 75% 76% 71% 75%
At least monthly user 35% 32% 31% 41% 30%
Less than monthly user 44% 45% 48% 42% 47%
First time user 18% 19% 18% 13% 19%
Care provider* 29% 30% 28% 30% 36% 29%
Not a care provider* 66% 66% 67% 64% 61% 67%
Works for NHS 9% 13% 8% 7% 12% 9%
Doesn’t work for NHS 89% 88% 91% 90% 89% 91%
How to read: find the column (care provider), read down
(49%) and then across (LTC – Yes). This tells us 49% of
care providers have a Long Term Condition
* Please refer to dataset for base sizes

Customer Insight Public Information 29
How is NHS Choices used?

Customer Insight Public Information 30
Most users are visiting to obtain medical info, check
symptoms and find info about health services
Q. Why did you come to the site today? (Top 3 reasons)
1. For medical
information
2. To check symptoms 3. For information
about health services e.g. GPs, hospitals, opticians…
40% 32% 19%
MULTICODE
Base: all respondents = 4,674
e.g illnesses/ treatment...

Customer Insight Public Information 31
10%
0
1%
1%
1%
1%
1%
1%
2%
2%
2%
2%
3%
3%
4%
4%
5%
6%
6%
8%
12%
19%
32%
40%
10%
1%
1%
1%
2%
1%
2%
4%
4%
2%
3%
3%
5%
6%
3%
3%
9%
8%
12%
16%
22%
32%
45%
Other
For information about social care services…
To find out which vaccines I, or a family member…
To sign up to the information service for parents
To book a hospital appointment
For information about stop smoking or alcohol
Information on travel vaccinations/immunisations…
Job search/career information
Research for a course or assignment
Pregnancy advice/guidance
To post a comment about an NHS service…
Information for carers of people with a disability/LTC
To help me choose/compare hospitals or other…
To look at health news
Out of curiosity /to see what’s new
To help me choose which GP practice to join
EU health insurance information/E111/EHIC
To view comments posted by other users…
To help me choose between different treatment…
For information about a healthy lifestyle…
To help better manage an existing condition for…
For information about health services…
To check symptoms
For medical information e.g. illnesses/treatment…
Dec 13/Jan 2014
Jul/Aug 2014
However, there has been a fall in the proportion of users
visiting for medical and health service information
-5%
Base: all respondents: Jul/Aug 2014 n=4,674, Dec 2013/Jan 2014 n=2,612
Q. Why did you come to the site today?
-4%
-4%
= Significant increase/decrease
in comparison to Dec 13/Jan 14
MULTICODE
-3%
-3%

Customer Insight Public Information 32
Professional and personal users have differing needs
Q. Why did you come to the site today?
23% 2%
2%
2%
2%
3%
3%
3%
16%
3%
5%
6%
6%
3%
4%
9%
4%
8%
10%
3%
12%
41%
6%
31%
9%
1%
1%
2%
1%
1%
2%
1%
3%
1%
1%
1%
4%
5%
2%
7%
4%
6%
13%
8%
17%
34%
41%
Other
To sign up to the information service for parents
To find out which vaccines I, or a family member…
To book a hospital appointment
To post a comment about an NHS service…
For information about stop smoking or alcohol
Information on travel vaccinations/immunisations…
Pregnancy advice/guidance
Research for a course or assignment
To help me choose/compare hospitals or other…
For information about social care services…
Information for carers of people with a disability/LTC
Job search/career information
To help me choose which GP practice to join
EU health insurance information/E111/EHIC
To look at health news
To help me choose between different treatment…
Out of curiosity /to see what’s new
To view comments posted by other users…
To help better manage an existing condition…
For information about a healthy lifestyle…
For information about health services…
To check symptoms
For medical information e.g. illnesses/treatment or to…
Personal users
Professional users
* *
* * *
* *
*
* *
*
Base: all responding personal users n= 4,225, all responding professional users n= 449 *
*
= Significant difference between
personal & professional users *
MULTICODE

Customer Insight Public Information 33
20%
32%
52%
34%
23%
73%
31%
35%
38%
47%
49%
36%
47%
46%
15%
47%
44%
41%
28%
15%
8%
15%
27%
10%
18%
18%
17%
4%
4%
4%
4%
4%
3%
4%
4%
4%
At least monthly user Less than monthly First time user Don't know
Dec 2013 n=2,604
Q. How often have you used the NHS Choices website in the last 12 months?
Jul/Aug 2014 n=4,674
Overall by wave
By user (Jul/Aug 14)
Professional n=449
Personal n=4,225
Professional users/those aged <24 are over twice as likely to
visit monthly compared to personal users/those aged 55+
-3%
Base: all responding users (as stated)
SINGLE CODE
Female n=3,055
Male n=1,018
24 and under n =577
55+ n=1,378
25-54 n=2,136

Customer Insight Public Information 34
The majority of users access NHS Choices via a search engine,
while a minority type the address or bookmark
Q. How did you get to NHS Choices today?
Base: all respondents n= 4,674, personal users n= 4,225, all responding professional users n= 449
4%
*
4%
2%
14%
10%
66%
2%
*
1%
3%
3%
10%
81%
2%
*
1%
3%
4%
10%
80%
Other
Via a link from Facebook/Twitter/other socialnetworking site
Link from an email
Link from a website (which one?)
Address bookmarked/favourite
Typed in the address
Via Google or another search engine
All
Personal users
Professional users
SINGLE CODE

Customer Insight Public Information 35
Does NHS Choices meet user needs?

Customer Insight Public Information 36
Three in five got most/everything they wanted from their visit –
but a significant minority (18%) ‘got none of what they wanted’
39%
36%
45%
38%
40%
41%
41%
39%
26%
25%
22%
25%
23%
24%
23%
23%
22%
23%
21%
23%
21%
20%
21%
20%
13%
15%
12%
14%
16%
16%
15%
18%
Got everything I wanted Got most of what I wanted Got some of what I wanted Got none of what I wanted
65%
64%
62%
63%
Q. Did you get what you wanted from the NHS Choices website?
64%
May 2013 ( n=3,147)
Aug 2012 (n=2,452)
Dec 2013 (n=2,609)
Jul 2014 (n=4,674
Dec 2011 (n=4,047)
Apr 2011 (n=2,011)
67%
Jul 2010 (n=2,052)
65%
Base: all responding users (as stated)
Nov 2010 (n=1,534)
61%
SINGLE CODE

Customer Insight Public Information 37
Information, help, support – general 25% (n =619)
Information on treatments/side effects/management of conditions 13% (n=326)
“There is zero information on my condition, extrinsic allergic alveolitis.”
“More details on the uses of the medication Deflazacor”
“Under what conditions haemorrhoids develop.”
Information on symptoms 9% (n=216)
“Found the symptom checker goes off on a subject not related to my symptoms”
“Using the symptom checker, after the 'mental health' section there were only 4 options - none of which
were applicable.”
“Symptom checker advised me to call 999 but gave no reason why”
Information not specific enough 8% (n=201)
“I was hoping for more information on the subject (non-diabetic hypoglycemia)”
“More info specific to breastfeeding.”
“More detailed information regarding complaints procedure”
Base: all responding personal users who didn’t get everything they wanted from NHS Choices n=2,476
Q. What couldn’t you find that you were expecting to? (top categories) OPEN ENDED
‘No info/enough detail’ was the most cited issue among those
who couldn’t get what they wanted from NHS Choices

Customer Insight Public Information 38
GP information – general 8% (n=186)
“I wanted some information on how I access tests results, do I ask my GP ?”
“Help as to when or if to visit a GP”
Accurate service information – general 4% (n=104)
“Some of the entries seem out of date, so I am hoping that they are still accepting new patients”
Pain – general 4% (n=91)
“It did not say what I can do in the meantime to make the pain better or prevent further injury”
Answers – general 4% (n=90)
Contact details 3% (n=85)
Hospital/A&E – general 3% (n=79)
Dentists – general 3% (n=62)
Patient feedback/reviews 2% (n=48)
Appointment booking information - general 2% (n=52)
Q. What couldn’t you find that you were expecting to? (other categories) OPEN ENDED
Base: all responding personal users who didn’t get everything they wanted from NHS Choices n=2,476
A minority of users also couldn’t find general GP info,
accurate service info or info relating to pain

Customer Insight Public Information 39
Q. Please rate the NHS Choices site for the following aspects (% rated very good/good)
There has been a perceived decline in the user experience
over the last three years – particularly on info accuracy
SINGLE CODE FOR EACH STATEMENT
Ease of
use
81% 73% 72% 78% 64%
88% 80% 79% 85% 76%
Attractive-
ness of
design
Ease of
finding info
Info that is
clear/ easy to
understand
Accurate/
up to date
info
Apr
2011
Jul/Aug
2014
NHS Choices customer satisfaction survey: April 2011 base = 2,011 responding users, Jul/Aug 2014 base = 4,674
-7% -7% -7% -7% -12%

Customer Insight Public Information 40
Eight in ten users (81%) say the site’s ‘ease of use’ is good –
women, those aged 24< and monthly visitors are most positive
86% 84% 88%
84% 85% 84% 84%
81%
4% 7% 4%
5% 6% 6% 6% 7%
9% 9% 8% 11% 9% 9% 10% 10%
0%
10%
20%
30%
40%
50%
60%
70%
80%
90%
100%
Jul 10(n=2052)
Nov/Dec10
(n=1534)
Apr 11(n=2011)
Dec 11(n=4047)
Jul/Aug12
(n=2452)
May 13(n=3147)
Dec13/Jan
14(n=2606)
Jul/Aug2014
(n=4674)
Very good/good Neither/nor Poor/very poor Don't know
Base all respondents (as stated)
Ease of use Q. Please rate the NHS Choices site for the following aspects
SINGLE CODE
%Very
good/good Base
Male 75% 1,018
Female 86% 3,055
24 and under 93% 577
25-54 84% 2,136
55+ 76% 1,378
LTC – Yes 83% 1,723
LTC – No 83% 2,207
Child aged 18/
under - Yes 85% 951
Child aged 18/
under – No 82% 3,114
At least monthly
user 90% 1,621
Less than
monthly user 80% 2,040
First time user 72% 820
Personal users 82% 4,225
Professionals 79% 449

Customer Insight Public Information 41
80% 78% 80% 76%
78% 77% 75% 73%
16% 15%
15% 18% 16% 17% 19% 20%
3% 6% 3% 4% 5% 5% 5% 6%
0%
10%
20%
30%
40%
50%
60%
70%
80%
90%
100%
Jul 10(n=2052)
Nov/Dec10
(n=1534)
Apr 11(n=2011)
Dec 11(n=4047)
Jul/Aug12
(n=2452)
May 13(n=3147)
Dec13/Jan
14(n=2604)
Jul/Aug2014
(n=4674)
Very good/good Neither/nor Poor/very poor Don't know
Base all respondents (as stated)
SINGLE CODE
Attractiveness of design/appearance Q. Please rate the NHS Choices site for the following aspects
Over seven in ten users (73%) say the site’s
‘attractiveness of design/appearance’ is good
%Very
good/good Base
Male 67% 1,018
Female 75% 3,055
24 and under 81% 577
25-54 75% 2,136
55+ 67% 1,378
LTC – Yes 73% 1,723
LTC – No 74% 2,207
Child aged18/
under - Yes 76% 951
Child aged18/
under – No 72% 3,114
At least monthly
user 82% 1,621
Less than
monthly user 69% 2,040
First time user 63% 820
Personal users 72% 4,225
Professionals 70% 449

Customer Insight Public Information 42
76% 74%
79% 75% 76% 76% 75%
72%
14% 13%
13% 15% 13% 13% 14%
15%
10% 12% 9% 11% 10% 11% 12%
0%
10%
20%
30%
40%
50%
60%
70%
80%
90%
100%
Jul 10(n=2052)
Nov/Dec10
(n=1534)
Apr 11(n=2011)
Dec 11(n=4047)
Jul/Aug12
(n=2452)
May 13(n=3147)
Dec13/Jan
14(n=2605)
Jul/Aug2014
(n=4674)
Very good/good Neither/nor Poor/very poor Don't know
Base all respondents (as stated)
SINGLE CODE
9%
Ease of finding information/services Q. Please rate the NHS Choices site for the following aspects
Over seven in ten (72%) say the site is good in terms
of ‘ease of finding information/services’
%Very
good/good Base
Male 65% 1,018
Female 76% 3,055
24 and under 83% 577
25-54 75% 2,136
55+ 67% 1,378
LTC – Yes 73% 1,723
LTC – No 74% 2,207
Child aged 18/
under - Yes 75% 951
Child aged 18/
under – No 73% 3,114
At least monthly
user 82% 1,621
Less than
monthly user 69% 2,040
First time user 61% 820
Personal users 72% 4,225
Professionals 68% 449

Customer Insight Public Information 43
84% 83% 85% 80%
82% 80% 81% 78%
10% 8%
9% 11% 9% 11% 11%
12%
5% 7%
6% 6% 8% 8% 7% 8%
0%
10%
20%
30%
40%
50%
60%
70%
80%
90%
100%
Jul 10(n=2052)
Nov/Dec10
(n=1534)
Apr 11(n=2011)
Dec 11(n=4047)
Jul/Aug12
(n=2452)
May 13(n=3147)
Dec13/Jan
14(n=2602)
Jul/Aug2014
(n=4674)
Very good/good Neither/nor Poor/very poor Don't know
Base all respondents (as stated)
SINGLE CODE
Information that was clear and easy to understand Q. Please rate the NHS Choices site for the following aspects
Approaching eight in ten users (78%) say the site is good
in terms of ‘information that was clear and easy to understand’
%Very
good/good Base
Male 71% 1,018
Female 82% 3,055
24 and under 89% 577
25-54 81% 2,136
55+ 71% 1,378
LTC – Yes 77% 1,723
LTC – No 80% 2,207
Child aged 18/
under - Yes 80% 951
Child aged 18/
under – No 78% 3,114
At least monthly
user 88% 1,621
Less than
monthly user 75% 2,040
First time user 67% 820
Personal users 78% 4,225
Professionals 80% 449

Customer Insight Public Information 44
74% 73% 76%
67% 68%
68% 66% 64%
12% 11% 11%
14% 11% 13% 14% 14%
5% 8% 6%
11% 10% 9% 9% 10%
9% 8% 11% 11% 12%
0%
10%
20%
30%
40%
50%
60%
70%
80%
90%
100%
Jul 10(n=2052)
Nov/Dec10
(n=1534)
Apr 11(n=2011)
Dec 11(n=4047)
Jul/Aug12
(n=2452)
May 13(n=3147)
Dec13/Jan
14(n=2605)
Jul/Aug2014
(n=4674)
Very good/good Neither/nor Poor/very poor Don't know
Base all respondents (as stated)
SINGLE CODE
9% 10% 11%
Accurate and up-to-date information Q. Please rate the NHS Choices site for the following aspects
Fewer than two in three users (64%) say the site is good
in terms of ‘accurate and up-to-date information’
%Very
good/good Base
Male 55% 1,018
Female 68% 3,055
24 and under 80% 577
25-54 67% 2,136
55+ 54% 1,378
LTC – Yes 63% 1,723
LTC – No 67% 2,207
Child aged 18/
under - Yes 69% 951
Child aged 18/
under – No 63% 3,114
At least monthly
user 76% 1,621
Less than
monthly user 60% 2,040
First time user 52% 820
Personal users 63% 4,225
Professionals 66% 449

Customer Insight Public Information 45
Users were shown the main NHS Choices search box and asked whether or
not that had used it during their visit…
Search
The users were also shown the ‘find services’ search page and search box
from the home page, and asked whether or not that had used these features…

Customer Insight Public Information 46
78% 73% 75% 75% 75% 72%
11% 12% 12% 12% 12% 13%
8% 8%
11% 12% 12% 13% 2% 7%
0%
10%
20%
30%
40%
50%
60%
70%
80%
90%
100%
Apr 11(n=962)
Dec 11(n=1275)
Jul/Aug 12(n=1431)
May 13(n=1689)
Dec 13/Jan14
(n=1352)
Jul/Aug2014
(n=2277)
Very good/good Neither good nor poor Poor/very poor DK
Base all respondents who have used the NHS Choices search function (as stated)
Half say they have used the on-site search – a decline of
13% points since the April 2011 survey
SINGLE CODE
Q. Please rate the usefulness of the NHS Choices search function
Used on-site search -13% points since Nov/Dec 2010
Base: all respondents: 4,674
49% %Very
good/good Base
Male 61% 475
Female 76% 1,497
24 and under 86% 231
25-54 73% 1,003
55+ 67% 744
LTC – Yes 73% 912
LTC – No 73% 981
Child aged 18/
under - Yes 76% 326
Child aged18/
under – No 72% 1,103
At least monthly
user 81% 824
Less than
monthly user 69% 990
First time user 59% 376
Personal users 71% 2,044
Professionals 74% 233

Customer Insight Public Information 47
43%
16%
15%
13%
7%
6%
5%
2%
2%
1%
1%
1%
16%
GP
Hospital
Dentist
Walk-in centre
A&E
Mental health services
Pharmacy
Sexual health services
Support for carers
Optician
Maternity unit
Social care services*
Other
Very satisfied/
satisfied with
service info found
One in five use the ‘find services’ search, of which 69% say it
is easy to find services & 65% are satisfied with the info
Base: all those responding and who used search to
find a services Jul/Aug 2014 n=884
Q. Which service(s) were you looking for?
Base: all those responding user who were dissatisfied with the find a
services information they found, Jul/Aug 2014 n=182
Q. Why do you say that? (Reasons for dissatisfaction with service info found)
69% 65%
Very easy/easy to find
the service(s) using
search function
Jul/Aug 2014
Total % of respondents identifying a
reason for dissatisfaction 22% (n=182)
Difficulty finding info 42% (n=77)
Accuracy/reliability of info 21% (n=39)
Patient reviews/comments (validity) 7% (n=13)
Amount of information 4% (n=4)
Booking appointment information 3% (n=6)
Service info not clear/understandable 3% (n=6)
Used ‘find
services’
search
19%
MULTICODE
Base: all those responding and who used search to find a service = 884
Base: all those responding and who used search = 884
Base: all respondents: 4,674

Customer Insight Public Information 48
How likely are users to be
satisfied with their visit to
NHS Choices + recommend it
and use it again?

Customer Insight Public Information 49
74% 73% 76%
72% 70% 71% 71% 68%
12% 12% 13%
15% 12% 13% 14%
15%
11% 14% 10% 12% 16% 15% 14% 16%
0%
10%
20%
30%
40%
50%
60%
70%
80%
90%
100%
July 2010(n=2052)
Nov 2010(n=1534)
April2011
(n=2011)
Dec 2011(n=4047)
Aug 2012(n=2452)
May2013
(n=3147)
Dec 2013(n=2603)
Jul/Aug2014
(n=4674)
Very satisfied/satisfied Neither/nor Dissatisfied/very dissatisfied Don’t know
Overall satisfaction with the NHS Choices visit declined
8% points between April 2011 and July/Aug 2014
Q. Overall, how satisfied were you with your visit today?
Base all respondents (as stated)
SINGLE CODE
%Very
good/good Base
Male 62% 1,018
Female 70% 3,055
24 and under 76% 577
25-54 69% 2,136
55+ 62% 1,378
LTC – Yes 68% 1,723
LTC – No 69% 2,207
Child aged 18/
under - Yes 68% 951
Child aged18/
under – No 68% 3,114
At least monthly
user 80% 1,621
Less than
monthly user 63% 2,040
First time user 58% 820
Personal user 67% 4,225
Professional 73% 449

Customer Insight Public Information 50
Couldn’t find the required information on symptoms
condition/treatment/services/etc 38% (n=284)
“The site and search was useless, I still have no idea where to go for my appointment.”
“Terrible graphics, information not available, all designed by geeks not users.”
“I did not find any kind of possible causes to my condition and did not need information on pain relief.”
“Could not find the information about surgeons.”
Amount of information 15% (n=114)
“Expected more detailed info for symptoms and treatments.”
“Expected more information, tips, practical ideas other than 'speak to your GP' when it is difficult to get
a GP appointment.”
“C-section information stated what happens but did not give enough information of how it feels to the
mother or what she should expect afterwards.”
Accuracy/reliability 14% (n=105)
“Not up to date information i.e. Doctors listed that no longer work there.”
“Out of date ratings and frankly uninformed and random comments from ignorant contributors.”
“I found the articles and information inaccurate and biased.”
Q. What specifically made you dissatisfied with your visit today? (top 3 categories) OPEN ENDED
Base: all responding personal users who were dissatisfied with their visit to NHS Choices n=756
Visit dissatisfaction is mainly due to problems finding info on
symptoms/conditions/treatment + amount & accuracy of info

Customer Insight Public Information 51
Technical issues – broken links 11% (n=86)
“Somehow, the webpage expired when working my way through the symptom checker.”
“Broken links to EHIC application”
Ease of use 4% (n=32)
“Using the symptoms checker is so difficult.”
“Poor layout, not intuitive/user friendly.”
Appointment bookings 3% (n=25)
“Still no way of making an appointment.”
“Not being able to book an appointment online having been led to believe I could, so it was pretty much
a waste of time and could have phoned the helpline directly.”
EHIC 3% (n=24)
“Link to get EHIC / E111 NOT working in peak holiday time!”
Patient reviews/comments 3% (n=22)
“Seeing the horrible comments which patients make about GP surgeries.”
Base: all responding personal users who were dissatisfied with their visit to NHS Choices n=756
Q. What specifically made you dissatisfied with your visit today? (other categories) OPEN ENDED
Dissatisfaction is also caused by technical problems, ease
of use issues and unfulfilled expectations around bookings

Customer Insight Public Information 52
90% 87% 90%
87% 87% 86% 86% 84%
5% 6%
5% 7% 7% 7% 7% 8%
5% 6% 4% 5% 5% 5% 6% 6%
0%
10%
20%
30%
40%
50%
60%
70%
80%
90%
100%
July 10(n=2052)
Nov/Dec10
(n=1534)
April 11(n=2011)
Dec 11(n=4047)
Jul/Aug12
(n=2452)
May 13(n=3147)
Dec13/Jan
14(n=2603)
Jul/Aug14
(n=4674)
Definitely/Probably Not sure Definately/Probably not Don’t know
Along with the decline in satisfaction, fewer say they are
likely to user the site again…
Q. How likely are you to use the NHS Choices website again?
Base all respondents (as stated)
SINGLE CODE
%Definitely/
Probably Base
Male 78% 1,018
Female 88% 3,055
24 and under 93% 577
25-54 87% 2,136
55+ 79% 1,378
LTC – Yes 85% 1,723
LTC – No 85% 2,207
Child aged 18/
under - Yes 87% 951
Child aged18/
under – No 85% 3,114
At least monthly
user 96% 1,621
Less than
monthly user 84% 2,040
First time user 68% 820
Personal users 84% 4,225
Professionals 92% 449

Customer Insight Public Information 53
83% 80% 81% 77% 77% 79% 76% 73%
8% 8% 10%
10% 10% 9% 10%
11%
7% 10% 8% 10% 12% 11% 12% 13%
0%
10%
20%
30%
40%
50%
60%
70%
80%
90%
100%
July 2010(n=2052)
Nov 2010(n=1534)
April2011
(n=2001)
Dec 2011(n=4047)
Aug 2012(n=2452)
May2013
(n=3147)
Dec 2013(n=2602)
Jul/Aug2014
(n=4674)
Definitely/Probably Not sure Definately/Probably not Don't know
…and fewer are also likely to recommend the site to friends,
colleagues or family members (although the majority still will)
Base all respondents (as stated)
Q. How likely are you to recommend this website to a friend, colleague or family member?
SINGLE CODE
%Definitely/
Probably Base
Male 68% 1,018
Female 77% 3,055
24 and under 81% 577
25-54 77% 2,136
55+ 69% 1,378
LTC – Yes 75% 1,723
LTC – No 75% 2,207
Child aged 18/
under - Yes 77% 951
Child aged18/
under – No 74% 3,114
At least monthly
user 86% 1,621
Less than
monthly user 72% 2,040
First time user 59% 820
Personal users 74% 4,225
Professionals 76% 449
Customer Insight Public Information 54
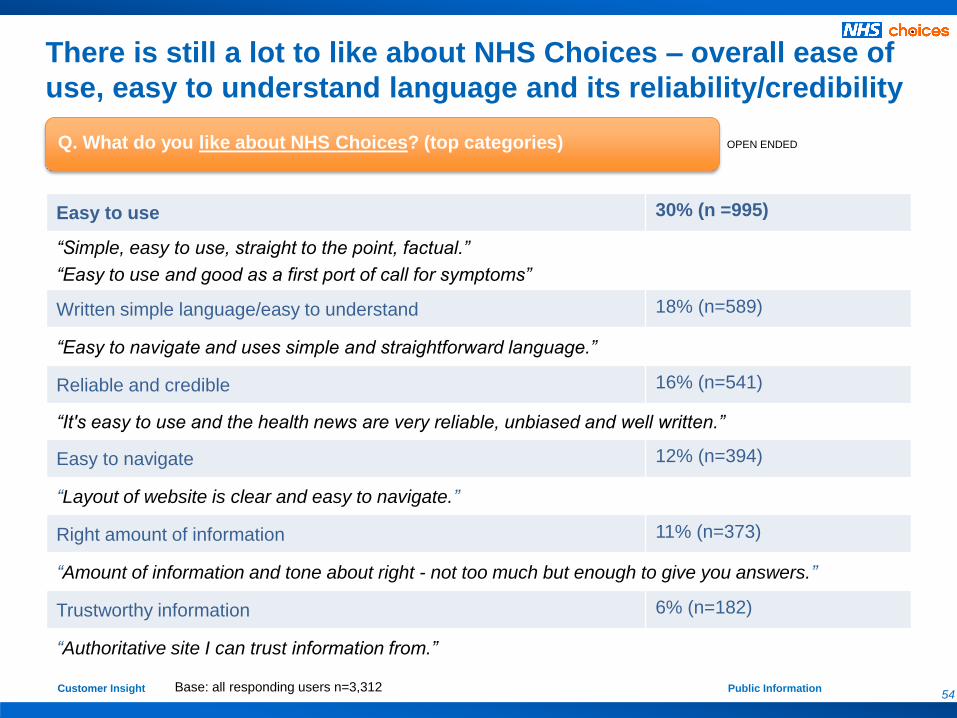
There is still a lot to like about NHS Choices – overall ease of
use, easy to understand language and its reliability/credibility
Easy to use 30% (n =995)
“Simple, easy to use, straight to the point, factual.”
“Easy to use and good as a first port of call for symptoms”
Written simple language/easy to understand 18% (n=589)
“Easy to navigate and uses simple and straightforward language.”
Reliable and credible 16% (n=541)
“It's easy to use and the health news are very reliable, unbiased and well written.”
Easy to navigate 12% (n=394)
“Layout of website is clear and easy to navigate.”
Right amount of information 11% (n=373)
“Amount of information and tone about right - not too much but enough to give you answers.”
Trustworthy information 6% (n=182)
“Authoritative site I can trust information from.”
Base: all responding users n=3,312
Q. What do you like about NHS Choices? (top categories) OPEN ENDED

Customer Insight Public Information 55
Q. What improvements would you recommend making to the NHS Choices website so that it better meets your needs? (top categories)
OPEN ENDED
None/don’t know 20% (n =555)
Navigation/search 15% (n=408)
“(To be able to) search for GPs with online appointments, or those with weekend surgery hours etc.”
“Group problems into types of problems if possible, and do not just rely on searches.”
“Greater functionality to refine searches.”
“Better search functionality or a map.”
Accuracy/up to date 15% (n=406)
“The results I get are insufficient and incomplete, with also very old not-updated information.”
“Clear and up to date information about how to contact medical staff or visit patients.”
“Basics like spelling and correct data!”
Technical issues e.g. broken links 13% (n=364)
“Non techie responses when I can not find something, or (get) an error - plain English responses”
“Do not use flash for any tools as it is not available on smart phones.”
“Link to apply for E111/EHIC not working.”
Base: all responding users n=2,744
BUT improvements are needed to increase user satisfaction –
navigation/search, accuracy and technical issues are priorities

Customer Insight Public Information 56
More information (both quantity and depth) around symptoms,
conditions, treatments is also desired + better use of patient reviews
Q. What improvements would you recommend making to the NHS Choices website so that it better meets your needs? (top categories)
OPEN ENDED
Amount of information 10% (n=268)
“Have more information about illnesses rather than just symptoms and treatments.”
“Proper info on the specific hospitals - what wards, visiting times etc.”
More detailed information 10% (n=264)
“More in depth information about surgical treatment/ conditions and also aftercare.”
Patient reviews/comments 5% (n=138)
“Encourage surgeries to reply to comments more quickly.”
“The reviewing system of GP surgeries needs to be looked into.”
Symptom checker 3% (n=88)
“Update the symptom checker. I am always advised to visit a doctor and I can never actually figure out
on this website what the problem could be, a waste of time really.”
Booking appointments 2% (n=42)
NHS Dentist information 1% (n=39)
Clearer/ more easy to understand 1% (n=35)
Base: all responding users n=2,744

Customer Insight Public Information 57
What other online health
and app resources are they
using?
Customer Insight Public Information 58
17%
11%
11%
8%
7%
5%
5%
3%
3%
3%
3%
3%
57%
NHS Direct
Symptom Checker
MyFitnessPal
WebMD
Patient.co.uk
MapMyRun
NHS BMI
Runkeeper
Nike+
Calorie Calculator
Weight Watchers
Other
None
40%
29%
23%
22%
17%
14%
11%
9%
9%
9%
9%
9%
9%
4%
23%
NHS Direct…
Boots WebMD…
Wikipedia
Directgov…
Patient (www.patient.co.uk)
Netdoctor…
Mayo Clinic…
Change for Life…
Doctors.net.uk…
Medicine.net…
British Heart Foundation…
Cancer Research UK…
Diabetes UK…
Other
None
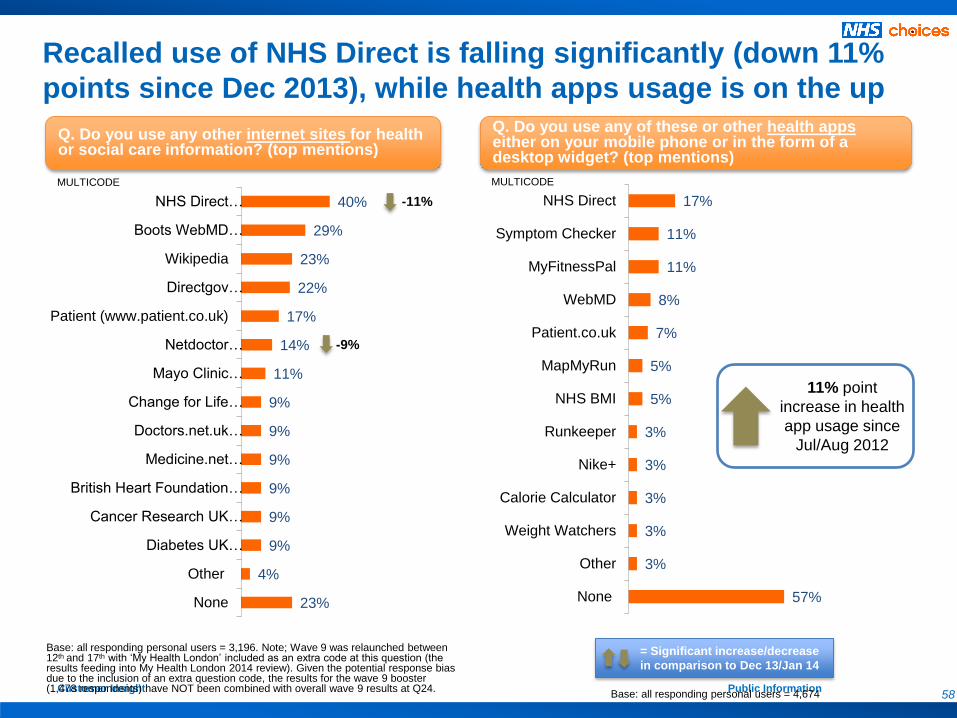
Recalled use of NHS Direct is falling significantly (down 11%
points since Dec 2013), while health apps usage is on the up
Q. Do you use any other internet sites for health or social care information? (top mentions)
Q. Do you use any of these or other health apps either on your mobile phone or in the form of a desktop widget? (top mentions)
-11%
= Significant increase/decrease
in comparison to Dec 13/Jan 14
Base: all responding personal users = 3,196. Note; Wave 9 was relaunched between 12th and 17th with ‘My Health London’ included as an extra code at this question (the results feeding into My Health London 2014 review). Given the potential response bias due to the inclusion of an extra question code, the results for the wave 9 booster (1,478 respondents) have NOT been combined with overall wave 9 results at Q24. Base: all responding personal users = 4,674
-9%
MULTICODE MULTICODE
11% point
increase in health
app usage since
Jul/Aug 2012

Customer Insight Public Information 59
A note on those responding
to the survey via the
homepage…

Customer Insight Public Information 60
Wave on wave findings – variation in key performance indicators among personal users responding to the survey via homepage vs. other URLs (all respondents)
Wave 8 – Homepage
(n=335)
Wave 9 - Homepage
(455)
Wave 8 – Other URLS
(2,257)
Wave 9 – Other URLs
(4,176)
Satisfaction with visit (Very
satisfied/satisfied) 78% 70% 70% 67%
Likelihood of
recommending
(Definitely/Probably) 84% 75% 75% 74%
Likelihood of using again
(Definitely/Probably) 91% 87% 86% 85%
Wave 8 – Homepage
(n=336)
Wave 9 - Homepage
(455)
Wave 8 – Other URLS
(2,261)
Wave 9 – Other URLs
(4,176)
Ease of use (Very
good/Good) 86% 84% 84% 81%
Attractive of design
appearance (Very
good/Good) 80% 77% 74% 72%
Ease of finding information
(Very good/Good) 79% 73% 74% 72%
Information that was clear
and easy to understand
(Very good/Good) 84% 77% 80% 78%
Accurate and up-to-date
information (Very
good/Good) 71% 66% 65% 63%
Satisfaction and advocacy declined most significantly among
those responding via the homepage vs. other areas of the site

Customer Insight Public Information 61
This is something to consider…
….even if it is partially explained by the higher proportion of 55+s and first time
users (those who are typically less positive) responding via the homepage in the
most recent survey wave
Wave on wave findings – profile of personal users responding to the survey via homepage vs. other URLs (all respondents)
Wave 8 – Homepage
(n=260)
Wave 9 - Homepage
(360)
Wave 8 – Other URLS
(2,041)
Wave 9 – Other URLs
(3,831)
Male 33% 28% 25% 24%
Female 65% 69% 73% 73%
24 and under 21% 21% 13% 13%
25-54 50% 47% 53% 51%
55+ 26% 29% 32% 33%
LTC – Yes 36% 36% 42% 41%
LTC – No 54% 56% 53% 52%
Monthly user 56% 47% 35% 33%
Less than monthly user 29% 34% 43% 45%
First time user 12% 15% 18% 18%
Works for NHS 11% 10% 9% 9%
Doesn’t work for NHS 92% 86% 91% 90%
Arrived via Google/other
search 58% 58% 81% 82%
Typed in address 18% 20% 9% 9%
Clicked on
bookmark/favourite 14% 13% 3% 3%

Customer Insight Public Information 62
Questions and comments to:
please quote “Slideshare” in the subject line