december 2014 nhs choices satisfaction survey
TRANSCRIPT

Customer Insight Public Information 1
Customer Satisfaction Survey Wave 10, January 2015
January 2015

Customer Insight Public Information 2
Contents
1. Introduction
• Purpose of survey
• Sample and methodology
2. Headline messages
3. How do users get to NHS Choices?
4. Who is using NHS Choices?
• Profile of personal users
• Profile of professional users
5. How is NHS Choices used?
• Reasons for visiting
• Frequency of visit
6. To what extent does NHS Choices meet user needs?
• Do users get what they want
from the site?
• Rating the user experience
• Use of on-site search
7. How likely are users to be satisfied with their visit to NHS Choices + recommend it and use it again?

Customer Insight Public Information 3
Introduction

Customer Insight Public Information 4
Introduction
• This report gives the findings from the 10th wave of the NHSC customer
satisfaction survey. The findings are based on data collected between
23/12/2014 and 12/01/2015
• The purpose of the survey is to:
• Track user satisfaction and advocacy over time
• Understand the user experience of different types of site user
• Establish their main reasons for visiting the site
• Understand whether users found what they were looking for
• Identify what improvements are needed to enhance the site
• New questions were added to this wave about disabilities and long term
conditions, and some functionality around the site
• Some questions were revised :
• Answers to multi-code/closed question on reasons for coming to
Choices
• Parent questions: Identifying parents of non dependent as well
as dependent children

Customer Insight Public Information 5
Sample and Methodology
Type of survey Online pop-up survey on selected pages of the NHS Choices website
Methodology Online self completion survey
Fieldwork dates 23rd December 2014 to 12th January 2015
Sample Total sample completes n=4399, Personal users n=4,081 Professional users n=303
Sample distribution General public – all responding users of NHS Choices
Previous research
conducted
Previous waves of the customer satisfaction survey have been conducted as follows:
- Wave 1: Nov 2008 (Ipsos MORI)
- Wave 2: July 2010
- Wave 3: Nov/Dec 2010
- Wave 4: Apr 2011
- Wave 5: Dec 2011
- Wave 6: Jul/Aug 2012
- Wave 7: May 2013
- Wave 8: Dec 2013/Jan 2014
- Wave 9: Jul/Aug 2014
- Wave 10: Dec 2014
Other information Users completed the survey via a pop-up invitation hosted on the 40 most commonly
visited website pages
Where percentage results do not sum to 100%, this is due to computer rounding or
questions that permit multiple responses
The base sizes denote all respondents to each question/statement unless stated
Wave 1 of the survey was delivered by Ipsos MORI in November 2009. The survey content
was changed after wave 1 to reflect COI requirements on how Government websites
should collect and measure user feedback. This means the results from survey wave 1 are
not directly comparable with subsequent waves.

Customer Insight Public Information 6
URLS from which the survey was launched (1) Top 40 most popular URLs used as survey invite pages
Base: all respondents n =4,674 Participants joining survey from
each page
% Number
/symptomcheckers/pages/symptoms.aspx 26% 1,154
/Search/Pages/Results.aspx 17% 732
/NHSEngland/Healthcareabroad/EHIC/Pages/about-the-ehic.aspx 8% 369
/Pages/HomePage.aspx 8% 348
/Conditions/Pages/hub.aspx 5% 219
/Services/GP/Overview/DefaultView.aspx 4% 175
/conditions/Chest-infection-adult/Pages/Introduction.aspx 2% 95
/Services/hospitals/Overview/DefaultView.aspx 2% 94
/Services/dentists/Overview/DefaultView.aspx 2% 90
/Services/hospitals/ReviewsAndRatings/DefaultView.aspx 2% 86
URL link unknown 2% 74
/conditions/stomach-ache-abdominal-pain/Pages/Introduction.aspx 2% 73
/conditions/cough/pages/introduction.aspx 2% 72
/Service-Search 2% 71
/Livewell/healthy-living/Pages/height-weight-chart.aspx 1% 63
/Services/GP/ReviewsAndRatings/DefaultView.aspx 1% 57
/Conditions/Irritable-bowel-syndrome/Pages/Introduction.aspx 1% 53
/conditions/chest-pain/Pages/Introduction.aspx 1% 47
/conditions/norovirus/pages/introduction.aspx 1% 42
/Livewell/tiredness-and-fatigue/Pages/medical-causes-of-tiredness.aspx 1% 37
/conditions/urinary-tract-infection-adults/Pages/Introduction.aspx 1% 35

Customer Insight Public Information 7
URLS from which the survey was launched (2)
Top 40 most popular URLs used as survey invite pages
Base: all respondents n =4,674 Participants joining survey from
each page
% Number
/NHSEngland/AboutNHSservices/Emergencyandurgentcareservices/Pages/NHS-
111.aspx 1% 35
/Services/GP/MapsAndDirections/DefaultView.aspx 1% 34
/Services/Hospitals/Services/Service/DefaultView.aspx 1% 33
/Conditions/Tonsillitis/Pages/Introduction.aspx 1% 33
/services/hospitals/services/defaultview.aspx 1% 32
/conditions/chickenpox/Pages/Introduction.aspx 1% 31
/conditions/lumps-swellings/Pages/Introduction.aspx 1% 31
/conditions/swollen-glands/Pages/Introduction.aspx 1% 31
/conditions/Sore-throat/Pages/Introduction.aspx 1% 31
/Services/GP/Staff/DefaultView.aspx 1% 27
/Services/dentists/MapsAndDirections/DefaultView.aspx 0% 21
/Services/pharmacies/Overview/DefaultView.aspx 1% 20
/Services/hospitals/MapsAndDirections/DefaultView.aspx 0% 18
/conditions/hand-foot-and-mouth-disease/Pages/Introduction.aspx 0% 15
/Conditions/vaginal-discharge/Pages/Introduction.aspx 0% 10
/medicine-guides/pages/default.aspx 0% 7
/chq/pages/948.aspx (How soon can I do a pregnancy test?) 0% 4
%url% 1% 37
Customer Insight Public Information 8
Headline messages
Customer Insight Public Information 9
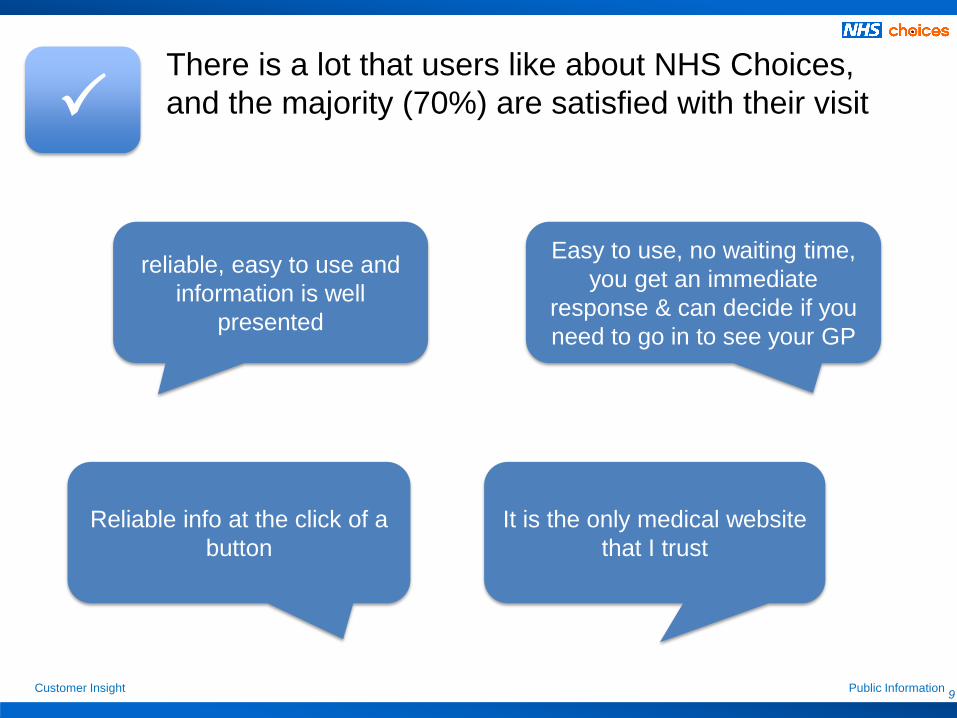
There is a lot that users like about NHS Choices,
and the majority (70%) are satisfied with their visit
reliable, easy to use and
information is well
presented
Easy to use, no waiting time,
you get an immediate
response & can decide if you
need to go in to see your GP
Reliable info at the click of a
button
It is the only medical website
that I trust

Customer Insight Public Information 10
Visit satisfaction, likelihood to recommend and
likelihood to use all slightly rose on the previous
wave - this may possibly be the result of the Dec
refresh . However it remains lower than highest
recorded measures
Visit satisfaction = 70% (vs. 68% in July 14, but 76% in April 11)
Likelihood to recommend = 79% (vs. 73% in July 14, but 83% in July 10)
Likelihood to use again = 88% (vs. 84% in July 14, but 90% in April 11)
Visit satisfaction = % Very satisfied/satisfied / Likelihood to recommend = % Definitely/probably / Likelihood to use again = % Definitely/probably

Customer Insight Public Information 11
Measures around site usability, layout and accuracy
of information also rose slightly on the previous wave
Ease of using the site = 84% (vs 81% in Jul 14)
Attractiveness of design = 75% (vs 73% in Jul 14)
Ease of finding information/services = 74% (vs 72% in Jul 14)
Info that was clear and easy to understand = 80% (vs 78% in Jul 14)
Accurate and up-to-date information = 68% (vs 64% in Jul 14)
All user experience indicators = % Very good/good
Customer Insight Public Information 12
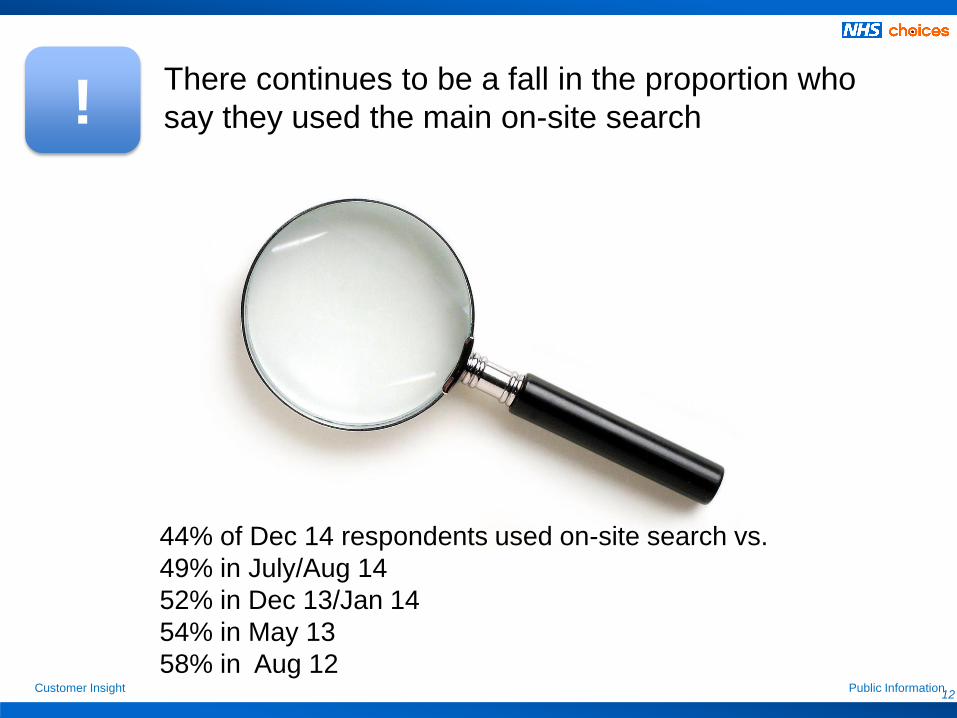
There continues to be a fall in the proportion who
say they used the main on-site search !
44% of Dec 14 respondents used on-site search vs.
49% in July/Aug 14
52% in Dec 13/Jan 14
54% in May 13
58% in Aug 12

Customer Insight Public Information 13
For this wave, full analysis was carried out on
respondents’ verbatim answers to the question
“Why exactly are you visiting Choices today?”
• Investigating symptoms is a key driver for visiting Choices
“Symptom” is the most mentioned word in response to this question, being
mentioned 619 times
• Seeking information on services (Dr’s, Hospitals, Dentists etc.) is another major
driver along with renewing EHIC cards and validating a suspected illness
?

Customer Insight Public Information 14
! A significant minority of users identified a number of
areas where they feel the site can improve.
Search and navigation
Accuracy of info and how frequently it is updated (Service information in particular)
Better information around symptoms/improved symptom checker
More/more detailed information
Improvement list
Site’s technical problems
Increase reviews and comments and help reviewers to feel acknowledged
Customer Insight Public Information 15
Survey findings

Customer Insight Public Information 16
Understanding this report
Statistically significant % increase
Statistically significant % decrease
Where percentage results do not sum to 100% this is due to computer
rounding or questions that permit multiple responses
Base sizes are noted at each question, and for each wave of research
‘Single code’ questions permit a single response
Open ended – respondents give a verbatim response
‘Multicode’ questions permit one or more responses
Significant differences between the latest survey wave and the previous
waves are highlighted throughout this report:

Customer Insight Public Information 17
How do NHS Choices users
get online?

Customer Insight Public Information 18
0%
10%
20%
30%
40%
50%
60%
70%
80%
90%
100%
A laptop/netbook
A desktop PC
A tablet (e.g. iPad)
A mobilephone/smartphone
Another kind of mobiledevice (e.g. iPod touch,PSP)
An internet-enabled TV
Other device notmentioned above(please specify)
Q. Which of the following devices have you ever used to look up online health and
social care information?
MULTICODE
Laptop/desktop usage rose slightly from last wave’s dip.
Mobile/tablet usage continues to increase
67%
62%
50%
45%
5%

Customer Insight Public Information 19
The majority (36%) use a laptop to access NHS Choices when
completing the survey
1%
14%
24%
26%
36%
Another kind of mobile device (e.g.iPod touch, PSP)
A mobile phone/smartphone
A desktop PC
A tablet (e.g. iPad)
A laptop/netbook
It is worth noting that people are less likely to complete a survey on their smartphone
Q. Which of the following devices are you using to access NHS choices today?
SINGLE CODE

Customer Insight Public Information 20
The majority of personal users access NHS Choices via a search engine.
Typing the site link and/or having it bookmarked is much more common with
professional users
Q. How did you get to NHS Choices today?
Base: all respondents n= 4,394 , personal users n=4,091 , all responding professional users n= 303
SINGLE CODE
5%
2%
2%
1%
1%
1%
4%
1%
1%
4%
3%
3%
13%
2%
3%
14%
11%
12%
59%
80%
78%
0% 20% 40% 60% 80%
Professional
Personal
All Users
Via Google or anothersearch engine
Typed in the address
Addressbookmarked/favourite
Link from a website
Link from an email
Via a link fromFacebook/Twitter/othersocial networking site
Other

Customer Insight Public Information 21
Who is using NHS Choices?

Customer Insight Public Information 22
Personal use
93%
Professional use
7%
Personal use (Base: 4,081)
For myself 75%
For a member of family (adult including adult children) 10%
For a member of family (child) 6%
For a friend or other relative 3%
Professional use (Base: 303)
As a health professional
(e.g. checking ratings for surgery/the local area, to get
information for my patient)
38%
Other professional use
(e.g. journalists research, teaching)
45%
As a professional looking for someone else as part of my
job
(e.g. librarian, local authority)
17%
Q. Were you mainly using the site for yourself, for someone else, or professionally today?
Personal users account for just over nine in every ten
visitors. This is a rise of 3% points on the previous wave
Base: 4395 respondents
SINGLE CODE
Personal users connection with the NHS
8% personally work for NHS (319 people)

Customer Insight Public Information 23
23%
-
1%
1%
1%
2%
2%
2%
2%
2%
2%
3%
4%
5%
8%
8%
8%
10%
18%
Other
School nurse
Health visitor
Practice nurse
Student nurse
Health trainer
Medical student
Midwife
Community/district nurse
Pharmacist
Hospital-based doctor/consultant
Hospital-based nurse
NHS management (e.g. PCT manager)
Specialist nurse working in primary care
GP
Hospital-based administrator
Medical receptionist/secretary / administrator
Other allied health professional
Practice managerHealth related professionalusers (Base: 115)
Practise managers, allied health professionals, medical
administrators and GPs are the top 3 professional user-types
Q. What is your job role? (Profile of healthcare professional users)
SINGLE CODE

Customer Insight Public Information 24
The majority of personal users are female and aged 25-64
Gender Age
Profile of personal users (Note: customer satisfaction survey respondents are self-selecting, so the profile of site users recorded in NHS Choices omnibus research from January 2014 should be considered a truer reflection of the site’s user base.)
Base: all responding personal users = 4,076 Base: all responding personal users = 4,080
25% (38% in NHSC nat rep
omnibus, Jan 14)
73% (62 % in NHSC nat
rep omnibus, Jan 14)
SINGLE CODE SINGLE CODE
2%
3%
11%
20%
20%
16%
14%
5%
6%
4%
Prefer not to answer
75+
65-74
55-64
45-54
35-44
25-34
20-24
16-19
15 and under

Customer Insight Public Information 25
Care provider
Carer for family
member
84%
Carer for
friend/other
relatives
23%
Base: all responding personal users = 4,078
28%
67%
MULTICODE
SINGLE CODE
Just over a quarter of personal users are carers: the majority of
them care for a family member
Of these people (base: 1,152)

Customer Insight Public Information 26
Yes 6%
No 89%
Prefer not to say 3%
Don't know 2%
6% of personal users have a disability that affects
their use of NHS Choices
Disability Disability
Base: all responding personal users = 4079
Base: all responding personal users with a disability = 283
Q. Do you have a disability that may affect how you use NHS Choices?
Q. How, if at all, does this disability limit your use of NHS Choices?
SINGLE CODE MULTICODE
0%
0%
3%
5%
7%
7%
9%
10%
11%
18%
18%
41%
Severely sight impaired (blind)
British sign language user
Hearing loss (severe/profound)
Difficulty in speaking orcommunicating
Problems using a touch screen device
Sight impaired (partially sighted)
Hearing loss (mild/moderate)
Problems due to learning difficulties
Problems using a mouse/keyboard
Problems due to mental healthdifficulties
Other (please specify)
Problems walking about
New question

Customer Insight Public Information 27
Yes 38%
No 52%
Prefer not to say 7%
Don't know 3%
38% of personal users have a LTC, with asthma, diabetes and
blood pressure issues being the most common conditions
Base: all responding personal users = 4080
Base: all responding personal users with a long term condition = 1,450
Q. Do you have any other long term health conditions or illnesses that require you to have regular medical care or check-ups?
Q. Most common conditions
SINGLE CODE OPEN-ENDED – CLARABRIDGE ANALYSIS
34
38
42
60
63
64
77
121
146
162
228
0 50 100 150 200 250
Spine/Back issues
Anxiety
COPD
Heart and heart related problems
Cancer
Thyroid issues
Arthritis
Depression
Blood pressure issues/Hypertension
Diabetes
Asthma
No of mentions
New question

Customer Insight Public Information 28
23% of personal users are expectant parents or parents with
dependent children under the age of 18. 17% have 18+
children only
Parent/expectant parent
Ages of children living with personal users
Base: all responding personal users who are parents/expectant parents = 1,817
Base: all responding personal users = 4,081
Q. Are you a parent or an expectant parent? (includes parents of children 18+)
Q. What are the ages of the children living with you?
SINGLE CODE
MULTICODE
Yes 45%
No 53%
Prefer not to say 3%
4%
17%
23%
16%
10%
45%
12%
I am expecting a child
Child/children aged 0-4
Child/children aged 5-11
Child/children aged 12-15
Child/children aged 16-17
Child/children aged 18+
Prefer not to answer
Base: all responding personal users = 4,081
Revised question
23%
17%
3% 5%
53%
Parents with dependent children/Expectantparents*
Parents with 18+ children only
Those that did not say whether they are aparent
Parents who did not indicate the age of theirchildren
Non parents

Customer Insight Public Information 29
Female respondents are more likely to be younger, have kids & visit
frequently, vs. men who are more likely to be older, first time visitors and have
a LTC. Younger respondents are most likely to visit monthly or more
Profile of personal users (demographic crossbreaks)
TOTAL
(N = 4,079) Male (1,013)
Female
(2,974)
24 and under
(597)
25 – 54
(2,040) 55+ (1,365)
Male 25% 16% 18% 40%
Female 73% 82% 81% 59%
24 and under 15% 9% 16%
25-54 50% 37% 56%
55+ 33% 54% 27%
LTC – Yes 38% 43% 37% 24% 35% 52%
LTC – No 52% 48% 53% 65% 57% 39%
Dependent children in
household/Expectant parents 23%
14% 26% 5% 42% 4%
No dependent children/No children 77% 86% 74% 95% 58% 96%
At least monthly user 27% 21% 29% 55% 27% 16%
Less than monthly user 49% 45% 50% 31% 54% 48%
First time user 18% 28% 15% 8% 14% 30%
Care provider 28% 25% 29% 19% 28% 34%
Not a care provider 67% 72% 67% 76% 68% 64%
Works for NHS 8% 4% 9% 4% 11% 4%
Doesn’t work for NHS 92% 96% 91% 96% 89% 96%
How to read: find the column (female), read down (16%)
and then across (24 and under). This tells us 16% of
female users are aged 24 and under

Customer Insight Public Information 30
Profile of personal users (demographic crossbreaks) How to read: find the column (Monthly user), read down
(79%) and then across (Female). This tells us 79% of
monthly users are Female
Frequent users are more likely to be female, 24 and under and to be a care provider
TOTAL
(N = 4,079 )
Dependent children in
household (926)
No dependent
children/No children
in household (3,153)
At least monthly user
(1,109)
Less than monthly
user (1,979) First time user (752)
Male 25% 15% 28% 19% 23% 38%
Female 73% 84% 70% 79% 75% 60%
24 and under 15% 3% 18% 29% 9% 6%
25-54 50% 92% 38% 49% 56% 38%
55+ 33% 4% 42% 20% 33% 54%
LTC – Yes 38% 32% 40% 39% 38% 39%
LTC – No 62% 62% 49% 51% 53% 52%
Dependent children in
household/Expectant
parents
23% 20% 25% 16%
No dependent
children in household
/No children
77% 80% 75% 84%
At least monthly user 27% 28% 31%
Less than monthly
user 49% 54% 45%
First time user 18% 13% 19%
Care provider 28% 29% 28% 31% 28% 27%
Not a care provider 67% 68% 67% 66% 69% 67%
Works for NHS 8% 11% 7% 11% 7% 6%
Doesn’t work for NHS 92% 89% 93% 89% 93% 94%

Customer Insight Public Information 31
Carers and those with disabilities that affect their use of Choices are more likely than non-carers and
those without disabilities to have an LTC. NHS workers visit more often than non-NHS workers
Profile of personal users (demographic crossbreaks)
TOTAL
(N = 4,079)
LTC –
Yes
(1,568)
LTC –
No
(2,114)
Have a
disability
affecting
use of
Choices
(255)
Do not have a
disability
affecting use
of Choices
(3,618)
Care provider
(1,152)
Not a care
provider
(2,742)
Works for
NHS (319)
Doesn’t work
for NHS
(3,765)
Male 25% 28% 23% 34% 24% 22% 26% 13% 26%
Female 73% 71% 75% 62% 75% 76% 72% 84% 72%
24 and under 15% 9% 18% 9% 15% 10% 16% 8% 15%
25-54 50% 45% 55% 42% 51% 49% 51% 70% 48%
55+ 33% 45% 25% 47% 33% 50% 32% 19% 35%
LTC – Yes 38% 77% 36% 45% 37% 31% 39%
LTC – No 52% 15% 57% 45% 56% 61% 51%
Dependent children in
household/Expectant parents 23% 19% 27% 16% 24% 24% 23% 31% 22%
No dependent children in
household /No children 77% 81% 73% 84% 76% 76% 77% 69% 78%
At least monthly user 27% 28% 27% 33% 27% 30% 21% 38% 26%
Less than monthly user 49% 48% 50% 35% 50% 47% 40% 43% 49%
First time user 18% 19% 19% 24% 18% 18% 22% 14% 19%
Care provider* 28% 33% 25% 39% 28% 30% 28%
Not a care provider* 67% 64% 73% 54% 69% 67% 67%
Works for NHS 8% 6% 9% 4% 8% 8% 8%
Doesn’t work for NHS 92% 94% 91% 96% 92% 92% 92%
How to read: find the column (works for NHS), read
down (8%) and then across (24 and under). This tells us
8% of those who work for the NHS are 24 and under

Customer Insight Public Information 32
How is NHS Choices used?

Customer Insight Public Information 33
Q. Why exactly are you visiting NHS Choices today?
The most popular reason for visiting Choices is to investigate
symptoms
• Respondents’ reasons for visiting Choices were analysed using Clarabridge software*
• What they said divides into the following themes
• Further definition and analysis of the themes are in the following slides
Base: 4,390
Reason visiting
Choices
% of all
mentions
No of
mentions
Investigating
symptoms
35% 1,519
Information on
services
15% 661
Actions around
EHIC card
9% 388
Validation of a
suspected illness
7% 306
Information on
long term
conditions
(including specific
cancers)
3% 130
Weight, BMI and
diet
3% 112
OPEN ENDED
Reason visiting Choices % of all
mentions
No of
mentions
Medicines 2% 91
Information needed for
studies
1% 56
Mental health 1% 50
Sexual health 1% 46
Pregnancy 1% 40
Cancer 1% 25
Customer Insight Public Information 34
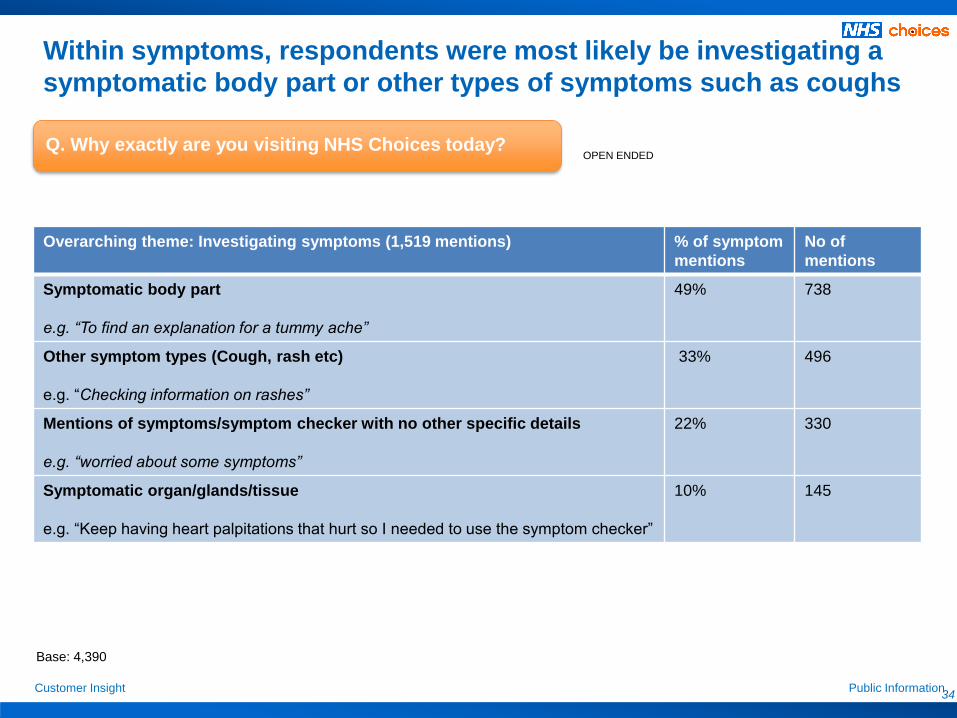
Overarching theme: Investigating symptoms (1,519 mentions) % of symptom
mentions
No of
mentions
Symptomatic body part
e.g. “To find an explanation for a tummy ache”
49% 738
Other symptom types (Cough, rash etc)
e.g. “Checking information on rashes”
33% 496
Mentions of symptoms/symptom checker with no other specific details
e.g. “worried about some symptoms”
22% 330
Symptomatic organ/glands/tissue
e.g. “Keep having heart palpitations that hurt so I needed to use the symptom checker”
10% 145
Within symptoms, respondents were most likely be investigating a
symptomatic body part or other types of symptoms such as coughs
Q. Why exactly are you visiting NHS Choices today? OPEN ENDED
Base: 4,390

Customer Insight Public Information 35
Overarching theme: Information on services (661 mentions) % of Services mentions No of mentions
Doctor/GP:
• Finding a Dr/GP
• Do I need to go to the Dr?
• Contact details
• Reviews/complaints
• Appointments
• Opening times/Out of hours
56%
16%
14%
8%
6%
5%
4%
369
108
93
51
40
33
26
Hospital:
• Reviews/Ratings
• Questions around A&E and/or whether to visit A&E
• Visiting/Contact details
• Map and location information
• Find a hospital
• Appointment
25%
5%
4%
4%
3%
2%
2%
164
35
26
26
19
12
10
Dentist:
• Find a dentist
14%
8%
94
51
Pharmacies:
• Find a pharmacy
6%
4%
37
28
Emergency/urgent care 3% 23
The majority of people with a service enquiry had an enquiry
related to GPs
Q. Why exactly are you visiting NHS Choices today? OPEN ENDED

Customer Insight Public Information 36
Q. Why exactly are you visiting NHS Choices today? OPEN ENDED
Validation of a suspected illness (306 mentions) % of validation mentions No of mentions
Flu and Colds
e.g. “Looking for the symptoms of flu and their duration”
56% 170
Chickenpox
e.g. “Checking symptoms and duration of chickenpox”
10% 31
Tonsillitis
e.g. “To identify whether or not I have tonsillitis”
10% 31
Norovirus
e.g. “I have Norovirus and am looking at the way to best treat it”
8% 23
Urinary tract infection
e.g. “To look at the symptoms of a UTI because I think I might
have one”
7% 22
Pneumonia
e.g. “I may have pneumonia”
5% 14
Those looking to validate a suspected illness are most likely to
be looking to validate colds and flu
Base: 4,390

Customer Insight Public Information 37
Information on long term conditions -
including specific cancers (130 mentions)
% of conditions mentions No of mentions
Depression
e.g. “to look into Depression”
17% 22
IBS
e.g. “Looking in to the difference between IBS
and Crohn’s disease as I have been diagnosed
with IBS but it is getting worse”
15% 20
Diabetes
e.g. “I need to know if I have diabetes”
13% 17
Arthritis
e.g. “I have recently been diagnosed with
osteoarthritis and thought I would have a look
and see what information I could find out”
9% 12
Asthma
e.g. “To read about asthma and to see why I
got it”
9% 12
High blood pressure
e.g. “Find out current guidance for
management of high blood pressure”
8% 10
Q. Why exactly are you visiting NHS Choices today? OPEN ENDED
The most common conditions people say they are
investigating on Choices are depression, IBS and diabetes
Base: 4,390

Customer Insight Public Information 38
Users were also asked to pick out their reason for visiting
from a predefined list
Q. Why did you come to the site today? (Top 4 reasons from a provided list)
1. Information and
advice on
symptoms
2. Information and
advice on how to
treat a health
condition
3. General
Information about
a medical
condition
40% 27% 26%
MULTICODE
Base: all respondents = 4,395
4. Information on
whether a medical
consultation is
needed
24%
Revised question

Customer Insight Public Information 39
Q. Why did you come to the site today? MULTICODE
Medical information
net % score:
65%
Service
information net %
score:
28%
Revised question
The biggest percentage of respondents claimed to be
investigating symptoms, matching the open ended question
17%
3%
5%
2%
4%
4%
5%
7%
7%
8%
11%
24%
26%
27%
40%
0% 5% 10% 15% 20% 25% 30% 35% 40%
Something else
Health news
Information to help lose weight/eat more healthily
Comments posted by other users about their experiences of usingDentists
Comments posted by other users about their experiences of usingspecialist health services (such as hospital, urgent care or maternity…
Comments posted by other users about their experiences of using GPs
Information about services to help prepare for a future health appointment
Information (medical) to help prepare for a future health appointment
Information to help choose an NHS service
Contact details for a health professional (such as a GP, nurse or dentist)
Information about NHS services
Information to help to determine whether a medical consultation isneeded
Information about a medical condition (general)
Information and advice on how to treat a health condition
Information and advice on symptoms
Customer Insight Public Information 40
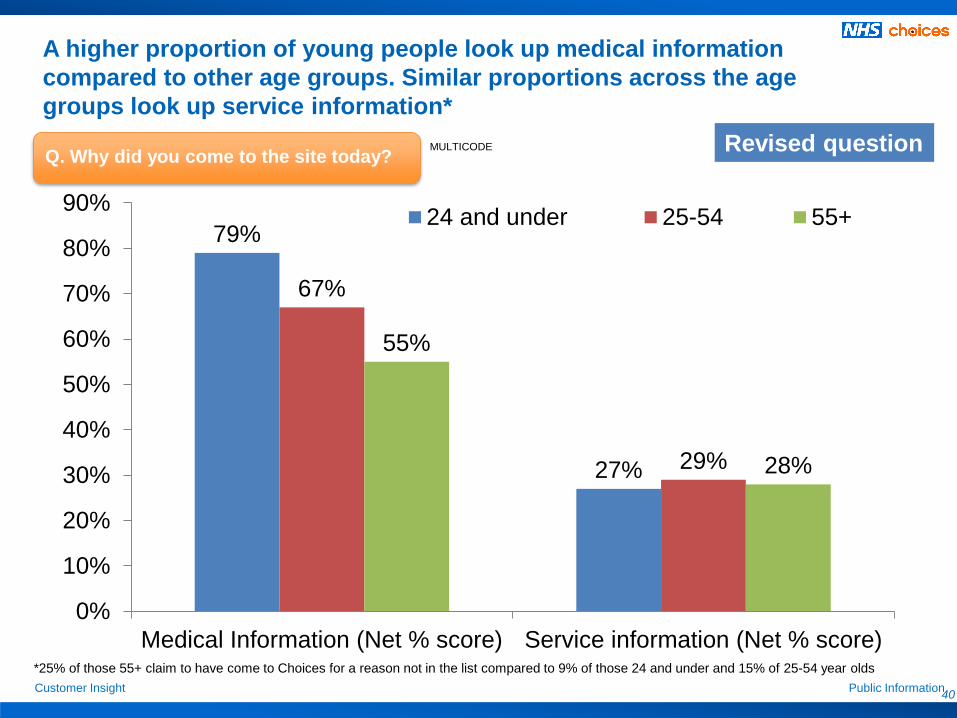
Revised question Q. Why did you come to the site today?
MULTICODE
79%
27%
67%
29%
55%
28%
0%
10%
20%
30%
40%
50%
60%
70%
80%
90%
Medical Information (Net % score) Service information (Net % score)
24 and under 25-54 55+
A higher proportion of young people look up medical information
compared to other age groups. Similar proportions across the age
groups look up service information*
*25% of those 55+ claim to have come to Choices for a reason not in the list compared to 9% of those 24 and under and 15% of 25-54 year olds

Customer Insight Public Information 41
Professional and personal users have differing needs
Personal users are most likely to be investigating symptoms
Professionals are looking at services
Q. Why did you come to the site today?
Base: all responding personal users n= 4,091 , all responding professional users n=303
MULTICODE
2%
3%
4%
4%
5%
5%
7%
7%
7%
9%
17%
26%
26%
27%
41%
4%
8%
9%
11%
4%
6%
5%
9%
18%
25%
25%
5%
24%
18%
18%
0% 10% 20% 30% 40% 50%
Comments posted by other users about their experiences of using Dentists
Health news
Comments posted by other users about their experiences of using…
Comments posted by other users about their experiences of using GPs
Information to help lose weight/eat more healthily
Information about services to help prepare for a future health appointment
Information (medical) to help prepare for a future health appointment
Information to help choose an NHS service
Contact details for a health professional (such as a GP, nurse or dentist)
Information about NHS services
Something else (please specify)
Information to help to determine whether a medical consultation is needed
Information about a medical condition (general)
Information and advice on how to treat a health condition
Information and advice on symptoms
Professional Users
Personal Users
Revised question

Customer Insight Public Information 42
Q. How often have you used the NHS Choices website in the last 12 months?
Overall by wave
Professional users and those aged <24 are most likely to visit monthly, as
seen in previous waves. Those 55+ are more likely to be first time users
Base: all responding users (as stated)
SINGLE CODE
38%
35%
30%
41%
44%
47%
17%
18%
18%
4%
4%
6%
Dec/Jan 14
Jul/Aug 14
Dec/Jan 2015
At least monthly user Less than monthly First time user Don't know
16%
27%
55%
29%
21%
72%
27%
48%
54%
31%
50%
45%
19%
49%
30%
14%
8%
15%
28%
6%
18%
6%
5%
7%
5%
6%
4%
6%
0% 10% 20% 30% 40% 50% 60% 70% 80% 90% 100%
55+ (Base: 1,365)
25-54 (Base: 2,040)
24 and under (Base: 597)
Female (Base: 2,975)
Male (Base: 1011)
Professional (Base: 302)
Personal (Base: 4068)

Customer Insight Public Information 43
Does NHS Choices meet user needs?

Customer Insight Public Information 44
66% got most/everything they wanted from their visit, an improvement
on the last survey
39%
36%
45%
38%
40%
41%
41%
39%
46%
26%
25%
22%
25%
23%
24%
23%
23%
20%
22%
23%
21%
23%
21%
20%
21%
20%
19%
13%
15%
12%
14%
16%
16%
15%
18%
15%
Got everything I wanted Got most of what I wanted Got some of what I wanted Got none of what I wanted
65%
64%
62%
63%
Q. Did you get what you wanted from the NHS Choices website?
64%
May 2013 ( n=3,147)
Aug 2012 (n=2,452)
Dec 2013 (n=2,609)
Jul 2014 (n=4,674)
Dec 2011 (n=4,047)
Apr 2011 (n=2,011) 67%
Jul 2010 (n=2,052)
65%
Base: all responding users (as stated)
Nov 2010 (n=1,534)
61%
SINGLE CODE
Dec 2014 (n=4,395)
66%

Customer Insight Public Information 45
Got everything/most of what I wanted Base
All respondents 66% 4,395
Male 65% 1,013
Female 68% 2,975
24 and under 76% 597
25-54 68% 2,040
55+ 61% 1,366
LTC – Yes 65% 1,568
LTC – No 70% 2,114
Children aged 17& under– Yes 70% 926
Children aged 17& under – No 65% 3,465
At least monthly user 75% 1,325
Less than monthly user 64% 2,035
First time user 61% 769
Personal users 66% 4,092
Professionals 66% 303
Those 24 and under are most likely to say they got everything or most
of what they wanted from their visit
Q. Did you get what you wanted from the NHS Choices website? SINGLE CODE
Key: = Demographic group with
highest % = Demographic group with
lowest %

Customer Insight Public Information 46
Definitive information on symptoms and complete accurate
service information are key areas for improvement
What they could not find
(2,080 mentions)
% of all mentions of what
couldn’t be found
No of mentions as an area
where not all the information
wanted could be found
No of mentions as a reason
for visiting Choices*
Definitive identification/advice on
symptoms
22% 448 1,519
Complete/accurate service
information
18% 364 661
More detailed information on
medication and/or side effects
3% 66 87
Confirmation/more detailed
information/treatment advice for
the illness they are trying to
validate
3% 64 306
More information on long term
conditions
2% 37 130
Renewing EHIC link or
information on renewing in
special circumstances (non UK
citizen, etc)
1% 27 388
Base: all responding personal users who didn’t get everything they wanted from NHS Choices n: 2080
Further definition and analysis of the themes/areas are in the following slides
Q. What couldn’t you find that you were expecting to?

Customer Insight Public Information 47
Overarching theme: Definitive identification/advice on symptoms
(448 mentions)
% of
mentions
under this
theme
No of
mentions
as
something
that could
not be
found
No of
mentions
as a reason
to come to
Choices
Mentions of symptoms/symptom checker with no other specific
details
e.g. “When trying the symptom checker the questions were too broad for
my complaint.”
44% 199 330
Symptomatic body part
e.g. “I wanted to know whether my chest pain could be a chest infection”
31% 138 738
Other symptom types (Cough, rash etc.)
e.g. “Whether it was flu or strep throat or tonsillitis”
23% 105 496
Symptomatic organ/glands/tissue
e.g. “On the list of symptoms there was nothing about pain in organs, i.e,
my kidney area pain”
9% 42 145
Q. What couldn’t you find that you were expecting to?
Respondents often do not detail their specific symptoms when
discussing what they could not find on the site*

Customer Insight Public Information 48
Overarching theme: Information on services (364 mentions) % of mentions
under this
theme
No of mentions as
something that
could not be found
No of mentions
as a reason to
come to Choices
Doctor/GP:
• Do I need to go to the Dr?
• Contact details & names
• Finding a Dr/GP
• Appointments
• Opening times/Out of hours
• Reviews/complaints
51%
13%
6%
6%
4%
4%
2%
187
49
23
21
15
15
8
369
93
51
108
33
26
40
Hospital:
• Questions around A&E/Whether to visit A&E
• Visiting/Contact details
• Map and location information
• Appointment
32%
8%
8%
4%
2%
115
28
27
15
7
164
26*
26*
19
10
Dentist:
• Find a dentist
• Review/Complaints
10%
1%
1%
38
5
5
94
51
3
Pharmacies:
• Find a pharmacy
8%
2%
29
8
37
28
Emergency/urgent care 5% 17 23
Q. What couldn’t you find that you were expecting to?
Information on hospitals could be a key area of concern

Customer Insight Public Information 49
What they could not find (2,080 mentions) % of all
mentions of
what couldn’t
be found
No of mentions as
an area where not
all the information
wanted could be
found
No of mentions
as a reason for
visiting Choices
More detailed information on medication and/or side
effects
e.g. “Did not tell me if there is any impact on the effectiveness
of the oral contraceptive when taking medication for thrush”
3% 66 87
Confirmation/more detailed information/treatment advice
for the illness they are trying to validate
e.g. “It told me to consult a GP but all I was looking for was
some self help advice to treat my flu at home”
3% 64 306
More information on long term conditions
e.g. “More in depth information on IBS”
2% 37 130
Renewing EHIC link or information on renewing in special
circumstances (non UK citizen, etc)
e.g. “I could not find out if I can get the card sent quicker than
10 days”
1% 27 388
Q. What couldn’t you find that you were expecting to?
Information on medication and side effects is also lacking

Customer Insight Public Information 50
Q. Please rate the NHS Choices site for the following aspects (% rated very good/good)
This wave saw a slight recovery in positive views on user
experience
SINGLE CODE FOR EACH STATEMENT
Ease of
use
81% 73% 72% 78% 64%
88% 80% 79% 85% 76%
Attractive-
ness of
design
Ease of
finding info
Info that is
clear/ easy to
understand
Accurate/
up to date
info
Apr
2011
Jul/Aug
2014
NHS Choices customer satisfaction survey: April 2011 base = 2,011 responding users, Jul/Aug 2014 base = 4,674
-7% -7% -7% -7% -12%
84% 75% 74% 80% 68% Dec
2014

Customer Insight Public Information 51
Over eight in ten users say the site’s ‘ease of use’ is good – those aged 24<,
monthly visitors and those with children 17 or under are most positive
86% 84% 88%
84% 85% 84% 84%
81% 84%
4% 7% 4%
5% 6% 6% 6% 7%
9%
9% 9% 8% 11% 9% 9% 10% 10%
6%
0%
10%
20%
30%
40%
50%
60%
70%
80%
90%
100%
Jul 10(n=2052)
Nov/Dec10
(n=1534)
Apr 11(n=2011)
Dec 11(n=4047)
Jul/Aug12
(n=2452)
May 13(n=3147)
Dec13/Jan 14(n=2606)
Jul/Aug14
(n=4674)
Dec 14(n=4392)
Very good/good Neither/nor Poor/very poor Don't know
Base all respondents (as stated)
Ease of use Q. Please rate the NHS Choices site for the following aspects
SINGLE CODE
%Very
good/good Base
Male 80% 1,013
Female 86% 2,973
24 and under 92% 596
25-54 85% 2,040
55+ 80% 1,365
LTC – Yes 85% 1,566
LTC – No 85% 2,114
Children aged
17& under* –
Yes
88% 926
Children aged
17& under – No 82% 3,466
At least monthly
user 90% 1,325
Less than
monthly user 84% 2,034
First time user 76% 769
Personal users 84% 4089
Professionals 79% 303

Customer Insight Public Information 52
80% 78% 80% 76%
78% 77% 75% 73% 75%
16% 15%
15% 18% 16% 17% 19% 20% 19%
3% 6% 3% 4% 5% 5% 5% 6% 5%
0%
10%
20%
30%
40%
50%
60%
70%
80%
90%
100%
Jul 10(n=2052)
Nov/Dec10
(n=1534)
Apr 11(n=2011)
Dec 11(n=4047)
Jul/Aug12
(n=2452)
May 13(n=3147)
Dec13/Jan 14(n=2604)
Jul/Aug2014
(n=4674)
Dec14/Jan2015
(n=4392)
Very good/good Neither/nor Poor/very poor Don't know
Base all respondents (as stated)
SINGLE CODE
Attractiveness of design/appearance Q. Please rate the NHS Choices site for the following aspects
Over seven in ten users (75%) say the site’s
‘attractiveness of design/appearance’ is good
%Very
good/good Base
Male 72% 1,013
Female 77% 2,973
24 and under 81% 596
25-54 77% 2,040
55+ 71% 1,365
LTC – Yes 75% 1,566
LTC – No 77% 2,114
Children aged
17& under –
Yes
80% 926
Children aged
17& under – No 73% 3,466
At least monthly
user 83% 1,325
Less than
monthly user 74% 2,034
First time user 67% 769
Personal users 74% 4089
Professionals 73% 303

Customer Insight Public Information 53
76% 74%
79% 75% 76% 76% 75%
72% 74%
14% 13%
13% 15% 13% 13% 14%
15% 14%
10% 12% 9% 11% 10% 11% 12% 11%
0%
10%
20%
30%
40%
50%
60%
70%
80%
90%
100%
Jul 10(n=2052)
Nov/Dec10
(n=1534)
Apr 11(n=2011)
Dec 11(n=4047)
Jul/Aug12
(n=2452)
May 13(n=3147)
Dec13/Jan 14(n=2605)
Jul/Aug14
(n=4674)
Dec14/Jan 15(n=4392)
Very good/good Neither/nor Poor/very poor Don't know
Base all respondents (as stated)
SINGLE CODE
9%
Ease of finding information/services Q. Please rate the NHS Choices site for the following aspects
Over seven in ten (74%) say the site is good in terms
of ‘ease of finding information/services’
%Very
good/good Base
Male 69% 1,013
Female 77% 2,973
24 and under 84% 596
25-54 77% 2,040
55+ 68% 1,365
LTC – Yes 73% 1,566
LTC – No 77% 2,114
Children aged
17& under –
Yes
79% 926
Children aged
17& under – No 72% 3,466
At least monthly
user 81% 1,325
Less than
monthly user 73% 2,034
First time user 66% 769
Personal users 74% 4089
Professionals 69% 303

Customer Insight Public Information 54
84% 83% 85% 80%
82% 80% 81% 78% 80%
10% 8%
9% 11% 9% 11% 11%
12% 11%
5% 7%
6% 6% 8% 8% 7% 8% 7%
0%
10%
20%
30%
40%
50%
60%
70%
80%
90%
100%
Jul 10(n=2052)
Nov/Dec10
(n=1534)
Apr 11(n=2011)
Dec 11(n=4047)
Jul/Aug12
(n=2452)
May 13(n=3147)
Dec13/Jan 14(n=2602)
Jul/Aug14
(n=4674)
Dec14/Jan 15(n=4392)
Very good/good Neither/nor Poor/very poor Don't know
Base all respondents (as stated)
SINGLE CODE
Information that was clear and easy to understand Q. Please rate the NHS Choices site for the following aspects
Eight in ten users (80%) say the site is good in terms of
‘information that was clear and easy to understand’
%Very
good/good Base
Male 76% 1,013
Female 82% 2,973
24 and under 90% 596
25-54 82% 2,040
55+ 74% 1,365
LTC – Yes 80% 1,566
LTC – No 83% 2,114
Children aged
17& under –
Yes
84% 926
Children aged
17& under – No 78% 3,466
At least monthly
user 87% 1,325
Less than
monthly user 79% 2,034
First time user 71% 769
Personal users 80% 4089
Professionals 75% 303

Customer Insight Public Information 55
74% 73% 76%
67% 68%
68% 66% 64% 68%
12% 11% 11%
14% 11% 13% 14% 14%
13%
5% 8% 6%
11% 10% 9% 9% 10%
8%
9% 8% 11% 11% 12% 10%
0%
10%
20%
30%
40%
50%
60%
70%
80%
90%
100%
Jul 10(n=2052)
Nov/Dec10
(n=1534)
Apr 11(n=2011)
Dec 11(n=4047)
Jul/Aug12
(n=2452)
May 13(n=3147)
Dec13/Jan 14(n=2605)
Jul/Aug14
(n=4674)
Dec14/Jan 15(n=4392)
Very good/good Neither/nor Poor/very poor Don't know
Base all respondents (as stated)
SINGLE CODE
9% 10% 11%
Accurate and up-to-date information Q. Please rate the NHS Choices site for the following aspects
Just under seven in ten users (68%) say the site is good
in terms of ‘accurate and up-to-date information’
%Very
good/good Base
Male 62% 1,013
Female 72% 2,973
24 and under 83% 596
25-54 73% 2,040
55+ 59% 1,365
LTC – Yes 68% 1,566
LTC – No 72% 2,114
Child aged 17
and under - Yes 75% 926
Child aged 17
and under – No 67% 3,466
At least monthly
user 77% 1,325
Less than
monthly user 67% 2,034
First time user 61% 769
Personal users 69% 4089
Professionals 63% 303

Customer Insight Public Information 56
Reasons why respondents felt NHS Choices is poor/very
poor for accurate and up to date information
Base: 332 respondents
• 28% (92 mentions) made general comments about the information being out of date and
needing to be updated
• 9% (31 mentions) were about information not being detailed enough
11% specifically mentioned issues with
Dr/G.P. info:
7% mentioned problems with the hospital
info (23 mentions)
5% mentioned a lack of reviews or mistrust
of those they did see
4% mentioned problems with dentists info
Most of the information especially about GPs is
older than 2 years - they are from 2011 and 2012
and not updated since
Q. Why specifically did you rate NHS Choices as poor/very poor for accurate and up to date information?
Could not find data I was looking for in order to
compare hospitals and surgeons
Most of the practice information had not been
reviewed for some years. Some were stating last
reviewed 2010
The dentist information - was very little of it,
nothing that was informative enough to make me
decide on one, lack of reviews of dentists
New question

Customer Insight Public Information 57
%Very
good/good Base
Male 85% 1,013
Female 86% 2,974
24 and under 87% 596
25-54 87% 2,040
55+ 83% 1,365
LTC – Yes 86% 1,566
LTC – No 86% 2,114
Children aged
17& under –
Yes
88% 926
Children aged
17& under – No 84% 3,466
At least monthly
user 88% 1,325
Less than
monthly user 86% 2,034
First time user 80% 769
Personal users 85% 4089
Professionals 83% 303
Over eight in ten say the site is good in terms of ‘how
the site displays on the device they are using’
85%
10%
4% 1%
0%
10%
20%
30%
40%
50%
60%
70%
80%
90%
100%
How the site displays on thedevice you are using today
Don’t know
Poor + Very poor
Neither good norpoor
Very good +Good
Base: All respondents (4,392)
Q. Please rate the NHS Choices site for the following aspects
New question

Customer Insight Public Information 58
%Very
good/good Base
Male 86% 1,013
Female 89% 2,974
24 and under 88% 596
25-54 91% 2,040
55+ 95% 1,365
LTC – Yes 88% 1,566
LTC – No 89% 2,114
Children aged
17& under –
Yes
91% 926
Children aged
17& under – No 86% 3,466
At least monthly
user 89% 1,325
Less than
monthly user 89% 2,034
First time user 82% 769
Personal users 88% 4089
Professionals 80% 303
Nearly nine in ten (90%) say the site is good in terms of
‘pages that load on first attempt’
87%
8%
4% 1%
0%
10%
20%
30%
40%
50%
60%
70%
80%
90%
100%
Pages that load on first attempt
Don’t know
Poor + Very poor
Neither good norpoor
Very good + Good
Base: All respondents (4,392)
Q. Please rate the NHS Choices site for the following aspects
New question

Customer Insight Public Information 59
%Very
good/good Base
Male 85% 1,013
Female 87% 2,974
24 and under 85% 596
25-54 89% 2,040
55+ 84% 1,365
LTC – Yes 87% 1,566
LTC – No 88% 2,114
Children aged
17& under –
Yes
90% 926
Children aged
17& under – No 84% 3,466
At least monthly
user 88% 1,325
Less than
monthly user 87% 2,034
First time user 81% 769
Personal users 86% 4089
Professionals 80% 303
Nearly nine in ten users (86%) say the site is good in
terms of ‘the speed in which pages load’
86%
9%
4% 1%
0%
10%
20%
30%
40%
50%
60%
70%
80%
90%
100%
The speed in which pages load
Don’t know
Poor + Very poor
Neither good norpoor
Very good + Good
Base: All respondents (4,392)
Q. Please rate the NHS Choices site for the following aspects
As professionals consistently had less people than other demographics rating
these elements as very good/good, it could be inferred that their ratings may
be due to the technology that is available to them
New question

Customer Insight Public Information 60
Users were shown the main NHS Choices search box and asked whether or
not that had used it during their visit…
Search
The users were also shown the ‘find services’ search page and search box
from the home page, and asked whether or not that had used these features…

Customer Insight Public Information 61
78% 73% 75% 75% 75% 72% 71%
11% 12% 12% 12% 12% 13% 13%
8% 8%
11% 12% 12% 13% 14%
2% 7% 2%
0%
10%
20%
30%
40%
50%
60%
70%
80%
90%
100%
Apr 11(n=962)
Dec 11(n=1275)
Jul/Aug12
(n=1431)
May 13(n=1689)
Dec13/Jan 14(n=1352)
Jul/Aug14
(n=2277)
Dec14/Jan 15(n=1,943)
Very good/good Neither good nor poor Poor/very poor DK
Base all respondents who have used the NHS Choices search function (as stated)
Under half say they have used the on-site search – a
decline of 5% points since the Jul 2014 survey
SINGLE CODE
Q. Please rate the usefulness of the NHS Choices search function
Used on-site search -5% points since Jul 2014
Base: all respondents: 4,387
44% %Very
good/good
Base
(those
who used
search)
Male 66% 436
Female 74% 1,316
24 and under 85% 193
25-54 74% 895
55+ 68% 660
LTC – Yes 73% 754
LTC – No 73% 867
Child aged 17 or
under – Yes 79% 420
Child aged 17 or
under – No 70% 1,522
At least monthly
user 79% 625
Less than
monthly user 72% 880
First time user 62% 328
Personal users 72% 1,795
Professionals 68% 147

Customer Insight Public Information 62
17% used the ‘find services’ search, with 35% looking for a GP,
and 20% looking for a service they defined as “other”
Q. Which service(s) were you looking for?
Used ‘find
services’
search
17%
MULTICODE
1%
2%
1%
1%
2%
6%
7%
5%
16%
15%
13%
16%
43%
1%
2%
2%
2%
4%
5%
8%
8%
14%
16%
18%
20%
35%
Optician
Support for carers
Maternity unit
Social care services*
Sexual health services
Mental health services
A&E
Pharmacy
Hospital
Dentist
Walk-in centre
Other
GP
Dec/Jan 15 (Base: 725)
Jul/Aug 14 (Base: 884)
Base: All respondents (4,384)
Used ‘find
services’ in
Jul 2014
19%
Base: All respondents (4,674)

Customer Insight Public Information 63
63% were satisfied with service info found
Dec 2014/Jan 2015
Total % of respondents identifying a reason for dissatisfaction with service
information
24% (n=173) – of these the reasons
were:
Difficulty finding info 50% (n=87)
Accuracy/reliability of info 10% (n=17)
Functionality 9% (n=16)
Amount of information 9% (n=15)
Patient reviews/comments (validity/how to do it) 3% (n=6)
Very satisfied/ satisfied with service info found 63% (65% in Jul 2014) Base: all those responding and who used search = 725
Q. How satisfied were you with the service information found?
Q. Why were you dissatisfied with the service information you found?

Customer Insight Public Information 64
How likely are users to be
satisfied with their visit to
NHS Choices + recommend it
and use it again?

Customer Insight Public Information 65
74% 73% 76%
72% 70% 71% 71% 68% 70%
12% 12% 13%
15% 12% 13% 14%
15% 14%
11% 14% 10% 12% 16% 15% 14% 16% 14%
0%
10%
20%
30%
40%
50%
60%
70%
80%
90%
100%
July 2010(n=2052)
Nov 2010(n=1534)
April 2011(n=2011)
Dec 2011(n=4047)
Aug 2012(n=2452)
May 2013(n=3147)
Dec 2013(n=2603)
Jul/Aug2014
(n=4674)
Dec 2014(n= 4386)
Very satisfied/satisfied Neither/nor Dissatisfied/very dissatisfied Don’t know
Overall satisfaction with the NHS Choices rose from last
wave’s decline
Q. Overall, how satisfied were you with your visit today?
Base all respondents (as stated)
SINGLE CODE
%Very
satisfied/sat
isfied
Base
Male 68% 1,013
Female 72% 2,973
24 and under 79% 597
25-54 73% 2,039
55+ 65% 1,365
LTC – Yes 70% 1,566
LTC – No 74% 2,114
Child aged 17
&/ under – Yes 76% 926
Child aged 17 &
under – No 69% 3,460
At least monthly
user 79% 1,325
Less than
monthly user 68% 2,034
First time user 64% 769
Personal user 70% 4,083
Professional 67% 303

Customer Insight Public Information 66
Visit dissatisfaction is mainly due to problems around the
amount & accuracy of info regarding symptoms and services
Reasons dissatisfied (613 mentions) % of
mentions/reasons
dissatisfied
No of mentions
(within reasons
dissatisfied)
No of mentions
as a reason for
coming to
Choices
Lack of definitive identification/advice
on symptoms
15% 92 1,519
Incomplete/inaccurate service
information
14% 84 658
Issues renewing EHIC link 1% 8 388
More information on long term
conditions
1% 5 130
Q. Why were you dissatisfied with your visit today?
Open ended

Customer Insight Public Information 67
90% 87% 90%
87% 87% 86% 86% 84% 88%
5% 6%
5% 7% 7% 7% 7% 8% 7%
5% 6% 4% 5% 5% 5% 6% 6%
0%
10%
20%
30%
40%
50%
60%
70%
80%
90%
100%
July 10(n=2052)
Nov/Dec10
(n=1534)
April 11(n=2011)
Dec 11(n=4047)
Jul/Aug12
(n=2452)
May 13(n=3147)
Dec13/Jan 14(n=2603)
Jul/Aug14
(n=4674)
Dec14/Jan 15(n=4382)
Definitely/Probably Not sure Definately/Probably not Don’t know
Along with the rise in satisfaction, there was a slight rise in
respondents saying they are likely to use the site again…
Q. How likely are you to use the NHS Choices website again?*
Base all respondents (as stated)
SINGLE CODE
%Definitely/
Probably Base
Male 84% 1,013
Female 90% 2,973
24 and under 93% 596
25-54 89% 2,039
55+ 83% 1,366
LTC – Yes 88% 1,566
LTC – No 89% 2,114
Child aged 17
and under - Yes 91% 926
Child aged 17
and under – No 86% 3,456
At least monthly
user 96% 1,324
Less than
monthly user 88% 2,035
First time user 73% 769
Personal users 87% 4,079
Professionals 87% 303

Customer Insight Public Information 68
…along with a slight rise in people being likely to recommend
the site to friends, colleagues or family members
Base all respondents (as stated)
83% 80% 81% 77% 77% 79% 76% 73% 79%
8% 8% 10%
10% 10% 9% 10%
11%
11%
7% 10% 8% 10% 12% 11% 12% 13%
10%
0%
10%
20%
30%
40%
50%
60%
70%
80%
90%
100%
July 2010(n=2052)
Nov 2010(n=1534)
April 2011(n=2001)
Dec 2011(n=4047)
Aug 2012(n=2452)
May 2013(n=3147)
Dec 2013(n=2602)
Jul/Aug2014
(n=4,674)
Dec/Jan2015
(n=4,379)
Definitely/Probably Not sure Definately/Probably not Don't know
Q. How likely are you to recommend this website to a friend, colleague or family member?*
SINGLE CODE
%Definitely/
Probably Base
Male 75% 1,013
Female 81% 2,973
24 and under 81% 595
25-54 82% 2,038
55+ 76% 1,365
LTC – Yes 80% 1,564
LTC – No 81% 2,113
Child aged 17 &
under – Yes 86% 925
Child aged 17 &
under – No 77% 3,454
At least monthly
user 88% 769
Less than
monthly user 78% 1,324
First time user 68% 2,032
Personal users 79% 4,076
Professionals 75% 303

Customer Insight Public Information 69
There is still a lot to like about NHS Choices – the overall ease
of use, easy to understand language and its
reliability/credibility
Easy to use 29% (n = 1k)
“It is very easy to access, easy to understand and has a very clear layout on the site”
Written simple language/easy to understand 16% (n = 540)
“High quality information without too much medical jargon”
Reliable, credible and trustworthy 15% (n = 524)
“Trust of information and a general feel that experts have been involved and not a celebrity endorsement”
Easy to navigate 10% (n = 352)
“pages are not "cluttered" with too much info. Easy to move back and forwards when finding out more information”
Right amount of information 2% (n = 61)
“It has all the information I need/ want”
Base: all responding users n= 3,408
Q. What do you like about NHS Choices? (top categories) OPEN ENDED

Customer Insight Public Information 70
BUT improvements are needed to increase user satisfaction –
improving navigation/search, information around symptoms and
accuracy of service data are priorities
None/ Don’t know 16% (n = 493)
Search/Navigation 12% (n = 375)
“Try to get your site at the top of search results, as a government dept this should be mandatory for search providers”
“Better search function for information on health conditions”
Better information around symptoms/improve symptom checker 10% (n = 302)
“Change the order of the 'previous' and 'next' buttons on the symptom checker”
“More options on symptom checker. Sometimes I may not have a symptom that is listed but still want to check
everything is ok”
“[Be] more symptom orientated with pictures”
Accuracy of info/How up to date the info is 8% (n = 288)
“More up to date information re: Gp's, dentists etc”
“To be more accurate in regards to local hospitals and what postcodes they cover as sometime it is most definitely
giving the wrong info”
Base: all responding users n= 3,028
OPEN ENDED
Q. What improvements would you recommend making to the NHS Choices website so that it better meets your needs? (top categories)

Customer Insight Public Information 71
Technical issues were also flagged alongside a lack of up to
date reviews
More/more detailed information 8% (n = 227)
“Have more information on children with illnesses”
“Need more information about the affects of different medications and symptoms
of overdosing, and the best way to get help”
Address technical issues of site 4% (n = 117)
“Pages could load a bit quicker”
“Open new tab when checking out a linked site”
Address or provide more up to date reviews and comments 4% (n= 105)
“I would like to see patients views given more focus and attention for a reply or comment”
“Encouraging more patients to review services - particularly GPs but also dentists, hospitals, etc”
OPEN ENDED Q. What improvements would you recommend making to the NHS Choices website so that it better meets your needs? (top categories)
Base: all responding users n= 3,028

Customer Insight Public Information 72
A note on those responding
to the survey via the
homepage and symptom
checker…

Customer Insight Public Information 73
Wave on wave findings – variation in key performance indicators among personal users responding to the survey via homepage vs. other URLs (all respondents)
Wave 9 - Homepage
(455)
Wave 10 – Homepage
(348)
Wave 9 – Other URLs
(4,176)
Wave 10 – other urls
(4,015)
Satisfaction with visit (Very
satisfied/satisfied) 70% 70% 67% 70%
Likelihood of
recommending
(Definitely/Probably)
75% 78% 74% 79%
Likelihood of using again
(Definitely/Probably) 87% 84% 85% 88%
Wave 9 - Homepage
(455)
Wave 10 – Homepage
(348)
Wave 9 – Other URLs
(4,176)
Wave 10 – other urls
(4,015)
Ease of use (Very
good/Good) 84% 84% 81% 84%
Attractiveness of design/
appearance (Very
good/Good)
77% 81% 72% 74%
Ease of finding information
(Very good/Good) 73% 71% 72% 74%
Information that was clear
and easy to understand
(Very good/Good)
77% 80% 78% 80%
Accurate and up-to-date
information (Very
good/Good)
66% 68% 63% 68%
Key metrics generally were stable or improved for both users coming from
the home page vs other urls: with the exception of “using the site again”

Customer Insight Public Information 74
Wave on wave findings – variation in key performance indicators among personal users responding to the survey via homepage vs. other URLs (all respondents)
Wave 10 – Homepage (348) Wave 10 – Symptom checker page
( 1,154) Wave 10 – other urls (2,860)
Satisfaction with visit (Very
satisfied/satisfied) 70% 63% 73%
Likelihood of recommending
(Definitely/Probably) 78% 77% 79%
Likelihood of using again
(Definitely/Probably) 84% 86% 88%
Wave 10 – Homepage (348) Wave 10 – Symptom checker page
( 1,154) Wave 10 – other urls (2,860)
Ease of use (Very good/Good) 84% 83% 84%
Attractiveness of design/appearance
(Very good/Good) 81% 71% 75%
Ease of finding information (Very
good/Good) 71% 71% 75%
Information that was clear and easy
to understand (Very good/Good) 80% 78% 80%
Accurate and up-to-date information
(Very good/Good) 68% 68% 69%
Users coming via the symptom checker page tend to be less positive
about key metrics than users who have come through other routes

Customer Insight Public Information 75
Questions and comments to:
please quote “Slideshare” in the subject line