july 14, 2004alexander marshak 3d error assessment and cloud climatology from modis r.f. cahalan, a....
TRANSCRIPT

July 14, 2004 Alexander Marshak
3D Error Assessment and Cloud Climatology from MODIS
R.F. Cahalan, A. Marshak (GSFC)
K.F. Evans (University of Colorado)
L. Oreopoulos, T. Várnai, G. Wen (UMBC)
Extend 3D retrieval capabilities for both passive (Terra and Aqua) and active (THOR lidar) remote sensing
1. Multiple-instrument Cloud-Aerosol I3RC Cases and 3D Toolkit [I3RC = (International) Intercomparison of 3D Radiation Codes2. 3D Error Assessment and Cloud Climatology from MODIS3. 3D Cloud Retrieval from MISR4. Cloud Retrievals from THOR (Thickness from Offbeam Returns)

July 14, 2004 Alexander Marshak
Task I: Multiple-instrument Cloud-Aerosol I3RC Cases and 3D Toolkit
Expected results
• Cloud cases from collocated MODIS, MISR and ASTER data• such cases are based directly on observed cloud fields;• all multi-instrument observed radiances are computable by “I3RC-certified” 3DRT codes;• the cases provide a basic for development of improved 3D retrievals.
• Open Source Toolkit (led by Robert Pincus)
• publicly documented MC Fortran code for 3DRT;• complements to widely used SHDOM.
• Educational pages on I3RC website (http://climate.gsfc.nasa.gov/I3RC/)
• case studies of different degrees of 3D complexity (from pp marine Sc to broken Cu) where students can learn about 3D RT and understand where and how pp approaches break down

July 14, 2004 Alexander Marshak
Multiple-instrument Cloud-Aerosol Casescase I: marine Sc (led by T. Varnai)
Images of the same marine Sc cloud from ASTER, MODIS and MISR taken on board of Terra on May 21, 2001 at 19:41 UTC over the Pacific Ocean
60 by 60 km ASTER image (nadir view, 15 m resolution)
60 by 60 km MODIS image (1 km and 250 m resolution)
60 by 60 km MISR image (275 m resolution, 26° and 60° viewing zenith angles)
0
5
10
15
20
25
30
35
-2 0 2 4 6 8 10 12
log2k
slope = -1.7
slope = -2.1
1 0.060.251664
ASTER
MODIS
MISR
4
26° view
60° view
Scale (km)
b
Wavenumber spectrum of variations in all five images

July 14, 2004 Alexander Marshak
Multiple-instrument Cloud-Aerosol Casescase II: biomass burning (led by G. Wen)
Biomass burning region in Brazil, Aug. 9, 2001 centered at -17.10 Lat and -42.16 Lon

July 14, 2004 Alexander Marshak
Multiple-instrument Cloud-Aerosol Casescase II: biomass burning (led by G. Wen)
ASTER (VNIR 15 m and SWIR 30 m)
MISR (0.67 m)0.275 km resolution (in nadir)
Cf (60o)
An (0o)
Ca (60o)
MODISRGB = 2.2, 0.86, 0.55 m
Biomass burning region in Brazil, Aug. 9, 2001 centered at -17.10 Lat and -42.16 Lon
60 km
1 km resolution
0.25 km resolution

July 14, 2004 Alexander Marshak
Task II: 3D Error Assessment and Cloud Climatology from MODIS
Expected Results
• Error bounds that cloud horizontal variability introduces into retrievals
• Climatic distribution of 3D effects

July 14, 2004 Alexander Marshak
Illustration of “illuminated” and “shadowy” pixels
(led by Tamas Varnai)
275
274
273
271
276
274
273
275
275
272
274
273
271
272
273
274
275
274
273
271
276
274
273
275
275
272
274
273
271
272
273
274
Example with pixels’ temperature
front front
behindbehind
X
Cold
Warm ILL SHAD

July 14, 2004 Alexander Marshak
3D Error Assessment: Example
An example of 450x200 km2 area observed by MODIS with VIS and IR channels. The area has been divided into 36 areas of 50x50 km2 each.
0.86 µm reflectance
11 µm brightness temperature

July 14, 2004 Alexander Marshak
Number of pixels
0
500
1000
1500
2000
2500
3000
0 400 800 1200 1600
# of illum. pxls # of shad. pxls
# of "pixels" per 50x50 km2 area
# of “illuminated” and “shadowed” pixels (total #: 107+) in 50x50 km2 areas
are statistically equal

July 14, 2004 Alexander Marshak
Symmetry at 11 m
So is IR brightness temperature

July 14, 2004 Alexander Marshak
Asymmetry at 0.86 and 2.1 m
Each dot corresponds to a 50x50 km2 area. Averaged reflectancies over “illuminated” pixels are plotted vs. “shadowed” ones.
The ill. slopes are much brighter than the shad. ones!

July 14, 2004 Alexander Marshak
Effects on and reff
Comparison of mean optical depth, , and mean effective radius, reff, at the illuminated and shadowed portion of 50 by 50 km areas
3D effects may have a strong influence!

July 14, 2004 Alexander Marshak
Example of climatic distribution of 3D effects
0
20
40
60
80
100
-100 -50 0 50 100
Ocean
Land
Cumulative histogram, P(x<D
r
) (%)
Relative difference, D
r
(%)
0.01
0.1
1
10
100
-10 0 10 20 30 40
Histogram value
TS
-
AS
Comparison of the histograms of the cloud asymmetry in optical depth retrieved from clouds over land and ocean. The inset shows the histograms of the asymmetry vs. differences between average optical depths of illuminated and shadowed pixels, TS and AS, respectively.

July 14, 2004 Alexander Marshak
“Forward” vs. “Backward” scattering
from Loeb and Coakley (1998)
Based on AVHRR data
from Buriez et al. (2001)
Based on Polder data
Earlier studies on 3D effect: For oblique sun, clouds appear too thick & forward reflection is too low
July 14, 2004 Alexander Marshak
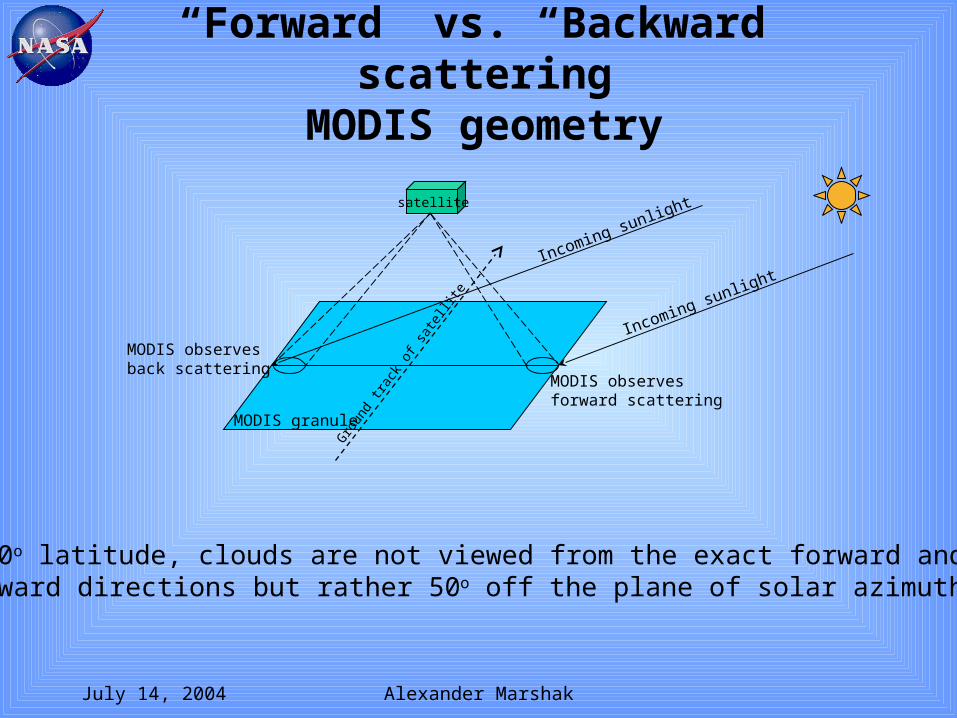
“Forward” vs. “Backward” scatteringMODIS geometry
MODIS granule Gro
und
track
of s
atel
lite
satellite
Incoming sunlight
Incoming sunlight
MODIS observesforward scattering
MODIS observesback scattering
At 40o latitude, clouds are not viewed from the exact forward and backward directions but rather 50o off the plane of solar azimuth

July 14, 2004 Alexander Marshak
“Forward” vs. “Backward” scatteringMODIS data
0.0
5.0 105
1.0 106
1.5 106
2.0 106
40 45 50 55 60 65 70 75 80
Solar zenith angle (°)
Nov. 1, 8, 15, 22, 29 in 2000, 2001, 2002, 2003.10 MODIS granules from Terra in 2000 and 2001 and from both Terra and Aqua in 2002 and 2003. Total: 300 granules. Form a ring around the Earth at roughly 40o North. Liquid clouds only with > 2.

July 14, 2004 Alexander Marshak
“Forward” vs. “Backward” scatteringMODIS data
-50 -25 0 25 50
40
50
60
70
80
Viewing zenith angle (°)
Solar zenith angle (°)
0 13 25 38 50Mean optical thickness
15
16
17
18
19
20
-60 -40 -20 0 20 40 60
Results after the influence of various SZA is equalized across the track
Viewing zenith angle (°)Back scatter Forward scatter
Mean optical depth as a function of SZA and VZA
Mean optical depth (normalized by SZA) as a function of VZA

July 14, 2004 Alexander Marshak
“Forward” vs. “Backward” scatteringMODIS data: saturated pixels
0.01
0.02
0.03
0.04
0.05
0.06
0.07
0.08
-60 -40 -20 0 20 40 60
(°)Viewing zenith angle Back scattering Forward scattering
Fraction of “saturated” pixels as a function of VZA

July 14, 2004 Alexander Marshak
Climatic distribution of 3D effects(led by Lazaros Oreopoulos)
• Latitudinal variation (-70° to 70°) of inhomogeneity parameter of Cahalan (1994) and optical depth for water clouds from MODIS data.
• Variations of optical depth are possibly exaggerated due to biases in optical depth retrievals under oblique illumination.
• 3D retrievals are needed to remove such biases.
0.4
0.5
0.6
0.7
0.8
0.9
0
10
20
30
40
50
60
-60 -40 -20 0 20 40 60
March 2001
latitude
0.4
0.5
0.6
0.7
0.8
0.9
0
10
20
30
40
50
60
-60 -40 -20 0 20 40 60
2001 - 2002March February
latitude
from the histogram of optical depth for the entire month
the average for an entire year of monthly values
=exp(lnτ )
τ

July 14, 2004 Alexander Marshak
Task II: Conclusion
• Statistical asymmetry is a direct signature of cloud 3D structure that cannot be taken into account in 1D retrievals:
• Estimate the errors that horizontal cloud variability introduces into retrievals of cloud properties;
• Study the climatology of 3D effects by analyzing how cloud 3D structure varies with geographical region, season and climatic conditions.

July 14, 2004 Alexander Marshak
Task III: 3D Cloud Retrievals from MISR(led by Frank Evans)
Expected results
• 3D algorithm for cloud optical depth and top height retrievals
• Importance of textural and angular parameters for optical depth and height
• Estimates of improvements

July 14, 2004 Alexander Marshak
3D Cloud Retrievals from MISR3D cloud retrieval algorithm
The liquid water path (LWP) from LES cloud fields is shown in the upper left.
The middle left has the LWP fields for one of the stochastic fields generated with statistics of the 8 LES fields.
The stochastic field with a grid spacing of 67 m is averaged 4x4 columns to obtain the MISR nadir resolution optical depth and cloud top height shown in the lower left.
Reflectances at the nine MISR angles are computed with the SHDOM 3D radiative transfer code.
The reflectances at MISR resolution for the five angles used in the retrieval simulation are shown in the right column.

July 14, 2004 Alexander Marshak
Task IV: THOR Lidar Retrievals(led by Bob Cahalan and Tamas Varnai)
•Objectives - Measure geometrical thickness of optically thick clouds
•Accomplishments - Measured cloud geometric thicknesses: 500–1000 m ± 30 m, > 25
•Exp. results - algorithms for cloud geometrical thickness and extinction retrievals

July 14, 2004 Alexander Marshak
THOR Color Composite (R,G,B) = (1,7,8)
NASA P-3B at 8.53 km
0
2
4
6
8
Ch4
Ch3 Ch7
Thin Cirrus Cloud Layer
Thick Lower Stratus Deck
500
600
700
800
900
1000
500 600 700 800 900 1000
8060 m5020 m7320 m8540 m
THOR + ARM estimate (m)
Flight altitude:

July 14, 2004 Alexander Marshak
3D Error Assessment and Cloud Climatology from MODIS
A. Marshak, R.F. Cahalan (GSFC)
K.F. Evans (University of Colorado)
L. Oreopoulos, T. Várnai, G. Wen (UMBC)
Extend 3D retrieval capabilities for both passive (Terra and Aqua) and active (THOR lidar) remote sensing
1. Multiple-instrument Cloud-Aerosol I3RC Cases and 3D Toolkit [I3RC = (International) Intercomparison of 3D Radiation Codes2. 3D Error Assessment and Cloud Climatology from MODIS3. 3D Cloud Retrieval from MISR4. Cloud Retrievals from THOR (Thickness from Offbeam Returns)