july 10, 2013 | nepool markets committee
DESCRIPTION
JULY 10, 2013 | NEPOOL MARKETS COMMITTEE. Ben Ewing. MARKET DEVELOPMENT [email protected] 413.535.4361. Analysis of out-of-merit compensation under Offer Flexibility NCPC design. And alternate NCPC credit methodology requested by Markets Committee. - PowerPoint PPT PresentationTRANSCRIPT
JULY 10, 2013 | NEPOOL MARKETS COMMITTEE
Ben EwingMARKET DEVELOPMENT
Analysis of out-of-merit compensation under Offer Flexibility NCPC design. And alternate NCPC credit methodology requested by Markets Committee.
NCPC Payments Major Initiative Impact Analysis Results
Matt BrewsterMARKET DEVELOPMENT

BACKGROUNDOverview of the purpose for the Impact Analysis and high-level assumptions utilized in the analysis
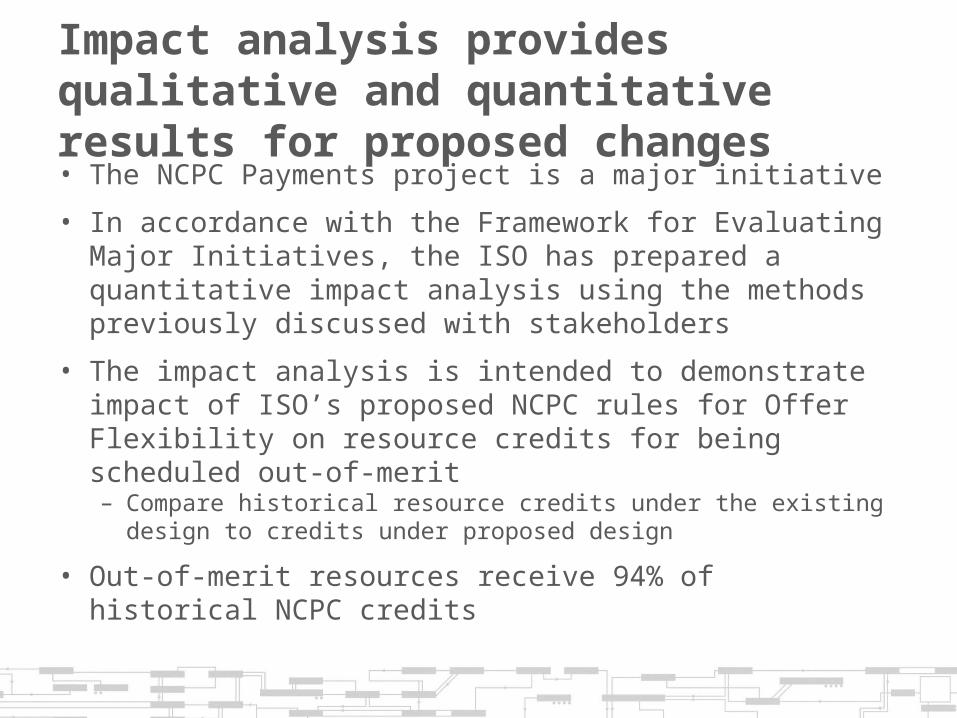
Impact analysis provides qualitative and quantitative results for proposed changes• The NCPC Payments project is a major initiative
• In accordance with the Framework for Evaluating Major Initiatives, the ISO has prepared a quantitative impact analysis using the methods previously discussed with stakeholders
• The impact analysis is intended to demonstrate impact of ISO’s proposed NCPC rules for Offer Flexibility on resource credits for being scheduled out-of-merit– Compare historical resource credits under the existing design to
credits under proposed design
• Out-of-merit resources receive 94% of historical NCPC credits

Assumptions used for Impact Analysis
• Study period: 2010 – 2012 calendar years
• Resource credits calculated under the Offer Flexibility NCPC rules are based on historical energy market data
• DA and RT commitment Decision Intervals are modeled using available data (e.g., day-ahead or RT schedule, min run time)
• Self-scheduled resources are treated as energy offer of floor price ($0/MWh) at requested dispatch level, No Load and Start-Up fees of $0
• Default commitment reason is 1st contingency (“economic”) when unspecified
4

Participants requested alternative analyses
• As part of major initiative process, participants may propose alternative analyses to perform. The ISO received two such requests:
• Examine upper bound on NCPC Credits– Use of hourly accounting periods
• Consider Start-Up and No Load costs in DA NCPC.
5

OUT-OF-MERIT NCPC CREDITS UNDER OFFER FLEXIBILITY DESIGN PROPOSAL RESULTSOffer Flexibility NCPC credit estimates are directionally consistent with expectations: decreased DA NCPC; increased RT NCPC particularly for flexible resources; and overall increase in NCPC payments
6
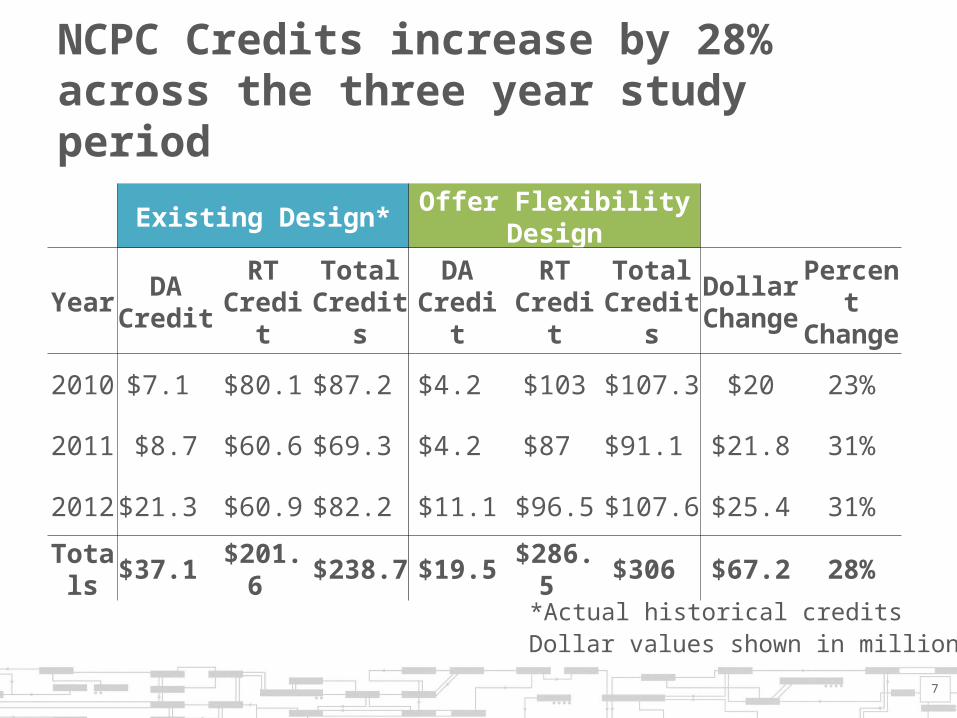
NCPC Credits increase by 28% across the three year study period
Existing Design* Offer Flexibility Design
Year DACredit
RTCredit
Total Credits
DACredit
RTCredit
Total Credits
Dollar Change
Percent Change
2010 $7.1 $80.1 $87.2 $4.2 $103 $107.3 $20 23%
2011 $8.7 $60.6 $69.3 $4.2 $87 $91.1 $21.8 31%
2012 $21.3 $60.9 $82.2 $11.1 $96.5 $107.6 $25.4 31%
Totals $37.1 $201.6 $238.7 $19.5 $286.5 $306 $67.2 28%
Dollar values shown in millions*Actual historical credits
7
Resources dispatched out-of-merit are a small percentage of RT Credits
8
Offer Flexibility Design
Dollar Values Percentage of Total Credit
Year DACredit
RTCommit Credit
RT Dispatch Credit
DACredit
RTCommit Credit
RT Dispatch Credit
TotalCredit
2010 $4.2 $98.8 $4.2 4% 92% 4% $107.2
2011 $4.2 $81.1 $5.9 5% 89% 6% $91.2
2012 $11.1 $92.1 $4.4 10% 86% 4% $107.6
Totals $19.5 $272 $14.5 6% 89% 5% $306
Dollar values shown in millions

NCPC Credits increase total Energy Market cost by less than 1% annually
9
Existing Design Offer Flexibility Design
Year Total Energy Market Value
NCPC Credits
Percent of Energy Market
NCPC Credits
Percent of Energy Market
2010 $6,630 $87.2 1.3% $107.3 1.6%
2011 $6,170 $69.3 1.1% $91.1 1.5%
2012 $4,770 $82.2 1.7% $107.6 2.3%
Dollar values shown in millions
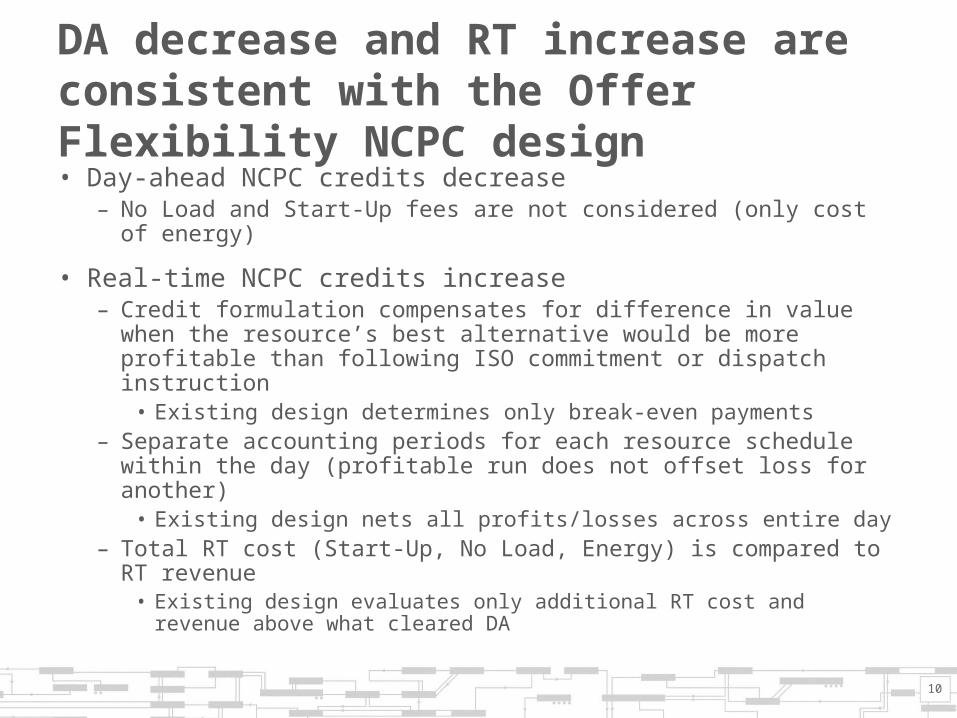
DA decrease and RT increase are consistent with the Offer Flexibility NCPC design• Day-ahead NCPC credits decrease
– No Load and Start-Up fees are not considered (only cost of energy)
• Real-time NCPC credits increase– Credit formulation compensates for difference in value when the
resource’s best alternative would be more profitable than following ISO commitment or dispatch instruction• Existing design determines only break-even payments
– Separate accounting periods for each resource schedule within the day (profitable run does not offset loss for another)• Existing design nets all profits/losses across entire day
– Total RT cost (Start-Up, No Load, Energy) is compared to RT revenue• Existing design evaluates only additional RT cost and revenue above
what cleared DA
10

Flexible resources account for large percentage of increased NCPC Credits
11
Start Time(hours)
Existing DesignTotal Credits
Offer FlexibilityTotal Credits
Dollar Change
PercentChange
<=1 $42.5 $59.9 $17.4 41%
<=4 $20.1 $25.1 $5.0 25%
<=8 $49.9 $79.1 $29.2 58%
> 8 $126.3 $141.9 $15.6 12%
Start Time (hours) = Cold Notification time + Cold Startup time
Dollar values shown in millions
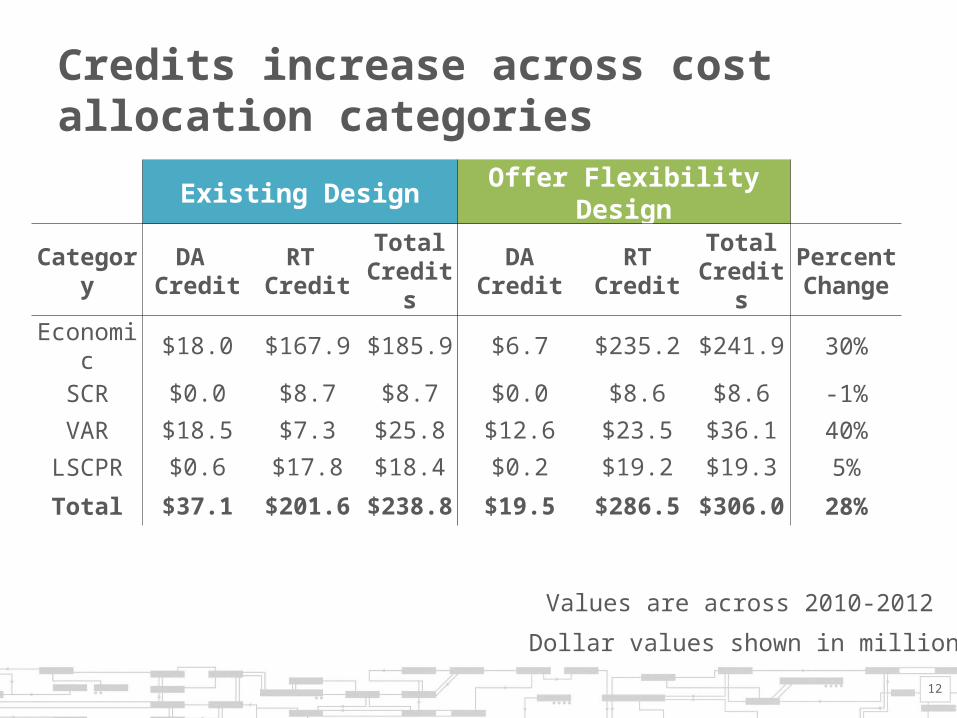
Credits increase across cost allocation categories
12
Existing Design Offer Flexibility Design
Category DA Credit
RT Credit
Total Credits
DACredit
RTCredit
Total Credits
Percent Change
Economic $18.0 $167.9 $185.9 $6.7 $235.2 $241.9 30%
SCR $0.0 $8.7 $8.7 $0.0 $8.6 $8.6 -1%
VAR $18.5 $7.3 $25.8 $12.6 $23.5 $36.1 40%
LSCPR $0.6 $17.8 $18.4 $0.2 $19.2 $19.3 5%
Total $37.1 $201.6 $238.8 $19.5 $286.5 $306.0 28%
Dollar values shown in millions
Values are across 2010-2012

Accounting period and hourly credit allocation impact changes among NCPC categories
• NCPC design for Offer Flexibility introduces two changes that influence the credits assigned to cost allocation categories1) Separate accounting periods significantly reduce the
blending of NCPC costs across commitment reasons– Distinct periods of operation generally have a single reason
2) NCPC credits are allocated pro rata to hours of net loss– Refer to explanation of Hourly NCPC Credit within
June 2013 MC presentation beginning at slide 5
• Both mechanisms more directly align NCPC cost with the reason for out-of-merit operation
13

ALTERNATE METHOD 1 RESULTSAnalysis to estimate an upper-bound on NCPC credit increase as a result of sub-daily accounting periods
14

Results demonstrate that sub-daily accounting periods increase NCPC Credits• Modified assumptions for this analysis:
– Resource Minimum Run Time treated as a single accounting period, with each subsequent hour as a separate accounting period
– In each hourly accounting period with a net loss, resource paid to break-even on cost (crude best-alternative formulation)
15
Dollar values shown in millions
Existing Design Offer Flexibility Alternative Method 1
Year Total Credits
Total Credits
Percent Change
Total Credits
Percent Change
2010 $87.2 $107.3 23% $123.9 42%
2011 $69.3 $91.1 31% $105.8 53%
2012 $82.2 $107.6 31% $125.7 53%
Totals $238.7 $306 28% $355.4 49%

ALTERNATIVE METHOD 2 RESULTSUses a compensation methodology where Start-Up and No Load fees for DA schedules are considered for DA Credit
16
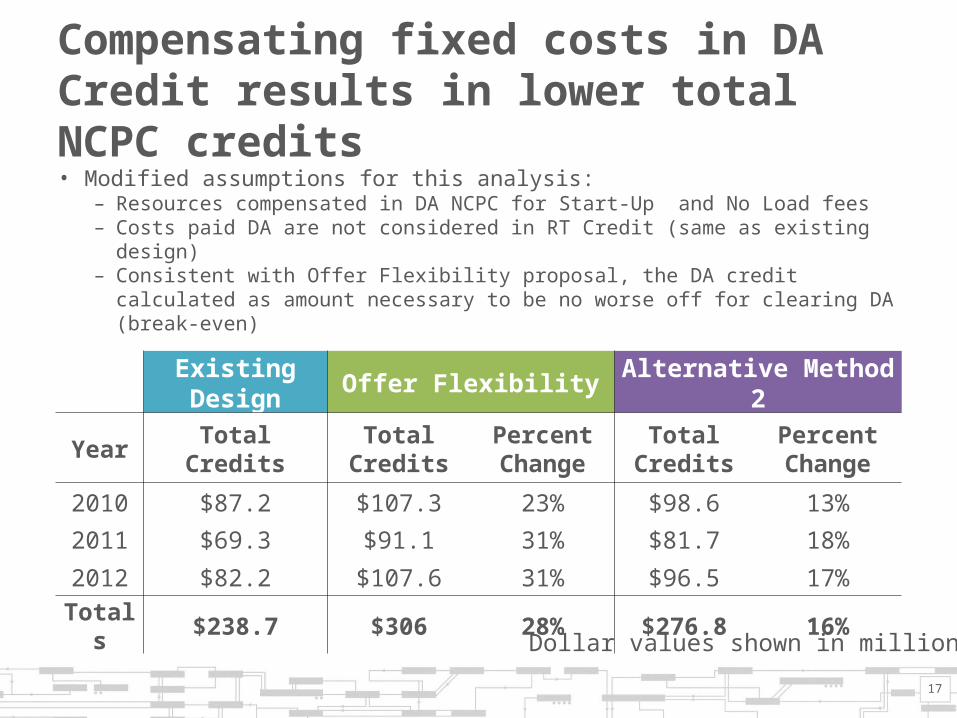
Compensating fixed costs in DA Credit results in lower total NCPC credits• Modified assumptions for this analysis:
– Resources compensated in DA NCPC for Start-Up and No Load fees– Costs paid DA are not considered in RT Credit (same as existing design)– Consistent with Offer Flexibility proposal, the DA credit calculated as
amount necessary to be no worse off for clearing DA (break-even)
17
Existing Design Offer Flexibility Alternative Method 2
Year TotalCredits
TotalCredits
PercentChange
TotalCredits
Percent Change
2010 $87.2 $107.3 23% $98.6 13%
2011 $69.3 $91.1 31% $81.7 18%
2012 $82.2 $107.6 31% $96.5 17%
Totals $238.7 $306 28% $276.8 16%
Dollar values shown in millions

Historical Start-Up and No Load fees considered for DA NCPC in excess of incurred RT costs are small
• Method for determining these values:– DA schedule start not matched by RT actual start means the Start-Up
cost considered in DA NCPC was not incurred RT– DA scheduled hours not matched by RT actual operation means the
No Load cost considered in DA NCPC was not incurred RT
18
Dollar values shown in millions
Existing Design DA NCPC Cost not incurred RT
Year Total Credits Start-Up fees No Load fees
2010 $87.2 $0.94 $1.9
2011 $69.3 $1.52 $2.4
2012 $82.2 $0.9 $2.3
Totals $238.7 $3.36 $6.6