september 4-5, 2014 | nepool markets committee
DESCRIPTION
September 4-5, 2014 | NEPOOL MARKETS COMMITTEE. Matt Brewster. Market development 413.540.4547 | [email protected]. Design changes to accompany system and capacity zone sloped demand curves. FCM Sloped Demand Curve: Reconfiguration Auctions and CSO Bilaterals. - PowerPoint PPT PresentationTRANSCRIPT

S E P T E M B E R 4 - 5 , 2 0 1 4 | N E P O O L M A R K E T S C O M M I T T E E
Matt BrewsterM A R K E T D E V E L O P M E N T
4 1 3 . 5 4 0 . 4 5 4 7 | M B R E W S T E R @ I S O - N E . C O M
Design changes to accompany system and capacity zone sloped demand curves
FCM Sloped Demand Curve:Reconfiguration Auctions and CSO Bilaterals
Status of Capacity Zone demand curves project
• ISO & Brattle received a significant number of requests and are still in the process of performing analysis– ISO has requested Brattle perform additional modeling– Without completed analysis, candidate curves can’t be fully vetted– Discussion will resume at October MC
• Today, ISO will discuss:– Design proposals for reconfiguration auctions, CSO bilaterals, and
capacity backstop measures
2
Design changes to accompany system and capacity zone sloped demand curves
• CSO Bilateral Transactions (slide 4)
• Reconfiguration Auctions (slide 8)– Annual auctions– Monthly auctions
• Capacity Backstop Measures (slide 13)
3
CSO BILATERALSConforming rules for capacity zone sloped demand curves
5
Proposed changes to CSO bilateral rules for capacity zone sloped demand curves
• Beginning with Commitment Period 2019/20 (CCP10)– Trades between resources in separate capacity zones only allowed to
transfer CSO in direction of modeled interface constraint• e.g., resource in NEMA cannot transfer CSO to rest-of-pool resource
– Same as presently effective rules for trades between zones
• Not changing– Other administration rules: e.g., bilateral schedule, reliability review,
requirements to participate– Settlement: CSO bilaterals not included in Net Regional Clearing Price
6
Proposed rules require that acquiring resource provide capacity of equal or greater value
• Prevent inefficient allocation of CSO and bilateral trades from resources receiving higher auction price (in import-constrained zones) to resources outside of that zone where capacity price is lower– Example on next slide
• Value of capacity may differ across capacity zones depending upon demand and supply conditions in each zone
• Capacity located in import-constrained areas is obligated to perform for both local and system Capacity Scarcity Conditions
• Suppliers can enter their offers to acquire or shed obligations (without identifying a counterparty) into reconfiguration auctions where market can produce the efficient allocation of CSO based on price and respecting value of capacity in different zones
7
Example of inefficient bilateral to shed capacity from higher value resource• Assume
– Bilateral trades were allowed from import-constrained zone to rest-of-pool– FCA clearing prices:
• Import-constrained zone = $12/kW-month• Rest-of-pool = $8/kW-month
• Suppliers agree to transfer 10 MW of FCA CSO from Resource A in import-constrained zone to Resource B in rest-of-pool for $10/kW-month
• Consumers no longer receive the higher value product (capacity in the import-constrained area) but will nevertheless pay Resource A– Consumers charged $120k (= $12/kW-mo x 1000 x 10MW) for Resource A FCA CSO– Resource A is debited $100k (= $10/kW-mo x 1000 x 10MW) to credit Resource B– Consumers receive no refund for capacity shed by Resource A
• Supplier with Resource A profits by $20k ($120k - $100k) and no longer has a CSO obligation to provide capacity
• Supplier with Resource B acquires a CSO at above the price consumers were willing to pay for its capacity (assuming Resource B did not receive a CSO in the FCA because its offer was above the clearing price)

RECONFIGURATION AUCTIONSProposed rules for sloped demand curves
Proposed annual reconfiguration auction (ARA) changes to accompany sloped demand curves
• Beginning with Capacity Commitment Period 9 (CCP9) (2018/19), system-wide demand curve included in each annual reconfiguration auction (ARA)
• Beginning with CCP10 (2019/20), system-wide and capacity zone demand curves included in each ARA
• Demand curve quantity parameters will be updated consistent with restudied ICR values (same as current)
• Demand curve price parameters from FCA will be held constant for each ARA (same as current)
• Sloped demand curves replace ISO submitted bids and offers to true-up supply to 100% of capacity requirements (ICR, LSR)– For CCP9, current rules for ISO bids/offers remain for capacity zones
9
10
ARA proposed rules will not significantly alter the existing auction structure
• Applying sloped demand curves in each ARA is consistent with current practice of applying ICR, LSR, MCL requirements
• Maintains objective to define demand in the reconfiguration auctions consistent with the FCA– With multiple forward auctions, there must be a consistent definition of demand
to prevent expectations of changes in market prices
• ARA continues to allow suppliers opportunity to adjust their capacity obligations prior to commitment period– Suppliers submit supply offers (to acquire CSO) and demand bids (to shed)– Supply offers and demand bids will not require an offsetting resource offer/bid in
order to be cleared in the ARA
• CSO exchanged in the ARA are credited/debited at the ARA auction clearing price and included in Net Regional Clearing Price
11
No change proposed for monthly reconfiguration auction (MRA) to accompany sloped demand curves
• No change to monthly reconfiguration auction (MRA)
• MRA allows suppliers opportunity to adjust their capacity obligations on a monthly basis– Submit supply offers (to acquire) and demand bids (to shed) – Clearing requires an offsetting resource bid/offer in the auction
• Total system-wide capacity cannot change in MRA (cleared supply must equal cleared demand)
• CSO can be traded across capacity zones respecting zonal resource requirements (LSR, MCL)
• CSO exchanged in MRA are credited/debited at the MRA auction clearing price and included in Net Regional Clearing Price
12
Current MRA rules allow suppliers flexibility to exchange CSO without inefficient substitution
• Suppliers can trade CSO among resources within zones and across zones through a market mechanism
• Suppliers compete based on price to utilize limited interface transfer capability– When constraints bind, refund is credited to consumers
• Zonal reliability requirements are maintained (LSR, MCL)
• FCA sloped demand curves are designed to reflect annual valuation of capacity obligations– Monthly value of CSO may vary such that efficient trades might be
prevented by imposing FCA demand curves in MRA
CAPACITY BACKSTOP MEASURESProposal to establish mechanisms for responding to market outcomes where supply is below capacity requirements
14
Backstop calls for evaluation when FCA short of requirements, and possible RFP after ARA
• If system-wide capacity in FCA is below Net ICR, or import capacity is below LSR, ISO will evaluate cause of the shortage and recommend adjustments, as appropriate
• If supply conditions persist through ARA, ISO will investigate need to pursue RFP to address the capacity shortage
• ISO expects process of recommending market adjustments would occur through stakeholder process
• RFPs would be conducted under §III.11 which requires consultation with Reliability Committee and FERC approval
15
Two-tiered backstop mechanism is intended to provide measured, transparent response
• Prospective, market-based adjustments when FCM is not able to secure required capacity supply (market objective)
• Short-term gap RFPs when there is a probable threat to system reliability that cannot be resolved by other means
• Impossible to forecast a threshold that will be acceptable for lower reliability in any commitment period– Case-by-case analysis will be necessary
• ISO is cognizant that drastic market changes between auctions and out-of-market purchases would not be healthy for FCM

APPENDIX

17
ARA Example 1: no change to supply and demand between FCA and ARA• Resources A and B have an ARA
offer at the same price as their FCA offer
• Demand has not changed between FCA and ARA
• Total quantity of CSO purchased and clearing prices are not changed
– PARA = PFCA
– QARA = QFCA
• Resource A clears in both the FCA and ARA (keeps its CSO)
• Resource B does not clear in either the FCA or ARA (no CSO)
ARA demand = FCA demand
ARA clearing example 1
18
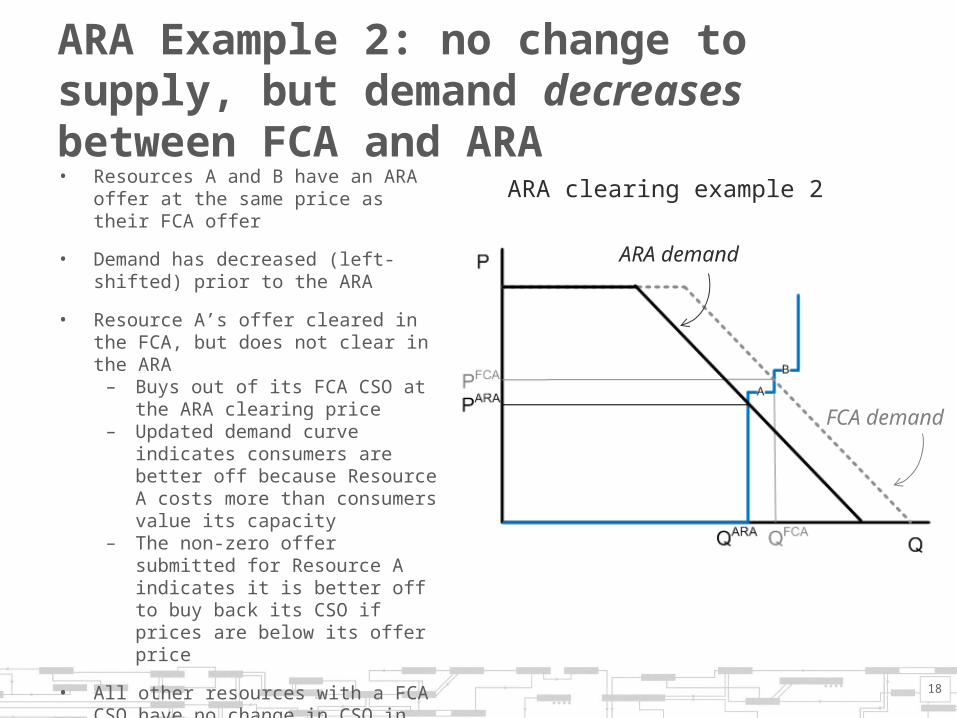
ARA Example 2: no change to supply, but demand decreases between FCA and ARA• Resources A and B have an ARA offer at the
same price as their FCA offer
• Demand has decreased (left-shifted) prior to the ARA
• Resource A’s offer cleared in the FCA, but does not clear in the ARA
– Buys out of its FCA CSO at the ARA clearing price
– Updated demand curve indicates consumers are better off because Resource A costs more than consumers value its capacity
– The non-zero offer submitted for Resource A indicates it is better off to buy back its CSO if prices are below its offer price
• All other resources with a FCA CSO have no change in CSO in the ARA and will be paid the FCA price
FCA demand
ARA demand
ARA clearing example 2
19
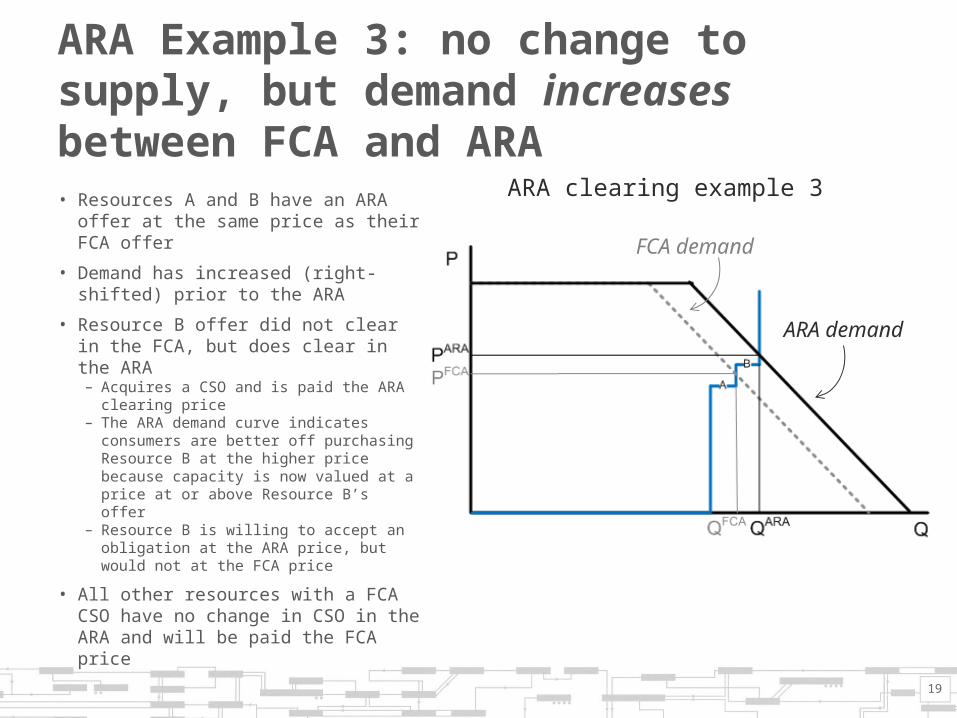
ARA Example 3: no change to supply, but demand increases between FCA and ARA
• Resources A and B have an ARA offer at the same price as their FCA offer
• Demand has increased (right-shifted) prior to the ARA
• Resource B offer did not clear in the FCA, but does clear in the ARA
– Acquires a CSO and is paid the ARA clearing price
– The ARA demand curve indicates consumers are better off purchasing Resource B at the higher price because capacity is now valued at a price at or above Resource B’s offer
– Resource B is willing to accept an obligation at the ARA price, but would not at the FCA price
• All other resources with a FCA CSO have no change in CSO in the ARA and will be paid the FCA price
ARA demand
FCA demand
ARA clearing example 3
20
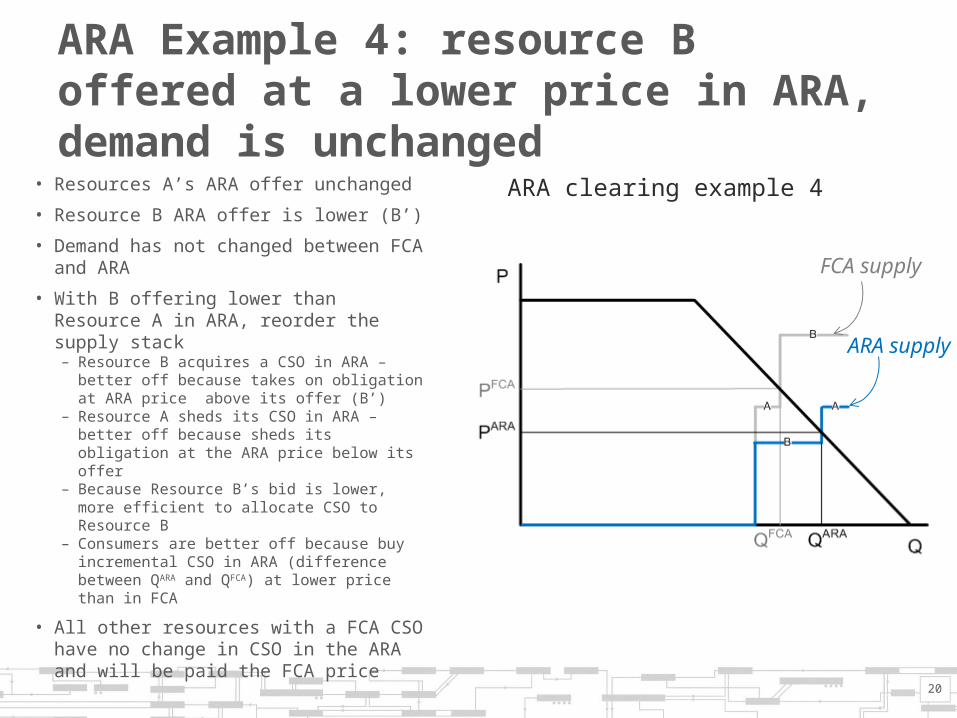
ARA Example 4: resource B offered at a lower price in ARA, demand is unchanged
• Resources A’s ARA offer unchanged
• Resource B ARA offer is lower (B’)
• Demand has not changed between FCA and ARA
• With B offering lower than Resource A in ARA, reorder the supply stack
– Resource B acquires a CSO in ARA – better off because takes on obligation at ARA price above its offer (B’)
– Resource A sheds its CSO in ARA – better off because sheds its obligation at the ARA price below its offer
– Because Resource B’s bid is lower, more efficient to allocate CSO to Resource B
– Consumers are better off because buy incremental CSO in ARA (difference between QARA and QFCA) at lower price than in FCA
• All other resources with a FCA CSO have no change in CSO in the ARA and will be paid the FCA price
ARA supply
FCA supply
ARA clearing example 4
21
Applying FCA demand curves in the MRA would be inconsistent with monthly value of capacity
• FCA price of $5/kW-month implies capacity is valued at $5 on average but not each month– For all 12 months capacity is valued at $60/kW-year ($5 x 12)
• Consumers would likely pay a higher price in peak months and a lower price in shoulder months
• An offer of $5/kW-month in the FCA, does not mean supplier would accept a CSO at this price in individual months– Would likely offer a higher price in peak months (when more scarcity
hours are expected to occur) and a lower price in shoulder months
FCA demand curves in MRA without fixing total system capacity leads to inefficient procurement
• Assume we apply FCA demand curves for each MRA and allow total system capacity amount to increase or decrease (not ‘fixed’)
• Simple clearing rules– Demand bids must be above price set by FCA demand curves– Supply bids must be below price set by FCA demand curves
• In peak months with high scarcity events, suppliers with CSO will submit high price demand bids (to shed)– Require high price to keep CSO with high probability of scarcity events– Total capacity decreases when it is most important to system reliability
• In shoulder months with low scarcity events, suppliers without CSO will submit low price supply offers (to acquire)– Require low price to take on CSO with low probability of scarcity events– Total capacity increases when it is least important to system reliability
22
FCA demand curves when requiring total system capacity remain fixed would inefficiently limit trades
• Assume we apply FCA demand curves for each MRA but do not allow total system capacity amount to increase or decrease (‘fixed’)
• Simple clearing rules– Demand bids must be above price set by FCA demand curves– Supply bids must be below price set by FCA demand curves
• In peak months with high scarcity events, supply offers and demand bids will likely both be above price set by FCA demand curves
• In shoulder months low scarcity events, supply offers and demand bids will likely both be below price set by FCA demand curves
• In both peak and shoulder months, no trades occur even when allowing them would be efficient and not harm reliability
23