julia berger hydratation des argiles gonflantes et...
TRANSCRIPT

THÈSE
Présentée en vue de l’obtention du grade de
DOCTEUR DE L’UNIVERSITÉ LOUIS PASTEUR
Sciences de la Terre et de l’Univers
Physique, Chimie et Biologie de l’Environnement
par
Julia Berger
Hydratation des argiles gonflantes et influence des bactéries Etude expérimentale de réaction in situ
Hydration of swelling clay and bacteria interaction An experimental in situ reaction study
soutenue publiquement le 31 janvier 2008 Mme Faïza Bergaya DR CNRS, Orléans Rapporteur Externe Mme Françoise Elsass IR INRA, Versailles Examinateur Mme Marie-Claire Lett Professeur, ULP Strasbourg Rapporteur Interne Mr Frédéric Villieras DR, CNRS, Nancy Rapporteur Externe Mr Laurence N. Warr Professeur, Greifswald Directeur de thèse
ECOLE ET OBSERVATOIRE DES SCIENCES DE LA TERRE
CENTRE DE GEOCHIMIE DE LA SURFACE (UMR 7517)


Von der Mehrzahl der Werke bleiben nur die Zitate übrig, warum nicht also von Anfang an nur die Zitate aufschreiben…? (Stanislaw Jerzy Lec)

Acknowledgements This work was financed by a three years grant of the french ministery of research.
I`d like to thank my supervisor Laurence Warr, who brought me to Strasbourg and proposed me to work on this fascinating project. His ideas were always creative and he transmitted especially this creative scientific approach to me. Thank you for all support especially at initial stages of the PhD project. I would like as well to thank Norbert Clauer who helped enormously when I did the application for this grant. I would like to thank François Gauthier-Lafaye for the welcome in the CGS and François Chabaux as director of the ecole doctorale. Thanks as well to Daniel Tessier for the welcome in Versailles at the TEM facility. A special Thank to Marie-Claire Lett and her team for having me invited to use the facilities of the microbiology institute. Whenever I had questions or I needed other support I felt welcomed. Here a special thank to Sandrine who was very patient with the “non-frenchspeaking non-microbiologist”.
I`d like to thank all members of the Jury Faïza Bergaya, Françoise Elsass, Marie-Claire-Lett and Frédéric Villieras for having accepted to judge the thesis, for compliments and for constructive criticism.
A very special thanks to the Geoparticles Group that received me warmly and although at the beginning my French was limited to “Bonjour” the communication was not disturbed and increasing understanding followed. Here a special thank to Jean-Luc who was extremely patient and who never got tired talking to me and later with me as soon as the language improved (Collioure…). Thanks to everybody of the X-ray lab, Jean-Luc, Fabienne and Amelie for the good working atmosphere and for having accepted the new ideas and methods I tested. Introducing microbiological methods, introduced as well microbiological smell (the finest Munster) and here a special thanks for your patience. Thanks as well to Gilles who was doing the ESEM and SEM with me and who was willing to search a long time until we had the first “Shewanella-smectite family” pictures. Thanks to Nico and Françoise who helped me with the TEM-EDX in Versailles; their help contributed significantly to main results of this thesis and working together was both effective and fun. Thanks to Joelle who was always willing to help concerning both scientific and language questions. Thanks to Mickaël and Valérie who share the experience of working at the interface of biology, geology and chemistry and who helped with staining and imaging bacteria. Thanks to all (Ex)-members of this dynamic and international group: Karim (Funkenmariechen from Morocco) who has always a sunshine effect on everybody, Christian the Québecois, who reintroduced the “coffebreak group feeling”, Pavlina from Czech Republic who is attracting somehow the everyday-catastrophes more than me and became, not only because of that, a precious friend to me. Mohammed from Algeria who always distributed optimism and who was the main source of “dattes” for this group. Thanks to Rabia and Raja from Tunesia, Tania (adding Italian temperament), Emna and Malika. Special thanks to the new group leader Jean-Louis Crovisier who supported me and my project and was always willing to help.
Special thanks to Françoise who partly overtook scientific supervision and helped me especially during the writing phase: working with her was relaxed and at the same time extremely effective and I felt encouraged to defend my ideas. Thank you very much, you where the right person at the right time. Here as well special thanks to Nico who was an important discussion partner and who managed to criticize and to encourage at the same time. Both his scientific and personal support was of prime importance for me and without him I could not have finished the thesis. Thanks as well to the Heidelbergers, especially to Margot and Christian who always gave a warm welcome. Their help with analytics contributed significantly to main results of the thesis

and working with them was always a pleasure. Thanks as well to all the other (Ex)-Heidelbergers, especially Bernd for still celebrating the walk to “Botanik”, Anja, the half American who periodically became French and especially shared the initial stages of my Strasbourg PhD experience, Heiko who never lost contact, whose Thesis was extremely helpful for me and who supported me during the defence day. A big hello to Axel, Christian, Seppl and Mirjam.
Thanks to all people of the CGS, especially Pavlina, Jérémie, Anne-Laure, Julien, Delphine, Momo. A hello to the Czech connection especially Honza, Prokop, Pavla, Andrej, Suzanna, Monica and Vladia and to the French connection Laurence, Michel, Majdi and all other doctorate students. Thanks for the everyday help to Yves, Cathie, les Danielles, Betty, Joëlle and thanks to Valérie and Erika for having partially or entirely read and corrected the manuscript.
On a personal note, I want to thank those who give my life meaning: my husband, best friend and scientific accomplice Nico, my family, especially my mother Regine and my sisters Nicole, Jenny, Ilana and Janna who never understood what I´m doing but who were always optimistic that it will lead to something and thanks to Marianne for continuous support. Thanks to my father and my grandmother who did not survive the end of the thesis but strongly supported me from their cloud.
Résumé ______________________________________________________________________________________________________________________________________________________________________________________________________________________________
i
RESUME Cette étude traite du comportement physico-chimique des argiles dioctaédriques gonflantes (smectites) et de leurs interactions avec la solution aqueuse en présence et en l'absence de la bactérie Shewanella putrefaciens. Les résultats expérimentaux sont présentés pour des argiles compactées, hydratées en conditions de volume confiné, en utilisant un nouveau type de cellule réactionnelle (la "wet-cell" décrite dans Warr & Hoffman, 2004) conçue afin de réaliser des mesures de diffraction des rayons X (DRX) in-situ. En combinant des mesures de suivi dans le temps de DRX in-situ avec les mesures gravimétriques et les spectres de diffraction calculés à l'aide du logiciel CALCMIX (Plançon & Drits, 1999), la dynamique d'incorporation et de stockage de l'eau a pu être quantifiée avec succès. Cette méthode analytique, combinée aux données publiées d'adsorption de la vapeur d'eau a permis de déterminer l'abondance des couches d'eau structurales développées dans l'espace interfoliaire ainsi que la quantité d'eau contenue dans les différents sites de stockage (interfoliaires, surfaces et porosité). Par ailleurs, une information qualitative sur les surfaces et l'organisation texturale des échantillons a été obtenue sur la base de calculs des modifications de l'épaisseur moyenne des particules et de l'organisation des couches d'eau (ordering). En complément, d’autres expériences ont été réalisées avec des suspensions de smectites contenant des bactéries. Les expériences d'hydratation de smectites en conditions abiotiques réalisées sur une large gamme de bentonites naturelles et industrielles (SWy-2, IBECO, MX80, TIXOTON) ont permis de définir le rôle des cations interfoliaires, des densités de compaction variables et de la force ionique sur la solution infiltrée. Le taux d'hydratation des smectites, comme attendu, a été défini comme fortement dépendant du type de cation interfoliaire (augmenté en présence de Ca2+, contrairement à Na+) et de la force ionique de la solution (taux d'incorporations augmentés en présence de solutions salines, particulièrement lors de l'infiltration de smectites sodiques). Une variété de modifications dynamiques de l'état microstructural a également été mise en évidence, apparaissant comme une fonction de la densité de compaction. Ces modifications expliquent un grand nombre des différences de comportement observées lors de l'hydratation des smectites calciques et sodiques. Les mécanismes d'hydratation des smectites, observés en volume confiné, sont inclus dans un modèle schématique prenant en compte différentes échelles, de l'angström pour les feuillets, à la structure argileuse globale. Alors que la nature des cations interfoliaires affecte l'hydratation à toutes les échelles, la force ionique de la solution infiltrée affecte principalement la structure globale. En parallèle, l'impact d'une sélection de smectites (SWy-2, MX80 et nontronite) sur le développement des cultures de S. putrefaciens a été étudié lors d'expérimentations en solution "batch" sous agitation, combinées avec des comptages de cellules. La survie prolongée des bactéries dans les suspensions de smectites, comparée à leur développement en milieu de culture, est attribué à : un apport continu et durable de nutriments cationiques et de carbone organique (Corg), à la capacité tampon de la smectite et aussi, à la grande surface des argiles qui favorise l'accumulation de nutriments, sert de sites de fixation et permet la sorption des déchets toxiques produits. Le taux d'altération/dissolution des smectites induit par les bactéries a été étudié dans les suspensions par ICP-OES et microscopie (confocale, MEB environnemental et MET couplé à un système de microanalyse en EDS). Un appauvrissement en cations majeurs apparaît dans la solution extraite de la nontronite, qui est attribué à la capture (binding) de cations par S. putrefaciens, et est probablement lié à la production de chélateurs. L'appauvrissement constant en Ca2+ est très probablement dû à son stockage dans le biofilm abondant produit (substance exo polymérique, EPS). L'importante libération de cations dans le cas de la

Résumé ______________________________________________________________________________________________________________________________________________________________________________________________________________________________
ii
nontronite, dans les expériences à long-terme, a été particulièrement mise en évidence en ce qui concerne Fe3+ et Al3+, correspondant à plus de 10% de dissolution partielle. A l'inverse, la smectite sodique pauvre en fer n'a pas semblé affectée de la même manière par l'activité bactérienne : l'augmentation de la libération d'Al lors de lessivage acide correspond à un maximum de 1,4% de dissolution partielle de la smectite. La présence de S. putrefaciens a causé de nombreux changements texturaux observés en microscopie (confocale, MEB environnemental) associés à la formation d'agrégats smectitiques et de biofilms. En conditions de volume confiné, la présence de bactéries dans un milieu de smectite sodique a montré l'augmentation, à la fois de l'incorporation d'eau en position interfoliaire, et de la quantité d'eau stockée en position externe (pores et surfaces). Dans ce type de smectite compactée, l'augmentation de l'épaisseur totale des couches d'eau apparaît due à l’augmentation, induite par les bactéries, de la porosité de l'échantillon. Ceci a été confirmé par les observations issues de la combinaison des mesures de DRX et la modélisation avec CALCMIX. Dans le cas de la nontronite, de l'eau additionnelle a été stockée en position externe, indiquant une augmentation similaire de la porosité, mais, dans ce cas, le flux d'eau entrant dans la cellule réactionnelle diminue, très certainement dû au colmatage de la porosité par le biofilm. En termes d'utilisation des bentonites comme matériel de confinement des déchets, cette étude montre que l'activité bactérienne peut modifier les propriétés chimiques et physiques des smectites. Même si les bactéries ne sont pas susceptibles de survivre longtemps dans un milieu smectitique hydraté et hermétique, leurs effets semblent actifs à long terme, spécialement dus aux substances produites par les bactéries, notamment les chélateurs et les EPS.

Summary ______________________________________________________________________________________________________________________________________________________________________________________________________________________________
iii
SUMMARY
This study reports on the physical-chemical behaviour of swelling dioctahedral clays (smectites) and their interaction with aqueous solutions and bacteria (Shewanella putrefaciens). Experimental results are presented for compacted clays, hydrated under confined volume conditions, using a new type of reaction-cell (the “wet-cell” of Warr & Hoffman, 2004) that was designed for in situ X-ray diffraction (XRD) measurement. For comparison, dispersed clay systems were studied using standard batch solutions subjected to varying degrees of agitation. The combination of time-dependent in situ XRD measurements with gravimetric measurements and calculated diffraction patterns using the CALCMIX software (Plançon &Drits, 1999) allowed to successful quantification of the dynamics of water uptake and storage. This analytical procedure combined with published water vapour adsorption data enabled determination of the abundance of structured water layers, developed in the interlayer space, and the amount of water contained in different storage sites (interlayers, surfaces and pore spaces). Qualitative information on surface area and textural organization was also estimated based on calculated changes in the average particle thickness and the organization of water layer structures (ordering).
Abiotic smectite hydration experiments, using a range of natural and industrial bentonites (SWy-2, IBECO, MX80, TIXOTON), focused on defining the role of the interlayer cation, variable clay packing densities and the ionic strength of the infiltrating solution. The rate of smectite hydration, as expected, was seen to be highly dependent on the type of interlayer cation (enhanced for Ca as opposed to Na) and the ionic strength of solution (enhanced uptake rates with saline solutions, particularly as they infiltrate Na-smectite). A range of dynamic changes in microtextural state occurred as a function of packing density. These changes explain the differences in hydration behaviour observed between Na- and Ca-smectite. The hydration mechanisms of compacted smectite occurring within a confined volume system are presented in a schematic model involving different scales, ranging from the Å-scale of lattice layers to the bulk clay structure. Whereas the nature of interlayer cation affects hydration on all scales, the ionic strength of the infiltrating solution primarily affects the bulk texture.
The impact of selected smectites (SWy-2, MX80 and nontronite) on the growth of S. putrefaciens was studied using agitated batch solution experiments combined with viable cell counts. The prolonged survival of bacteria in smectite suspensions compared to growth in culture medium is attributed to i) a continuous and sustainable supply of cationic nutrients and Corg, ii) the buffering capacity of the smectite clay and iii) the large clay surface areas, which accumulate nutrients, serve as attachment sites and sorb toxic waste products. The rate of bacterially induced smectite alteration/dissolution in batch solutions, as monitored by ICP-OES and microscopy (confocal, ESEM and TEM coupled to EDX), shows depletion of the main cations in the nontronite extracted solution. This is attributed to the initial consumption and/or binding of cations by S. putrefaciens, which is probably related to the production of chelating agents. The constantly depleted Ca is most likely stored in the abundant EPS (exopolymeric substance). Enhanced cation release in the case of nontronite in long-term experiments was especially evident for Fe and Al that corresponds to more than 10% partial dissolution. In contrast, the Fe-poor, Na-smectite was not seen to be affected by bacterial activity in this way and the increased release of Al by acid leaching corresponds to only 1.4% partial smectite dissolution. The presence of S. putrefaciens induced abundant textural changes as observed by microscopic investigations (confocal microscopy, ESEM), associated with the formation of smectite-aggregates and biofilms. In confined volume conditions, the presence of bacteria in Na-smectite clay was seen to enhance both the uptake of interlayer water and the amount of externally stored surface and pore water. In this type of compacted smectite, an increase in the total thickness of water layer structures occurs due to bacterial

Summary ______________________________________________________________________________________________________________________________________________________________________________________________________________________________
iv
enhancement of sample porosity as seen by combined X-ray diffraction study and CALCMIX profile calculations. In the case of nontronite, additional water was stored as external water indicating a similar enhancement of porosity, but here, the rate of water inflow into the reaction cell decreased, most likely due to clogging of the pores by biofilm.
With respect to the application of bentonites as a suitable backfill material in underground waste disposal sites, this study demonstrates that bacterial activity can modify both chemically and physically the properties of the smectite. Even if bacteria are not likely to survive in a hydrated bentonite seal, their effects are considered to be long-term, especially due to bacterially produced substances such as EPS and organic ligands.

Contents ______________________________________________________________________________________________________________________________________________________________________________________________________________________________
v
CONTENTS
ACKNOWLEDGEMENTS ...........................................................................................
RÉSUMÉ .................................................................................................................. i
SUMMARY ............................................................................................................. iii
CONTENTS ............................................................................................................. v
FIGURES LIST ........................................................................................................ xi
TABLES LIST ....................................................................................................... xix
ABBREVIATIONS LIST ........................................................................................xxii
CHAPITRE 1 INTRODUCTION .................................................................................1
1.1. Argiles gonflantes et vie microbienne.............................................................................. 2
1.2. Argiles gonflantes dans l'industrie................................................................................... 3
1.3. Utilisation des argiles gonflantes dans le stockage des déchets nucléaires................... 4
1.4. Objectifs de l'étude............................................................................................................ 7
1.5. Plan de la thèse .................................................................................................................. 7
CHAPTER 1 INTRODUCTION ...................................................................................9
1.1. Swelling clays and microbial life.................................................................................... 10
1.2. Swelling clays in industry ............................................................................................... 11
1.3. Swelling clays in nuclear waste disposal ....................................................................... 12
1.4. Objectives of the study.................................................................................................... 14
1.5. Outline of the study......................................................................................................... 15
Contents ______________________________________________________________________________________________________________________________________________________________________________________________________________________________
vi
CHAPTER 2 STRUCTURE AND PROPERTIES OF SMECTITES AND OF RELATED
BACTERIA ............................................................................................................ 17
2.1. Smectites........................................................................................................................... 18
2.1.1. Layer charge and cation exchange capacity (CEC).................................................. 19
2.1.2. Edge charges ............................................................................................................ 20
2.1.3. Interlayer hydration properties and analytical approaches to study hydration......... 21
2.1.4. The diffuse double layer, DLVO theory, and implications for smectite swelling ... 23
2.1.5. Hydration of non-interlayer sites: Surface and pore water ......................................25
2.1.6. Smectite swelling in a confined volume system ...................................................... 26
2.2. The role of bacteria ......................................................................................................... 27
2.2.1. Structure, properties and requirements of bacteria................................................... 27
2.2.2. The bacterial cell wall .............................................................................................. 28
2.2.3. Requirements for bacterial growth .......................................................................... 29
2.2.4. Shewanella putrefaciens...........................................................................................31
2.2.5. Impact of bacteria on their environment .................................................................. 31
2.3. Conclusion an approach of this study ........................................................................... 32
CHAPTER 3 MATERIALS AND ANALYTICAL METHODS ....................................... 35
3.1. Sample materials ............................................................................................................. 36
3.1.1. Bentonite samples: MX80, IBECO, TIXOTON ...................................................... 36
3.1.2. Nontronite and montmorillonite separates ............................................................... 38
3.1.3. Solutions: ground water, sea water and experimentally mixed saline solutions...... 39
3.1.4. Bacteria..................................................................................................................... 40
3.2. Analytical Methods ......................................................................................................... 41
3.2.1. X-ray diffraction study............................................................................................. 41
3.2.1.1. Concept of a laboratory analogue: reaction-cell X-ray diffractometry .......... 44
3.2.2. Monitoring hydration ............................................................................................... 46
3.2.2.1. Quantification of interlayer hydration using CALCMIX................................ 46
3.2.2.2. Quantification of non-interlayer hydration...................................................... 47

Contents ______________________________________________________________________________________________________________________________________________________________________________________________________________________________
vii
3.2.3. XRD characterization of clay minerals .................................................................... 47
3.2.4. Microscopy............................................................................................................... 48
3.2.4.1. Confocal microscopy....................................................................................... 48
3.2.4.2. Electron microscopy........................................................................................ 48
3.3. Bacteria preparation and analyses ............................................................................... 50
3.3.1. Aseptic techniques.................................................................................................... 50
3.3.2. Culture preparation................................................................................................... 51
3.3.3. Viable cell counts ..................................................................................................... 51
3.4. Solution chemistry........................................................................................................... 52
CHAPTER 4 ABIOTIC INFLUENCE ON SMECTITE HYDRATION ........................... 55
Abstract ................................................................................................................................... 56
4.1. Introduction ..................................................................................................................... 57
4.2. Analytical procedure....................................................................................................... 59
4.3. Hydration results of compacted smectite clay under confined volume...................... 60
4.3.1. Total water uptake as a function of interlayer cation, solution chemistry and clay
packing density.................................................................................................................. 60
4.3.2. Influence of solution chemistry on the hydration mechanisms of Wyoming
montmorillonite (SWy-2) ...................................................................................... 64
4.3.2.1. Dynamics of water layer development in SWy-2............................................ 64
4.3.2.2. Organization of interlayer water (ordering) in SWy-2 .................................... 67
4.3.2.3. Particle thickness and theoretical surface area in SWy-2................................ 69
4.3.3. Influence of initial packing density and water content on the hydration behaviour of
MX80 bentonite..................................................................................................... 71
4.3.3.1. Dynamics of water layer development in MX80 ............................................ 71
4.3.3.2. Organization of interlayer water (ordering) in MX80..................................... 74
4.3.3.3. Water uptake into different storage sites in MX80 ......................................... 76
4.3.3.4. Particle thickness and theoretical surface area in MX80................................. 78
4.3.4. Hydration behaviour of bentonite in natural solution .............................................. 80
4.3.4.1. Dynamics of water layer development in IBECO and TIXOTON ................. 80
4.3.4.2. Water uptake into different storage sites in IBECO and TIXOTON .............. 82

Contents ______________________________________________________________________________________________________________________________________________________________________________________________________________________________
viii
4.3.4.3. Particle thickness and surface area estimates in IBECO and TIXOTON ....... 84
4.4. Discussion......................................................................................................................... 86
4.4.1. The influence of the type of smectite and solution chemistry ................................ 86
4.4.2. Progressive hydration in solution under confined volume conditions .................... 88
4.4.3. The influence of initial conditions ......................................................................... 93
4.4.4. Implications of confined volume laboratory analogue for understanding natural
systems..................................................................................................................... 94
CHAPTER 5 BACTERIAL INFLUENCE ON SMECTITE HYDRATION ...................... 97
Abstract .................................................................................................................................. 98
5.1. Introduction .................................................................................................................. 100
5.2. Analytical procedure .................................................................................................... 102
5.2.1. Agitated batch experiments................................................................................... 102
5.2.2. Confined volume experiments using reaction-cell XRD ...................................... 103
5.2.3. Analyses of reaction products ............................................................................... 104
5.3. Results ............................................................................................................................ 105
5.3.1. Bacterial growth in a clay suspension .................................................................. 105
5.3.2. Effects of bacterial action on smectite solution chemistry.................................... 110
5.3.2.1. pH variations ................................................................................................. 110
5.3.2.2. Nontronite cation release into solution.......................................................... 114
5.3.2.3. Montmorillonite cation release into solution.................................................117
5.3.3. Microscopic Analysis............................................................................................ 120
5.3.3.1. The role of biofilm: Confocal microscopy and ESEM.................................. 120
5.3.3.2. Microscale interaction and microchemistry investigated by TEM ............... 122
5.4. Bacteria - compacted clay interaction under confined volume conditions .............. 126
5.4.1. In situ monitoring of smectite hydration by reaction-cell X-ray diffraction......... 126
5.4.1.1. Bacterial effects on total water uptake .......................................................... 126
5.4.1.2. Bacterial effect on interlayer water uptake.................................................... 127
5.4.1.3. Bacterial effects on the storage of water ....................................................... 132
5.4.2. Characterization of reaction products ................................................................... 135
5.4.2.1. Powder XRD ................................................................................................. 135
Contents ______________________________________________________________________________________________________________________________________________________________________________________________________________________________
ix
5.4.2.2. XRD-texture characterization of samples ..................................................... 138
5.4.2.3. Chemistry of solution extractions.................................................................. 145
5.4.2.4. The role of Fe-reduction under confined volume conditions ........................ 149
5.4.2.5. Microscopical observations of long-term experiments ................................. 151
5.5. Discussion....................................................................................................................... 153
5.5.1. The influence of smectite on bacterial activity ..................................................... 153
5.5.2. Physical and chemical influence of bacteria on smectite clay .............................. 157
5.5.2.1. Complexation and binding of potential nutrients and effects on smectite .... 157
5.5.2.2. Effects of bacterial respiration on smectite .................................................. 159
5.5.2.3. Bacterially induced dissolution of nontronite................................................160
5.5.2.4. Textural alteration ......................................................................................... 162
5.5.3. Concluding remarks ............................................................................................... 163
CHAPTER 6 IMPLICATIONS ON SMECTITE HYDRATION IN ABIOTIC AND BI OTIC
ENVIRONMENTS ................................................................................................. 165
6.1. Environmental processes and the importance of laboratory analogue experiments ...
................................................................................................................................................ 166
6.2. Application of confined volume experiments: constraints for backfill hydration .. 169
6.2.1. Predicting the rates of clay barrier saturation ....................................................... 170
6.2.2. Diffusion and transport capacity for radionuclides............................................... 173
6.3. Limitations of the study: challenges for further research ......................................... 173
GENERAL CONCLUSIONS .................................................................................. 175
L ITERATURE ..................................................................................................... 179
APPENDIX .......................................................................................................... 193

_
x

Figures list ______________________________________________________________________________________________________________________________________________________________________________________________________________________________
xi
FIGURES LIST
Chapter 1 Fig. 1.1. Schematic sketch of an underground repository for the storage of nuclear waste. The multi-barrier concept includes the bedrock as a natural barrier as well as the backfill and waste containers as engineered barriers. ................................................................................ 12
Chapter 2 Fig. 2.1. Schematic representation of the crystal structure of smectite. The alternating succession of tetrahedral (T) and octahedral (O) units makes up the sheet-like structure. The interlayer space (IL) contains cations and separates the TOT sheets. The resulting lattice thickness of the structure (d-value) is 9.6Å (modified after Grim, 1962). ............................... 19 Fig. 2.2. Schematic representation of the pH dependent edge charges (modified after Lagaly, 1993)......................................................................................................................................... 21 Fig. 2.3. a) Schematic representation of the diffuse double layer of a smectite particle in suspension. b) Formation of tactoid particles due to osmotic swelling (modified after Lagaly, 1993)......................................................................................................................................... 24 Fig. 2.4. a) With increasing ionic strength the dimension of the diffuse double layer is decreased. b) The curves for interaction energy show decreasing electrostatic repulsion and increasing influence of Van-der-Waals attractive forces. c) Coagulation of particles forming stair-step-card house structures (Hofmann, 2003; modified after Lagaly et al. 1997). ........ 25 Fig. 2.5. Internal structure of a prokaryotic cell (modified after Madigan et al. 2003).......... 28 Fig. 2.6. Schematic representation of the gram-negative and the gram-positive cell wall (Cleassens, 2006; modified after Willey et al. 1996). .............................................................. 29
Chapter 3 Fig. 3.1. Schematic representation of cation sites in the dioctahedral smectite structure (non-stoichiometric). Abbreviations are as follows: IL- interlayer, T- tetrahedral sites and O-octahedral sites (after Velde 1992). ......................................................................................... 38 Fig. 3.2. TEM image of S. putrefaciens cultivated in minimal medium showing the presence of a flagellum................................................................................................................................ 41 Fig. 3.3. Photograph through the window of the D-5000 Bruker-Siemens diffractometer showing the X-ray tube, the goniometer and the sample holder. ............................................. 42 Fig. 3.4. Two dimensional schematic sketch of X-ray diffraction and the Bragg's law. The incident X-ray beam with the wavelength l interacts with the atoms arranged in a periodic manner (grey dots) forming different sets of planes in the crystal (dotted lines). Bragg's law
Figures list ______________________________________________________________________________________________________________________________________________________________________________________________________________________________
xii
gives the condition for the occurrence of constructive interference and the position of the diffraction peak. ....................................................................................................................... 42 Fig. 3.5. Increase of d-values due to intercalation of water layers. ........................................ 43 Fig. 3.6. a) Schematic representation of the reaction-cell sealed by Capton foil. b) Closed reaction-cell with Teflon bottles, c) reaction-cell mounted on the sample holder of the diffractometer. .......................................................................................................................... 45 Fig. 3.7. a) SEM image of a nontronite aggregate. b) ESEM image of swelling nontronite. .. 50 Fig. 3.8. Example of a serial dilution conducted prior to viable cell counts. 0.1ml of the initial sample are introduced into 0.9ml sterile water and mixed. 0.1ml of this dilution is then introduced to another tube that contains as well 0.9ml water and so on. Each step leads to a 10 fold dilution. 0.1ml of the final dilution is then spread on an agar plate. In the example
presented there are too many colonies on the first two plates (10-1 and 10-2) but the third
dilution gives good results with 125 colonies on the plate yielding a count of 1.25*105 cfu/ml (after Madigan et al. 2003). ..................................................................................................... 52
Chapter 4 Fig. 4.3.1. Solution uptake into pressed smectite powders in ml/g. Ca-smectite (TIXOTON, NAu-1) reaches steady state earlier than Na-smectite (IBECO, MX80 and SWy-2) and generally incorporates higher amounts of solution. I=ionic strength. .................................... 61 Fig. 4.3.2. Influence of ionic strength on solution uptake into pressed smectite powders. Correction of weight due to higher ionic strength is indicated as dotted line. a) SWy-2 purified montmorillonite infiltrated by 1M NaCl solution and purified water (packing density 1.36 and 1.37 g/cm3). B) IBECO Na-montmorillonite infiltrated by sea water and ground water (packing density 1.14 and 1.15 g/cm3). c) TIXOTON Ca-montmorillonite infiltrated by sea water and ground water (packing density 0.94 g/cm3). I=ionic strength.......................... 62 Fig. 4.3.3. Correlation between packing density and total water uptake for various samples. Materials containing predominantly Ca in smectite interlayers take more water in than the Na varieties. Interpolating the plots to zero water uptake (dotted lines) yields for both varieties the same values for packing density (2.1 g/cm3) that corresponds to mineral density. ........... 63 Fig. 4.3.4. Development of water layers in Na-exchanged purified montmorillonite (SWy-2). a) During infiltration of purified water and b) during infiltration of 1M NaCl. c) Storage sites for solution when infiltrated by purified water and d) by 1M NaCl. Values for weight of NaCl corrected................................................................................................................................... 65 Fig. 4.3.5. Schematic representation of the formation of new external surfaces associated with decreasing particle thicknesses. N=number of layers per particle (stack)..............................66 Fig. 4.3.6. Ordering of mixed water layer structures (grey bars) expressed as probabilities (p) and the corresponding water layer abundance (empty bars) for SWy-2 a) infiltrated by water b) infiltrated by NaCl. c) Stacking probability plotted for SWy-2 expressed as the deviation

Figures list ______________________________________________________________________________________________________________________________________________________________________________________________________________________________
xiii
from the random stacking state (R=0) when infiltrated by purified water and d) for SWy-2 infiltrated by NaCl solution...................................................................................................... 69 Fig. 4.3.7. Plot showing the change in the number of layers per stack and the corresponding increase of surface area with time a) for SWy-2 infiltrated by purified water and b) by 1M NaCl. c) Shows the distribution of stored water and the estimated amount of surface adsorbed water for the saturated stable state (indicated as a horizontal dotted line) assuming a concentration of 4mmol/g. The distance between the surface absorbed water line and the external water curves (marked by a vertical arrow) represents the amount of bulk pore water at the end of the hydration experiment..................................................................................... 70 Fig. 4.3.8. Development of water layer structures in montmorillonite during hydration of MX80 bentonite. a) Dehydrated sample with a packing density of 1.35g/cm3. b) Dehydrated sample with elevated packing density (1.43g/cm3). c) Initially hydrated sample with a packing density of 1.60g/cm3. The number in brackets corresponds to the dry packing density. ......... 73 Fig. 4.3.9. Ordering of mixed water layer structures (grey bars) expressed as probabilities (p) and the corresponding water layer abundance (black empty bars). a) Initial stages of the experiment and b) the final stages. Expressed as the deviation from the random stacking state (R=0). c) Initial stages and d) final stages............................................................................... 75 Fig. 4.3.10. Water uptake into the different storage sites of MX80 bentonite. a) Dehydrated sample with an intermediate packing density (1.35g/cm3). b) Dehydrated sample with an elevated packing density (1.43g/cm3). c) Initially hydrated sample. Note the packing density is higher when including the initial water content (1.60cm3/g) compared to that of the dry state (1.31g/cm3). .............................................................................................................................. 77 Fig. 4.3.11. Plot showing the change in the number of layers per stack and the corresponding increase of surface area with time for dehydrated and compacted MX80 powder. a) Dehydrated and compacted MX80 powder (1.35 g/cm3). b) Dehydrated and highly compacted MX80 powder (1.43 g/cm3). Estimation of surface adsorbed water according to increased smectite surface area for c) dehydrated and compacted MX80 powder (1.35 g/cm3) and d) dehydrated and highly compacted MX80 powder (1.43 g/cm3). Dotted lines indicate the calculated amount of water corresponding to the stable saturated state assuming 4 or 2.5mmol/g required to cover the external surface area. TW-total water, ILW-interlayer water, EW-external water (combined surface and pore water). ......................................................... 79 Fig. 4.3.12. Water layer development in smectite contained in bentonite powders. a) IBECO infiltrated by ground water. b) IBECO infiltrated by sea water. c) TIXOTON infiltrated by ground water. d) TIXOTON infiltrated by sea water. Ionic strength for ground and sea water is 0.0013 and 0.64M, respectively. Modified after Warr & Berger (2007). ............................ 81 Fig. 4.3.13. Partitioning of water storage sites in bentonites infiltrated by natural solutions. The weight of sea water was corrected for the amount of dissolved ions. Modified after Warr & Berger (2007). ...................................................................................................................... 83 Fig. 4.3.14. Changes in the number of layers per stack and the corresponding surface areas of montmorillonite contained in bentonite (a-d). ..................................................................... 85

Figures list ______________________________________________________________________________________________________________________________________________________________________________________________________________________________
xiv
Fig. 4.4.1. Different hydration sites in a smectite powder as a function of scale. a) Interlayer, b) surface of particles composed of several layers, c) aggregates composed of several particles and d) arrangements of aggregates. The aggregate model shown in c is modified after Suzuki et al. (2005). Hydration sites are marked with arrows.. ...................................... 86 Fig. 4.4.2. Schematic sketch of water uptake and hydration of smectite in confined volume conditions (bulk textural scale). a+b) Initial stages of hydration dominated by pore water intake. c+d) Pore water serves as a reservoir for interlayer expansion leading to the formation of hydration aggregates. e+f) Interlayer hydration and local particle separation leads to the expansion of aggregates and pore closure. In the case of Na-smectite (e) the formation of gels fill remaining pore spaces and voids associated with mineral impurities (inserted image). .................................................................................................................................................. 92
Chapter 5 Fig. 5.2.1. a) Schematic representation of the reaction-cell device (without upper sealing plate). b) Set up for flow-through experiments with solution bottles attached. At any stage of the hydration experiment, the reaction-cell in a) can be placed in the X-ray diffractometer for measurement. ......................................................................................................................... 104 Fig. 5.3.1. a) Growth curves of S. putrefaciens in culture media (solid black lines, LB indicates Luria Bertrani medium and MM the minimal medium defined by Myers & Nealson (1988)) and smectite suspensions of two different mineral concentrations. The light grey background indicates the population span for the nontronite (NAu-1) culture and the dark grey background for the two montmorillonite rich samples MX80 and SWy-2. Bacterial populations are measured as colony forming units per ml of suspension (cfu/ml) plotted against reaction time (days). b) Schematic representation of the growth curves showing the main differences in the duration of recognized phases (numbers in italics). ........................ 106 Fig. 5.3.2. Changes in pH over time for the different smectite suspensions (density 0.01g/ml). Montmorillonite suspensions are highlighted with a dark background, nontronite suspension with a light grey one. Filled symbols indicate the presence of bacteria, empty ones present sterile controls........................................................................................................................ 110 Fig. 5.3.3. Changes in pH over time for a-b) montmorillonite suspensions (aerobic), c) the nontronite (NAu-1) suspension (aerobic) and d) the montmorillonite (MX80) suspension (anaerobic). Filled symbols with solid lines indicate the evolution of pH values for samples containing bacteria; the empty symbols with dotted lines represent sterile controls. The corresponding growth curves are presented as dashed lines, and the recognized phases marked with vertical arrows: A-lag, B-exponential, C- stationary and D-death. ................. 111 Fig. 5.3.4. Relative difference in the pH of bacteria containing smectite suspensions from the abiotic control expressed as a %. The phases of growth (A-D) are indicated as shown in Fig 5.3.2. Abbreviations for the growth phases: A-lag, B-exponential, C- stationary and D-death.. ................................................................................................................................................ 113 Fig. 5.3.5. a) The concentration of cations released from nontronite into purified water. Light grey columns indicate cation release into the solution after 2h of dispersion, dark grey columns after 264h. Columns in dotted lines correspond to 2% theoretical stoichiometrical cation release. b) Mineral formula and a schematic representation of cation sites in layered

Figures list ______________________________________________________________________________________________________________________________________________________________________________________________________________________________
xv
smectite structure (non-stoichiometric). Abbreviations: IL- interlayer, T- tetrahedral sites and O- octahedral sites. ................................................................................................................ 114 Fig. 5.3.6. The concentration of cations in solution derived from the bacteria containing nontronite suspension after 2h (filled light grey columns) and 264h (filled dark grey columns). Empty columns indicate the amount of depletion compared to the cation concentration of the sterile control. ........................................................................................................................ 116 Fig. 5.3.7. The concentration of cations released from Wyoming montmorillonite (SWy-2) into purified water after 2h (light grey columns) and 264h (dark grey columns). Columns in dotted lines represent stoichiometrical cation release. b) Mineral formula and a schematic representation of cation sites in the smectite structure (non-stoichiometric). Abbreviation: IL- interlayer, T- tetrahedral sites and O- octahedral sites......................................................... 117 Fig. 5.3.8. a) The concentration of cations released from montmorillonite (contained in MX80) into purified water after 2h and 264h. Columns in dotted lines correspond to 3% theoretical stoichiometrical cation release. b) Mineral formula and a schematic representation of cation sites in the smectite structure (non-stoichiometric). Abbreviation: IL- interlayer, T- tetrahedral sites and O- octahedral sites......................................................... 118 Fig. 5.3.9. The concentration of cations in solution derived from bacteria containing MX80 suspension. Empty columns indicate the amount of depletion compared to the cation concentration of the sterile control. In the case of Ca, Fe and K less cations are dissolved in solution when bacteria are present. Na and Si in contrast are slightly enhanced................. 119 Fig. 5.3.10. The concentration of cations in solution derived from bacteria containing SWy-2 suspension. Empty columns indicate the amount of depletion compared to the cation concentration of the sterile control. Virtually all cations in solution are present in higher concentrations when bacteria are present. ............................................................................ 119 Fig. 5.3.11. Confocal transmitted light microscopy image of smectite incubated with S. putrefaciens. a) MX80 and b) nontronite. Biofilm appears within aggregates as diffuse structure. ................................................................................................................................ 120 Fig. 5.3.12. a) ESEM image of a two day old S. putrefaciens culture forming biofilm around precipitates from the medium. b) Bacteria incorporated in biofilm attached to a phosphate needle that precipitated from the medium. c) ESEM image of a two week old culture after the majority of cells have died. The biofilm is still visible. d) ESEM picture of biofilm forming on mineral particles. ................................................................................................................. 121 Fig. 5.3.13. a) TEM microphotograph of S. putrefaciens cultivated in minimal medium. b) EDX microanalysis of part of the cell marked by an arrow. The analysis shows high amounts of Na, P, S and Ca, as well as a Cu peak from the sample grid............................................. 122 Fig. 5.3.14. a) TEM microphotograph of S. putrefaciens cultivated in Fe-rich minimal medium. b) EDX microanalysis of the coated grid. c) EDX microanalysis of the cell showing the bacterium to containing elements of the medium. The dark areas of the cell are Fe-rich (the Cu-peak is from the sample grid).................................................................................... 123

Figures list ______________________________________________________________________________________________________________________________________________________________________________________________________________________________
xvi
Fig. 5.3.15. TEM microphotograph and corresponding EDX spectra of nontronite particles. Microanalysis shows typically high amounts of iron (12.1 wt% Fetot). Quantification was
done without correcting for C content derived from the sample coating. The Cu-peak comes from the sample grid. ............................................................................................................. 123 Fig. 5.3.16. a) TEM microphotograph of nontronite incubated with bacteria for 10 days. b-c) Corresponding EDX spectra showing typical nontronite composition in darker regions and a Si-rich gel-like structure surrounding the grains. The Cu-peak comes from the sample grid. d) TEM microphotograph of nontronite covering a bacterial cell (position marked with arrow)... ................................................................................................................................................ 124 Fig. 5.3.17. a) TEM microphotograph of montmorillonite (MX80) showing relicts of a bacterial cell. The corresponding EXD spectrum shows typical values for montmorillonite. b) TEM microphotograph of bacteria cultivated in the presence of MX80 bentonite. The image shows a bacterial cell with montmorillonite wrapped around it. c) EDX spectrum of the cell. d) EDX spectrum of the montmorillonite. .............................................................................. 125 Fig. 5.4.1. Total water uptake into smectite powder determined by weight. ......................... 127 Fig. 5.4.2. a-b) Abundance of water layers for nontronite (NAu-1) and montmorillonite (MX80) without and with S. putrefaciens, expressed in percent (%) vs. the reaction time (in hours). Encircled symbols indicate the number of water layers within the hydrating interlayer. The dashed lines show the normalized total water uptake determined by weight. ................ 129 Fig. 5.4.3. Ordering of mixed water layer structures expressed as a deviation from the R0 (random) stacking state for a) nontronite without bacteria, b) nontronite with bacteria, c) montmorillonite (MX80) without bacteria, and d) montmorillonite (MX80) with bacteria... 131 Fig. 5.4.4. a-d. Storage of water in interlayer and non-interlayer sites from nontronite (NAu-1) and montmorillonite (MX80) without and with S. putrefaciens. ....................................... 132 Fig. 5.4.5. a) XRD patterns of initial (black) and final (grey) bacteria containing nontronite powders extracted from the reaction-cell experiments. Basal reflections of hydrated nontronite (Ntr) and the internal standard kaolinite (Kln) are indicated with corresponding d-values in Å. Additionally both samples contain goethite (Gt), tridymite (Trd), biotite (Bt) and precipitations of the Al-sulphate basaluminite (Bal). Mirabilite (Mir) and vivianite (Viv) are only contained in the final reaction products (bold). b) XRD patterns of the initial sterile nontronite (black) and the final measurements made at the end of the experiment (grey). The final reaction products show enhanced basaluminite precipitation (bold)............................ 135 Fig. 5.4.6. a) Selected XRD patterns of sterile MX80 measured in situ during the reaction-cell experiment. The initial measurement is shown in black and the last measurement (after 9600 h) in light grey. The d-values for montmorillonite (Mnt) present mostly a mixture of 2- and 3-WL hydrates. All samples contain illite (Ill), quartz (Qtz) and feldspar (Fsp). Non-silicates are present as bassanite (Bas), rhodochrosite (Rds), and in some measurements, calcite (Cal) is visible. b) The amount of green rust is observed to increase and decreases during the period of the experiment, suggestive of precipitation and subsequent dissolution. All d-values are given in Å................................................................................................................................ 136

Figures list ______________________________________________________________________________________________________________________________________________________________________________________________________________________________
xvii
Fig. 5.4.7. a) Selected XRD patterns of bacteria containing MX80 measured in situ during the reaction-cell experiment. The initial measurement is shown in black and the last measurement (after 3150 h) in light grey. The d-values for montmorillonite (Mnt) present mostly a mixture of 2- and 3-WL hydrates. All samples contain illite (Ill), quartz (Qtz) and feldspar (Fsp). Non-silicates are bassanite (Bas), rhodochrosite (Rds) and in some measurements calcite (Cal). Reflections indicating dissolution/precipitation are shown in the magnified images: b) increase of green rust c) increase of lepidocrocite (Lpc) and d) decrease of calcite (Cal). The 2.42 Å peak of pyrite (Py) is perhaps present in c). All d-values are given in Å. .................. 138 Fig. 5.4.8. a) XRD patterns of air dried (AD) and glycolated (EG) texture preparations of the original nontronite sample (upper sketch, light grey), of the sample extracted from the sterile reaction-cell (middle dark grey) and the sample extracted from the S. putrefaciens containing reaction-cell (black). b) Enlarged image of the (001) reflection with d-values. The numbers in italics indicate the relative air humidity (RH) for air dried samples at the time of measurement........................................................................................................................... 139 Fig. 5.4.9. XRD patterns of Mg-exchanged and glycerol-saturated texture preparations extracted from sterile (S) and bacteria containing (B) reaction-cell experiments. The enlarged image shows the position of 001 reflections and their corresponding d-values. The light grey pattern represents the Mg-exchanged and glycerol- saturated original sample (O) that was taken as a reference................................................................................................................ 141 Fig. 5.4.10. XRD patterns of nontronite reaction-cell experiments with and without bacteria. a) Air dried, b) heated to 80°C, c) heated to 120°C and d) heated to 160°C. ....................... 143 Fig. 5.4.11. a) XRD patterns of montmorillonite (MX80 sample) measured as air dried texture slides prepared from the sterile (grey) and bacteria containing (black) reaction-cells. The numbers in brackets indicate the order of diffracting basal planes (00l series of montmorillonite) and their corresponding d-values in Å. b) Enlarged image of the (001) reflection. The numbers in italics indicate the relative air humidity (RH) during measurement. ................................................................................................................................................ 144 Fig. 5.4.12. a) XRD patterns of montmorillonite (MX80) measured as air dried texture slides prepared from the sterile (S, grey, RH 45%) and bacteria containing (B, black, RH 42%) reaction-cells. b) XRD patterns of the collapsed interlayer structure after heat treatment (24h 80°C). ..................................................................................................................................... 145 Fig. 5.4.13. Concentration of cations leached into solution of samples taken from nontronite reaction-cell experiments (with and without bacteria). a) Absolute concentrations, b) normalized to 10% of stoichiometric cation release (zero line). ........................................... 146 Fig. 5.4.14. A comparison between the concentrations of cations extracted from nontronite using water (solid lines) and HCl (dashed lines). The results show higher cationic content for HCl leaching especially for Fe. Generally bacteria containing samples (grey columns) release more cations into solution than bacteria free (white columns). ................................147 Fig. 5.4.15. Concentration of cations leached into solution of samples taken from the MX80 montmorillonite reaction-cell experiments (with and without bacteria). a) Absolute values obtained from ICP-OES analyses. b) Normalized to 3% stoichiometric cation release (zero line)......................................................................................................................................... 148

Figures list ______________________________________________________________________________________________________________________________________________________________________________________________________________________________
xviii
Fig. 5.4.16. Comparison between the concentrations of cations extracted from montmorillonite using water (solid lines) and HCl (dashed lines). The results show higher cationic content for HCl leaching analysis of bacteria containing montmorillonite samples. Without bacteria (white columns) the values are comparable to the water extracts. ............ 149 Fig. 5.4.17. Measured Fe(II) values for reaction-cell extractions (solid lines) with and without bacteria. Dotted columns represent values taken from the literature, which show initial Fe(II) concentration (empty column) and that after clay-bacteria interaction in batch experiments (Kim et al. 2004, striped column)........................................................................................... 150 Fig. 5.4.18. Relative differences in Fe(II) content for the bacteria-containing reaction-cell experiments in % (dark grey column) when normalized to the sterile control. Anaerobic batch cultures (light grey column) and aerobic batch cultures (empty column). The numbers in brackets represent the absolute differences in mmol/g. ......................................................... 151 Fig. 5.4.19. a) TEM microphotograph of nontronite and S. putrefaciens taken from reaction-cell experiment. The size of the bacterium does not exceed 0.7µm in length and is partly damaged. b) EDX microanalysis of the nontronite grain shown in a) contains Si, Al, Fe, Ca and K. c) EDX microanalysis of the bacterial cell showing the same cations along with additional S and Cl due to the presence of bacteria. The Cu is derived from the sample grid. .. ................................................................................................................................................ 152 Fig. 5.5.1. The behavior of smectite and bacteria in solutions. a) With monovalent cations the electrostatic repulsion keeps clay and bacteria in suspension. b) The presence of divalent cations serve as bridges and allow the formation of aggregates. ......................................... 155 Fig. 5.5.2. Schematic sketch showing the interaction of nontronite and S. putrefaciens at the lattice layer scale. a) Octahedrally coordinated Fe(III) is mobilized at unstable edge sites and the Ca from interlayer sites is released into solution. Bacterially produced ligands (here catecholate) form siderophore complexes with Fe(III) as the central cation (modified after Konhauser, 2007). b) Calcium acts as a bridge between clay and bacteria. The complex is transported to the cell, the Fe(III) is dismantled and reduced or is involved in the formation of Fe(III)-coatings at the cell surface. As the complexation leads to continuous dissolution, Si is released and precipitated as amorphous silica, which is presumably associated with EPS. 161 Fig. 5.5.3. Bacteria in confined volume conditions. a) Directly after closing the reaction cell the bacteria occupy open pores between mineral grains and aggregates. b) Pores are closed due to increased swelling during smectite hydration. Exudates of bacteria cause aggregation in their vicinity. c) After death and lyses of bacteria newly formed porosity becomes available for additional swelling. .......................................................................................................... 163
Chapter 6 Fig. 6.1. Schematic sketch of the time required to saturate a 1m thick bentonite barrier as a function of initial packing density and the difference types of solutions infiltrated. ............. 171

Tables list ______________________________________________________________________________________________________________________________________________________________________________________________________________________________
xix
TABLES LIST
Chapter 2 Table 2.1. Compilation of layer charge and idealized formula of some representative 1:1 and 2:1 phyllosilicates modified from Bergaya & Lagaly (2006). ................................................. 19 Table 2.2. Compilation of bacterial nutrients (Madigan et al., 2003; Todar, 2006)............... 30
Chapter 3 Table 3.1. List of samples and their important mineralogical characteristics. Data taken from (Hofmann et al., 2004)1), (Sauzeat et al., 2001)2), (Mermut &Cano, 2001)3), (Keeling et al., 2000)4) and (Chipera &Bish, 2001)5). *Own data. .................................................................. 37 Table 3.2. Chemical composition of the used materials. Data taken from (Hofmann et al., 2004)1), (Sauzeat et al., 2001)2), (Mermut &Cano, 2001)3), (Keeling et al., 2000)4). .............. 39 Table 3.3. Cationic compositions of the natural solutions used in this study determined by atomic adsorption spectroscopy (Warr & Berger, 2007). ....................................................... 40 Table 3.4. Cation composition of the Luria Bertrani medium (LB) and a list of the major compounds in the minimal medium (MM) as defined by Myers and Nealson (1988). The electron acceptor was only added to adapt bacteria to Fe(III)-respiration and for incubation under anaeorobic conditions.................................................................................................... 40
Chapter 4 Table 4.1.1. Summary of the key properties of the studied materials after sample preparation and a list of the experimental conditions used in the hydration experiments. ......................... 59 Table 4.3.1. Total water uptake for confined volume experiments infiltrated by solutions.*Uptake after correcting the weight of concentrated solutions................................ 61 Table 4.3.2. Water uptake into different storage sites of SWy-2montmorillonite.*Weight of NaCl corrected. ........................................................................................................................ 66 Table 4.3.3. Average number of layers per stack and the corresponding theoretical surface area. *Calculated assuming 4mmol/g. The dry BET surface area is 27.64m2/g. .................... 71 Table 4.3.4. Water layer abundance (%) and the difference in mean lattice layer thickness in Å between the initial and final state of hydration.................................................................... 74 Table 4.3.5. Experimental results used to calculate the rates of water uptake into the various storage sites of MX80 montmorillonite as a function of different packing densities and initial hydration states. ....................................................................................................................... 77
Tables list ______________________________________________________________________________________________________________________________________________________________________________________________________________________________
xx
Table 4.3.6. Results used to estimate the amount of surface water based on decreasing layers per stack.*Assuming a mean of 19 layers per stack at dry state.............................................. 78 Table 4.3.7. Water layer abundance (%) and the difference in mean lattice layer thickness in Å between the initial and final state of hydration for bentonites infiltrated by natural solution. .................................................................................................................................................. 82 Table 4.3.8. Experimental results used to calculate the rates of water uptake into the various storage sites of Na- and Ca-bentonites. The weight of sea water was corrected for salt content. .................................................................................................................................... 84 Table 4.4.1. Calculated rates of water uptake into the interlayer sites. *Na- smectite, +Ca- smectite..................................................................................................................................... 87 Table 4.4.2. Calculated saturation velocities for the different clays powders used in this study. The time to saturate 1m of compacted smectite is calculated based on the distance across the reaction cell (24mm) and the time required to reach the fully hydrated state......................... 95
Chapter 5 Table 5.3.1. Starting densities of bacteria expressed as colony forming units per ml clay suspension (cfu/ml)................................................................................................................. 105 Table 5.3.2. Data used to calculate the time to double during the exponential growth phase expressed as generation time (g) in hours. Initial and final cell numbers correspond to the beginning (68h) and end (164h, see Fig. 5.3.1.b) of the exponential phase and were used to calculate the slope.................................................................................................................. 107 Table 5.3.3. Theoretical cationic nutrients available in g/l for the different smectites if particles were dissolved to 100%........................................................................................... 109 Table.5.4.1. Ionic strength of solutions and bacterial densities. .......................................... 127 Table 5.4.2. Water layer abundances (%) and corresponding basal lattice d-values for sterile and Shewanella-bearing nontronite and MX80 bentonite clays ...........................................130 Table 5.4.3. Values for interlayer and non-interlayer water uptake for nontronite and montmorillonite (contained in MX80) with and without bacteria. ........................................ 133 Table 5.4.4. Mean number of layers per stack and corresponding theoretical surface area for MX80 montmorillonite with and without bacteria.*Assuming 19 layers per stack for the “dry” state and *4 and **2.5 mmol H2O/g for the amount of adsorbed surface water................... 134 Table 5.4.5. XRD peak characteristics (001 reflection) of nontronite materials after various chemical and physical treatments. *FWHM= full width at half maximum. .......................... 141 Table 5.4.6. XRD peak characteristics for montmorillonite (contained in MX80). ............... 145
Tables list ______________________________________________________________________________________________________________________________________________________________________________________________________________________________
xxi
Table 5.4.7. Composition of minimal medium (MM) and the salt solution that were used in experiments with their contribution to cationic content of leaching solutions.*Based on 2.2E-02 l MM in 1 l leaching solution. ........................................................................................... 146 Table 5.4.8. Theoretical iron content in nontronite as described by Keeling et al. 2000,*Andrade et al. 2002; Kim et al. 2004 and **O’Reilly et al. 2005............................... 150
Chapter 6 Table 6.1. A summary of the effects clay minerals have on bacterial growth in batch experiments (solution dominated system) and compacted confined volume experiments (mineral-dominated). TEA = Terminal electron acceptor. .................................................... 168 Table 6.2. Compilation of bentonite clay backfill properties and possible abiotic and biotic effects as a function of scale. IL = Interlayer water WL = Water layer HC = Hydraulic conductivity. ........................................................................................................................... 169

Abbreviations List ______________________________________________________________________________________________________________________________________________________________________________________________________________________________
xxii
ABBREVIATIONS LIST
BET Brunauer-Emmet-Teller CEC Cation exchange capacity cfu Colony forming unit Corg Organic carbon EDX Energy dispersive spectroscopy EPS Exopolymeric substance ESEM Environmental scanning electron microscopy EW External water FEBEX Full-scale engineered barrier experiment HC Hydraulic conductivity IL Interlayer ILW Interlayer water LBM Luria Bertrani medium MM Minimal medium SSA Specific surface area TEA Terminal electron acceptor TEM Transmission electron microscopy TW Total water WL Water layer WLs Water layers XRD X-ray diffraction

___________________________________________________________________________
CHAPITRE 1
-
INTRODUCTION
___________________________________________________________________________

Chapitre 1 - Introduction ______________________________________________________________________________________________________________________________________________________________________________________________________________________________
2
1. INTRODUCTION
1.1. Argiles gonflantes et vie microbienne
L'ubiquité et la réactivité des bactéries et des minéraux sur Terre offrent un potentiel
énorme pour une grande variété d'interactions dans les environnements hydriques. Les
premiers travaux liant les domaines de la géologie et de la microbiologie ont été publiés au
début du siècle dernier, traitant notamment de l'implication de microorganismes dans la
formation de sulfure d'hydrogène et de carbonates de calcium (Nadson, 1903; in Ivanov
&Karavaiko, 2004). Depuis, l'étude des interactions microbe-minéral est devenu un sujet de
première importance dans la thématique des sciences de l'environnement et de la vie. Il a été
montré que les bactéries ont des effets prononcés sur la croissance cristalline (Gorshkov et al.,
1992; Kohler et al., 1994; Ehrlich, 1999; Kawano &Tomita, 2001) et la dissolution des
minéraux (Bennett et al., 1996; Liermann et al., 2000b; Rosenberg &Maurice, 2003; Aouad et
al., 2006; O'Reilly et al., 2006). L'association de minéraux avec des bactéries et/ou des
exsudats bactériens provoque souvent une augmentation des taux d'altération à l'interface
minéral/bactérie et une variété de mécanismes possibles ont été suggérés afin d’expliquer cet
effet (Marshall et al., 1971; Van Loosdrecht et al., 1990; Maurice &Warren, 2006). Il a été,
par ailleurs, observé que les interactions minéral-bactéries peuvent modifier la composition
chimique de l'eau environnante, notamment son pH et son état d'oxydo-réduction. De plus, il
est maintenant admis que la connaissance détaillée de ces interactions est essentielle afin de
mieux comprendre la chimie de l'hydrosphère et de la lithosphère (Ehrlich, 1996; Liermann et
al., 2000a; Haas, 2004).
L'interaction entre activité bactérienne et smectite a en particulier été abordée dans des
études pionnières publiées par Stotzky (1966a; 1966b) et Stotzky & Rem (1966; 1967).
L'implication des caractéristiques de la montmorillonite (p. ex. la capacité d'échange
cationique et la surface spécifique) sur l'activité et l'écologie des microorganismes du sol a été
spécialement étudiée en ce qui concerne les changements qu’elle induit sur les habitats
microbiens. Du fait de la haute teneur en eau des smectites et de leur abondance dans les sols
et sédiments, la nature de l'interaction entre les bactéries et les minéraux argileux gonflants est
d'un intérêt particulier. Les smectites sont des minéraux possédant des propriétés physiques et
chimiques uniques : elles présentent une faible charge de feuillets facilitant leur ecartement et

Chapitre 1 - Introduction ______________________________________________________________________________________________________________________________________________________________________________________________________________________________
3
l’adsorbtion ou absorbtion de grandes quantités d'eau (ou autres substances polaires) et d´une
grande variété de cations au sein de leur structure. Récemment, une attention particulière a été
donnée aux modifications induites par les bactéries des propriétés de la charge des feuillets de
smectite riche en fer (nontronite) induites par les bactéries. Il est aujourd'hui admis qu'une
réduction (anaérobique), chimique ou biologique, du Fe(III) dans la structure de la smectite
provoque une augmentation de la charge de surface. Il a également été montré que de telles
modifications diminuent la capacité d'hydratation de la smectite riche en fer (Stucki et al.,
1987; Wu et al., 1988; Lovley, 1991; Kostka et al., 1996; Kostka et al., 1999; Kim et al.,
2004; Kim et al., 2005; Lee et al., 2006; Stucki &Kostka, 2006). Dans une expérience réalisée
en conditions anaérobiques par Kim et al. (2004), il a même été reporté que l'activité de
Shewanella oneidensis induisait la transformation de la smectite en illite par la fixation de K
dans l'espace interfoliaire. Comme dans cette expérience la réaction avait eu lieu à 25°C et sur
une période de seulement 2 semaines, les auteurs suggèrent que l'interaction "smectite riche
en fer – bactéries" peut jouer un rôle clé en tant qu’initiateur des réactions argilo-minérales
dans les environnements anaérobiques. Bien que de nombreuses études portent aujourd'hui sur
cette thématique de recherche, l'amélioration de la connaissance des interactions microbe-
minéral reste un défi de premier plan, spécialement en ce qui concerne la nature complexe des
réactions prenant place dans le système bactéries-smectites.
1.2. Argiles gonflantes dans l'industrie
Les minéraux argileux gonflants (smectites) sont les principaux composants de la
bentonite, qui, du fait de son fort pouvoir ad-absorbant et de sa capacité d'imperméabilisation,
en fait un des composé argileux industriellement utilisé les plus importants (Murray, 1977;
Elzea &Murray, 1990). Le terme de bentonite a été pour la première fois introduit en 1898, il
faisait alors référence à une roche trouvée dans une "Benton-Shale" au Wyoming, mais ce
terme désigne de nos jours un matériau contenant essentiellement de la smectite (O'Driscoll,
1988; 1989). Ses applications les plus importantes sont en tant que liant pour l’extraction des
minerais de fer, en tant que moule de fonderie ou comme constituant des boues de forages
pétroliers (Harvey &Lagaly, 2006). Sous forme de dispersions, la bentonite est utilisée en
contexte d'ingénierie civile, comme agent épaississant (p. ex. dans les peintures), comme
adsorbant chimique (p. ex. pour les protéines) ainsi que pour la stabilisation de la bière et du
vin (Sarmento et al., 2000). Du fait de leur importante capacité d'adsorption, de leur grande

Chapitre 1 - Introduction ______________________________________________________________________________________________________________________________________________________________________________________________________________________________
4
surface spécifique et de leur propriété d'imperméabilisation quand elles sont hydratées, les
smectites sont également utilisées comme des barrières ouvragées dans les sites
d'enfouissement et de stockage de déchets. En raison de l'augmentation actuelle en besoins
énergétiques et du développement concomitant de l'énergie nucléaire, de nouveaux défis ont
vu le jour concernant le stockage sûr des déchets nucléaires. Dans cette optique, les argiles
gonflantes (bentonites) sont considérées comme un bon matériau pour constituer les barrières
ouvragées inhérentes au futur stockage en profondeur des déchets. Cette application est
décrite plus en détails dans le paragraphe suivant.
1.3. Utilisation des argiles gonflantes dans le stockage des déchets nucléaires
Les déchets radioactifs sont des matériaux extrêmement dangereux et leur isolation de
la biosphère est essentielle (Pusch, 2006b). Ces déchets proviennent de toutes les phases du
cycle de production de l'énergie nucléaire et de l'utilisation de produits radioactifs dans
l'industrie ainsi que pour des applications médicales. Le type de déchet le plus dangereux est
le type des déchets "de haute activité et à vie longue" (HAVL), qui sont dérivés du résidu
non-recyclable de la combustion nucléaire. De tels déchets doivent être confinés pendant
approximativement un million d'années avant que leur niveau de radioactivité approche le
niveau de l'environnement naturel (ANDRA, 2005).
La majorité des pays producteurs de déchets radioactifs envisagent leur stockage en
profondeur au cœur de formations géologiques profondes de manière à avoir une barrière
épaisse et naturelle entre les déchets et la biosphère. Différents types de formations rocheuses
sont actuellement étudiées pour servir d'encaissant, par exemple du granite en Suède et
Finlande, des dômes de sel en Allemagne, des tufs pyroclastiques aux Etats-Unis et des roches
argileuses en Suisse, Belgique et France (OECD, 1999; ANDRA, 2005; OECD, 2006). En
dépit de ces différences dans les types d'encaissant considérés, tous les projets de stockage
impliquent le concept de multi-barrière. Celui-ci consiste en un container d'acier contenant les
déchets radioactifs vitrifiés, éventuellement entouré de béton, un matériau de remplissage
smectitique étant alors introduit entre le container d'acier et la roche encaissante. Finalement,
le tunnel d'accès sera remblayé afin de sceller le site (Fig. 1.1.).
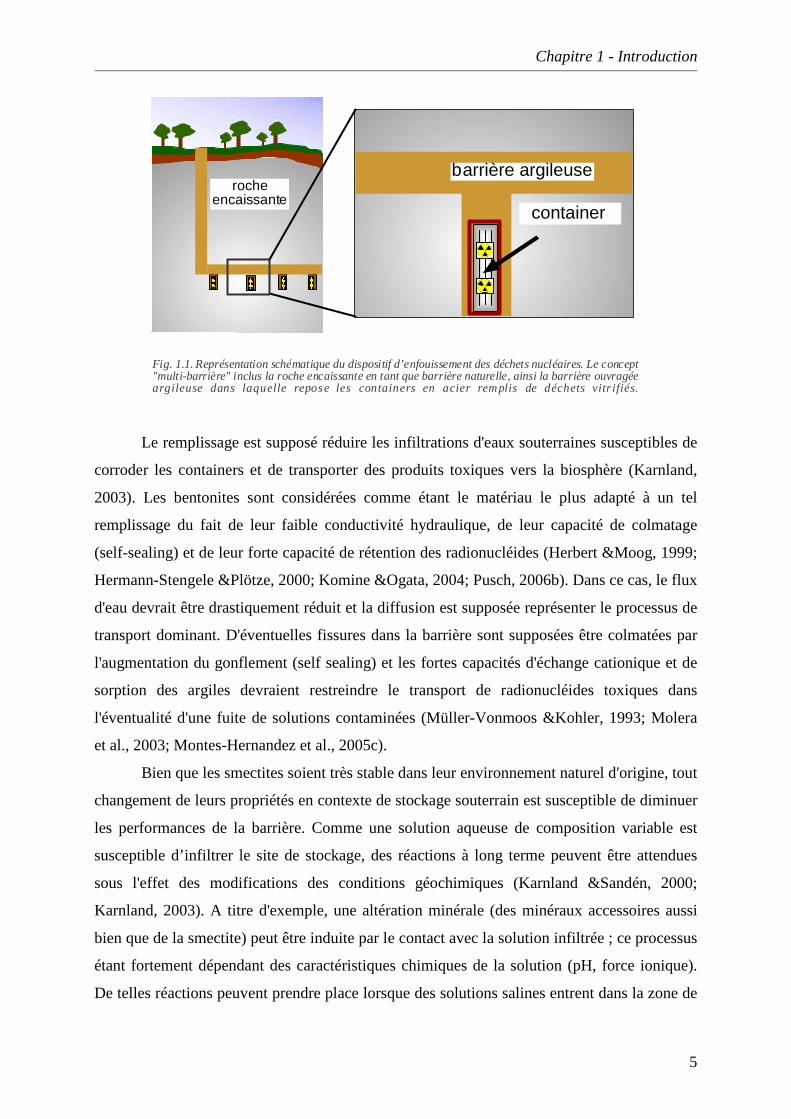
Chapitre 1 - Introduction ______________________________________________________________________________________________________________________________________________________________________________________________________________________________
5
Fig. 1.1. Représentation schématique du dispositif d’enfouissement des déchets nucléaires. Le concept"multi-barrière" inclus la roche encaissante en tant que barrière naturelle, ainsi la barrière ouvragéeargileuse dans laquelle repose les containers en acier remplis de déchets vitr ifiés.
container
barrière argileuseroche
encaissante
Le remplissage est supposé réduire les infiltrations d'eaux souterraines susceptibles de
corroder les containers et de transporter des produits toxiques vers la biosphère (Karnland,
2003). Les bentonites sont considérées comme étant le matériau le plus adapté à un tel
remplissage du fait de leur faible conductivité hydraulique, de leur capacité de colmatage
(self-sealing) et de leur forte capacité de rétention des radionucléides (Herbert &Moog, 1999;
Hermann-Stengele &Plötze, 2000; Komine &Ogata, 2004; Pusch, 2006b). Dans ce cas, le flux
d'eau devrait être drastiquement réduit et la diffusion est supposée représenter le processus de
transport dominant. D'éventuelles fissures dans la barrière sont supposées être colmatées par
l'augmentation du gonflement (self sealing) et les fortes capacités d'échange cationique et de
sorption des argiles devraient restreindre le transport de radionucléides toxiques dans
l'éventualité d'une fuite de solutions contaminées (Müller-Vonmoos &Kohler, 1993; Molera
et al., 2003; Montes-Hernandez et al., 2005c).
Bien que les smectites soient très stable dans leur environnement naturel d'origine, tout
changement de leurs propriétés en contexte de stockage souterrain est susceptible de diminuer
les performances de la barrière. Comme une solution aqueuse de composition variable est
susceptible d’infiltrer le site de stockage, des réactions à long terme peuvent être attendues
sous l'effet des modifications des conditions géochimiques (Karnland &Sandén, 2000;
Karnland, 2003). A titre d'exemple, une altération minérale (des minéraux accessoires aussi
bien que de la smectite) peut être induite par le contact avec la solution infiltrée ; ce processus
étant fortement dépendant des caractéristiques chimiques de la solution (pH, force ionique).
De telles réactions peuvent prendre place lorsque des solutions salines entrent dans la zone de

Chapitre 1 - Introduction ______________________________________________________________________________________________________________________________________________________________________________________________________________________________
6
remplissage, ce qui est un scénario possible lors du confinement au cœur de formations
salines (Hofman, 2003). Par ailleurs, des infiltrations d'eau de mer sont possibles dans le cas
de sites de confinements proches de zones côtières (projet japonais) si le niveau de la mer
augmente du fait du réchauffement climatique (Gustafsson, 2004).
De nombreuses approches ont été adoptées afin d'étudier les réactions dans le matériau
smectitique et l'encaissant rocheux adjacent. Ces approches ont inclus des études sur
analogues naturels (Montes-Hernandez et al., 2003a), des tests en laboratoires souterrains
(Marcos, 2002; Delay et al., 2007; Garavito et al., 2007; Rothfuchs et al., 2007), des
expérimentations in situ à large échelle (Martin &Barcala, 2005; ENRESA, 2007) et le
développement de modèles numériques (Haycox et al., 2006; Rotenberg et al., 2007). Toutes
ces études se sont focalisées sur le comportement supposé des argiles de la barrière avec le
temps. Un aspect important réside dans la caractérisation des changements dynamiques ayant
lieu pendant l'hydratation de la smectite en conditions de volume confiné, équivalentes aux
conditions de stockage souterrain. Dans ce cas, la connaissance des mécanismes et de la
quantité d'eau admise dans le système est un facteur prédominant pour la compréhension et la
prédiction de la capacité de colmatage et d'imperméabilisation du matériau smectitique ainsi
que son efficacité à adsorber ou transporter les radionucléides. Un des aspects clés d'une telle
étude est de quantifier la quantité d'eau présente dans les sites interfoliaires en opposition à
l'eau moins stable adsorbée à la surface des particules et remplissant l'espace poral disponible.
Bien que peu d'études aient été réalisées sur le sujet, ces aspects sont considérés comme
essentiels au regard de l'évaluation des performances des barrières ouvragées.
Le rôle des bactéries présentes dans les stockages souterrains est également sujet à
débat. En effet, diverses études ont portées sur la possibilité d'une rétention des radionucléides
par les bactéries et les biofilms associés (Stroes-Gascoyne &Sargent, 1998; Jolley, 2002) et
sur la corrosion des containers induite par les bactéries (Stroes-Gascoyne &West, 1994; King
et al., 1999; King et al., 2004). Cependant, jusqu’à présent, peu d'études ont été réalisées afin
de déterminer comment les bactéries peuvent influencer les propriétés d'hydratation des
bentonites et des smectites riches en fer. Ceci reflète probablement le manque de méthodes
analytiques permettant le suivi in situ de l'hydratation de la smectite en solution en volume
confiné, avec et sans bactéries. De manière à combler ce manque, la présente étude utilise un
nouveau type de cellule réactionnelle, adaptable à un diffractomètre de rayons X afin de
réaliser des mesures in situ de l'état d'hydratation d'argiles compactées. Accroître les
connaissances concernant les taux et mécanismes d'hydratation de la smectite en conditions
stériles et en présence de bactéries est de première importance au regard des applications

Chapitre 1 - Introduction ______________________________________________________________________________________________________________________________________________________________________________________________________________________________
7
industrielles actuelles. De plus, une telle connaissance contribuerait à augmenter notre
compréhension des réactions de subsurface ayant lieu dans les environnements argileux
compactés.
1.4. Objectifs de l'étude
Les principaux buts que nous nous sommes fixés dans le cadre de cette thèse étaient :
• de développer un ensemble de techniques analytiques permettant d'étudier in situ
l'hydratation de la smectite pendant l'infiltration des solutions aqueuses, en
conditions de volume confiné, avec et sans présence de bactéries
• de déterminer la nature des interactions smectite-bactéries en solution et comparer
avec des systèmes en volume confiné
• et enfin d’explorer les implications des résultats obtenus à partir du large panel
d'expériences en laboratoires présentées et d’évaluer leur importance dans le
contexte de l'enfouissement des déchets nucléaires.
1.5. Plan de la thèse
Le chapitre 2 fournit une description de la structure des smectites, de leurs propriétés
physico-chimiques ainsi que de réactions d'altération correspondantes. Il introduit brièvement
les approches analytiques couramment utilisées pour étudier l'hydratation des smectites. Il
contient par ailleurs, par ailleurs, une brève présentation des bactéries, de leur structure et de
leurs besoins nutritionnels, ainsi qu'un résumé des interactions connues dans les
environnements de surface et plus particulièrement dans les milieux argileux.
Dans le chapitre 3, les matériaux smectitiques utilisés dans cette étude (smectite
purifiée, poudre de bentonite) sont décrits et les caractéristiques de l'espèce bactérienne
utilisée (Shewanella putrefaciens) sont présentées. Les méthodes analytiques utilisées sont
décrites, et le principe de fonctionnement de la cellule réactionnelle ("wet-cell", Warr &
Hoffman, 2004) utilisée pour étudier l'hydratation des argiles gonflantes en volume confiné
est expliqué en détail, notamment son emploi en tant qu'analogue au laboratoire des
conditions d'enfouissement souterrain.
Chapitre 1 - Introduction ______________________________________________________________________________________________________________________________________________________________________________________________________________________________
8
Dans le chapitre 4, les résultats obtenus sur l'hydratation des smectites en conditions
abiotiques et en volume confiné sont discutés en fonction du type de cation interfoliaire, de la
densité de compaction et de la composition de la solution infiltrée. L'hydratation de la
smectite est caractérisée par la combinaison de mesures de diffraction in situ des rayons X et
le traitement des spectres de diffraction ainsi obtenus. Ceci permettant de quantifier l’eau
interfoliaire. Combinés avec des mesures gravimétriques, ces résultats ont également été
utilisés afin de calculer le volume d’eau incorporé à la fois dans les sites interfoliaires et non-
interfoliaires (surface et porosité). Les valeurs de surfaces spécifiques et l’organisation
texturale de ces argiles, calculées de manière qualitative à partir des changements d’épaisseur
des particules et l’organisation des couches d’eau (ordering) sont également présentées.
Le chapitre 5 présente les résultats des expériences mettant en interaction la smectite
et S. putrefaciens, pour une sélection de smectites. La première partie est basée sur des
expériences en batch, d’argiles en suspension réalisées afin de quantifier l'impact de différents
types de smectites (nontronite et MX80) sur la croissance microbienne de S. putrefaciens, en
utilisant des méthodes de comptage de cellules viables. En parallèle, l'impact des bactéries sur
la composition et les propriétés des smectites a été déterminé par ICP-OES, microscopie
confocale et électronique (MEB environnemental et MET couplé à un système EDX). Dans la
seconde partie, les résultats montrant l'impact des bactéries sur le comportement d'hydratation
in situ des smectites en volume confiné sont présentés. L'ensemble de ces résultats est, par la
suite, discuté afin de définir la nature de l'altération chimique et texturale induite par les
bactéries.
Dans le chapitre 6 les résultats présentés dans les chapitres 4 et 5 sont résumés et
discutés au regard de l'application des matériaux smectitiques dans le contexte du stockage de
déchets, avec un intérêt particulier sur le rôle des bactéries. Finalement, une dernière partie
présente les conclusions majeures et originales de ce travail de thèse.

___________________________________________________________________________
CHAPTER 1
-
INTRODUCTION
___________________________________________________________________________

Chapter 1 - Introduction ______________________________________________________________________________________________________________________________________________________________________________________________________________________________
10
1. INTRODUCTION
1.1. Swelling clays and microbial life
The reactive nature of both bacteria and fine-grained minerals on Earth provide an
enormous potential for various types of interaction in hydrous environments. First
publications linking the fields of geology and microbiology appeared at the beginning of the
last century when the involvement of microorganisms in the formation of hydrogen sulfide
and calcium carbonates was reported (Nadson, 1903; in Ivanov &Karavaiko, 2004). Since this
time, microbe - mineral interaction has become a topic of central importance in environmental
and life sciences. Bacteria have been shown to have pronounced effects on both mineral
growth (Gorshkov et al., 1992; Kohler et al., 1994; Ehrlich, 1999; Kawano &Tomita, 2001)
and mineral dissolution (Bennett et al., 1996; Liermann et al., 2000b; Rosenberg &Maurice,
2003; Aouad et al., 2006; O'Reilly et al., 2006). Additionally, minerals coated with bacteria
and/or bacterial exudates often exhibit increased rates of alteration at the interface (Marshall
et al., 1971; Van Loosdrecht et al., 1990; Maurice &Warren, 2006). As bacteria-mineral
interactions are also observed to alter the chemical composition of resident water, including
the pH and redox state, it is now accepted that detailed knowledge of these reactions is
essential for understanding the chemistry of the hydrosphere and lithosphere (Ehrlich, 1996;
Liermann et al., 2000a; Haas, 2004).
The interaction between bacterial activity and smectite was also addressed in
pioneering papers by Stotzky (1966a; 1966b) and Stotzky and Rem (1966; 1967). Especially,
the implication of montmorillonite characteristics (e.g. cation exchange capacity and specific
surface area) on the activity and ecology of microorganisms in soils was studied with regard
to changes on microbial habitats. Because of the high water content of smectites and their
abundance in soils and sediments, the nature of interplay between bacteria and the swelling
clay minerals is of special interest. Smectites are minerals with unique physical and chemical
properties: they exhibit a weak permanent layer charge and can therefore sorb into their
structure large quantities of water (or other polar substances) and various cations. In recent
years, particular attention has been given to the bacterially induced changes in the layer
charge properties of Fe-smectite (nontronite). It is now accepted that a chemical or
biologically driven (anaerobic) reduction of Fe(III) in the smectite structure leads to an

Chapter 1 - Introduction ______________________________________________________________________________________________________________________________________________________________________________________________________________________________
11
increase in the surface layer charge. Such changes have also been shown to diminish the
hydration capacity of the Fe-smectite (Stucki et al., 1987; Wu et al., 1988; Lovley, 1991;
Kostka et al., 1996; Kostka et al., 1999; Kim et al., 2004; Kim et al., 2005; Lee et al., 2006;
Stucki &Kostka, 2006). In the anaerobic experiment of Kim et al. (2004), the activity of
Shewanella oneidensis was even reported to induce the smectite to illite (10Å-phase)
transformation by fixation of K into the interlayer space. As this reaction occurred at 25°C,
and over the time period of just 2 weeks, it was suggested that Fe-smectite-bacterial
interaction can play a key role in driving clay mineral reactions in anaerobic environments.
Despite these numerous studies now conducted in this field of research, it remains a great
challenge to advance the understanding of the relationship between microbes and minerals
and, especially, to elucidate the complex nature of reactions occurring between bacteria and
the smectite clays.
1.2. Swelling clays in industry
Swelling clay minerals form the main component of bentonite, which, because of their
high sorbent properties and sealing capacity, constitute one of most important industrially
applied clay mineral materials (Murray, 1977; Elzea &Murray, 1990). The name bentonite
was first introduced in the year 1898 and it refers to a rock found in the « Benton-Shale »,
Wyoming. Nowadays, it is used for materials that essentially contain smectite (O'Driscoll,
1988; 1989). The most important applications include its use as a binding agent in the
pelletization of iron ores, as foundry mouldings or as oil well drilling fluids (Harvey &Lagaly,
2006). Bentonite dispersions are also used in civil engineering, as a thickening agent (e.g. in
paints), as chemical sorbants (e.g. for proteins) and in the stabilization of beer and wine
(Sarmento et al., 2000). Because of their extensive adsorption capacity, high surface area and
the impermeable nature when hydrated, the smectite minerals are also applied as sealant
barriers in waste disposal sites. With today’s increasing need for energy, and the development
of nuclear power, new challenges have arisen concerning the safe storage of the generated
nuclear waste. Here the swelling clays (bentonites) are considered for construction of the
engineered backfill barrier in many planned underground waste repositories, as described in
more detail in the following section.
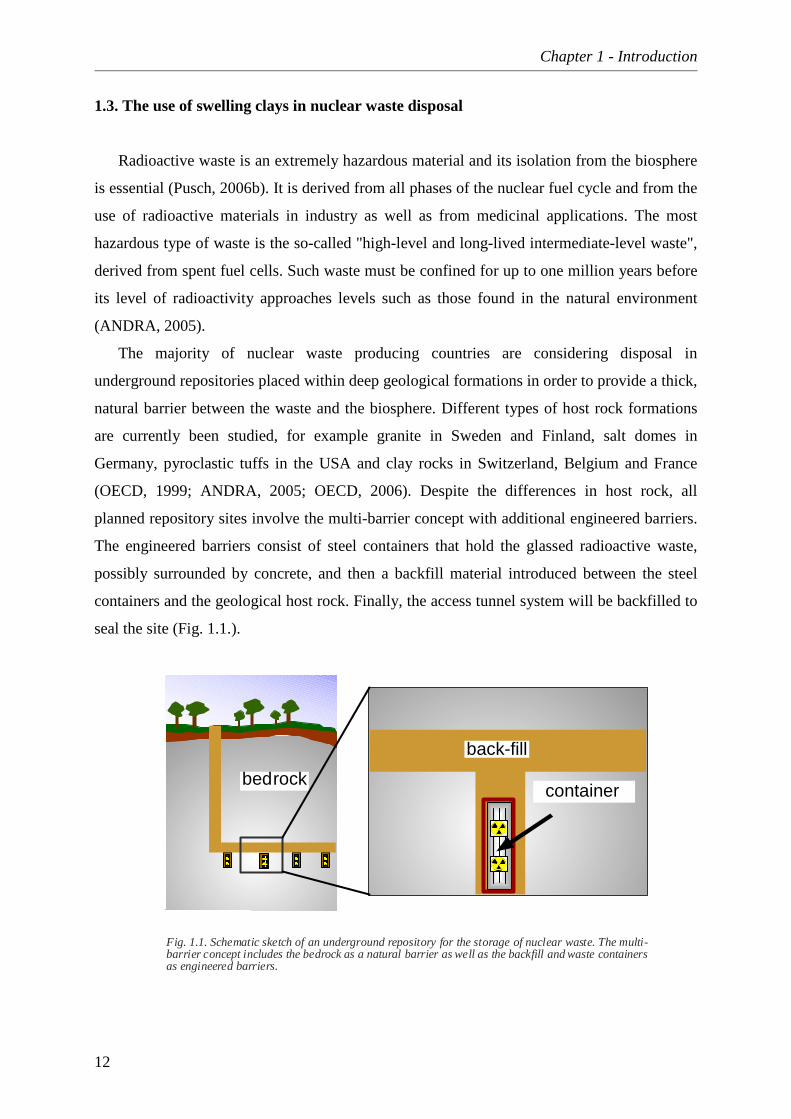
Chapter 1 - Introduction ______________________________________________________________________________________________________________________________________________________________________________________________________________________________
12
1.3. The use of swelling clays in nuclear waste disposal
Radioactive waste is an extremely hazardous material and its isolation from the biosphere
is essential (Pusch, 2006b). It is derived from all phases of the nuclear fuel cycle and from the
use of radioactive materials in industry as well as from medicinal applications. The most
hazardous type of waste is the so-called "high-level and long-lived intermediate-level waste",
derived from spent fuel cells. Such waste must be confined for up to one million years before
its level of radioactivity approaches levels such as those found in the natural environment
(ANDRA, 2005).
The majority of nuclear waste producing countries are considering disposal in
underground repositories placed within deep geological formations in order to provide a thick,
natural barrier between the waste and the biosphere. Different types of host rock formations
are currently been studied, for example granite in Sweden and Finland, salt domes in
Germany, pyroclastic tuffs in the USA and clay rocks in Switzerland, Belgium and France
(OECD, 1999; ANDRA, 2005; OECD, 2006). Despite the differences in host rock, all
planned repository sites involve the multi-barrier concept with additional engineered barriers.
The engineered barriers consist of steel containers that hold the glassed radioactive waste,
possibly surrounded by concrete, and then a backfill material introduced between the steel
containers and the geological host rock. Finally, the access tunnel system will be backfilled to
seal the site (Fig. 1.1.).
bedrock container
back-fill
Fig. 1.1. Schematic sketch of an underground repository for the storage of nuclear waste. The multi-barrier concept includes the bedrock as a natural barrier as well as the backfill and waste containersas engineered barriers.
Chapter 1 - Introduction ______________________________________________________________________________________________________________________________________________________________________________________________________________________________
13
The main function of the backfill is to reduce ground water inflow that could corrode
containers and transport hazardous compounds to the biosphere (Karnland, 2003). Bentonites
are considered to be the most suitable backfill material because of the low hydraulic
conductivity, the so-called self sealing capacity and the high retention capacity for
radionuclides (Herbert &Moog, 1999; Hermann-Stengele &Plötze, 2000; Komine &Ogata,
2004; Pusch, 2006b). Here, the flow of water is expected to be drastically reduced that
diffusion is the dominating transport process. Cracks in the barrier are expected to be closed
during enhanced swelling (self sealing) and the high cation exchange and sorption capacity of
the clay should restrict the transport of hazardous radionuclides in the case of leakage of
contaminated solutions (Müller-Vonmoos &Kohler, 1993; Molera et al., 2003; Montes-
Hernandez et al., 2005c).
Although smectites are very stable in their original natural environment, any changes in
the minerals properties within the underground repository could decrease the performance of
the backfill barrier. As aqueous solution of varying composition may infiltrate the site, long
term reactions can be expected under the changing geochemical conditions (Karnland
&Sandén, 2000; Karnland, 2003). Depending on the solution chemistry (pH, ionic strength)
both accessory minerals and smectite can be altered. For example concentrated saline
solutions may enter the backfill zone when storing waste in salt formations (Hofman, 2003).
As well the infiltration of sea water is possible if repositories are close to coastal areas
(planned in Japan) and the sea level rises due to global warming (Gustafsson, 2004).
A wide range of approaches has been adopted in order to study reactions within the
smectitic backfill material and its adjacent wall rock. These have included natural analogue
studies (Montes-Hernandez et al., 2003a), testing within underground laboratories (Marcos,
2002; Delay et al., 2007; Garavito et al., 2007; Rothfuchs et al., 2007), large scale in situ
experiments (Martin &Barcala, 2005; ENRESA, 2007) and the development of numerical
models (Haycox et al., 2006; Rotenberg et al., 2007). All these studies addressed the expected
behaviour of the clay barrier with time. One important aspect is the characterization of the
dynamic changes that occur during the hydration of the smectite within confined volume
conditions, equivalent to the underground repository. Here, knowledge of the mechanisms and
amount of water intake and retention is critical for understanding and predicting the sealing
capability of the smectite material and its effectiveness in the adsorption or transport of
radionuclides. A key aspect of such a study is, to quantify the amount of structured (bound)
water stored in the interlayer sites, as opposed to more loosely held water adsorbed on particle

Chapter 1 - Introduction ______________________________________________________________________________________________________________________________________________________________________________________________________________________________
14
surfaces and in pore space. Although few studies have been conducted on this topic, these
aspects are considered to be essential when evaluating the performance of clay barriers.
The role of bacteria present in underground repositories is also a theme of current debate.
Studies here have focused on the possibility of radionuclide retention by bacteria and
associated biofilms (Stroes-Gascoyne &Sargent, 1998; Jolley, 2002) and the microbially
induced corrosion (MIC) of the steel containers (Stroes-Gascoyne &West, 1994; King et al.,
1999; King et al., 2004). However, little research has been undertaken to determine how
bacteria can influence the hydration properties in bentonite and Fe-smectites. This probably
reflects the lack of an analytical approach that allows in situ monitoring of smectite hydration
in solution, with and without bacteria in a confined volume system. To fill this niche, this
study employed a new type of flow-through reaction cell that can be mounted onto an X-ray
diffractometer for in situ measurements of the state of compacted clay hydration. Gaining
knowledge on the rates and mechanisms of smectite hydration in sterile and bacterial-
containing samples is considered to be of major importance with respect to current industrial
applications and furthers our general understanding of subsurface reactions in compacted clay
environments.
1.4. Objectives of the study
Therefore the objectives of this study were set as follows:
• To develop a set of analytical techniques to study in situ smectite hydration during
the infiltration of aqueous solution under confined volume conditions with and
without bacteria.
• To determine the nature of smectite - bacteria interaction in batch solution
experiments and to compare it with compacted clay systems.
• To explore the implications of the results obtained from the broad range of
laboratory experiments presented and to discuss their importance within the
context of nuclear waste disposal in underground repositories.

Chapter 1 - Introduction ______________________________________________________________________________________________________________________________________________________________________________________________________________________________
15
1.5. Outline of the thesis
Chapter 2 provides an overview of smectite structure, their physical-chemical properties and
relevant alteration reactions. A short introduction is given on the common analytical
approaches used to study smectite hydration. Additionally, a brief introduction is provided on
bacteria, their structure and nutritional requirements for growth, as well as a summary of
known interactions in surface environments and more specifically within clay mineral
substrates.
In Chapter 3, the smectite based materials studied (purified smectite and bulk rock
bentonite powder) are described as well as the characteristics of the bacteria used in this study
(Shewanella putrefaciens) are presented. The analytical methods are outlined, and the
reaction-cell (“wet-cell”, Warr & Hoffman 2004) applied to study the hydration of swelling
clay under confined volume condition is described. This device is used as a laboratory
analogue for underground repository conditions.
In Chapter 4, the results of abiotic smectite hydration under confined volume conditions
are presented and discussed as a function of the type of interlayer cation, packing density and
the ionic strength of infiltrated solution. Smectite hydration is characterized by combining in
situ X-ray diffraction and the calculation of diffraction patterns, which allows quantification
of the amount of structured water layers occurring in hydrated interlayers. Combined with
gravimetric measurement, these results are also used to calculate the volume of water
incorporated into both interlayer and non-interlayer (surface and pore) sites. Qualitative
information on surface area and textural organization is also presented based on calculated
changes in particle thickness and the structural organization of water layer structures (degree
of ordering).
In Chapter 5, the experimental results of smectite – S. putrefaciens interaction are
presented for selected smectite minerals. The first part is based on batch experiments
conducted to quantify the impact of smectite (nontronite and MX80) on the growth of S.
putrefaciens by using viable cell counts. The impact on smectite composition and mineral
properties was determined by ICP-OES, confocal and electron microscopy (ESEM and TEM
coupled to EDX). In the second part, results showing the impact of bacteria on the in situ
hydration behaviour of smectite under confined volume conditions are presented. These
results are then discussed in order to define the nature of bacterially induced chemical and
textural alteration.

Chapter 1 - Introduction ______________________________________________________________________________________________________________________________________________________________________________________________________________________________
16
In Chapter 6, the results presented in Chapters 4 and 5 are summarized and discussed with
regard to the application of smectite based buffer materials in an underground waste
repository, with special focus on the role of bacteria. The thesis finishes with a list of general
conclusions.

___________________________________________________________________________
CHAPTER 2
-
STRUCTURE AND PROPERTIES
OF SMECTITES AND OF
RELATED BACTERIA
___________________________________________________________________________

Chapter 2 – Structure and properties of smectites and of related bacteria ______________________________________________________________________________________________________________________________________________________________________________________________________________________________
18
CHAPTER 2 – STRUCTURE AND PROPERTIES OF SMECTITES AND OF RELATED
BACTERIA
2.1. Smectites
Swelling clay minerals belong to the hydrated phyllosilicates subclass (Table 2.1) and
are rather unique in the Earth’s environment because they have the ability to adsorb quantities
of water, and other polar substances by the ordered expansion of their crystal lattices (Hofman
&Bilke, 1936; Mooney et al., 1952; Norrish, 1954; MacEwan &Wilson, 1980; Sposito
&Prost, 1982; Sato et al., 1992; Bergaya &Lagaly, 2006; Brigatti et al., 2006). Smectites are
2:1 phyllosilicates that are built up by a succession of tetrahedral-octahedral tetrahedral sheets
(TOT). Two successive TOT are separated by an interlayer space (Fig. 2.1). The tetrahedron
is composed of a central Si4+ atom (substitutions with Al3+ and/or Fe3+) surrounded by four
oxygen atoms that are linked via the corners in a sheet-like manner to form the so-called
tetrahedral sheet (Bailey, 1980; Brigatti et al., 2006). In the case of the octahedron the central
cation is usually Al3+, Mg2+, Fe2+ or Fe3+ that is surrounded by six oxygen atoms. The sharing
of neighboring oxygens results in an edge-linked, octahedral sheet structure (Velde, 1992). In
the case of dioctahedral smectites (e.g. montmorillonite, beidelllite, nontronite) the octahedral
sheet is predominantly occupied by trivalent cations whereas the octahedral sheet of
trioctahedral smectites (e.g. hectorite and saponite) is dominated by divalent cations (Bailey,
1980; Brigatti et al., 2006). In this study, montmorillonite and an Fe-smectite, nontronite,
were selected for detailed experimental investigation as these clays are considered to be
particularly important for understanding bentonite back fill systems and their predicted
alteration productions (Chapter 3).

Chapter 2 – Structure and properties of smectites and of related bacteria ______________________________________________________________________________________________________________________________________________________________________________________________________________________________
19
Charge per formula unit (PFU)
Dioctahedral species Trioctahedral species
Serpentin-kaolin group ~0 Kaolinite
(Si2)IV(Al2)VIO5(OH)4 Serpentine
(Si2)IV(Mg3)VIO5(OH)4 Talk-Pyrophyllite group
~0 Pyrophyllite (Si4)IV(Al2)VIO10(OH)2
Talc (Si4)IV(Mg3)VIO10(OH)2
Smectite group
Montmorillonite (My
+*nH2O)(Al3+2-yMg2+
y) Si4+4O10(OH)2
Hectorite (My
+ * nH2O)(Mg 23-yLi +y) Si4+
4O10(OH)2
Beidellite (Mx
+*nH2O)Al3+2
(Si4+4Al3+
x)O10(OH)2
Saponite (Mx
+ * nH2O)Mg 2+3 (Si4+
4xAl3+x)O10(OH)2
~0.2-0.6 Nontronite
(Mx+ * nH2O)Fe 3+
2 (Si4+4xAl3+
x)O10(OH)2
Vermiculite group ~0.6-0.9 (Si4-xAl x)IV (Fe2-y Mgy)VI
O10(OH)2 (x+y)M+ (Si4-xAl x)IV (Mg3-y My
3+)VI
O10(OH)2 (x-y)/2Mg2+ Illite
~0.9 (Si4-xAl x)IV (Al2-y Mgy)VI
O10(OH)2 (x+y)K+
True mica group ~0.9-1 Muscovite
(Si3Al) IV (Al2)VI
O10(OH)2 K+
Phlogopite (Si3Al) IV (Mg3)VI
O10(OH)2 K+
Table 2.1. Compilation of layer charge and idealized formula of some representative 1:1 and 2:1 phyllosilicates modified from Bergaya & Lagaly (2006).
O
OH
SiMg, Fe
T
T
O
Na, CaNa, Ca
Fig. 2.1. Schematic representation of thecrystal structure of smectite. The alternatingsuccession of tetrahedral (T) and octahedral(O) units makes up the sheet-like structure.The interlayer space (IL) contains cationsand separates the TOT sheets. The resultinglattice thickness of the structure (d-value)is 9.6Å (modified after Grim, 1962).
T
9,6ÅIL
2.1.1. Layer charge and cation exchange capacity (CEC)
Besides the above described structural characteristics, smectite minerals can be
additionally characterized by the density and location of layer charge (Brigatti et al., 2006).

Chapter 2 – Structure and properties of smectites and of related bacteria ______________________________________________________________________________________________________________________________________________________________________________________________________________________________
20
The layer charge of smectite, derived from substitutions in either tetrahedral or octahedral
sheets, leads to an excess negative charge (ξ). For smectites this charge typically ranges
between -0.2 and -0.6 per formula unit (PFU, table 2.1), whereas for vermiculites, this charge
is higher and lies between -0.6 and -0.9 PFU (MacEwan &Wilson, 1980). The layer charge
may result from predominantly octahedral substitutions as in the case of montmorillonite
where trivalent Al3+ is substituted by divalent cations, or from tetrahedral substitutions, as
described for nontronite, where Si4+ is partly substituted by trivalent Al3+ (Velde, 1992). The
ability to exchange cations is expressed by the so-called cation exchange capacity (CEC)
which is highest in the case of smectites and linked to a particular range of layer charge
values. As the layer charge property controls many important characteristics, such as
hydration, swelling, clay fabric, and surface reactivity (Stucki, 1988) the electrostatic balance
of charge is a key parameter affecting the transfer and retention of water and elements that
serve as nutrients (e.g. in a soil) or pollutants in natural and anthropogenic environments.
However, with increasing layer charge the mineral looses the ability to exchange cations
because the interlayer cations become increasingly bound (such as K+ fixation in illite).
2.1.2. Edge charges
Another type of charge located at the edges of smectite particles makes up more than 20% of
the CEC (Lagaly, 1993; , 2006). The sign and density of this charge is, unlike the permanent
interlayer charge, dependent on the pH of the surrounding solution and therefore referred to as
the variable charge. In an acidic solution, the excess protons lead to the formation of positive
edge charges whose density decreases with increasing pH (Fig. 2.2.). Alkaline solutions in
contrast provoke the dissociation of silanol and aluminol groups leading to negative edge
charges that are compensated with cations. Uncharged edge sites are only found in solutions
of slightly acidic pH (5-6) but here ligand exchange occurs where OH groups are exchanged,
for example, by sulfate or phosphate groups (Lagaly, 1993). The edge charge is seen to play
an important role in buffering and sorption reactions within solution. For example a higher
proportion of edge sites was shown to enhance the overall retention of pollutants such as
UO22+ (Zachara &McKinley, 1993).

Chapter 2 – Structure and properties of smectites and of related bacteria ______________________________________________________________________________________________________________________________________________________________________________________________________________________________
21
+
OH
OH2
OH2
OH
A-
X-
OH
OH2
OH
X-
OH-
OH
OH2
OH
M
C
+
+
O-
pH < 5
positively charged edgesdue to excess protons atlow pH
anion exchange
equal amount of positiveand negative charges withincreasing pH
ligand exchange
pH 5 - 6 pH > 6
negative charged edges dueto dissociation of silanol andaluminol groups
cation exchange
Fig. 2.2. Schematic representation of the pH dependent edge charges (modified after Lagaly, 1993).
2.1.3. Interlayer hydration properties and analytical approaches to study hydration
The low negative layer charge of smectite (table 2.1) enables water molecules to coexist
with the interlayer cations and to hydrate them as a function of water activity (Norrish
&Quirk, 1954; Prost, 1975; Sposito &Prost, 1982). This process is generally known as
intracrystalline swelling and corresponds to the intercalation of H2O molecules in the
interlayer space as it expands (Nagelschmidt, 1936; Norrish, 1954; Norrish &Quirk, 1954;
Grim, 1962; Watanabe &Sato, 1988; Sato et al., 1992; Tamura et al., 2000; Suzuki et al.,
2005). This intercalation is governed by the size and charge of the saturating cation and as
well by the magnitude and localization of layer charge (MacEwan &Wilson, 1980).
At ambient conditions, monovalent interlayer cations preferentially form a one water layer
structure, which if homogenously distributed along all interlayers, results in a d-svalue of
~12.3Å. Divalent cations are normally surrounded by two water layers and yield an ideal d-
value of ~15.2Å. In the case of Ca2+, this spacing is stabilized by the formation of
octahedrally co-ordinated hexahydrate groups with the composition [Ca (H2O)6]2+ (Méring,
1946). However it is very rare that smectites are strictly homoionic and the presence of more
than one type of cations (typically mixtures of Na+, Ca2+, K+ or Mg2+) in the interlayer space
is common with variations of the hydrated interlayer spacings accordingly (MacEwan
&Wilson, 1980).
The amount of water intercalated in the interlayer space increases with humidity and can
form up to 4 layers of structured water (Bradley et al., 1937). As the mobility of the interlayer

Chapter 2 – Structure and properties of smectites and of related bacteria ______________________________________________________________________________________________________________________________________________________________________________________________________________________________
22
cation successively increases with hydration state (Lagaly, 1993) the name “quasi-
crystalline” was proposed to describe the thicker water layer structures (Hofmann et al.,
1957). If smectite expands more than 20Å the quasi-crystalline structure is lost and the
interlayer cations build diffuse double layers. Experimental studies of interlayer expansion
under conditions of elevated relative humidity have also shown transformations to take place
in a step-wise manner with the occurrence of discrete hydration states (Mooney et al., 1952;
Norrish, 1954; MacEwan &Wilson, 1980). The early observation of continuous swelling by
Nagelschmidt (1936) and Hofman and Bilke (1936) is considered to represent random
interstratifications of different hydrates (MacEwan &Wilson, 1980).
The state of interlayer hydration can be determined from X-ray diffraction patterns by
quantifying the position and shape of the basal lattice layer reflections (Chapter 3). In analogy
with mixed layered clay minerals, that are formed of two or more kinds of intergrown layers
(e.g. illite-smectite), the diffraction properties of smectite containing a mixture of different
water layer structures can treated according to Méring’s principle (Méring, 1949). The basal
X-ray diffraction peaks of mixed layered clays occur between the nominal positions of both
members and their precise position is fixed by the relative proportions of the interstratified
phases (Moore & Reynolds 1997; Chapter 3).
Smectite interstratifications are generally considered to be random (R=0) or ordered (e.g.
R=1) although the precise nature of ordering at the lattice scale is still a topic of debate.
Moore and Hower (1986) described the regular (non-random) stacking of 1 and 2 water layer
hydrates resulting in varying basal spacing (d001) that formed as a function of the relative
humidity. The ordered arrangement was suggested to be more stable, resulting from the
electrostatic interaction of the interlayer cation with the hydroxyl ions. When the two water
layer thicknesses were present in equal abundance (e.g. 50% 1WL and 50% 2WL) with
regular interstratification, the formation of a superstructure was observed by X-ray diffraction
and confirmed by peak calculations.
The types of ordering present in mixed layered minerals are best studied by matching
measured XRD patterns with calculated profiles. The best known program for simulating one-
dimensional diffraction patterns is NEWMOD (Reynolds, 1985), but there are limitations to
the number of mixed-layered phases that can be mixed simultaneously. Recent simulations of
smectite swelling under elevated air humidity consider that complex diffraction patterns are
best reproduced by calculating mixtures of both pure and mixed layered structures to be
necessary to account for observed heterogeneities (Ferrage et al., 2005a; Ferrage et al.,
2005b). However, in this study the observed XRD patterns were most satisfactorily fitted

Chapter 2 – Structure and properties of smectites and of related bacteria ______________________________________________________________________________________________________________________________________________________________________________________________________________________________
23
assuming only mixed layered structures, as long as enough components were included.
Preliminary tests using non mixed layered components yielded poorer results.
Molecular simulations have also been applied to model the hydration structure of
smectites when experimental constraints are absent. Based on such studies, the chemical
properties, reaction mechanisms, thermodynamics, and kinetics of the hydration mechanism
were identified (Monsalvo et al., 2006). Simulations using the Monte-Carlo algorithm are
most common. In this approach the energy of a randomly chosen compound in a system (with
defined coordinations) is calculated by varying randomly its position or rotation until a
minimum energy is obtained. Here, the change from an old to the new state is based on the
assumption of certain probabilities and energetic minimums. The calculated molecular
structures serve as a basis for calculating various crystal-chemical parameters such as the
thickness of the hydrated interlayer (Meleshyn, 2005). Simulations of Na-montmorillonite
confirmed the presence of four stable hydration states (at 9.7, 12.0, 15.5, and 18.3Å,
respectively), the thicknesses of which are in good agreement with experimental data
(Karaborni et al., 1996). Based on such studies, the combination of experimental results and
computer simulations is seen to be an essential part of understanding complex molecular
reactions such those involved in smectite hydration.
2.1.4. The diffuse double layer, DLVO theory, and implications for smectite swelling
The double layer model (Gouy-Chapman-Model) is used to describe the ionic
environment in the vicinity of a charged particle and explains how electrical repulsive forces
occur. A negatively charged particle causes firmly attached positive ions to concentrate at the
surface of the clay particle (known as counter-ions) to form the so-called “Stern layer”
(represented as one layer of positive charges in Fig. 2.3). The diffuse layer results as a
consequence of positive ions being attracted by the negative charged surface but
simultaneously repelled by the “Stern layer” and other positive ions trying to approach the
particle (Shaw, 1992). The concentration of positively charge ions decreases with increasing
distance from the particle surface until equilibrium with the solution is attained. The Stern-
and the diffuse-layer together are called the “diffuse double layer” (Fig. 2.3.a). The DLVO
theory (independently proposed by Derjaguin and Landau in 1941 and by Vervey and
Overbeek in (1948) provides a quantitative description of interaction of negatively charged

Chapter 2 – Structure and properties of smectites and of related bacteria ______________________________________________________________________________________________________________________________________________________________________________________________________________________________
24
particles and includes the basic concept of mutual repulsion of overlapping diffuse double
layers and the attraction of particles due to the London-van der Waals forces.
The behaviour of smectite particles in solution can be well understood by applying the
diffuse double layer model. The thickness at which swelling occurs is driven by the forces of
the charged surfaces and the transition to osmotic swelling, which is controlled by
concentration gradients. This transition usually corresponds to layer separations >30Å as
indicated by small angle scattering techniques (Tchoubar & Cohaut (2006). This contrasts to
the proposed 20Å limit of Hofmann et al. (1957). At this point the interlayer becomes
detached and the exposed cations build a diffuse double layer between the layers that repulse
each other as the coherence between particles is lost (Fig. 2.3.b). This so-called osmotic
swelling transforms interlayers into free surfaces and create very thin independent particles
which do not overlap (Lagaly, 1993; Likos, 2004; Lagaly, 2006).
-
------
-
- -
---
--
- -
-+
++
+++
+
+
+
+ +
+
+
+
++
distance from surface
Guy-Chapman-Modeldouble layer
-
-
-
bulk solutiona) b)
+
+
+
++
++
-
Fig. 2.3. a) Schematic representation of the diffuse double layer of asmectite sheet-silicate particle in suspension. b) Formation of tactoidparticles due to osmotic swelling (modified after Lagaly, 1993).
With increasing concentration of the electrolyte (Fig. 2.4.a) the diffuse double layer is
suppressed and particles are able to approach each other (McNeil, 1970; Lagaly, 1993; ,
2006). When particles approach a distance of ~10Å the Van-der-Waals attractive forces
overcome the electrostatic repulsion forces and the particles coagulate to form aggregates
(Fig. 2.4c, Lagaly 1993). A typical value for the critical coagulation concentration of
Wyoming montmorillonite is 3.5 mmol/l NaCl (~0.2g/l) for a maximal of 18g/l dispersed clay
(Lagaly, 2006). In addition to dissolved salts, numerous other components can lead to

Chapter 2 – Structure and properties of smectites and of related bacteria ______________________________________________________________________________________________________________________________________________________________________________________________________________________________
25
coagulation (see Lagaly 2006) including organic macromolecules. Here, important
mechanisms are charge neutralization (the molecule and the clay surface having opposite
charge) and the molecular bridging of adjacent particles.
Fig. 2.4. a) With increasing ionic strength the dimension of the diffuse double layer is decreased. b) The curves forinteraction energy show decreasing electrostatic repulsion and increasing influence of Van-der-Waals attractive forces.c) Coagulation of particles forming stair-step-card house structures (Hofmann, 2000; modified after Lagaly et al.1997).
+
+--
-----
+
+++++
+
+
++
+
+
+
+
+
+
+
+
++
+
-
--
-----
+
+++++
+
+
+
++
+
+
+
++
+
-
increase of ionic strength
high ionic strength
low ionic strength
repulsion
attraction
Interaction energy(Vervey & Overbeek 1948)
a) b)
c)
2.1.5. Hydration of non-interlayer sites: surface and pore water
In smectite-rich clay such as bentonite, water is not only stored within interlayers but is
also located outside the crystal structure, namely as adsorbed water on external particle
surfaces or as free pore water stored between adjacent grains or minerals aggregates (Prost,
1975; Sposito &Prost, 1982). In the case of smectite the enormous specific surface area (SSA)
is one of the most important properties controlling surface phenomena including the uptake of
organic and inorganic molecules (Michot &Villieras, 2006). The amount of available surface
area is highly dependent on the state of particle swelling. Maximal values for external
surfaces range up to 850 m2/g; a surface which is theoretically available for water adsorption
(Schramm &Kwak, 1982; Michot &Villieras, 2006). In addition to this immense surface area,
smectites commonly have relatively high porosities due to their microtextural arrangement. A

Chapter 2 – Structure and properties of smectites and of related bacteria ______________________________________________________________________________________________________________________________________________________________________________________________________________________________
26
typical porosity of a smectite-rich soil for example ranges between 58% and 51% (Horgan,
1999), corresponding to a bulk density of 1.1 and 1.3 g/cm³, respectively. Such porosities
provide a natural capacity to store water in micropores as infiltrating aqueous solution
replaces air. In the hydrated state these pores are however frequently not connected and in
such conditions the smectites have characteristically low hydraulic conductivities (depending
on the packing density, ranging between 1E-11 and 1E-14 m/s, Pusch 1994; 2006).
Water adsorption on the siloxane surface of smectite particles, which is the basal plane of
a tetrahedral sheet, is mostly depending on the local charge distribution (Sposito &Prost,
1982). For montmorillonite the isomorphic substitution occurs in the octahedral sheet and the
resulting excess negative charge allows the surface to form adsorption complexes with cations
and water molecules by weak hydrogen bonds (Sposito &Prost, 1982; Sposito et al., 1999).
This effect is even more enhanced in nontronite where substitution occurs mostly in the
tetrahedral sheet. The resulting excess negative charge localized closer to the siloxane surface
leads to stronger adsorption complexes and the formation of stronger hydrogen bonds is
possible (Sposito et al., 1999).
2.1.6. Smectite swelling in a confined volume system
Although a restricted reaction volume is the common situation in many natural and
engineered systems, the hydration behaviour in such conditions is not well studied
experimentally. The uptake of water in a confined volume and the associated expansion
depending on the packing density can generate swelling pressures ranging from 0.06 to 12
MPa (Pusch, 2006a; 2006b). The latter value is typical for pressures at more than 10km
crustal depth. Therefore swelling under such conditions is different from that observed in free
swelling. The elevated solid to liquid ratio in engineered clay systems and the effect of bulk
characteristics such as the pore water chemistry has been addressed in various models
(Muurinen &Lehikoinen, 1999; Bradbury &Baeyens, 2003; Wersin et al., 2004). In such
studies the main reactions could be identified depending on the system parameters, such as
the degree of equilibrium attained in the bulk mineral assemblage, Na+-Ca2+ exchange
reactions and deprotonation of functional surface groups. However it is generally considered
that many uncertainties remain with regard to the effects of smectite swelling and the
chemical properties of the interstitial water (Wersin, 2003).

Chapter 2 – Structure and properties of smectites and of related bacteria ______________________________________________________________________________________________________________________________________________________________________________________________________________________________
27
The different water storage sites, namely the interlayer, surface and pore spaces are most
likely to influence the mechanisms of sealing, sorption and transport in fundamentally
different ways. A quantification of the distribution of water between these sites is therefore
considered as important for predicting of the behaviour of hydrated smectite clays in both
natural and anthropogenic environments.
2.2. The role of bacteria
Another aspect of importance is the role bacteria play in influencing clay mineral
reactions in low temperature aqueous environments. Bacteria are abundant in near surface
conditions and have been shown to be present in deep geological formations (Fredrickson &
Onstott, 1996) and in naturally occurring bentonite (Pedersen, 2000, Fukunaga et al. 2005).
The impact they have in affecting mineral reactions is strongly dependent on the type of clay
and bacteria present, but in a number of cases they have been shown to enhance mineral
dissolution (Banfield & Welch, 2000). Dissimilatory reduction of Fe-smectites under
anaerobic conditions by Shewanella species was shown to increase layer charge and
decreased particle swelling (Gates et al 1993, Kostka et al 1999, Kim et al. 2003; 2004) and
was accompanied by partial mineral dissolution (Stucki et al. 1987, Wu et al. 1988, Gates et
al, 1993, Kostka et al. 1999, Kim et al 2003, 2004, Kostka et al. 2003b).
2.2.1. Structure, properties and requirements of bacteria
Bacteria are abundant in soils and sediments in both terrestrial and marine environments.
They flourish in the extreme conditions of hot springs (Corliss et al., 1979), deep in the
Earth’s crust (Fredrickson &Onstott, 1996) and have even been reported in nuclear waste
material (Fredrickson et al., 2004; Nazina et al., 2004). The biochemical functions they
perform in system Earth are numerous and of critical importance in the ecological
environment, serving as decomposers, gas fixators and agents of fermentation. They also play
an important role in bioremediation by degrading and transforming hazardous contaminants
such as toxic metals and radionuclides (Willey et al., 1996; Banfield &Welch, 2000; Lloyd,
2003; Madigan et al., 2003; Konhauser, 2007; Muller et al., 2007). Members of the genus
Shewanella were among the first organisms shown to grow by dissimilatory metal and

Chapter 2 – Structure and properties of smectites and of related bacteria ______________________________________________________________________________________________________________________________________________________________________________________________________________________________
28
radionuclide reduction and they have been intensively studied with regard to biogeochemical
cycling and bioremediation (Haas et al., 2001; Marshall et al., 2006; Payne &DiChristina,
2006).
Bacteria are a group of single-cell microorganisms with prokaryotic cellular
configuration (Fox et al., 1977; Woese &Fox, 1977; Woese, 1987; Madigan et al., 2003).
Typically, a few µm in length, individual bacterial shapes range from spheres to rods and
spirals. In contrast to animals or plants, a bacterial cell can carry out the key life functions
such as growth, energy generation and reproduction independently without the need of other
cells. A prokaryotic cell (bacteria and Archaea) is compared to the eukaryotic cell more
simple in structure, lacking a membrane-bound nucleus and instead of having chromosomal
DNA, their genetic information is contained in a circular loop called a nucleoid (Fig. 2.5).
cytoplasm
nucleoid ribosomes
cell wall
cytoplasmicmembrane
flagellum
Fig. 2.5. Internal structure of a procaryoticcell (modified after Madigan et al. 2003)
2.2.2. The bacterial cell wall
Two major groups of bacteria are recognizable based on their cell wall structure: the gram
negative and the gram positive (based on the cells response to the so-called gram stain).
Gram-positive cell walls consist primarily of one type of molecule, the peptidoglycan, which
provides strength to the wall by forming a relatively thick layer (Fig. 2.7). In contrast, the cell
wall of gram-negative bacteria is made up of a complex multilayered structure that contains
besides the peptidoglycan layer an additional layer made of lipopolysaccharide. The
lipopolysaccharides form the outer membrane of the cell walls of gram-negative bacteria and
contain macromolecules with carboxylate, phosphate and amino groups (e.g., Beveridge and
Murray, 1980; Plette et al., 1995). Generally bacteria cells are negatively charged in most
environmental conditions (Haas, 2004; Kronhauser, 2007) but the cell walls can be protonated

Chapter 2 – Structure and properties of smectites and of related bacteria ______________________________________________________________________________________________________________________________________________________________________________________________________________________________
29
or deprotonated, depending on the pH of the outside solution. This is basically due to the
macromolecules of the cell wall that contain exposed ionizable functional groups.
Additionally, buffering reactions can be linked to the bacterial metabolism such as the active
transport of protons (proton pump) and the subsequent release of exudates (Banfield
&Hamers, 1997; Barker et al., 1997; Banfield &Welch, 2000; Haas, 2004).
Teichoic acidLipotoichoic acid
Peptidoglycan
Periplasmicspace
Plasmamembrane
Peptidoglycan
Porin
Braun'slipoproteinO-specific
side chains
Outermembrane
Periplasmicspace andpeptidoglycan
Plasmamembrane
Integral protein
Phospholipid
Lipopolysaccharide
gram-positive gram-negative
Fig. 2.6. Schematic representation of the gram-negative and the gram-positive cell wall (Cleassens, 2006; modified after Willey et al. 1996).
2.2.3. Requirements for bacterial growth
Bacteria are relatively small with a common size of about 0.5-1µm in diameter and upto
~4µm in length. As a consequence, they have a large specific surface area compared to their
volume (e.g. 55m2/g for Shewanella putrefaciens, Haas 2004). As the surface area controls
the rate of nutrient transport into a cell as well as the rate of waste products excreted, bacterial
size fundamentally affects both the cells metabolism and growth rate. For successful growth
in nature or in the laboratory bacteria require water, an energy source, carbon and a range of
other nutrients (table 2.2).
Carbon is the major constituent of all cellular materials and in the case of bacteria it
makes up around 50% of its dry weight. It is therefore the main nutrient desired by all bacteria
(Madigan et al., 2003; Konhauser, 2007). After carbon, the second most abundant element in
a cell is nitrogen with around 12% dry weight. This element is a major constituent of amino
acids, nucleic acids nucleotides, and coenzymes (table 2.1). Phosphorous is required primarily

Chapter 2 – Structure and properties of smectites and of related bacteria ______________________________________________________________________________________________________________________________________________________________________________________________________________________________
30
as a constituent of nucleic acids and phospholipids, whereas sulphur is a constituent of amino
acids (cysteine, methionine) and several co-enzymes. Potassium is the main inorganic cation
and acts as a cofactor for certain enzymes. Other inorganic cellular cations are magnesium
and calcium that are cofactors for enzymatic reactions. Iron is the key component of
cytochromes and thus plays a major role in cellular respiration. A summary of the main
elements required as nutrients and some of their functions are compiled in table 2.2.
Element % of dry
weight Source Function
Carbon (C) ~50 organic compounds or CO2 Main constituent of cellular material Nitrogen (N) ~12 NH3, NO3, organic compounds,
N2 Constituent of amino acids, nucleic acids
nucleotides, and coenzymes Phosphorous
(P) ~3 inorganic phosphates (PO4) Constituent of nucleic acids, nucleotides,
phospholipids, LPS, teichoic acids Sulphur (S) ~1 SO4, H2S, So, organic sulphur
compounds Constituent of cysteine, methionine, glutathione,
several coenzymes Potassium
(K) ~1 Potassium salts Main cellular inorganic cation and cofactor for
certain enzymes Magnesium
(Mg) ~0.5 Magnesium salts Inorganic cellular cation, cofactor for certain
enzymatic reactions Sodium (Na) ~0.5 Sodium salts Mostly required by marine bacteria Calcium (Ca) ~0.5 Calcium salts Inorganic cellular cation, cofactor for certain
enzymes Iron (Fe) ~0.2 Iron salts Component of cytochromes and certain nonheme
iron-proteins and a cofactor for some enzymatic reactions
Table 2.2. Compilation of bacterial nutrients, including their source and function (Madigan et al., 2003; Todar, 2006).
In order to drive cellular biosynthesis and function, the bacteria require energy. This
energy can either come from the conversion of radiant energy (light) into chemical energy via
the process of photosynthesis (phototroph) or from oxidation-reduction reactions involving
inorganic or organic molecules (autotroph and heterotroph).
Additionally, a suitable range of physical conditions, especially temperature, and
optimal pH conditions are required. This is however highly depending on the bacterial
species. Hyperthermophilic bacteria, for example, prefer temperatures around the boiling
point of water as identified in samples from deep sea hydrothermal vents (Huber et al., 1989)
whereas other bacteria have been reported to be actively growing in the Siberian permafrost at
temperatures as low as -20°C (Rivkina et al., 2000). Acidophiles can live at pH values below
2 and are for example found in acid mine drainage whereas alkaliphiles grow at pH values up
to 11 and are often associated with soda lakes and carbonate rich soils (Konhauser, 2007).

Chapter 2 – Structure and properties of smectites and of related bacteria ______________________________________________________________________________________________________________________________________________________________________________________________________________________________
31
2.2.4. Shewanella putrefaciens
The gram negative S. putrefaciens are heterotroph and therefore require organic carbon
(Corg) to couple its oxidation with the reduction of an oxidized compound, the terminal
electron acceptor (TEA). As facultative anaerobes, they can switch between aerobic and
anaerobic types of metabolism. Under anaerobic conditions (no O2) S. putrefaciens can gain
energy by reducing various metals in particular Fe (Lovley, 1991; Lovley et al., 2004; Stucki
&Kostka, 2006) and Mn (Myers &Nealson, 1988; , 1990) whereas in the presence of O2 they
switch to aerobic respiration. According to their natural habitats optimal conditions of
temperature, salinity, and pH are that of typical marine and freshwater environments
(Venkateswaran et al., 1999). The strain used in this study (S. putrefaciens DMS 6067) grows
at optimal temperatures around 30°C and a near neutral pH (7).
2.2.5. Impact of bacteria on their environment
Within limits, bacteria can react and even evolve to changes in their environment and thus
readily adapt to a particular situation (Roszak &Colwell, 1987; Todar, 2006). Mineral
surfaces are preferred sites for metabolically active bacteria because nutrients are often
accumulated (Brown et al., 1977; Ellwood et al., 1982; Bright &Fletcher, 1983). In order to
attach to surfaces the majority of microorganisms in aquatic systems form biofilms and
assemble themselves in microcolonies (Flemming, 1995; Konhauser, 2007). Such a biofilm
consists mainly of highly hydrated exopolymeric substances (EPS) that are secreted by the
bacteria who are embedded within it. Biofilms trap nutrients for the growth of the microbial
population and help prevent cells from desiccating (Van Loosdrecht et al., 1989; , 1990;
Madigan et al., 2003).
Additionally, bacteria can produce compounds to acquire nutrients or other compounds. It
was for example shown that Shewanella oneidensis was shown to produce reductase proteins
that specifically interact with the mineral surface after the potential as a TEA was recognized
(Lower et al., 2001). As well the production of electron-shuttling compounds for electron
transfer was reported to be involved (Lovley et al., 2004). Another mechanism is the

Chapter 2 – Structure and properties of smectites and of related bacteria ______________________________________________________________________________________________________________________________________________________________________________________________________________________________
32
excretion of low molecular weight ligands that are especially produced to sequester essential
elements. Fe(III)-specific ligands are called siderophores (Neilands, 1989) that form
coordinative positions around the central Fe(III) cation. This complexation keeps iron in a
soluble form making it more easily accessible for bacteria (Birkel et al., 2002). It was
described that some bacteria (e.g. Pseudomonas mendocina) are able to adapt the siderophore
production to the availability of Fe(III) and so actively adapt to their environment (Hersman
et al., 1995; Hersman et al., 2000).
2.3. Conclusion an approach of this study
Smectites are unique minerals with very special properties such as their permanent and
variable layer charge, cation exchange capacity and large surface areas. The way that
smectites interact with the environment is directly linked to these properties and the behaviour
of the diffuse double layerin aqueous solution. Approaches to studying smectite hydration are
traditionally based on X-ray diffraction analyses under conditions of elevated air humidity in
combination with calculated diffraction patterns and more recently Monte-Carlo simulations.
Despite the wealth of knowledge on the hydration behaviour of bentonite clay in solution,
less work has been conducted to determine the mechanism and rate of hydration during the
infiltration of solution into pressed bentonite powders within a confined reaction volume. In
Chapter 4 this topic is addressed by using confined volume reaction-cells (“wet-cells”) that
are used to study hydration in situ as potential analogues for the infiltration of solutions into a
backfill section of a waste disposal site. Time-dependent results on the mechanism of
hydration in relation to the total influx of water into compacted bentonite are obtained and the
partitioning of solution into different water storage sites is quantified.
Bacteria are extremely diverse and inhabit almost every near surface environment in
and on the planet. Requirements for growth are highly dependent on the type of bacteria but
all require a source of carbon, a range of nutrients, energy, water and a favourable pH and
temperature range. Many species of bacteria not only appear to interact with their
environment but actively react with the solid interfaces of minerals. The bacteria chosen for
this study belongs to the phylogenetically diverse genus Shewanella that have been isolated
from a wide range of freshwater and marine environments as well as from terrestrial
environments including soils (Bowman, 2005). This broad occurrence in nature in

Chapter 2 – Structure and properties of smectites and of related bacteria ______________________________________________________________________________________________________________________________________________________________________________________________________________________________
33
combination with their broad versatility with regard to anaerobic respiration make them a
“model” organism for studying environmental processes.
Being aware that the diversity of microbial live and the complexity of environmentally
relevant processes in natural systems imply an enormous challenge to resolve, this work is
based on a defined system of only one type of mineral (smectite) and one type of bacteria
(Shewanella putrefaciens). The materials and methods used to study the interactions of this
clay and bacteria are presented in the following chapter (Chapter 3).


___________________________________________________________________________
CHAPTER 3
-
MATERIALS AND ANALYTICAL
METHODS
___________________________________________________________________________

Chapter 3 - Materials and analytical methods ______________________________________________________________________________________________________________________________________________________________________________________________________________________________
36
CHAPTER 3 MATERIALS AND ANALYTICAL METHODS
3.1. Sample materials
3.1.1. Bentonite samples: MX80, IBECO, TIXOTON
Three different industrially available bentonites were selected for experimentation:
“MX80”, ““IBECO SEAL-80” und “TIXOTON TE”. For reasons of simplicity, the latter two
will be referred to as IBECO and TIXOTON in the following text. MX80 is a commercial
bentonite that is sold by « CETCO France « (17 Avenue Général De Gaulle, 94220 Le Plessis
Trevise, France) and was chosen for this study as an example of a possible future back fill
material in the context of nuclear waste disposal (ANDRA, 2005). For experimental
investigation, it was used without further purifying treatment and, therefore, the interlayers of
the montmorillonite are heteroionically occupied by Na+ and Ca2+ according to the formula
(Sauzeat et al., 2001):
Na0.18 Ca0.11 [Al1.52 Mg0.26 Fe(3+)0.17] [Si3.96 Al0.04] O10(OH)2
Montmorillonite makes up around 76% of the raw material and the remaining fraction
consists of mica, feldspar, quartz, calcite and pyrite (table 3.1).
The other two industrial bentonites are considered to be “activated”, which means that the
interlayer cations of the montmorillonite minerals have been exchanged to enhance desired
properties (Lagaly, 1993). IBECO is activated with Na+ and can be obtained as a powder from
“IBECO Bentonit-Technologie GmbH” (Ruhrorter Strasse 72, 68219 Mannheim, Germany).
TIXOTON is a mixture of different bentonites from south German bentonite deposits. The
Ca2+ activated powder is available from “Süd-Chemie AG” (Steinbockstrasse 12, 85368
Moosburg, Germany). These bentonites contain more that 80% montmorillonite and
accessory minerals such as mica, feldspar, quartz, and calcite (table 3.1).
Because of their low layer charge (ranging between 0.28 and 0.33 equivalents per half unit
[eq/(Si,Al)4 O10]) and high cation exchange capacities (CEC, ranging between 70 and 82
milliequivalents (meq) per 100g), they are considered to be suitable for industrial
applications, in particularly, as back fill materials (Hermann-Stengele &Plötze, 2000; Sauzeat

Chapter 3 - Materials and analytical methods ______________________________________________________________________________________________________________________________________________________________________________________________________________________________
37
et al., 2001; Hofmann et al., 2004; Pusch, 2006b). In addition, their high surface area (BET
surface area ranging from ~30 to over 100m2/g) provides numerous sites suitable for the
adsorption of toxic substances.
Sample name IBECO seal 801) TIXOTON-TE1) MX80 (BF100)2)
SWy-23,5) NAu-14,5)
Material
Na-activated bentonite
Ca-activated bentonite
bentonite bentonite Pure nontronite
Lokality South Germany South Germany Wyoming, USA Wyoming, USA
Uley Mine, Australia
Source IBECO Bentonit-
technologie GmbH, Germany
Süd-Chemie AG, Germany
CETCO, France CMS source clay collection
CMS source clay collection
Smectite
Amount [%] > 80% montmorillonite
> 80% montmorillonite
> 80% montmorillonite
>95% montmorillonite
>93% nontronite
Interlayer cation Na Ca Na, Ca Na Ca
CEC [meq/100g] 82 72 69.6 76.4 71
Surface area [m2/g]*
55.33 103.01 30.03 27.64 83.98
Layer charge [eq/(Si,Al)4O10]
0.33 0.29 0.28 0.32 0.52
Grain size Not separated Not separated 14% silt + sand, 86% <2µm
<1 µm <0.5 µm
Accessory minerals [%]
Mica <3 1-2 2.8-3.8 <1 -
Kaolinite - - - - 4
Biotite* - - - - trace
Chlorite - - - >1 -
Feldspar <3 5-6 4.5 1 -
Quartz - 8-9 5-6 4 <1
Goethite - - - - 3
Calcite 8-12 1 0.3-1.4 - -
Gypsum - - - 1 -
Pyrite - - 0.5 - -
Table 3.1. List of samples and their important mineralogical characteristics. Data taken from (Hofmann et al., 2004)1), (Sauzeat et al., 2001)2), (Mermut &Cano, 2001)3), (Keeling et al., 2000)4) and (Chipera &Bish, 2001)5). *Own data.
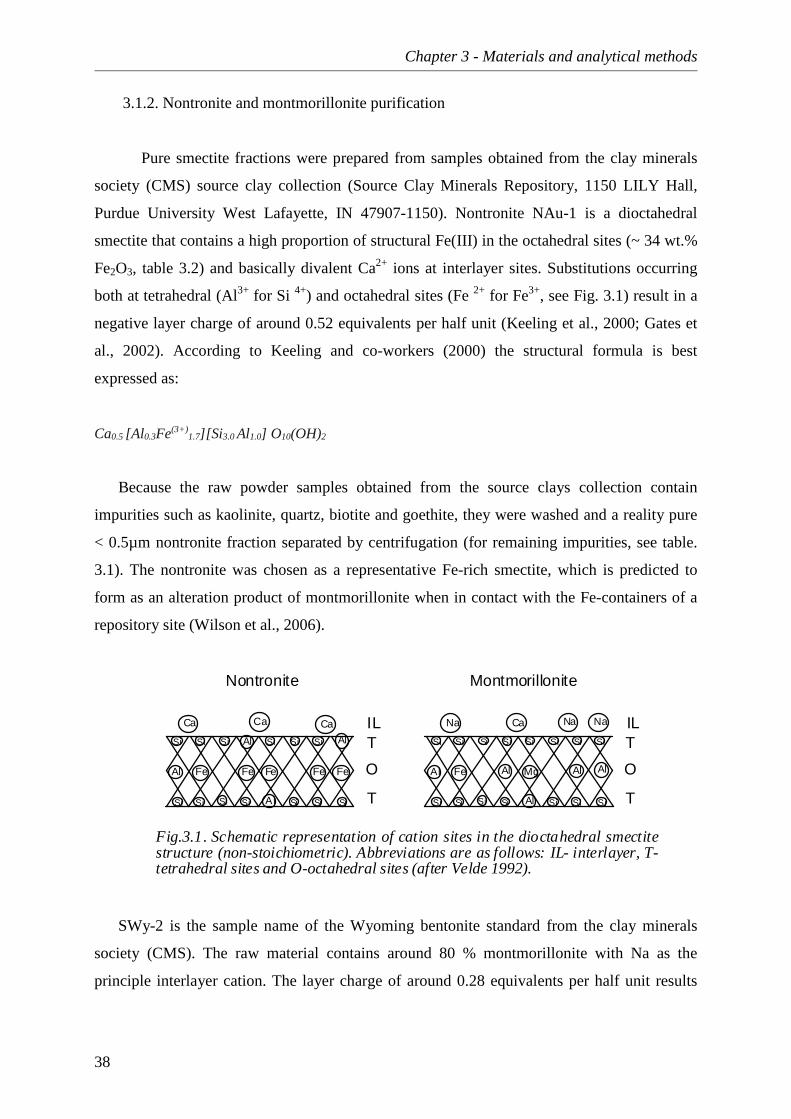
Chapter 3 - Materials and analytical methods ______________________________________________________________________________________________________________________________________________________________________________________________________________________________
38
3.1.2. Nontronite and montmorillonite purification
Pure smectite fractions were prepared from samples obtained from the clay minerals
society (CMS) source clay collection (Source Clay Minerals Repository, 1150 LILY Hall,
Purdue University West Lafayette, IN 47907-1150). Nontronite NAu-1 is a dioctahedral
smectite that contains a high proportion of structural Fe(III) in the octahedral sites (~ 34 wt.%
Fe2O3, table 3.2) and basically divalent Ca2+ ions at interlayer sites. Substitutions occurring
both at tetrahedral (Al3+ for Si 4+) and octahedral sites (Fe 2+ for Fe3+, see Fig. 3.1) result in a
negative layer charge of around 0.52 equivalents per half unit (Keeling et al., 2000; Gates et
al., 2002). According to Keeling and co-workers (2000) the structural formula is best
expressed as:
Ca0.5 [Al 0.3Fe(3+)1.7][Si 3.0 Al1.0] O10(OH)2
Because the raw powder samples obtained from the source clays collection contain
impurities such as kaolinite, quartz, biotite and goethite, they were washed and a reality pure
< 0.5µm nontronite fraction separated by centrifugation (for remaining impurities, see table.
3.1). The nontronite was chosen as a representative Fe-rich smectite, which is predicted to
form as an alteration product of montmorillonite when in contact with the Fe-containers of a
repository site (Wilson et al., 2006).
Si Si Si SiSi
SiSiSiSiSiSi
Si
Si
ILT
O
T
Al
Al
Al Al
Fe FeFeFeFe
Ca Ca
Si Si Si SiSi
SiSiSiSiSiSi
Si
Si
ILT
O
T
Al
Al
Fe
Ca
Mg
Na Na
Si Si
Al Al Al
NaCa
Fig.3.1. Schematic representation of cation sites in the dioctahedral smectitestructure (non-stoichiometric). Abbreviations are as follows: IL- interlayer, T-tetrahedral sites and O-octahedral sites (after Velde 1992).
Nontronite Montmorillonite
SWy-2 is the sample name of the Wyoming bentonite standard from the clay minerals
society (CMS). The raw material contains around 80 % montmorillonite with Na as the
principle interlayer cation. The layer charge of around 0.28 equivalents per half unit results

Chapter 3 - Materials and analytical methods ______________________________________________________________________________________________________________________________________________________________________________________________________________________________
39
mainly from the octahedral substitution of Mg2+ for Al3+ (cp Fig. 3.1). The generalized
formula after Mermut & Cano (2001) and Mermut & Lagaly (2001) is:
Na0.16 Ca0.06[Al1.50 Mg0.3 Fe(3+)0.2] [Si3.99 Al0.01] O10(OH)2
In order to obtain a monocationic sample the (<1µm fraction) was saturated with Na+ and was
used in experiments as a standard reference for pure Na-montmorillonite.
Element [% oxide]
IBECO seal -801)
TIXOTON-TE1) MX80 (BF100)2)
SWy-2 Montmorillonite 3)
NAu-1 Nontronite4)
SiO2 52.9 53.8 57.5 62.9 53.33 Al 2O3 16.6 17.5 18.66 19.6 10.22 TiO2 0.8 0.3 0.14 0.09 - Fe2O3 4.6 5.1 4.16 3.35 34.19 FeO - - 1.65 0.32 - MnO 0.1 0.1 - 0.006 - MgO 3.9 3.0 2.17 3.05 0.27 CaO 6.1 3.7 1.42 1.68 3.47 Na2O 2.6 2.2 2.18 1.53 0.08 K2O 0.5 1.3 0.64 0.53 0.03 P2O5 0.1 0.1 0.25 0.049 0
S - - 0.27 0.05 -
Table 3.2. Chemical composition of the used materials. Data taken from Hofmann et al. (2004)1), Sauzeat et al. (2001)2), Mermut & Cano (2001)3)and Keeling et al. (2000)4).
3.1.3. Solutions: ground water, sea water and experimentally mixed saline solutions
In this study, two natural solutions were used (table 3.3). A granitic ground water
obtained from a surface source in Heidelberg, Germany, and an Atlantic sea water that was
sampled from the Cornwall coastline, UK. The latter has been diluted by terrestrial waters and
exhibits a lower salinity than the average sea water composition. The samples were filtrated
(<0.45µm) and stored in a cool place until used for experiments. Additionally, a simplified
salt solution containing KCl (0.28 g/l) and CaCl2 (0.05 g/l) was mixed. All solutions were
sterilized by filtration or autoclave prior to experimentation.
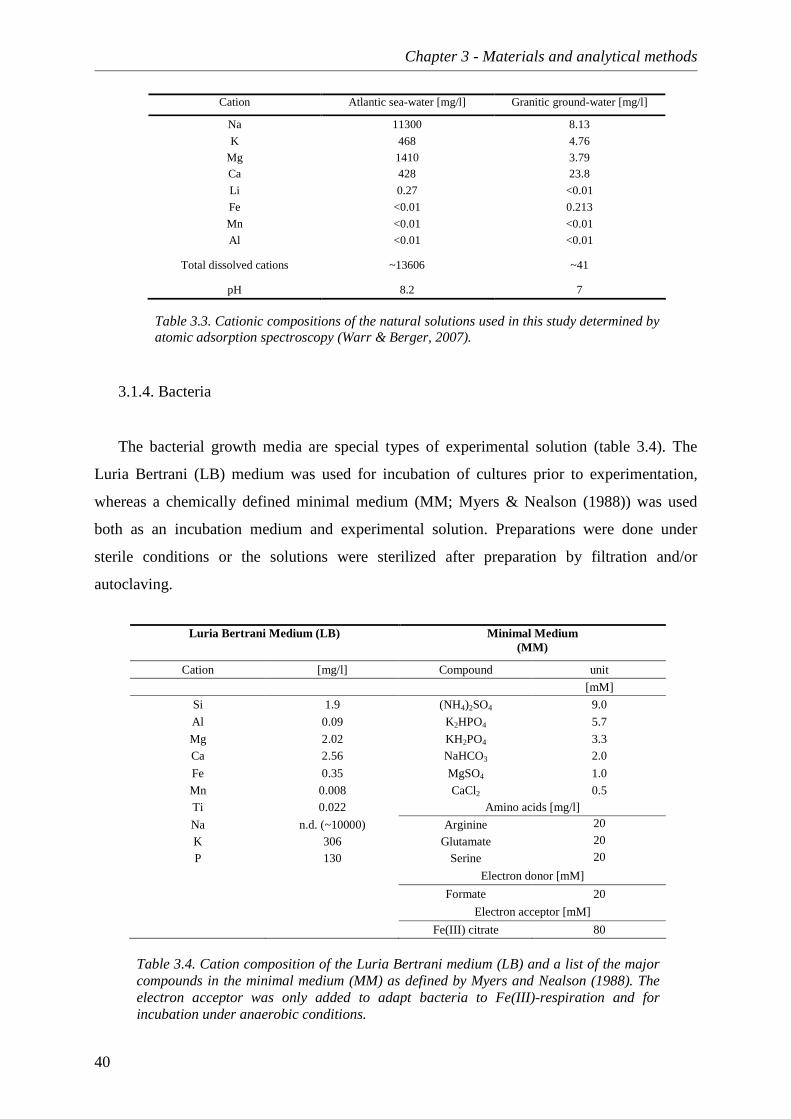
Chapter 3 - Materials and analytical methods ______________________________________________________________________________________________________________________________________________________________________________________________________________________________
40
Table 3.3. Cationic compositions of the natural solutions used in this study determined by atomic adsorption spectroscopy (Warr & Berger, 2007).
Cation Atlantic sea-water [mg/l] Granitic ground-water [mg/l]
Na 11300 8.13
K 468 4.76
Mg 1410 3.79 Ca 428 23.8
Li 0.27 <0.01
Fe <0.01 0.213
Mn <0.01 <0.01
Al <0.01 <0.01
Total dissolved cations ~13606 ~41
pH 8.2 7
3.1.4. Bacteria
The bacterial growth media are special types of experimental solution (table 3.4). The
Luria Bertrani (LB) medium was used for incubation of cultures prior to experimentation,
whereas a chemically defined minimal medium (MM; Myers & Nealson (1988)) was used
both as an incubation medium and experimental solution. Preparations were done under
sterile conditions or the solutions were sterilized after preparation by filtration and/or
autoclaving.
Table 3.4. Cation composition of the Luria Bertrani medium (LB) and a list of the major compounds in the minimal medium (MM) as defined by Myers and Nealson (1988). The electron acceptor was only added to adapt bacteria to Fe(III)-respiration and for incubation under anaerobic conditions.
Luria Bertrani Medium (LB) Minimal Medium (MM)
Cation [mg/l] Compound unit
[mM]
Si 1.9 (NH4)2SO4 9.0
Al 0.09 K2HPO4 5.7
Mg 2.02 KH2PO4 3.3 Ca 2.56 NaHCO3 2.0
Fe 0.35 MgSO4 1.0
Mn 0.008 CaCl2 0.5 Ti 0.022 Amino acids [mg/l]
Na n.d. (~10000) Arginine 20
K 306 Glutamate 20
P 130 Serine 20
Electron donor [mM]
Formate 20
Electron acceptor [mM]
Fe(III) citrate 80

Chapter 3 - Materials and analytical methods ______________________________________________________________________________________________________________________________________________________________________________________________________________________________
41
Shewanella putrefaciens are motile rods that vary in size between 0.5 and 5µm (Fig.
3.2.), depending on their growth state and environmental conditions (Chapter 2). These gram
negative heterotrophic bacteria have been detected in a variety of aquatic and subsurface
environments (Venkateswaran et al., 1999) as well as been isolated from some oil fields
(Westlake et al., 1966). As facultative anaerobes, they are able to use oxygen as terminal
electron acceptor (TEA) but under anaerobic conditions they can also utilize nitrate, fumarate,
sulphite, chromate and U(V), Fe(III) and Mn(IV) (Obuekwe &Westlake, 1982; DiChristina et
al., 1988; Lovley et al., 1991).
2 µmS.putrefaciens
Fig. 3.2. TEM image of S. putrefaciens cultivated in minimalmedium showing the presence of a flagellum.
flagellum
The S. putrefaciens strain used in this study was obtained from the “Deutsche
Sammlung von Mikroorganismen und Zellkulturen (DSMZ) as freeze dried pellets. The DMS
specification (DMS 6067) is identical with the American Type Culture Collection
specification ATCC 8071. This strain had been formerly called Alteromonas putrefaciens
(Lee et al., 1977; MacDonell &Colwell, 1985) but was later re-classified (Gauthier et al.,
1995). In pre-1977 literature, the names Pseudomonas putrefaciens or Achromobacter
putrefaciens were used.
3.2. Analytical Methods
3.2.1. X-ray diffraction study
X-ray diffraction (XRD) is the main method used in this study for monitoring time
dependent changes in crystal chemistry. This is a well-established technique commonly used
for identification and characterization of smectites as it can routinely detect changes in lattice

Chapter 3 - Materials and analytical methods ______________________________________________________________________________________________________________________________________________________________________________________________________________________________
42
structure at the angstrom scale (Brown &Brindley, 1984; Moore &Reynolds, 1997). As
established by Max von Laue in 1914, X-rays diffract on the periodically arranged atoms of
crystalline substances, allowing its structure and chemistry to be determined. X-rays are
generated within an X-ray tube and focused onto powdered samples at varying angles within a
controlled goniometer circle (Fig. 3.3).
detectorsample
goniometer
Fig. 3.3. Photograph through the window of the D-5000 Bruker-Siemensdiffractometer showing the X-ray tube, the goniometer and the sample holder.
X-ray tube
The X-ray photons from the incident beam collide with electrons in the crystalline
sample causing some photons to be deflected away from their original direction (scattered X-
rays). Constructive and destructive interference of diffracted waves with the crystal lattice
allow interference maxima (peaks) to be recorded by the detector. Conditions for diffraction
are given by the well known Bragg’s law (Fig. 3.4).
Fig. 3.4. Two dimensional schematic sketchof X-ray diffraction and the Bragg's law. Theincident X-ray beam with the wavelength linteracts with the atoms arranged in aperiodic manner (grey dots) forming differentsets of planes in the crystal (dotted lines).Bragg's law gives the condition for theoccurrence of constructive interference andthe position of the diffraction peak.
2dsinθ = n λ
λθθ d
λ = wavelength of the X-ray
θ = scattering angle
n = integer representing the order of the diffraction peak.
d = lattice distance

Chapter 3 - Materials and analytical methods ______________________________________________________________________________________________________________________________________________________________________________________________________________________________
43
The arrangement of atoms in a lattice are characteristic of each mineral phase and their
X-ray scattering effects can be used for resolving structure, qualitative mineral identification
and quantitative measurement of mineral abundance. Particularly important in the study of
smectites is the determination of the thickness of the interlayer space which can be resolved
from d-value of the 001 X-ray peak (Hofman &Bilke, 1936; Bradley et al., 1937; MacEwan
&Wilson, 1980). This dimension varies dependant on the structure of adsorbed water and the
type of hydrated interlayer cations (Fig. 3.5).
hydration
dehydrated 1 WL 2 WL 3 WL
9,6Å 12,3Å15,2Å
18,5Å
Fig. 3.5. Increase of d-values due to intercalation of water layers.WL=water layers.
M+
M+
M+
H2O M+ Cation
TOT
M+TOT
In addition to the position of X-ray diffraction peaks, the shape of the basal reflections
holds important structural information of the material, in particular, the thickness of the
coherent scattering domains (commonly referred to as particle size) and the abundance of
mixed layered structures. A simple measurement of the shape of a refection is the full-width-
at-half-maximum (FWHM) parameter (peak-width). A small increment of peak broadening is
caused by machine effects, such as defocusing or scattering of the beam (Klug &Alexander,
1954; Moore &Reynolds, 1997). However, installing a monochromator and narrowing the
slits minimizes this effect. In the case of clay minerals, most of the peak broadening is due to
small particle size and (in case of smectites) due to complex mixtures of mixed-layered
hydration states (Reynolds, 1980). In the case of pure phase reflections (no mixed layers), the
thickness of particles can be estimated by the Scherrer equation or from modifications of this
empirical formula (see Klug & Alexander (1954), Drits et al. (1997) and Moore & Reynolds
(1997) for details).
Although most natural smectites produce basal XRD reflections that are broadened by
the effects of small particle thickness (typically <10 nm) and mixed hydration states,
comparison with calculated XRD patterns, such as NEWMOD and CALCMIX, do allow

Chapter 3 - Materials and analytical methods ______________________________________________________________________________________________________________________________________________________________________________________________________________________________
44
these parameters to be resolved. Mathematically, in contrast to the irrational distribution of
mixed-layered broadened peaks (2 theta dependent), particle size broadening is rationally
distributed over the XRD patterns and therefore not 2 theta dependent (Eberl et al., 1998).
The intensity of a given X-ray reflection is dependent on a number of factors such as
phase abundance, density, mass adsorption coefficient and orientation (texture) of the clay
mineral platelets (Lagaly, 1993; Moore &Reynolds, 1997). For perfectly oriented crystallites
only the (00l) intervals are visible because diffraction is restricted to the crystallographic c-
direction. Texture preparations, in contrast to powder preparations, approach this ideal
because, during sedimentation, their particles orientate parallel to the sample holder (glass
slide). Therefore, texture preparations were used in this study to characterize clay samples
extracted from the experiments
Analyses were made using a theta-theta Bruker Siemens D5000 diffractometer with CuKα
radiation, operated under a potential of 40kV and a beam current of 30mA with 1° divergent
aperture diaphragms and a 0.15° detector diaphragm. Scanning parameters were set at 0.02
step width and a count time of 10 seconds. The measurement range was selected to suite
certain samples and ranged between 2 and 15-70°2θ. Intensity variations between
measurements caused by textural changes in the sample were calibrated by normalizing the
height of the (001) kaolinite reflection at 7.14Å.
3.2.1.1. Concept of a laboratory analogue: reaction-cell X-ray diffractometry
The reaction-cell device (“wet-cell” of Warr & Hofmann 2003) is a small flow-through
reaction chamber made of a Teflon compound that can be routinely mounted onto the X-ray
diffractometer. It allows in situ measurement of hydration reactions during the infiltration of a
solution into fine-grained smectite powders. The sample chamber of the cell is disc shaped
(Fig. 3.6 a) with a diameter of 24mm and a depth of 8mm (volume of 3.9cm3), into which the
sample is densely packed using a metal brass rod that gives a rough texture parallel to the
upper surface of the sample holder.

Chapter 3 - Materials and analytical methods ______________________________________________________________________________________________________________________________________________________________________________________________________________________________
45
O-ring
samplecovered bycapton foil
removing cover
Fig. 3.6. a) Schematic representation of the reaction-cellsealed by Capton foil. b) Closed reaction-cell with Teflonbottles. c) Reaction-cell mounted on the sample holder ofthe diffractometer.
a) b)
c)
Bacteria containing samples were prepared by mixing the clay with the bacteria prior to
loading it into the cell. Depending on the type of material and its initial hydration state, the
amount of clay powder loaded into the cells varied between 3 and 5g. The reaction-cell was
then sealed by a thin X-ray transparent Capton© foil and held in place with a sealing Teflon©
O-ring. Around 200ml of solution was placed in 8cm tall Teflon© bottles which were screwed
directly onto the cell to allow inflow (Fig. 3.6b). Before entering the reaction-cell and the
sample powder, the solution passes a horizontal 0.8mm hole, 5mm in length. Once into
contact with the powder, a radial zone of hydration moves across the reaction-cell chamber.
Filters at the entrance of the cell (<0.45µm) prevent contaminations with unwanted microbes
which are especially important when working with bacterial media. Additional filters at the
end of the reaction-cell also prevent the powder from leaving the chamber.
In order to maintain constant reaction volume during the experiment, a pressure cap was
screwed to the top of the cell and only removed for XRD study (Fig. 3.6.c). Subsequent
measurements were made at selected intervals throughout the experiment, enabling sequential
XRD patterns to be plotted against time. The frequency of measurements was adjusted
according to the observed rate of reaction. For bacteria containing samples, the measurement
frequency was kept low in order to minimize radiation damage and disturbance of the
experimental setup.

Chapter 3 - Materials and analytical methods ______________________________________________________________________________________________________________________________________________________________________________________________________________________________
46
3.2.2. Monitoring hydration
3.2.2.1. Quantification of interlayer hydration using CALCMIX
The hydration structure of smectite interlayers was quantified by comparison with
calculated patterns. In this study, the CALCMIX software provided by Plançon & Drits
(1999) was used because it could be easily modified and can deals with three phase systems
simultaneously. This software calculates the theoretical diffraction patterns of mixed-layer
minerals based on Mérings principle (Méring, 1949). In order to calculate different mixtures
of different water layer structures, the standard mineral data base was modified for smectites
containing 0, 1, 2, 3 and 4 water layers. The relevant chemical composition and structure of
the minerals used was entered in the minerals database of the program.
In the CALCMIX program, the mean defect free domain can be selected and the particle
thickness distribution calculated assuming lognormal distributions (Drits et al., 1997; Drits et
al., 1998). This type of distribution reproduces well the broadened tails observed in clay
mineral XRD 00l reflections and is considered to be the common size distribution observed in
clays and many other minerals (Drits et al., 1997). In the smectites studied, the mean defect
free domain varied between 14 and 19 layers per stack for relatively dehydrated samples and
between 3 and 8 units for hydrated samples. The degree of ordering for mixed-layered water-
layer structures (the Reichweite) was selected manually. Initial values of R1 ordering were
first tested which appeared to best match the shaped of measured XRD reflections, followed
by refinements made in the stacking probabilities to improve the correspondence between
calculated and measured profiles. Based on these calculations, the abundance and ordering of
water layer structures as well as the mean defect free domain thickness (particle thickness)
were obtained. Further details on using the CALCMIX program can be found in the handbook
of Plancon & Drits (1999).
The relative abundance of water layers obtained from CALCMIX-calculations were used
to estimate the amount of interlayer water using data obtained from isotherm absorption
experiments of montmorillonites (Bérend et al., 1995; Cases et al., 1997). The amount of
water in nontronite interlayer’s was calculated using data by Jähnchen et al. (2006) and
Milliken & Mustard (2007). As 3 and 4 water layers have not been observed in relative
humidity experiments, these values are extrapolated from the isotherm curves (see appendix
for details).
Chapter 3 - Materials and analytical methods ______________________________________________________________________________________________________________________________________________________________________________________________________________________________
47
3.2.2.2. Quantification of non-interlayer hydration
The total water uptake into clay samples during hydration was determined by monitoring
gravimetrically the relative weight change of the reaction-cell apparatus throughout
experimental runs. Subtraction of the calculated interlayer water from the measured total
water content yields the volume of surface- and pore-water in the samples (i.e. non-interlayer
water). Based on the decrease in numbers of layers per particle (n), the relative increase of
surfaces and a theoretical corresponding surface area were obtained. These results were then
used to estimate the amount of adsorbed water on particle surfaces (appendix for an example
of this calculation).
3.2.3. XRD characterization of clay minerals
Experimentally induced changes in smectite composition and structure can be detected by
simple chemical treatments in the laboratory combined with XRD analyses. Here, tests related
to the oxidation state of Fe and its influence on layer charge properties are of particular
importance. As octahedral Fe is reduced, the weak negative charge of the smectite (~0.3-0.5
per formula unit - PFU) increases and approaches that of vermiculite (~0.6 PFU, Bailey
(1980). As the permanent layer charge increases (>0.6 PFU), K can fix to interlayer sites to
form a 10Å illite phase (MacEwan &Wilson, 1980; Cuadros &Altaner, 1998; Meunier et al.,
2000). Low layer-charged smectite can be distinguished from the higher charged vermiculite
by Mg- exchange and glycerol solvation because vermiculite only accepts one plane of
glycerol molecules (d-spacing 14.5Å). Smectite, in contrast, swells to a basal spacing of 18Å
and intermediate spacings are suggestive of an intermediate layer charge. Illite clays, or
mixed layered illite-smectite phases, produce basal reflections between 10-15Å in the
untreated air dried state. These type of minerals are best characterized by ethylene glycol
solvation and heat treatments (Moore &Reynolds, 1997).

Chapter 3 - Materials and analytical methods ______________________________________________________________________________________________________________________________________________________________________________________________________________________________
48
3.2.4. Microscopy
3.2.4.1. Confocal microscopy
Optical microscopy (epifluoresence) was used to study the formation of biofilm in clay
bacteria mixtures. For this purpose, diluted bacteria containing and sterile smectite
suspensions were directly pipetted onto a glass slide and studies in the wet state. In the case of
optical epifluorescent microscopy, the biofilm was coloured with calcofluor and the bacteria
with ethidium bromide (see details of procedure in appendix).
3.2.4.2. Electron microscopy
As powder XRD is a bulk analytical approach and does not provide vision information
concerning reaction textures and fabrics, it is important to accompany such studies with
electron microscopic investigations of the sample material. The electron microscope operates
on the same basic principles as a light microscope but the focused electrons allow
significantly higher resolutions to be obtained. A cathode at the top of the microscope emits
electrons that are accelerated through the vacuum column of the microscope and focused by
magnetic lenses to produce a very narrow beam. Energy dispersive X-ray analyses (EDX)
allows multi-element analyses by detection of X-rays of specific energy that are characteristic
individual elements. Because the electron beam can be reduced to a sub-micron diameter,
microchemical information can be obtained from distinct clay particles and bacteria cells. The
two different types of electron microscopes used in this study are briefly outlined as follows.
Transmission electron microscopy (TEM)
At the base of the TEM microscope, un-scattered electrons hit a fluorescent screen to
produce a shadow image of the specimen with its different parts displayed in varied grey
scales according to material thickness and density. The image can be studied directly by the
operator or photographed with a camera. The highest resolution possible is, dependent on
microscopic settings, in the order of a few angstroms (10-10m). This is ideal for imaging
bacteria and clay structure at the nanometric and micrometric size (Elsass, 2006). Coupled
with an EDX analyzer, microchemical data on specific particles and bacteria can be routinely
obtained. As it was shown by (Perdrial, 2007), it is not necessary to stain bacterial cells prior
to imaging (as required for optical microscopy) and an acceleration voltage of 120 kV incurs
minimal damage to the bacterial cells in transmission mode.

Chapter 3 - Materials and analytical methods ______________________________________________________________________________________________________________________________________________________________________________________________________________________________
49
Because of the low resistance to irradiation of bacteria and swelling clays, the counting
time for analyses was reduced to 30s and analyses were done with the sample in strictly
eucentric position at an angle of +20° to the detector. Microchemical analyses (C-N-O-Na-
Mg-Al-Si-P-S-Cl-K-Ca-Mn-Fe-Cu-Zn) were carried out in transmission mode with the same
acceleration voltage and with the fluo-X signals being recorded between 0 and 20 keV with a
Si/Li detector and an atmospheric thin window (ATW). The C coating of the copper grids
(Formwar ©) always contains enrichment in Si, this is to be taken into account concerning all
EDX microanalyses. The TEM/EDX was carried out at the Laboratory of Users of Electron
Microscopes (LUME) of INRA, Center Versailles-Grignon. The TEM microscope, a Philips
STEM 420 is equipped with an Oxford INCA EDX system and a SIS Megaview II CCD
camera.
Environmental scanning electron microscopy (ESEM)
As both bacteria and smectite are very sensitive to drying, environmental scanning
electron microscopy (ESEM) was used to investigate this sample material. This technique
does not require desiccation or coating and, instead of completely evacuating the specimen
chamber as in conventional SEM, water vapour is introduced into the chamber via a valve that
controls the pressure (range 0-10torr or 0 - 0.013bar, respectively). The microscope used was
a Philips XL30 ESEM equipped with a peltier cooled specimen stage that controls the
temperature (range of -5°C to +60°C). In conjunction with chamber pressure, the resulting
condensation keeps the sample wet. Relative humidity values, between 55-75%, were
obtained by applying a pressure range between 5.9 and 6 torr and corresponding temperatures,
ranging from 8°C to 22°C.
Electrons are emitted from a LaB6 cathode and, in order to achieve the best resolution in
ESEM mode, the accelerating voltage was set to 25 keV. The signal to noise ratio and
resolution were decreased and the resulting magnification limited to about 20 000 times due
to the skirting effect: an electron scattering of the primary beam caused by the residual
pressure between the objective lens and the scanned surface. Secondary electrons emitted
from the surface of the sample encounter water vapour molecules, which amplifies the signal.
A specific detector converts directly the electrical signal into images. In this study, the ESEM
was used to monitor changes in the morphology and size of smectite particles, and to observe
biofilm formation and structures under hydrated conditions. In Fig. 3.7 a) an example of a
nontronite aggregate imaged by conventional SEM is shown with no swelling as opposed to
the same material imaged in environmental mode (Fig. 3.7.b).
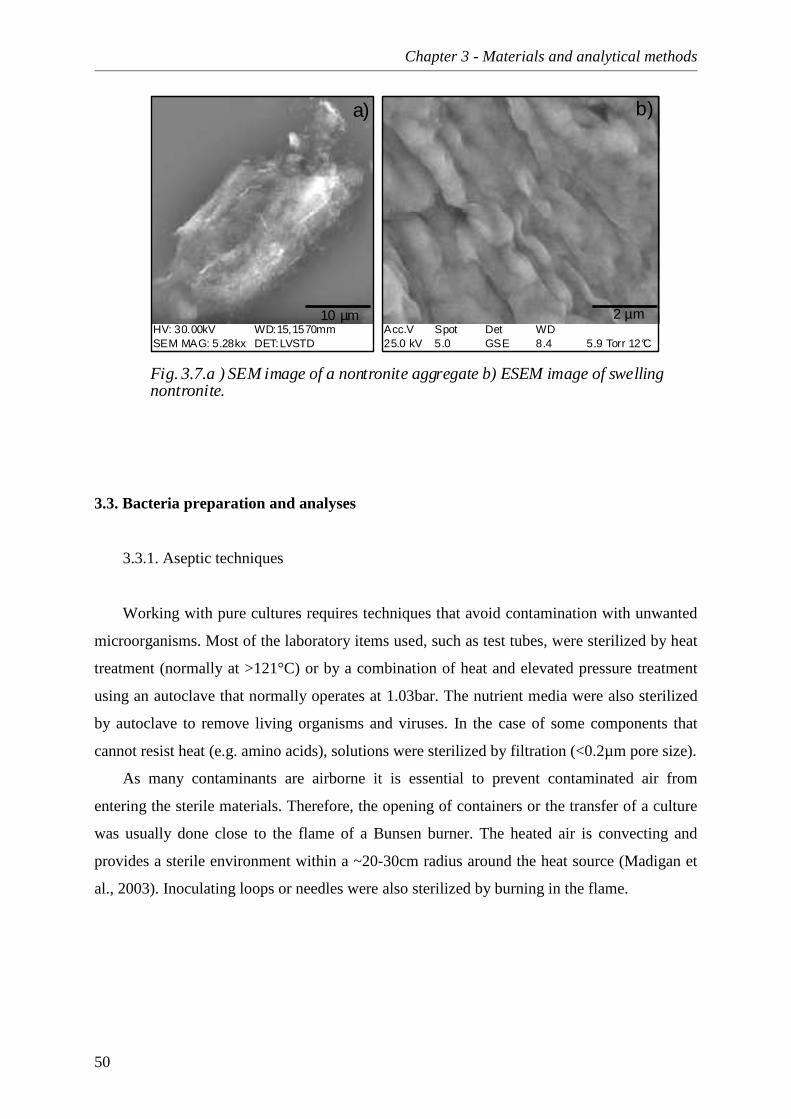
Chapter 3 - Materials and analytical methods ______________________________________________________________________________________________________________________________________________________________________________________________________________________________
50
Acc.V Spot Det WD25.0 kV 5.0 GSE 8.4 5.9 Torr 12°C
2 µm10 µmHV: 30.00kV WD:15,1570mmSEM MAG: 5.28kx DET:LVSTD
a) b)
Fig. 3.7.a ) SEM image of a nontronite aggregate b) ESEM image of swellingnontronite.
3.3. Bacteria preparation and analyses
3.3.1. Aseptic techniques
Working with pure cultures requires techniques that avoid contamination with unwanted
microorganisms. Most of the laboratory items used, such as test tubes, were sterilized by heat
treatment (normally at >121°C) or by a combination of heat and elevated pressure treatment
using an autoclave that normally operates at 1.03bar. The nutrient media were also sterilized
by autoclave to remove living organisms and viruses. In the case of some components that
cannot resist heat (e.g. amino acids), solutions were sterilized by filtration (<0.2µm pore size).
As many contaminants are airborne it is essential to prevent contaminated air from
entering the sterile materials. Therefore, the opening of containers or the transfer of a culture
was usually done close to the flame of a Bunsen burner. The heated air is convecting and
provides a sterile environment within a ~20-30cm radius around the heat source (Madigan et
al., 2003). Inoculating loops or needles were also sterilized by burning in the flame.
Chapter 3 - Materials and analytical methods ______________________________________________________________________________________________________________________________________________________________________________________________________________________________
51
3.3.2. Culture preparation
The bacterial sample of S. putrefaciens, which was obtained as a dried pellet from the
DSMZ, was first dissolved in LB medium and then cultured for 72h at 30°C. Secondly the
culture was grown on LB-agar plates to control its purity and was then again introduced and
grown in liquid LB for 72 hours. For storage in the freezer (-80°C), this culture was washed
by centrifugation (4000rpm/10min) and then supplied with 20% of glycerol to prevent
damage during freezing. This frozen culture served as a source for all subsequent
experiments. Before usage, a small amount of the frozen culture was taken, re-grown in LB
medium for 72 hours and washed. Experiments that were conducted under anaerobic
conditions required a culture adapted to metal respiration (Fe(III)-respiration). For this
purpose the stock culture was washed and grown in a defined minimal medium (Myers
&Nealson, 1988) for 72h at 25°C (table 3.4). The culture was supplemented with 20mM
formate, as an electron donor, and 80mM Fe(III) citrate, as TEA, before being stored
anaerobically by using the CO2 generating system of BioMerieux©. The Fe-citrate was
applied to slowly adapt the bacteria’s metabolism to respire Fe(III) instead of oxygen.
Bacterial cultures for aerobic experimentations were not adapted.
3.3.3. Viable cell counts
The growth of a bacterial population can be measured by monitoring changes in the total
numbers of cells (total cell counts) or by counting only those cells that are alive and are able
to form colonies on an Agar plate (viable cell counts). This latter method was routinely
applied in order to control the density of a bacterial culture both prior to experimentation and
during bacterial growth within smectite samples. However, with this technique it is not
possible to know if one colony has been formed by more than one bacterial cell and,
therefore, the population growth is expressed as increase in “colony forming units” (cfu) per
ml. For effective counting of single colony units, all samples were diluted using serial
dilutions before being tested on agar plates. If the number of bacteria in a sample was too
high, no single colonies could be observed as they merge to form bacterial mats. However, if
this number is too low, the statistical error increases.
Prior to dilution, solid samples were dissolved and dispersed in sterile water. Several
serial 10-fold dilutions were prepared for each sample by mixing 0.1ml of the initial solution

Chapter 3 - Materials and analytical methods ______________________________________________________________________________________________________________________________________________________________________________________________________________________________
52
with 0.9ml dilutent. Further dilutions were prepared by repeating the procedure by extracting
0.1ml of this dilution and introducing it to another 0.9ml of water (Fig. 3.8.). In the case of
pure culture counts, the samples were diluted up to 7 times (10-7) whereas for samples
containing bacteria and smectite 3 dilutions (10-3) were usually adequate. Colonies were
grown by spreading 0.1ml of sample-suspension onto an agar plate (glass-pearls were used to
obtain an even distribution), incubated (25°C for 72h) and after a few days of growth counted.
To increase the reliability, preparations of each sample were repeated twice.
Fig. 3.8. Example of a serial dilution conducted prior to viable cell counts. 0.1 ml of the initial sample areintroduced into 0.9 ml sterile water and mixed. 0.1 ml of this dilution is then introduced to another tube thatcontains as well 0.9 ml water and so on. Each step leads to a 10 fold dilution. 0.1 ml of the final dilution isthen spread on an agar plate. In the example presented there are too many colonies on the first two plates(10-1 and 10-2) but the third dilution gives good results with 125 colonies on the plate yielding a count of1.25*105 cfu/ml (after Madigan et al. 2003).
sample
0.1ml 0.1ml 0.1ml 0.1ml 0.1ml
10-1 10-2 10-510-410-3
125 12 1
dilution
??
3.4. Solution chemistry
Precise elemental concentrations of elute solutions were readily obtained using ICP-
OES (Inductively-Coupled-Plasma Optical-Emission-Spectroscopy). Here, analyses were
made using the „Plasma 400“ICP-OES of Perkin-Elmer. Exited atoms and ions emit
electromagnetic radiation characteristic of each particular element. An induction coil fed by a
high frequency generator, releases an oscillating magnetic field at the plasma torch. Since it is
easily ionified, argon is used as a plasma gas. With the induction of the coil, the high
frequency generator supplies the energy for ionization in the plasma in which the sample is
introduced. The intensities of emission are detected by a photosensitive detector and digitally

Chapter 3 - Materials and analytical methods ______________________________________________________________________________________________________________________________________________________________________________________________________________________________
53
processed before calculation of the dissolved elemental concentrations by calibrating against
standards.
This method is particularly suitable for metals, metalloids and some non-metals. In
this study, the elemental concentrations of Al, Si, Mg, Na, K, Fe and Ca were measured. As
the detection limit is in the order of ppm most of the samples required a dilution of 1:5
(minimum of 4ml) for accurate measurements.

54

___________________________________________________________________________
CHAPTER 4
-
ABIOTIC INFLUENCE ON
SMECTITE HYDRATION
___________________________________________________________________________

Chapter 4 - Abiotic influence on smectite hydration ______________________________________________________________________________________________________________________________________________________________________________________________________________________________
56
CHAPTER 4 ABIOTIC INFLUENCE ON SMECTITE HYDRATION
Abstract
This chapter presents the study of smectite hydration in confined volume conditions in situ by
using small-scaled reaction-cells (“wet-cells”, Warr & Hoffman, 2004) mounted on an X-ray
diffractometer and applied to simulate conditions of an underground repository. The rate of
smectite hydration was seen to be highly dependant on the type of interlayer cation (enhanced
for Ca2+ as opposed to Na+) and on the ionic strength of solution (enhanced uptake rate in the
case of Na-smectite). Differences between Na and Ca-smectite were observed to occur due to
microtextural variations and to decrease as a function of packing density. The combination of
X-ray diffraction and the calculations of diffraction patterns by using the CALCMIX software
(Plançon &Drits, 1999) revealed aggregate formation of particles with the same water layer
thicknesses. Additionally, changes in particle thicknesses were used to calculate
corresponding theoretical surface area increase. Results indicate the partial transformation of
internal surfaces into external ones upon hydration that are partly available as sorption sites.
Quantifications of water storage sites by using published data of water vapour absorption
experiments (Cases et al., 1992; Bérend et al., 1995; Cases et al., 1997) revealed that in Na-
smectite external water (surface- and pore water) is taken up and serves as a reservoir for
interlayer hydration. Higher initial packing density decreased the thickness of water layers
and led to enhanced external water uptake. The influence of solutions of higher ionic strength
was seen to be most pronounced in the case of Na-smectites and was attributed to the
formation of aggregates that enhance the porosity. The observed mechanisms of smectite
hydration in confined volume is presented in a schematic model involving different scales:
ranging from the Å-scale (layers) to the bulk structure, including particles, aggregates
(arrangement of closed particles) and arrangements of aggregates. Effects on all scales were
due to the nature of interlayer cation, whereas the ionic strength basically affected the bulk
texture. Quantification of water storage sites as a function of solution chemistry, packing
density, and the obtained uptake rates provide important constraints for predicting smectite
hydration in terms of conductivity, sealing capacity and sorption and/or transport of
radionuclides. Additional constraints for computer based models are provided by estimations
of changes and availability of surface area during hydration.

Chapter 4 - Abiotic influence on smectite hydration ______________________________________________________________________________________________________________________________________________________________________________________________________________________________
57
4.1. Introduction
The majority of nuclear power producing countries are today considering disposal of
radioactive waste in underground repositories using a system of clay-based natural and
engineered barriers (OECD, 1999; ANDRA, 2005; OECD, 2006). In order to prevent or
severely reduce the eventual release of radioactivity, the engineered barrier is of major
importance with regard to physical and chemical containment. Swelling clays (smectite) are
the primary constituent of the engineered back fill material which during hydration expands
and self-seals, thus restricting the movement of aqueous fluids (Karnland &Sandén, 2000;
Montes-Hernandez et al., 2005b; Pusch, 2006b). The sorbant properties of clays are also of
interest because of the potential retention of toxic elements (Hermann-Stengele &Plötze,
2000; Karnland &Sandén, 2000; Karnland et al., 2000).
The sealing capacity of smectite is based on its ability to intercalate water molecules into
the interlayer space that solvates the exchangeable interlayer cations (Farmer &Russel, 1971;
Prost, 1975). During intercalation, the molecules order themselves in an arrangement of well-
defined layers and successive intercalation leads to increasing expansion (Sposito &Prost,
1982; Karaborni et al., 1996). Water that is not stored in the interlayer space is found in
external regions in inter-particles and aggregates, like external surfaces or micropores (Prost,
1975; Sposito &Prost, 1982). Experimental quantification of the mechanisms and rates of
water incorporation is of major importance because the different storage sites of water
influence the mechanisms of sealing, sorption and transport in notably different ways. The
amount of water that is incorporated in interlayer spaces has already been successfully
quantified based on water vapour adsorption-desorption isotherms (Cases et al., 1992; Bérend
et al., 1995; Cases et al., 1997).
In a fully dispersed Na-bentonite solution of low ionic concentration, the proportion of
external pore space increases dramatically as osmotic pressure transforms interlayers (internal
surfaces) into free (external) surfaces by separating particles (Lagaly, 1993; , 2006). Such
newly formed external surfaces might then be available as sorption sites. In bentonite
powders, the quantity of additional water uptake on particle surfaces has been calculated on
the basis of the Brunauer-Emmet-Teller (BET) method (Bérend et al., 1995; Cuadros
&Altaner, 1998). Additionally, the size distribution of pore spaces was assessed by the Hg-
injection technique (Olson, 1985).

Chapter 4 - Abiotic influence on smectite hydration ______________________________________________________________________________________________________________________________________________________________________________________________________________________________
58
In order to monitor the interlayer expansion, a common approach is to study the smectite
hydration states by varying the conditions of relative humidity in combination with X-ray
diffraction measurements (XRD) (Mooney et al., 1952; Collins et al., 1992; Kühnel &van der
Gaast, 1993; Chipera et al., 1997; Ferrage et al., 2005b) or via bulk volume measurements
(Likos, 2004). In contrast to experiments in elevated air humidity, a number of studies
investigated swelling in aqueous and electrolyte solutions by using experimental systems
where particles expanded freely (Norrish, 1954; Norrish &Quirk, 1954; Schramm &Kwak,
1982; Laird et al., 1995; Wilson et al., 2004). More recently, the influence of varying salt
concentration on the total bulk expansion of montmorillonite particles in solution was
quantified by in situ laser scanning microscopy (Suzuki et al., 2005) so the contributions of
interlayer expansion and osmotically-driven swelling could be directly observed.
Hydration under repository conditions is, however, most likely to be highly influenced by
the confined volume and therefore not comparable to free swelling in solution. In order to
record essential parameters like heating, wetting rate and development of swelling pressure,
large scale in situ experiments such as Mock-up in Sweden and Spain or the FEBEX (Full-
scale Engineered Barriers EXperiment) were performed (Lloret &Villar, 2007; Pusch et al.,
2007; Villar &Lloret, 2007). This approach is essential for evaluating the performance of a
bentonite buffer in an almost full scale system (ENRESA, 2007).
Large scale analogues are, however, extremely costly, and require intensive preparation
and once started, it is not possible to adapt or change the set up. Laboratory analogues are
significantly cheaper and serve to simulate repository conditions, thus providing more easily
won constraints for larger scale tests. At the same time, laboratory experiments allow specific
problems to be investigated by using different set ups and materials that provide quantitative
data for modelling reaction and transport processes. The experiments conducted in this study
were therefore designed to monitor and quantify the hydration of different materials (purified
smectite and bulk powdered bentonite) with regard to different initial conditions, such as
packing density and initial hydration state, subjected to a range of infiltrating solutions
(Table. 4.1.1).

Chapter 4 - Abiotic influence on smectite hydration ______________________________________________________________________________________________________________________________________________________________________________________________________________________________
59
Table 4.1.1. Summary of the key properties of the studied materials after sample preparation and a list of the experimental conditions used in the hydration experiments.
4.2. Analytical procedure
In situ monitoring of smectite hydration by XRD was achieved by using a flow-through
reaction-cell known as “wet-cell” (Warr &Hofmann, 2003). This small-scale reaction-cell
provides a laboratory analogue for quantifying the dynamics of hydration in compacted
smectite under confined volume conditions. Time dependent XRD measurements were
acquired routinely during experimentation with minimal disturbance of the sample set up. The
total water uptake was measured throughout experimental runs by monitoring the relative
weight change of the cell. The relative proportion of WL structures obtained from the
CALCMIX data were used to calculate the theoretical amount of water (mmol/g H2O) in the
interlayer space of Na-montmorillonite and Ca-montmorillonite based on the absorption
isotherm experiments of Bérend (1995) and Cases et al. (1997). Subtracting the calculated
interlayer water from the measured total water content yielded the combined volume of
IBECO seal 80 TIXOTON-TE MX80 (BF100) SWy-2 Nau-1 Material Na-activated
bentonite Ca-activated bentonite bentonite Purified
montmorillonite Purified
nontronite
Pre-treatment Grain size separation
- - - - - - - 1µm 1µm 0.5µm
Cation exchange
- - - - - - - Na Na -
Hydration or dehydration
60° for 24h, re-equilibrated at 25-30 % RH
110°C 2 weeks
110°C 1 week
Hydrated (0.23 ml/g)
110°C for 2 weeks
110°C 1week
Initial parameters packing density [g/cm3]
1.15 1.14 0.94 0.94 1.43 1.35 1.60 (dry 1.31)
1.37 1.36 1.08
Temperature [°C]
25 25 25 25 25 25 25 25 25 25
Experimental parameters Experimental
solution Ground water
Sea water
Ground water
Sea water Purified water
Salt solution
Salt solution
Purified water
NaCl Purified water
Ionic strength [mol/l]
0.0013 0.639 0.0013 0.639 ~0.001 0.011 0.011 ~0.001 1 ~0.001
Static fluid pressure
[kPa]
0.7-05 0.7-05 0.7-05 0.7-05 0.7-05 0.7-05 0.7-05 0.7-05 0.7-05
0.7-05
Inflow rate
[ml/g/h]
2.7E-04 1.1E-03
4.3E-03 3.8E-03 8E-05 1.7E-04 1.7E-04 1.9E-04 2.1E-04
1.2E-03

Chapter 4 - Abiotic influence on smectite hydration ______________________________________________________________________________________________________________________________________________________________________________________________________________________________
60
surface- and pore-water, here referred to as external water. The specific surface area (BET)
was used to estimate the contribution of surface adsorbed water to the external water in
combination with changes in particle thickness. All calculations assumed a log normal size
distribution commonly described for clay minerals (Drits et al., 1998; Eberl et al., 1998). As
fitting was done manually by adjusting a range of variables, results are considered to
represent best approximations to the measured patterns rather than perfectly fitted profiles.
4.3. Hydration results of compacted smectite clay under confined volume
4.3.1. Total water uptake as a function of interlayer cation, solution chemistry and clay
packing density
As shown in Fig. 4.3.1, the total water uptake and saturation time vary as a function of
the type of interlayer cation. Materials that contain predominantly Na as the interlayer cation
(montmorillonite of IBECO- and MX80-bentonite and the purified Wyoming-
montmorillonite, SWy-2) show continuous and relatively slow water intake. Uptake into the
purified SWy-2 montmorillonite powder reaches stable state conditions after 2314h with a
total uptake of 0.44ml/g at a relatively constant rate of 1.9E-04ml/g/h (table 4.3.1). The
IBECO-bentonite powder hydrates over a 1368h duration and 0.37ml/g enter the clay
(hydration rate of 2.7E-04ml/g/h). Although some Ca2+ are contained in the interlayer space
of this sample (0.11 Ca2+ and 0.18 Na+ PFU, chapter 3), water uptake into MX80-bentonite is
similar to other Na-montmorillonite, which is continuous and slow. Here, the steady state of
water saturation develops over 5040h with a total uptake of 0.40ml/g at a rate of 8E-05ml/g/h.
This is the lowest water uptake rate observed in all hydration experiments (table 4.3.1, data
not in plot).

Chapter 4 - Abiotic influence on smectite hydration ______________________________________________________________________________________________________________________________________________________________________________________________________________________________
61
Fig. 4.3.1. Solution uptake into pressed smectite powders in ml/g. Ca-smectite(TIXOTON, NAu-1) reaches steady state earlier than Na-smectite (IBECO,MX80 and SWy-2) and generally incorporates higher amounts of solution.I=ionic strength.
Steady stateCa-smectite
I~0.001
0
0.1
0.3
0.5
0.7
0 500 1000time (h)
1500 2000 30002500
Steady stateNa-smectite
IBECOSWy-2
MX80
TIXOTON
NAu-1Total uptakeCa-smectite
Total uptakeNa-smectite
Smectite with predominantly Ca2+ as the interlayer cation shows a different behaviour
with more rapid and nonlinear water uptake. The Ca-activated TIXOTON-bentonite
incorporates a total of 0.61ml/g at an average rate of 4.3E-03ml/g/h over the first ~ 142h of
inflow. This is 10 times more rapid than observed for the IBECO and around 15 times more
rapid compared to the SWy-2 sample. Notably less water enters the Ca-nontronite powder
compared to the Ca-montmorillonite (TIXOTON) while, compared to Na-smectite, there is
still 14-26% more water taken in. A total of 0.50ml/g is contained at the stable state that is
reached after only 290h (rate 1.2E-03ml/g/h). The observed difference in water uptake for Na-
and Ca-smectites can be attributed to the significant differences in hydration energy (enthalpy
of hydration) of the Na and Ca cations positioned in the interlayer sites (∆HhydNa = -
405kJ/mol as opposed to ∆HhydCa= -1592kJ/mol, values from Huheey (1993)). The higher
hydration energy of Ca explains both the more rapid water inflow and the larger amount of
total water uptake.
Table 4.3.1. Total water uptake for confined volume experiments infiltrated by solutions.*Uptake after correcting the weight of saline solutions to account for dissolved salt.
IBECO (Na) TIXOTON (Ca) MX80 SWy-2 Nau-1 Experimental
solution Ground water
Sea water Ground water
Sea water Purified water
Purified water
NaCl Purified water
Total solution uptake [ml/g]
0.37 0.45 0.43* 0.61 0.69 0.66* 0.40 0.44 0.45 0.43* 0.50
Saturation time [h]
1368 384 142 167.6 5040 2314 1994 290
Uptake rate [ml/g/h]
2.7E-04 1.1E-03 4.3E-03 3.9E-03 8E-05 1.9E-04 2.1E-04 1.2E-03

Chapter 4 - Abiotic influence on smectite hydration ______________________________________________________________________________________________________________________________________________________________________________________________________________________________
62
The effect of ionic strength (I) on water uptake is shown in Fig. 4.3.2 for samples of
similar packing density. Each sample presented shows the water uptake behaviour for
relatively lower (empty circles) and higher ionic solution strengths (filled circles). The Na+-
exchanged and purified SWy-2 montmorillonite was infiltrated with purified water (I =
<0.001mol/L) and concentrated 1M NaCl solution (Fig. 4.3.2.a). The total uptake of the 1M
NaCl solution seems relative to the purified water enhanced by 0.45ml/g. But correcting the
weight of the solution (dotted line), it is shown that the additional weight is due to the higher
ionic strength (1M NaCl accounts for 0.058g/ml). A temporal plateau is visible between 340
and ~820h after which water intake continues and reaches a stable state after ~1994h with a
total of 0.43ml/g leading to an uptake rate of 2.1E-04. Here, the higher ionic strength leads to
an increased rate of water intake but not to an increased amount.
sea water I=0.64
ground water I=0.001
IBECO -bentonite (Na)b)
Fig. 4.3.2. Influence of ionic strength on solution uptake into pressed smectite powders. Correction of weightdue to higher ionic strength is indicated as dotted line. a) SWy-2 purified montmorillonite infiltrated by 1MNaCl solution and purified water (packing density 1.36 and 1.37 g/cm3). B) IBECO Na-montmorilloniteinfiltrated by sea water and ground water (packing density 1.14 and 1.15 g/cm3). c) TIXOTON Ca-montmorilloniteinfiltrat ed by sea water and ground water (pac king dens ity 0.94 g/cm3). I=i onic strength.
TIXOTON-bentonite (Ca)c)
sea water I=0.64
ground water I=0.001
SWy-2 montmorillonite (Na)a)
100 30020000
0.1
0.3
0.5
0.7
time (h)
0 500 1000time (h)
15000
0.1
0.3
0.5
0.7
1500 2500 35005000time (h)
salt solution I=1
purified water I<0.001
In contrast, for the bentonite sample infiltrated by both dilute ground water (I= 0.0013mol/L)
and sea water (I= 0.639mol/L), more water enters the sample subjected to the more saline
solution. Here, the difference in weight between ground and sea water is slightly less
significant with 0.037g. In the case of the Na-montmorillonite containing IBECO-bentonite
(Fig. 4.3.2b), there is accordingly ~13% more water intake (total = 0.43ml/g) over a more
rapid time period (384h) with sea water compared to that of dilute ground water (1368h). This
represents a four fold increase in the rate of inflow to 1.1E-03ml/g/h compared to 2.7E-
04ml/g/h. The Ca-bentonite (TIXOTON, Fig. 4.3.2c) hydrated in sea water incorporated a

Chapter 4 - Abiotic influence on smectite hydration ______________________________________________________________________________________________________________________________________________________________________________________________________________________________
63
total of 0.66ml/g, which represents ~7.5% more solution compared to the ground water
sample (0.61ml/g) and, in contrast to the Na-bentonite, this occurred over a longer period of
time (~ 168h compared to 142h). The resulting rate of 3.9E-03ml/g/h is similar to the rate
obtained for the ground water-infiltrated sample (table 4.3.1).
The difference between Na- and Ca-smectite is also evident when plotting the total
water uptake for the range of packing densities tested (Fig. 4.3.3, table 4.1.1.). Linear
relationships are observed for both types of material over packing density range of 1.05 and
1.6g/cm3. Slopes of the linear trends are similar for both Na- and the Ca-smectite and are
independent of the ionic strength of the solution used. Extrapolating the plots to 0ml water
uptake leads to a packing density of 2.1g/cm3 for both types of interlayer cations, which is in
good agreement with the range of published smectite mineral densities (between 1.8 and 2.3
g/cm3), as published by Dud’a et al. (1992).
Fig. 4.3.3. Correlation between packing density and total water uptake forvarious samples. Materials containing predominantly Ca in smectite interlayerstake more water in than the Na varieties. Interpolating the plots to zero wateruptake (dotted lines) yields for both varieties the same values for packingdensity (2.1 g/cm3) that corresponds to mineral density.
total uptake (ml/g)
0.60.40.8
2.2
1.8
1.6
1.4
1.2
0.2 1.00.8
y=-1.5978x + 2.1157R
2= 0.7466
Na-smectite
y=-1.3011x + 21163R2= 0.9438
Ca-smectite
2.0
1.0
0
~2.1
As expected, less water is taken in when the material is packed more densely and therefore
has a lower porosity. Also Ca-smectite generally incorporates more water than the Na-variety
for equivalent packing densities, in accordance with the results presented in Figure 4.3.2. The
higher packing density decreases the available pore space for accommodating pore water and
the expansion of swelling smectite particles. The fact that the fitted slopes for packing density
versus total water intake for mono- and divalent cations are similar indicates that the
restriction of pore space in all packed swelling clay powders is controlled by the same
physical parameter, namely the volume of the reaction-cell. Additionally, it is noted that the
difference in water uptake for the different cations decreases with increasing packing density.

Chapter 4 - Abiotic influence on smectite hydration ______________________________________________________________________________________________________________________________________________________________________________________________________________________________
64
This indicates that initial microtextural differences occur that become negligible when
particles are forced more closely together (Pusch, 2006a).
4.3.2. Influence of solution chemistry on the hydration mechanisms of Wyoming
montmorillonite (SWy-2)
4.3.2.1. Dynamics of water layer development in SWy-2
The hydration of Na-montmorillonite (SWy-2) was monitored during the infiltration of
purified water and 1M NaCl solution in order to constrain the effect of higher ionic strength
on hydration behaviour. In order to exclude cation exchange effects, the sample powder was
first Na-exchanged using a 1 M NaCl solution, washed, re-dried and powdered before loading
into the reaction-cells. Similar packing densities were used in order to exclude porosity
differences. The consistency of packing was achieved with 1.37g/cm3 for the water-hydrated
sample and 1.36g/cm3 for the salt solution infiltrated powder.
Although the material was dehydrated in the oven for 2 weeks (at 110°C) around 5% of
the SWy-2 powder remained hydrated with a 1 water layer (WL) structure (Fig. 4.3.4a+b).
During infiltration with purified water, the collapsed layers (initially 95%) hydrated to form
1- and 2-WL structures. After only 480h all 0-WLs are replaced by hydrated structures (Fig.
4.3.4a). At this time the 1-WL structure is most abundant at 47% and from this point its
proportion decreases successively to reach a stable state at 12%. The replacing 2-WL
structure appears to be slowly replaced by 3-WL but continues to remain the most dominant
structure with a steady state abundance of 63%. The thickest hydrated structure is the 3-WL
structure that is steadily increasing in abundance during the experiment and stabilizes at 25%
under saturated conditions. The normalized uptake curve, shown as a dashed line, matches
most closely the formation of the 1- and later 2-WL structures.
The sample infiltrated with 1M NaCl solution has a similar initial hydration state to the
pure water sample with 96% of completely collapsed layers and 4% abundance of the 1-WL
structure (Fig. 4.3.4b). After 814h, the dehydrated structure (0-WL) is completely replaced by
the growth of 1- and 2-WL structures. As in the pure water experiment, the 1-WL structure
forms a maximum at 44% followed by a rapid decrease down to 21%. This decrease in the
1M NaCl solution occurs more rapidly than in the pure water system. The 2-WL increases
during hydration and forms the dominant structure (64% abundance) whereas the 3-WL

Chapter 4 - Abiotic influence on smectite hydration ______________________________________________________________________________________________________________________________________________________________________________________________________________________________
65
structure forms only 15%, and does not exceed the number of 1-WL. Generally, the sample in
salt solution shows a more rapid development of 2-WL structures but forms slightly less
hydrated structures than the pure water one. This difference is best seen in the abundance of
1- and 3-WLs in the saturated steady state condition. Regarding the pure water system, the 3-
WL is more abundant than the 1-WL structure, whereas with 1M NaCl solution it is just the
opposite: here, the 1-WL is dominant over the 3-WL. The temporal plateau visible for the
normalized water uptake curve (between ~500 and 1500h) might indicate either a hydration
step (this would correspond to a sudden formation of the 3-WL structures) or a temporally
blocked inflow induced by salt precipitations from the solution.
0
20
40
60
80
100
0
20
40
60
80
10 0
0 500 1000 1500 2500
time (h)
30002000 3500 0 500 1000 1500 2500
time (h)
30002000 3500
Fig. 4.3.4. Development of water layers in Na-exchanged purified montmorillonite (SWy-2). a) During infiltration of purified water and b) during infiltration of 1M NaCl. c)Storage sites for solution when infiltrated by purified water and d) by 1M NaCl. Valuesfor weight of NaCl corrected.
interlayer water
external water(pore & surface water)
c) Storage spaces in SWy-2 when infiltratedby purified water
0
0.1
0.2
0.3
0.5
0.4
0 500 1000 1500 2500
time (h)
30002000 3500
b)a)
tota l water content
normalized water uptakenormalized water uptake
Water layer structures in SWy-2 wheninfiltrated by purified water
Water layer structures in SWy-2 wheninfiltrated by 1M NaCl
d)
interlayer water
0
0.1
0.2
0.3
0.5
0.4
0 500 1000 1500 2500
time (h)
3 0002000 3500
external water(pore & surface wa ter)
total water conten t
Storage spaces in SWy-2 when infiltratedby 1M NaCl
1
3
2
01
2
30
The corresponding storage sites determined by subtracting the interlayer from the total
water are shown for both samples (Fig. 4.3.4c+d). In the case of the pure water infiltrated

Chapter 4 - Abiotic influence on smectite hydration ______________________________________________________________________________________________________________________________________________________________________________________________________________________________
66
sample, the curve for interlayer water uptake indicates that a relative stable state is achieved
after 625h with an intake of 0.20ml/g (Fig. 4.3.4c). After 1104h, the amount increased only
slightly to 0.24ml/g making up around 54% of the total water uptake (table 4.3.2). The curve
for external water (combined surface- and pore water) indicates rapid uptake followed by a
short temporary decrease between 625 and 790h. This decrease reflects, most likely, the
transfer of pore water to hydrate interlayer space without a higher rate of new water inflow.
The expansion of non-interlayer sites continues after the stabilization of interlayers and
reaches its stable state at 2314h after incorporating 0.20ml/g of solution.
Total water [ml/g]
Interlayer water [ml/g]
Saturation time (h)
Rate (ml/g/h)
External water [ml/g]
Saturation time (h)
Rate (ml/g/h)
SWy-2-H2O
0.44 0.24 1104 2.2E-04 0.20 2314 8.6E-05
SWy-2-NaCl
0.43* 0.23 1653 1.4E-04 0.20 2450 8.2E-05
Table 4.3.2. Water uptake into the different storage sites of SWy-2 montmorillonite.*Weight after NaCl correction.
The first 500h of the pure water experiment reveal important information on the hydration
mechanism. As the 1-WL hydrates are formed, the rate of interlayer swelling is not quick
enough to use all available water and, therefore, excess surface- and pore water are present.
At this stage, the largest amount of interlayer water is accommodated within 2-WL structures.
However, during the development of the 3-WL structure, a significant amount of water is
used up from pores and this leads to the decrease observed in the external water uptake curve.
Another additional mechanism to explain this pattern of water uptake is that during hydration
the particle size decreases (Fig. 4.3.5).
Fig. 4.3.5. Schematic representation of the formation of new externalsurfaces associated with decreasing particle thicknesses. N=number oflayers per particle (stack).
N=18
N=9
N=9
1
2
1
2
4
3
1 particle made of 18 layers 2 particles made of 9 layers

Chapter 4 - Abiotic influence on smectite hydration ______________________________________________________________________________________________________________________________________________________________________________________________________________________________
67
Such a decrease in particle thickness, commonly observed during hydration, is associated
with the transformation of interlayer into external particle surfaces. This is achieved by simple
splitting and detachment of layers during water uptake, probably related to internal stresses
generated by particle expansion. This latter mechanism would be expected to lead to a relative
increase in the gradient of the non-interlayer curve relative to the interlayer water uptake as
the particles swell, split and increase the surface area of the wet clay powder.
In the case of the sample infiltrated with 1M NaCl, a similar pattern of water transfer is
observed (Fig. 4.3.4d) as a temporary stable state is reached after 340h (0.16ml/g) for the
interlayer water and a temporal increase for external water after ~280h (0.08ml/g) for the non-
interlayer water. As for the pure water infiltrated sample, the curve for non-interlayer water
increases rapidly, indicating that solution is first accommodated on external surfaces and
within pores before being incorporated into the interlayer space. During the last period of the
experiment (after 1653h), interlayer expansion ceases with 0.23ml/g, whereas values for
external water are slightly lower with 0.20ml/g (table 4.3.2).
The fact that the values for both the water and 1M NaCl infiltrated sample are similar
indicates that the higher ionic strength does not affect the net hydration state. However, the
rates are different, with more continuous hydration in case of the water infiltrated sample.
Pores might be kept open and facilitate inflow as a high ionic strength inhibits possible
osmotic swelling and the closure of pores by non-coherent particle expansion (Lagaly, 1993;
Hofmann et al., 2004; Lagaly, 2006).
4.3.2.2. Organization of interlayer water (ordering) in SWy-2
Fig. 4.3.6 shows the ordering probabilities of the different WL structures which developed
in the stable state condition (from 625h onward) for the water- and 1M NaCl-hydrated
samples. In the case of the water hydrated sample (Fig. 4.3.6a), high probabilities (>0.5)
occur for the same WL lying adjacent to each other. This applies particularly to the 1-WL
(p11 between 0.6 and 0.7) and 2-WL (p22 ranging from 0.65 to 0.86) structures. The high
probability to find a 2-WL adjacent to another 2-WL structure is expected to increase simply
as a function of the abundance of this hydrate (around 60%). Similarly, it is also relatively
probable that 3-WLs are found adjacent to the abundant 2-WL (0.4-0.6) and other 3-WL
structures (p33 0.34-0.5). However, it is less common to find the 1-WL adjacent to 2-WL.
These characteristics are best seen in the salt solution infiltrated experiment (here shown from
1650h onwards) where highest probabilities occur for 2-WL to adjacent to 2-WL (p22 is over

Chapter 4 - Abiotic influence on smectite hydration ______________________________________________________________________________________________________________________________________________________________________________________________________________________________
68
0.8, Fig. 4.3.6b), which corresponds well to the high abundance of this 2-WL structure. The
probability that 1-WL follows 1-WL is also relatively high but it is not as common as in the
pure water infiltrated sample.
Generally, the ordering of WLs in the hydrated powders is largely a function of the
relative abundance of WL structures. For random stacking (R0), the layer probabilities would
be a direct function of layer abundance. For example, 2-WL structure with an abundance of
60% has the same probability for p12, p22 and p32 which is 0.6. Any ordering in the
arrangement of water layers is revealed by normalizing probabilities to random stacking, as
shown in Fig. 4.3.6c+d. In both pure and saline water experiments, the probability of
combinations of the same structure is relatively enhanced over the random case (positive
values for p11, p22 and p33). Therefore, the combination of different structures is generally
not favoured (negative values for p32, p12), except for the p31 pair in montmorillonite
hydrated in saline water. Some differences are also seen when comparing the pure water with
the NaCl solution infiltrated sample. The former is characterized by high p11 and p33
probabilities, the latter by high p11 and p22 probabilities. This pattern provides evidence for
clustering of hydrating layers during local homogeneous uptake of water along layers of
equivalent layer charge.

Chapter 4 - Abiotic influence on smectite hydration ______________________________________________________________________________________________________________________________________________________________________________________________________________________________
69
Fig. 4.3.6. Ordering of mixed water layer structures (grey bars) expressed as probabilities (p)and the corresponding water layer abundance (empty bars) for SWy-2 a) infiltrated by waterb) infiltrated by NaCl. c) Stacking probability plotted for SWy-2 expressed as the deviationfrom the random stacking state (R=0) when infiltrated by purified water and d) for SWy-2infiltrated by NaCl solution.
Swy-2 infiltrated with 1M NaClb)Swy-2 infiltrated with purified watera)
p11p22p33p32p12
1WL2WL3WL
p11p22p33p32p12
1WL2WL3WL
0.50 1low high
Swy-2 infiltrated with purified waterc) Swy-2 infiltrated with NaCl solutiond)
0 20 40 60 80 100 0 20 40 60 80 100
0.50 1low high
water layers (%) water layers (%)
p11 p22 p33
p32 p12 p23 p21 p13 p31
-0.6
-0.4
-0.2
0
0.2
0.4
0.6
p11 p22 p33
p32 p12 p23 p21
p13 p31
-0.6
-0.4
-0.2
0
0.2
0.4
0.6
R=0 R=0
4.3.2.3. Particle thickness and theoretical surface area in SWy-2
In Fig. 4.3.7a+b the changes in N are presented for water and 1M NaCl-solution infiltrated
samples. The mean values for N are obtained by matching measured profiles against
calculated diffraction patterns. The N values can also be used to estimate relative changes in
surface area (m2/g), referred to as the theoretical specific surface area (SSA; table 4.3.4 and
details in appendix).
The initial measurement of the purified water experiment was best fitted with a mean of
18 layers per particle (N=18). This value serves as a reference value and corresponds to a
“dry” BET surface area of 27.64m2/g. The mean particle thickness rapidly decreased during
the first 480h of water uptake and then stabilized at 12 layers per particle stack until 1780h,
which corresponds to a SSA value of 41.5m2/g. A further decrease to 9 layers per stack and a
SSA of 55.3m2/g occurs by the end of the experiment (3500h) when the steady state is
reached. Here, the hydrated smectite particles have half the thickness of the dry particles and
twice their surface area.

Chapter 4 - Abiotic influence on smectite hydration ______________________________________________________________________________________________________________________________________________________________________________________________________________________________
70
Fig. 4.3.7. Plot showing the change in the number of layers per stack and the correspondingincrease of surface area with time a) for SWy-2 infiltrated by purified water and b) by 1MNaCl. c) Shows the distribution of stored water and the estimated amount of surface adsorbedwater for the saturated stable state (indicated as a horizontal dotted line) assuming aconcentration of 4mmol/g. The distance between the surface absorbed water line and theexternal water curves (marked by a vertical arrow) represents the amount of bulk pore waterat the end of the hydration experiment.
SWy-2 infiltrated by purified water SWy-2 infiltrated by 1M NaCl solution
laye rs per stack
specific surface area
0 500 1000 1500 2500
time (h)
30002000 35000
4
8
12
20
16
0
20
40
60
100
80
a)
0 500 1000 1500 2500
time (h)
3000200 0 35000
4
8
12
20
16
0
20
40
60
100
80
specific surface area
layers per stack
b)
c)
0
0.1
0.2
0.3
0.5
0.4
0 500 1000 1500 2500
time (h)
30002000 3500
interlayer water
external water
surface adsorbed water
total water content
water in pores
d)
interlayer water
exte rnal water
0
0.1
0.2
0.3
0.5
0.4
0 500 1000 1500 2500
time (h)
30002000 3500
surface adsorbed water
total water content
water in pores
The sample infiltrated by salt solution has a slightly lower initial number of layers per stack
and shows rapid decrease in N during hydration (Fig. 4.3.7.b). Within the first 340h, N
decreases from 16 to 9 and corresponds to a surface area increase from 31.1 to 55.3m2/g. In
this experiment, no intermediate plateau in the N curve was observed as it was seen for pure
water. The nonlinear decrease shows a simple curve and attains a stable, saturated state at a
rate ten times faster than for pure water. Despite the more rapid change in N, there is no
difference between the average particle thickness of the smectite saturated in salt solution or
pure water. Therefore, the theoretical final surface area is for both experiments the same
(~55m2/g). These values are, due to the confined volume conditions, significantly lower than
those obtained for free swelling Na-montmorillonite, where up to 850m2/g could be
theoretically reached (Schramm &Kwak, 1982; Michot &Villieras, 2006).

Chapter 4 - Abiotic influence on smectite hydration ______________________________________________________________________________________________________________________________________________________________________________________________________________________________
71
An estimation of the contribution of surface adsorbed water to the measured external
(non-interlayer) water was calculated by assuming that 4mmol/g of water is required to cover
the initial surface area of 27.64m2/g with one sheet of H2O molecules (Bérend et al., 1995).
Fig. 4.3.7c+d shows the amount of water stored in the smectite clay and the dotted lines
indicate the amount of surface adsorbed water as calculated for the stable state. In both cases
(Fig. 4.3.7c+d), the surface adsorbed water would account for almost the entire “external”
water (which is the combined surface and pore water) indicating that only a small portion of
water filled porosity remains (table 4.3.4). However, it is important to note that all the above
described quantifications of surface areas and the amount of surface adsorbed water are just
approximations and they serve only as estimations to compare the behaviour of equally
treated samples and should not be treated as absolute values equivalent to analytically
measured parameters.
Layers per stack initial
Layers per stack final
External surface area
Initial [m2/g]
External surface area final [m2/g]
Stabilization time [h]
Surface adsorbed water * [ml/g]
Excess water [ml/g] (pore water)
SWy-2-H2O 18 9 27.64 55.3 3440 (480) 0.14 0.06 (30%)
SWy-2-NaCl 16 9 31.13 55.3 340 0.14 0.06 (30%)
Table 4.3.3. Average number of layers per stack and the corresponding theoretical surface area. *Calculated assuming 4mmol/g. The dry BET surface area is 27.64m2/g.
4.3.3. Influence of initial packing density and water content on the hydration behaviour of
MX80 bentonite
4.3.3.1. Dynamics of water layer development in MX80
The influence of initial packing density and hydration state on the hydration dynamics of
smectite-rich clay was investigated using MX80 bentonite. Fig. 4.3.8 shows the change in
water-layer abundance during hydration for 3 different MX80 samples of varying packing
density and initial water contents that were infiltrated with solution of low ionic strength
(I<0.001M). Although the sample in Fig. 4.3.8a was dehydrated for 2 weeks in the oven at
110°C (table 4.1.1.), some 1-WL (5%) and 2-WLs (4%) were present at initial measurements.

Chapter 4 - Abiotic influence on smectite hydration ______________________________________________________________________________________________________________________________________________________________________________________________________________________________
72
During the first 300h of the experiment, all non-hydrated smectite interlayers were completely
replaced by the developing 1- and 2-WL structures. Both reached a maximum of 35%, after
490h for 1-WL and after 681h for 2-WL. The 3-WL structure developed relatively early by
replacing 1-WLs and, at the final stages of the experiment, it reached an abundance of 30%.
The 4-WL structure was also detected and formed by replacing the 2-WLs. The shape of the
XRD profiles also indicated the presence of even thicker hydrated structures, which were best
fitted by assuming a d-value of ~22.8Å. For reasons of simplicity, this structure is referred to
as a 5-WL structure, although the precise nature of this hydrated layer is not clear. This d-
value might also result from the ordering effects of thinner water layers (e.g. a superstructure
formed from adjacent ca 11.4Å layers). At the end of the saturation experiment, the powder
contained 9% of apparent 5-WLs, 30% of 4-WLs and 61% of 3-WLs.
The abundance of water layers in the more densely packed powder (1.43g/cm3) changed
in a similar way with hydration of dehydrated layers (94% of 0-WL) to form a mixture of 1-
to 3-WL and, eventually, 2- to 4-WL structures (Fig. 4.3.8b). However, in comparison to the
less compacted MX80 bentonite, the thickness of hydrated layers (mixture of 3-, 2- and 4-
WLs compared to 3-, 4- and 5- for 1.35g/m2) was notably smaller and the rate of hydration
slower, with a stable state of total water uptake attained after more than 5000h. The 2-WL
was for most of the hydration process the dominant structure increasing in abundance up to
70% followed by a subsequent decrease to 14%. The 3-WL structure developed slowly and
continuously to form the dominant structure at (quasi)-stable state with a value of 78%
together with 8% of the 4-WL structure. A “5-WL” structure was not observed in this more
strongly compacted sample. Both a reduction in water layer thicknesses and a slower rate of
hydration was expected for the more strongly packed samples because of reduced pore space
and, thus, restricted volume for inflow and particle expansion.

Chapter 4 - Abiotic influence on smectite hydration ______________________________________________________________________________________________________________________________________________________________________________________________________________________________
73
MX80 hydrated with 0.23 ml/g, 1.60 g/cm3
(1.31 g/cm3)
0
20
40
60
80
100
300020001000500 1500 2500 35000
time (h)
a) MX80 dehydrated, 1.35 g/cm3
0
20
40
60
80
100
1
0
5
300020001000500 1500 2500 35000
time (h)
increasing packing density
MX80 dehydrated, 1.43g/cm3b)
0
20
40
60
80
100 air solution
Fig. 4.3.8. Development of water layerstructures in montmorillonite duringhydration of MX80 bentonite. a)Dehydrated sample with a packingdensity of 1.35g/cm3. b) Dehydratedsample with elevated packing density(1.43g/cm3). c) Initially hydratedsample with a packing density of1.60g/cm3. The number in bracketscorresponds to the dry packing density.
300020001000500 1500 2500 35000
time (h)
2
normalized water uptake
normalized water uptake normalized water uptake
c)
4
1
3
2
0
1 4
3
4
3
2
The pre-hydrated MX80 bentonite (containing ~0.23ml/g of water) showed a significantly
different pattern of interlayer hydration to that of the two dehydrated bentonite samples (Fig.
4.3.8c). The packing density of this sample was higher when including the pre-absorbed water
(1.60g/cm3) but corresponded to dry packing density of 1.31g/cm3. Therefore, the initial
hydration state was notably different from the other two samples, with a mixture of 40% 1-
WLs, 15% 2-WLs and 45% 3-WL structures. The subsequent pattern of water-layer
development was less complicated with a gradual increase of 3-WL which was always the
most abundant structure (80% at stable state after ~2000h of hydration time). This gradual
increase corresponded with a gentle decrease of the 1- and 2-WL, whereas, after ~1500h, a 4-
WL structure occurred (ca. 10% abundance) and remained unchanged until the end of the
experiment.
The relative abundance of WL structures formed in the pre-hydrated bentonite is most
similar to the more highly compacted dehydrated sample of 1.43g/cm3. The water
incorporated into the smectite (prior to packing the powder into the reaction-cell) was added

Chapter 4 - Abiotic influence on smectite hydration ______________________________________________________________________________________________________________________________________________________________________________________________________________________________
74
into interlayer sites inducing particle expansion. Therefore, the sample behaved according to
its “wet” packing density (1.60g/cm3) like a highly compacted material with reduced
permeability.
Comparing the mean thicknesses of the different initial and final WL structures for the
three samples showed, as expected, similar values for the hydrated and densely packed
dehydrated MX80 (1.43g/cm3, table 4.3.4). In contrast, the two dehydrated samples had
similar values for the difference in mean lattice layer thickness which reflects the dimension
of the hydrated interlayer (∆d 9.45Å and 8.25Å as opposed to 2.7Å for the hydrated sample).
Table 4.3.4. Water layer abundance (%) and the difference in mean lattice layer thickness in Å between the initial and final state of hydration.
4.3.3.2. Organization of interlayer water (ordering) in MX80
An example of the ordering probabilities for the different WL structures formed during
hydration is given for the dehydrated MX80 bentonite at two different stages of hydration
(Fig. 4.3.9a-d). At the beginning of hydration (the first 480h), the probability that a
dehydrated structure lies adjacent to another dehydrated structure is always very high with a
p00 between 0.57 and 0.94. Other combinations that have high probabilities are the 1-WL and
2-WL structures adjacent to dehydrated layers with p10 and p02 values both between 0.7 and
0.9. During the final stages of water intake (between 1700 and 5040h), the 3-WL structure
dominates with abundances between 45 and 81% (Fig. 4.3.9b) resulting therefore in high p33
values, ranging between 0.56 and 0.91. Although the amount of the 2-WL structures
decreases during hydration, the probability that 2-WL structures are neighbours is consistently
high (p22 0.6-0.7). The 4-WL structure is more frequently located adjacent to other thick
hydrated structures than to thinner ones, with p44 values between 0.4 and 0.5 and p43 values
of 0.5.
MX80 dehydrated MX80 dehydrated MX80 hydrated
Packing density 1.35 g/cm3 1.43 g/cm3 1.6 g/cm3 Water layers d-value Initial Final Initial Final Initial Final
0 9.6 0.91 0.94 1 12.2 0.05 0.06 0.4 2 15.2 0.04 0.14 0.15 0.10 3 18.5 0.61 0.78 0.45 0.80 4 20.2 0.3 0.08 0.10 5 22.8 0.09
Mean thickness of d (Å) 9.95 19.4 9.95 18.2 15.6 18.3 ∆d (Å) 9.45 8.25 2.7

Chapter 4 - Abiotic influence on smectite hydration ______________________________________________________________________________________________________________________________________________________________________________________________________________________________
75
Ordering of the WL structures is displayed as a deviation from the random (R0) case for
the initial and final stages of hydration in the MX80 bentonite (Fig 4.3.9c+d). Little variation
is seen from the random stacking state during the initial stages, with layer probabilities not
exceeding 0.31. Systematic deviations from random are only seen in some cases with positive
values for p11 and p22 and negative values for p21 and p12.
0 20 40 60 80 100
Compacted MX80 at final stagesb)
0.50
p22p33p44p43p23
2WL3WL4WL
Compacted MX80 at initial stagesa)
0.50 1low high
p00p11
p22p10p20
0WL1WL
2WL
0 20 40 60 80 100
1low high
Fig. 4.3.9. Ordering of mixed water layer structures (grey bars) expressed as probabilities(p) and the corresponding water layer abundance (black empty bars). a) Initial stages ofthe experiment and b) the final stages. Expressed as the deviation from the random stackingstate (R=0). c) Initial stages and d) final stages.
p00 p22 p01 p20p11 p10p21 p12 p12
R=0
0.4
0.8
0
-0.4
-0.8
0.4
0.8
0
-0.4
-0.8
p33p22
p23 p42
p44
p32p43 p24 p34
R=0
Compacted MX80 at initial stagesc) d) Compacted MX80 at final stages
In contrast, clearly reproducible deviations from the random case occur at final stages of
the experiment (Fig 4.3.9.). As observed in the case of SWy-2 (cp. Fig. 4.3.6), enhanced
probabilities occur for adjacent WL structures of the same thickness, with positive values for
p22 (0.2-0.64), p33 (0.09-0.22) and p44 (0.27- 0.4). In contrast, well defined “negative”
probabilities characterize all combinations of different WL structures. This is especially the
case for the probability that 2-WL is followed by 3-WL (p23 between -0.15 and -0.61), that 4-
WL is followed by 3-WL (p43 up to -0.31) and that 4-WL is followed by 2-WL (p42 up to -
0.41). For other combinations, the deviations are less reproducible and close to the zero line
indicating random ordering.
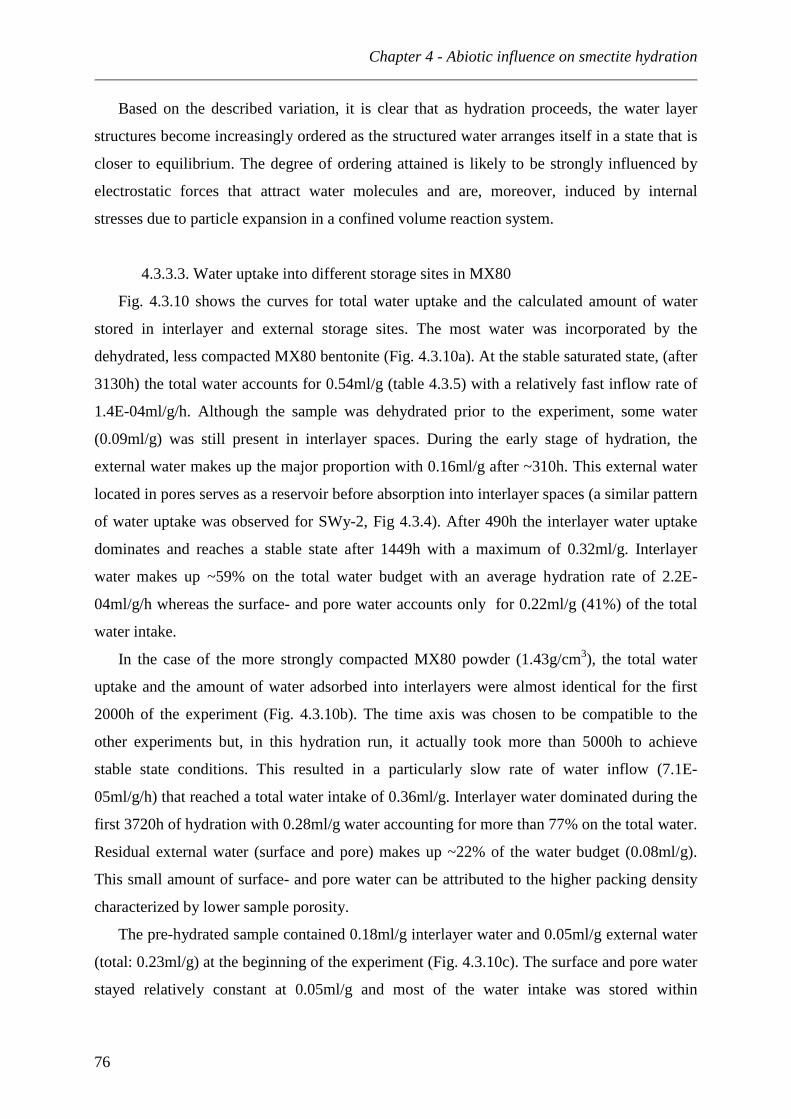
Chapter 4 - Abiotic influence on smectite hydration ______________________________________________________________________________________________________________________________________________________________________________________________________________________________
76
Based on the described variation, it is clear that as hydration proceeds, the water layer
structures become increasingly ordered as the structured water arranges itself in a state that is
closer to equilibrium. The degree of ordering attained is likely to be strongly influenced by
electrostatic forces that attract water molecules and are, moreover, induced by internal
stresses due to particle expansion in a confined volume reaction system.
4.3.3.3. Water uptake into different storage sites in MX80
Fig. 4.3.10 shows the curves for total water uptake and the calculated amount of water
stored in interlayer and external storage sites. The most water was incorporated by the
dehydrated, less compacted MX80 bentonite (Fig. 4.3.10a). At the stable saturated state, (after
3130h) the total water accounts for 0.54ml/g (table 4.3.5) with a relatively fast inflow rate of
1.4E-04ml/g/h. Although the sample was dehydrated prior to the experiment, some water
(0.09ml/g) was still present in interlayer spaces. During the early stage of hydration, the
external water makes up the major proportion with 0.16ml/g after ~310h. This external water
located in pores serves as a reservoir before absorption into interlayer spaces (a similar pattern
of water uptake was observed for SWy-2, Fig 4.3.4). After 490h the interlayer water uptake
dominates and reaches a stable state after 1449h with a maximum of 0.32ml/g. Interlayer
water makes up ~59% on the total water budget with an average hydration rate of 2.2E-
04ml/g/h whereas the surface- and pore water accounts only for 0.22ml/g (41%) of the total
water intake.
In the case of the more strongly compacted MX80 powder (1.43g/cm3), the total water
uptake and the amount of water adsorbed into interlayers were almost identical for the first
2000h of the experiment (Fig. 4.3.10b). The time axis was chosen to be compatible to the
other experiments but, in this hydration run, it actually took more than 5000h to achieve
stable state conditions. This resulted in a particularly slow rate of water inflow (7.1E-
05ml/g/h) that reached a total water intake of 0.36ml/g. Interlayer water dominated during the
first 3720h of hydration with 0.28ml/g water accounting for more than 77% on the total water.
Residual external water (surface and pore) makes up ~22% of the water budget (0.08ml/g).
This small amount of surface- and pore water can be attributed to the higher packing density
characterized by lower sample porosity.
The pre-hydrated sample contained 0.18ml/g interlayer water and 0.05ml/g external water
(total: 0.23ml/g) at the beginning of the experiment (Fig. 4.3.10c). The surface and pore water
stayed relatively constant at 0.05ml/g and most of the water intake was stored within

Chapter 4 - Abiotic influence on smectite hydration ______________________________________________________________________________________________________________________________________________________________________________________________________________________________
77
interlayer sites. After 1470h, the interlayer water was complete with 0.27ml/g, which made up
~82% of the water inflow.
MX80 hydrated, 1.60 g/cm3 (1.31 g/cm3)
increasing packing density
MX80 dehydrated, 1.43g/cm3b)
0
0.70
0.60
0.40
0.20
0.10
0.50
0.30
time (h)
total water content
interlayer water
external water
0
0.70
0.60
0.40
0.20
0.10
0.50
0.30
1000 15000 500 2000 2500 3000time (h)
total water content
interlayer water
1000 15000 500 2000 2500 3000 3500
a) MX80 dehydrated, 1.35 g/cm3
0
0.70
0.60
0.40
0.20
0.10
0.50
0.30
1000 15000 500 2000 2500 3000time (h)
total water content
interlayer water
3500
external water
external water
3500
c)
Fig. 4.3.10. Water uptake intothe different storage sites ofMX80 bentonite. a) Dehydratedsample with an intermediatepacking density (1.35g/cm3). b)Dehydrated sample with anelevated pac king dens it y(1.43g/cm3). c) Initially hydratedsample. Note the packing densityis higher when including theinitial water content (1.60cm3/g)compared to that of the dry state(1.31g/cm3).
MX80-dehydrated
1.35 g/cm3 MX80-dehydrated
1.43 g/cm3 MX80-hydrated 1.6-1.31 g/cm3
Total water Initial amount (ml/g) 0.09 0.005 0.23
Saturation time (h) 3130 5040 1998
Final amount (ml/g) 0.54 0.36 0.32 Rate (ml/g/h) 1.4E-04 7.1E-05 5E-05
Interlayer water
Saturation time (h) 1449 3720 1470
Uptake (ml/g) 0.32 0.28 0.27
Proportion (%) 59.3 77.7 81.8
Rate (ml/g/h) 2.2E-04 7.5E-05 1.8E-04
External (surface and pore) water Saturation time (h) 1997 3720 1998
Uptake (ml/g) 0.22 0.08 0.05 Proportion (%) 40.7 22.3 18.2 Rate (ml/g/h) 1.1E-04 1.6E-06 5.8E-05
Table 4.3.5. Experimental results used to calculate the rates of water uptake into the various storage sites of MX80 montmorillonite as a function of different packing densities and initial hydration states.

Chapter 4 - Abiotic influence on smectite hydration ______________________________________________________________________________________________________________________________________________________________________________________________________________________________
78
The storage of water in the pre-hydrated bentonite seemed to show more similar
characteristics to the strongly packed dehydrated samples. The “wet” powder packed at higher
density (1.60g/cm3) incorporated less external water than the more weakly compacted
dehydrated sample (1.35g/cm3) and in comparison with the strongly packed dehydrated
sample (1.42g/cm3), the storage sites were occupied in a similar way. This behaviour
indicated that a wetted bentonite powder shows equivalent sealing capacities as similarly
packed dehydrated samples while pre-hydrated bentonites will have the disadvantage of
sudden volume loss and clay cracking when dried (Delage et al., 1998; Cui et al., 2002).
4.3.3.4. Particle thickness and theoretical surface area in MX80
Changes in particle thickness and theoretical surface area during hydration for the two
dehydrated MX80 bentonites are displayed in Fig. 4.3.11. The surface area calculated
assuming a particle thickness of 19 layers corresponds to a BET surface area of 30m2/g (table
4.3.6). In the case of the less compacted sample (1.35g/cm3, Fig. 4.3.11a), the particle
thickness decreased from 15 to 3 layers and the surface area increased from theoretically
38m2/g (already slightly hydrated) to around 190m2/g by the end of the experiment (Fig.
4.3.11a). This difference indicates a 5 fold increase in surface area in the near-saturated state.
The more strongly compacted powder also showed a decrease in particle thickness, here
from 19 to 7 layers (Fig. 4.3.11b). This corresponded to a theoretical increase in surface area
from ca. 30 to 81m2/g, which was less than a threefold increase. The smaller increase in
surface area during hydration and the higher abundance of interlayer water in this sample
(Fig. 4.3.11b) suggests particle splitting, and the generation of new external surfaces and pore
spaces is not a significant mechanism in the more strongly compacted clay.
Layers per stack External surface area* [m2/g]
Stabilisation time [h]
Total external water [ml/g]
Maximal surface water [ml/g]
Surface availability [%]
Initial final initial final 4mmol H2O/g
2.5mmol H2O/g
4mmol H2O/g
2.5mmol H2O/g
MX80- 1.35 g/cm3
15 3 38 190 1977 0.22 0.46 0.29 47.8 75.8
MX80- 1.43 g/cm3
19 7 30 81 1704 0.06 0.2 0.12 30 50
MX80-hydated
9 5 63 115 1998 0.05 0.27 0.17 18.5 29.4
Table 4.3.6. Results used to estimate the amount of surface water based on decreasing layers per stack.*Assuming a mean of 19 layers per stack at dry state.

Chapter 4 - Abiotic influence on smectite hydration ______________________________________________________________________________________________________________________________________________________________________________________________________________________________
79
0 500 1000 1500 2500
time (h)
30002000 35000
4
8
12
20
16
0 500 1000 1500 2500
time (h)
30002000 35000
4
8
12
20
16
0
50
100
200
150
Fig. 4.3.11. Plot showing the change in the number of layers per stack and the correspondingincrease of surface area with time for dehydrated and compacted MX80 powder. a) Dehydratedand compacted MX80 powder (1.35 g/cm3). b) Dehydrated and highly compacted MX80 powder(1.43 g/cm3). Estimation of surface adsorbed water according to increased smectite surface areafor c) dehydrated and compacted MX80 powder (1.35 g/cm3) and d) dehydrated and highlycompacted MX80 powder (1.43 g/cm3). Dotted lines indicate the calculated amount of watercorresponding to the stable saturated state assuming 4 or 2.5mmol/g required to cover theexternal surface area. TW-total water, ILW-interlayer water, EW-external water (combined surfaceand pore water).
0
50
100
200
150
a)
MX80 dehydrated, 1.35 g/cm 3 MX80 dehydrated, 1.43g/cm 3
b)
30
81
19
7
15
338
190
d)
0
0.70
0.60
0.40
0.20
0.10
0.50
0.30
time (h)
0
0.70
0.60
0.40
0.20
0.10
0.50
0.30
1000 15000 500 2000 2500 3000time (h)
3500 1000 15000 500 2000 2500 3000 3500
TW
ILW
EW
TWILW
EW
c)
layers per stack
specific surface area
layers per stack
specific surface area
4mmol/g
2.5mmol/g
4mmol/g
2.5mmol/g
The relative contribution of the increased surface area to the sorption of surface water was
calculated assuming that 4 and 2.5mmol/g of water were needed to cover the external surfaces
at the stable state (Fig. 4.3.11c+d). 4mmol/g were considered more typical for dispersed Na-
montmorillonite (Bérend et al., 1995) whereas 2.5mmol/g was reported for Ca-
montmorillonite (Cases et al., 1997). As noted for the SWy-2 sample, these values should be
just taken as a reference to compare equally treated samples, since the published data was not
obtained using similar experimental conditions.
For both samples, the theoretical possible amount of water sorbed on external surfaces
exceeded the available external water when using both values (4 and 2.5mmol/g). (The
external water was obtained by subtracting interlayer water, obtained from CALCMIX
calculations). Because of the confined volume, water is unable to enter the system and to

Chapter 4 - Abiotic influence on smectite hydration ______________________________________________________________________________________________________________________________________________________________________________________________________________________________
80
saturate the surfaces as in an open system. Therefore, in the case of the less compacted sample
(Fig. 4.3.11c), a higher proportion of surfaces could be saturated with the available external
water compared to the strongly compacted sample. Calculating for 2.5mmol/g, the maximal
portion of saturated external surface was 73% for the less compacted sample vs. 42% for the
more compacted one. In comparison to the SWy-2, where excess water was available to fill
pore spaces, the access for water n MX80 is limited.
4.3.4. Hydration behaviour of bentonite in natural solution
4.3.4.1. Dynamics of water layer development in IBECO and TIXOTON
The hydration experiments infiltrated with ground water and Atlantic sea water were
conducted to quantify the uptake and storage in Na-activated IBECO and Ca-activated
TIXOTON bentonite when infiltrated by ground- and Atlantic sea water. The development of
water layer structures is given in Fig. 4.3.12a-d. In the case of the ground water infiltrated
IBECO powder, the initial hydration state comprised 31% 0-WL, 59% 1-WL and 10% 2-WL
(Fig. 4.3.12a). During ground water inflow, rapid growth of the 2-WL structure occurred at
the expense of both 0- and 1-WL. Between 400-600h of inflow, the 0-WL disappeared, the 1-
WL structure stabilized at ~ 30% and the 2-WL state reached its maximum abundance at
60%. After 600h of hydration, the 2-WL transformed into the 3-WL state, a reaction which
was completed by ~1400h. Following this change, the hydration condition reached a steady
state composed of ~ 70% 3-WL and ~ 30% 1-WL. No 4-WL structure was detected in this
experiment.
In sea water, the interlayer hydration of IBECO occurred over a shorter time period than
in ground water (Fig. 4.3.12b). The abundance of 0- and 1-WLs rapidly decreased during the
initial hours of hydration and disappeared within the first 300h of hydration time. During this
period, both 2-WL and 3-WL formed rapidly, and reached a steady state condition between
200-400h consisting of 55% 2-WL, 40% 3-WL and 5% 4-WL components.
In the case of the Ca-activated TIXOTON powder, the initial hydration state was higher,
consisting of 15% 1-WL, 70% 2-WL and 5% 3-WL (Fig. 4.3.12c). No 0-WL structure was
detected in this sample material. During the first phase of ground water inflow both 1 and 2-
WLs rapidly decreased during the first 30h of hydration, with the formation of the 3-WL
state, reaching a maximum (~60% abundance) after 40h. A 4-WL state appeared at this stage

Chapter 4 - Abiotic influence on smectite hydration ______________________________________________________________________________________________________________________________________________________________________________________________________________________________
81
of the experiment, corresponding to the disappearance of the 1-WL, the continued decline of
2-WL, and the reduction of the 3-WL structure. A steady state system was achieved after
150h of hydration and comprised 11% 2-WL, 42% 3-WL and 47% 4-WL. When hydrated in
sea water, the 1- and 2-WL structures decreased rapidly and the formation of 3 and 4-WLs
during the initial 60h of hydration could be observed (Fig. 4.3.12d). After 120h, the 2-WL
structure showed about the same abundance as in ground water (~10%) and the 3-WL
structure increased to ~ 60%. However, in the steady state condition, the 3-WL phase
remained dominant, and was accompanied by 27% of 4-WLs.
0
20
40
60
80
100
0 50 100 150 200 250 300 350
time (h)
Ca-smectite (TIXOTON) in ground water
0
20
40
60
80
100
0 400 800 1200 1600 2000
time (h)
Na-smectite (IBECO) in sea waterb)
20
40
60
80
100
0 50 100 150 200 250 300 350
time (h)
d)
0
a)
0
20
40
60
80
100
0 400 800 1200 1600
time (h)
2000
Na-smectite (IBECO) in ground water
Ca-smectite (TIXOTON) in sea water
Fig. 4.3.12. Water layer development in smectite contained in bentonite powders. a) IBECOinfiltrated by ground water. b) IBECO infiltrated by sea water. c) TIXOTON infiltrated byground water. d) TIXOTON infiltrated by sea water. Ionic strength for ground and sea wateris 0.0013 and 0.64M, respectively. Modified after Warr & Berger (2007).
normalized water uptake normalized water uptake
normalized water uptakenormalizedwater uptake
c)
1
4
3
2
1
3
2
0
4
14
3
2
1
3
20
Values of mean thickness (d-values) for the initial and final water layer distribution are
given in table 4.3.7 for both the ground- and sea water infiltrated IBECO and TIXOTON
samples. Both IBECO bentonite samples had similar final mean thicknesses (16.64Å in
ground- and 16.77Å in sea water) that was lower compared to values for TIXOTON with 18.9

Chapter 4 - Abiotic influence on smectite hydration ______________________________________________________________________________________________________________________________________________________________________________________________________________________________
82
vs. 18.6Å. This is in accordance with results for different interlayer cations (cp. Fig. 4.3.3.)
and can be attributed to the fact that IBECO is Na-activated and TIXOTON Ca-activated.
Table 4.3.7. Water layer abundance (%) and the difference in mean lattice layer thickness in Å between the initial and final state of hydration for bentonites infiltrated by natural solution.
4.3.4.2. Water uptake into different storage sites in IBECO and TIXOTON
The quantification for interlayer and non-interlayer water are given in Fig. 4.3.13 with
corresponding uptake rates in table 4.3.8. In this case, the calculation was based on
CALCMIX fitting of XRD-patterns of samples that already contained some interlayer water
and all curves were normalized to a starting water content of zero at the beginning of each
experiment. Thus, the presented hydration curves represent the quantification of water inflow
and not the total water content of the bentonite, which is higher than the values given.
In the case of Na-bentonite, the total inflow of ground water, the growth of interlayer
water and the incorporation of external water showed the same general linear increase. The
interlayer water hydrated at an average rate of 1.5E-04ml/g/h over 1368h but a slight
flattening of the curve started after around 1250h (Fig. 4.3.13a). The external water hydrated
at a similar rate 1.2E-04ml/g/h over 1368h but, in this case, a clear linear trend was
maintained. After 1500h, the proportion of interlayer water made up 54% of the total water
inflow.
IBECO IBECO TIXOTON TIXOTON Ground water Sea water Ground water Sea water Water layers d-
value Initial Final Initial Final Initial Final Initial Final
0 9.6 0.31 0.45 1 12.2 0.59 0.29 0.45 0.15 0.25 2 15.2 0.1 0.01 0.1 0.55 0.7 0.11 0.7 0.11 3 18.5 0.7 0.4 0.05 0.42 0.05 0.62 4 20.2 0.05 0.47 0.27 Mean d-value (Å) 11.7 16.64 11.33 16.77 13.4 18.9 14.6 18.6 Difference ∆d (Å) 4.94 5.44 5.5 4

Chapter 4 - Abiotic influence on smectite hydration ______________________________________________________________________________________________________________________________________________________________________________________________________________________________
83
0
0.2
0.4
0.6
0.8
0 100 200 300time (h)
total water content
interlayer water
time (h)1500
time (h)
0
0.2
0.4
0.6
0.8
0 100 200 300
to tal water conten t
interlayer water
c)
15000
0.1
0.2
0.3
0.4
0.5
0 500 1000
tota l water content
interlayer water
external water
b)
time (h)
0
0.1
0.2
0.3
0.4
0 500 1000
interlayer water
external water
a)
Fig. 4.3.13. Partitioning of water storage sites in bentonites infiltrated by naturalsolutions. The weight of seawater was corrected for the amount of dissolved ions.Modified after Warr & Berger (2007).
IBECO infiltrated by ground water IBECO infiltrated by sea-water
TIXOTON infiltrated by ground water TIXOTON infiltra ted by sea waterd)
external water
external water
total water content
The sea water intake curves reveal a different behaviour from the ground water
experiments with non-linear intake rates (Fig. 4.3.13b). Rapid uptake leads to the formation of
a relative stable plateau after only 552h for the external water (average rate 3.6E-04ml/g/h)
and after 720h for interlayer hydration (average rate 3.1E-04ml/g/h). 52% of interlayer water
and 48% of external water were observed at the end of the experiment (values for higher
weight of the sea water were corrected). This uptake was much more rapid than the NaCl
infiltrated SWy2 sample (cp. Fig. 4.3.6) and was most likely due to the decreased packing
density.

Chapter 4 - Abiotic influence on smectite hydration ______________________________________________________________________________________________________________________________________________________________________________________________________________________________
84
IBECO in ground
water IBECO in sea water
TIXOTON in ground water
TIXOTON in sea water
Interlayer water Saturation time (h) 1368 720 87 146.3
Uptake (ml/g) 0.2 0.22 0.15 0.15
Proportion (%) 54 52 24 23 Rate (ml/g/h) 1.5E-04 3.1E-04 1.7E-03 1.0E-03
External water (surface and pore water) Saturation time (h) 1368 552 142 167.6
Uptake (ml/g) 0.17 0.20 0.46 0.49 Proportion (%) 46 48 76 77 Rate (ml/g/h) 1.2E-04 3.6E-04 3.2E-03 2.9E-03
Table 4.3.8. Experimental results used to calculate the rates of water uptake into the various storage sites of Na- and Ca-bentonites. The weight of sea water was corrected for salt content.
The proportion of external water was visibly higher in the Ca-bentonite experiments (Fig.
4.3.13 c-d). In ground water, most of the total content was stored as surface and pore water
(76%), which formed at an average rate of 3.2E-03ml/g/h. The interlayer water intake was
already completed (hydration rate of 1.7E-03ml/g/h) when the total intake ceased after 142h.
When infiltrated with sea water, the amount stored as external water made up around 77% of
the total water inflow resulting, therefore, equivalent to the ground water infiltrated sample.
The interlayer water curve flattened after 100h (hydration rate of 1.0E-03ml/g/h) and
indicated no change after 146h, whereas significant volumes of surface and pore water
continued to build up until ceasing at ~ 167h (hydration rate of 2.9E-03ml/g/h).
4.3.4.3. Particle thickness and surface area estimates in IBECO and TIXOTON
The Na-montmorillonite containing IBECO infiltrated with natural ground water showed
the same initial and final number of layers per stack as infiltrated by sea water, decreasing
from 15 to 5 (Fig. 4.3.14a+b). Accordingly, the values for the initial surface area for both
samples were 66.4m2/g and at the final stages 199.2m2/g. The major difference between the
two samples was the time needed to achieve stable state. When infiltrated by ground water it
took 1250h until a stable state was formed, whereas, in the case of salt water infiltration, the
system stabilized already after 214h (that is more than 5 times quicker). The same trend was
visible for the Ca-montmorillonite-containing TIXOTON bentonite when infiltrated by
ground- and sea water (Fig.4.3.14c+d). In both cases, the particle thickness decreased from 14
to 7 layers per stack and the corresponding surface area increased from 132 to 265m2/g. When

Chapter 4 - Abiotic influence on smectite hydration ______________________________________________________________________________________________________________________________________________________________________________________________________________________________
85
infiltrated by ground water, a stable state was achieved after 142h, whereas, salt water
infiltration led to a stable state after less than 5h (3 times less time).
IBECO infiltrated by ground water IBECO infiltrated by sea-water
laye rs per stack
specific su rface area
time (h)
0
5
10
15
0
80
160
280
240
a)
0 500 1000
time (h)
1500
0
speci fic surface area
layers per stack
b)
200
120
40
0 500 1000 1500
80
160
280
240
200
120
40
0
5
10
15
6666
TIXOTON infiltrated by ground waterc)
time (h)
0
5
10
15
0
80
160
280
240
200
120
40
0 50 150 350
66
250
7
14
132
265
TIXOTON infiltrated by sea waterd)
time (h)
0
5
10
15
0
80
160
280
240
200
120
40
0 50 15 0 350
66
250
7
14
132
265specific surface area
layers per stack
speci fic surface area
layers per stack
Fig. 4.3.14. Changes in the number of layers per stack and the corresponding surface areasof montmorillonite contained in bentonite (a-d).
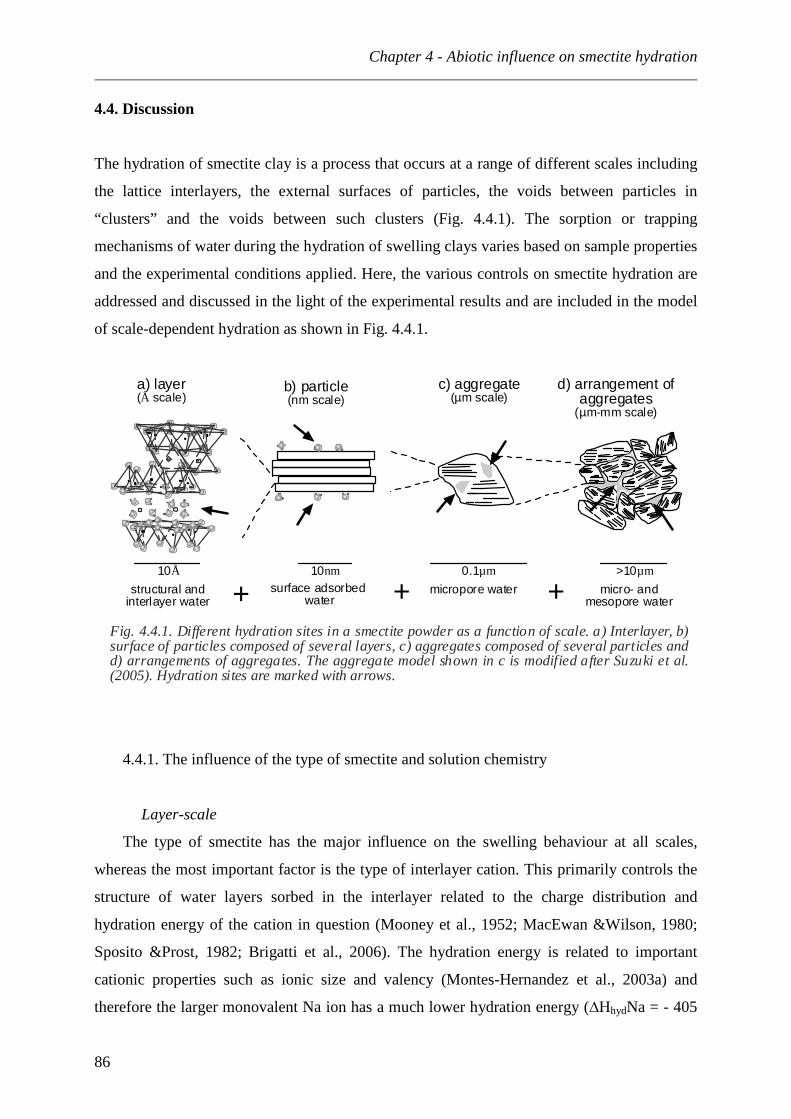
Chapter 4 - Abiotic influence on smectite hydration ______________________________________________________________________________________________________________________________________________________________________________________________________________________________
86
4.4. Discussion
The hydration of smectite clay is a process that occurs at a range of different scales including
the lattice interlayers, the external surfaces of particles, the voids between particles in
“clusters” and the voids between such clusters (Fig. 4.4.1). The sorption or trapping
mechanisms of water during the hydration of swelling clays varies based on sample properties
and the experimental conditions applied. Here, the various controls on smectite hydration are
addressed and discussed in the light of the experimental results and are included in the model
of scale-dependent hydration as shown in Fig. 4.4.1.
a) layer(Å scale)
b) particle(nm scale)
c) aggregate(µm scale)
d) arrangement ofaggregates
(µm-mm scale)
structural and interlayer water
surface adsorbed water+ + micropore water + micro- and
mesopore water
Fig. 4.4.1. Different hydration sites in a smectite powder as a function of scale. a) Interlayer, b)surface of particles composed of several layers, c) aggregates composed of several particles andd) arrangements of aggregates. The aggregate model shown in c is modified after Suzuki et al.(2005). Hydration sites are marked with arrows.
10Å 10nm 0.1µm >10µm
4.4.1. The influence of the type of smectite and solution chemistry
Layer-scale
The type of smectite has the major influence on the swelling behaviour at all scales,
whereas the most important factor is the type of interlayer cation. This primarily controls the
structure of water layers sorbed in the interlayer related to the charge distribution and
hydration energy of the cation in question (Mooney et al., 1952; MacEwan &Wilson, 1980;
Sposito &Prost, 1982; Brigatti et al., 2006). The hydration energy is related to important
cationic properties such as ionic size and valency (Montes-Hernandez et al., 2003a) and
therefore the larger monovalent Na ion has a much lower hydration energy (∆HhydNa = - 405

Chapter 4 - Abiotic influence on smectite hydration ______________________________________________________________________________________________________________________________________________________________________________________________________________________________
87
kJ/mol; Huheey 1993) compared to the smaller, divalent Ca (∆HhydCa= -1592 kJ/mol). This
effect is visible by the slower interlayer water uptake in case of all Na-containing smectites
(SWy-2, MX80-bentonite and IBECO-bentonite, table 4.3.1).
For example the Na-activated IBECO bentonite hydrated in ground water showed the
slowest rate of hydration and was not completely saturated even after the 1500h duration of
the experiment. In contrast, the interlayer uptake of the Ca-activated TIXOTON bentonite
infiltrated by the same solution was accomplished after just 80h. Although differences in
packing density occur between these samples (TIXOTON bentonite 0.94 g/cm3 vs. 1.15g/cm3
for IBECO), which influences access of water to interlayer sites, the dominant factor
controlling the enhanced uptake rate of the Ca-smectite is considered to be the higher
hydration energy. Whereas the interlayer uptake rates for all Na- smectites vary between
1.4E-04 and 7.5E-05, the Ca-varieties show values enhanced by a factor of 10 with rates
between 1.0 and 1.7E-03 (table 4.4.1).
Table 4.4.1. Calculated rates of water uptake into the interlayer spaces of various *Na- and +Ca- smectites. The samples are of varying packing density and where infiltrated with a range of ionic solutions
Particle-scale
The type of interlayer cation has additionally an influence on particle scale (Fig. 4.4.1)
because the number of average layers per clay stack varies for the different types of smectite.
For example, the number of layers per particle is reported to be higher for Ca-smectite
(average ~10 layers per stack when hydrated) as opposed to the thinner stacks composed of 3
to 5 layers for Na-varieties (Cases et al., 1997; Pusch, 2006b). This trend is partially visible
when comparing the Ca-activated TIXOTON and the Na-activated IBECO where the latter
shows a decrease to 5 layers per stack and the TIXOTON to 7, independent of the infiltrated
solution (Fig. 4.3.15). However, these differences are less pronounced than described in the
IBECO seal 80* TIXOTON-TE + MX80 (BF100)* SWy-2* Nau-1+ Material Na-activated
bentonite Ca-activated
bentonite bentonite Purified
montmorillonite Purified nontronite
packing density [g/cm3]
1.15 1.14 0.94 0.94 1.43 1.35 1.60 (dry 1.31)
1.37 1.36 1.08
Ionic strength of infiltrating
solution [mol/l]
0.0013 0.639 0.0013 0.639 0.0001 0.0109 0.0109 0.0001 1 0.0001
Interlayer uptake rate
[ml/g/h]
1.5E-04 3.1E-04
1.7E-03
1.0E-03 7.5E-05 2.2E-04 1.8E-04 2.2E-04
1.4E-04
<1.2E-03

Chapter 4 - Abiotic influence on smectite hydration ______________________________________________________________________________________________________________________________________________________________________________________________________________________________
88
literature (Schramm &Kwak, 1982; Pusch, 2006a) and appears to be strongly dependent on
the packing density when particle separation is restricted by limited pore volume.
The solution chemistry also clearly influences smectite hydration on a particle scale. It
has been reported that a higher ionic strength of infiltrated solution leads to increased rates of
hydration by influencing the micro texture of clay particles. During particle aggregation,
voids in the micro porosity are not closed (Pusch, 2001a). This mechanism occurs during the
initial states of solution uptake by Na-smectite (SWy-2 montmorillonite and the Na-activated
IBECO-bentonite) where both external (surface- and pore-water) and interlayer water show
enhanced uptake rates (Fig. 4.3.2). The Ca-activated TIXOTON bentonite showed slower
uptake when infiltrated with sea water compared to the ground water infiltrated sample (ionic
strength of 0.64M as opposed to 0.0013M). Due to the presence of the divalent Ca in the
interlayers, this sample has already a tendency to form aggregates and the effect of solution
concentration is not as pronounced as for Na-smectite.
Responsible for sealing is, however, the amount of interlayer water that was in both cases
(Na and Ca-smectite) not observed to be affected by the higher ionic strength. In the case of
SWy-2 infiltrated by 1M NaCl the interlayer water did not significantly differ from the water
infiltrated sample (table 4.3.2) and in the case of IBECO-bentonite, the interlayer water was
even enhanced when infiltrated by sea water as opposed to ground water (table 4.3.8). These
results indicate that the saline solution has no serious detrimental effects on intracrystalline
swelling of Na-smectite, as previously noted by Hofmann et al. (2004).
4.4.2. Progressive hydration in solution under confined volume conditions
All hydration experiments in this study were conducted using aqueous solutions as
opposed to conditions of relative humidity. Therefore differences in the mechanisms and
kinetics of hydration can be expected. It is generally well documented that the smectite clays
(in particular montmorillonite) show a step-wise hydration behaviour as the water activity is
improved under conditions of increasing air humidity (Collins et al., 1992; Chipera et al.,
1997; Ferrage et al., 2005b). This stepwise hydration behaviour is commonly attributed to
apparent energy levels as hydration shells are formed around interlayer cations (Karaborni et
al., 1996; Cases et al., 1997). In contrast the build-up of structured interlayer water in
percolating solutions is observed to be a more continuous process. In general, water-layers do
not appear spontaneously in high abundance, as seen with increasing humidity, but form

Chapter 4 - Abiotic influence on smectite hydration ______________________________________________________________________________________________________________________________________________________________________________________________________________________________
89
steadily as part of a progressive layer expansion process as seen during the hydration of the
Wyoming bentonite sample, SWy-2 (Fig. 4.3.4 a+b) or the MX80 bentonite(Fig. 4.3.8).
In some hydration experiments the occurrence of apparent plateaus may be better
explained by transport fluctuations during the inflow of water rather than to variations in
hydration energy. A stepwise behaviour was observed for SWy-2 when hydrated with a
solution of increased ionic strength (1M NaCl, Fig. 4.3.2.a). This apparent hydration step
could result from precipitation of salts from the solution that blocked infiltration but might be
as well due to the increased rate of infiltration whereby less time is available to organize the
preferred coordination of interlayer water molecules. In the case of the sea water infiltrated,
Ca-activated TIXOTON bentonite, an apparent hydration step is also visible (Fig. 4.3.2). One
possible explanation here is that cation exchange reactions such as K exchanging Ca led to a
reduction in the number of water layers.
However, such variations in the rate of interlayer water uptake and the occurrence of
apparent hydration steps should be interpreted with caution as these fluctuations can also
results as an artefact of the calculation procedure applied in this study. In the CALCMIX
program, that was used to quantify the abundance of water layers, only combinations of 3
different WL structures can be fitted simultaneously, whereas in some transitional states it is
probable that more WLs coexist. For example, the immediate appearance of abundant 3-WL
structures in some bentonites (e.g. 35%, as seen for Na-activated IBECO, Fig. 4.3.12a) is
considered to be such an artefact as these thick hydrated interlayers are more likely to form
continuously by progressive layer growth, which could not be resolved by the CALCMIX
approach.
Influence of the confined volume conditions on a layer scale
The confined volume was seen to have, as expected, a significant influence on the
hydration behaviour of the smectites on all scales. Concerning the interlayer hydration (layer-
scale, Fig. 4.4.1) the generation of significant swelling pressures can limit particle expansion
(Pusch, 2001b; Komine, 2004; Komine &Ogata, 2004; Pusch, 2006a). This is visible in the
number of water layers formed with increasing packing density of the MX80 bentonite (Fig.
4.3.8). The more strongly compacted sample (initial packing density 1.43g/cm3, Fig. 4.3.8b)
shows a final combination of 2-, 3- and 4-WL whereas for the less compacted sample
(1.35g/cm3, Fig. 4.3.8a) 3-, 4- and 5-WL are developed.

Chapter 4 - Abiotic influence on smectite hydration ______________________________________________________________________________________________________________________________________________________________________________________________________________________________
90
The suppression of water layers due to an increased packing density is also well illustrated
by considering the mean thickness of hydrated interlayers such as presented in table 4.3.4 for
the MX80 samples. Both the pre-dried more densely packed MX80 (1.43g/cm3) and the wet
MX80 sample (1.60g/cm3) show similar final mean thicknesses with 18.2-18.3Å whereas the
more loosely packed powder (1.35g/cm3) accommodates thicker structures with a mean
thickness of 19.4Å. The other investigated bentonites exhibit as well features that can be
attributed to the confined volume. The stable configuration of saturated Na-activated IBECO
was a mixture of 1- and 3-WLs; a structural arrangement commonly described for the
interlayer hydration of Na cations under high humidity conditions (Karaborni et al., 1996).
The absence of a 4-WL structure in the saturated state of this experiment is attributed to the
buildup of swelling pressure within the sealed cell, which inhibited further layer expansion
(Fig. 4.3.12).
Influence of the confined volume on a particle scale
Furthermore the volume of the system is seen to influence particle and aggregate
processes (Fig. 4.4.1). Classical studies have characterized smectite and bentonite hydration
in free swelling systems (Norrish, 1954; Norrish &Quirk, 1954; Laird et al., 1995; Wilson et
al., 2004) in which Na-montmorillonite can by osmotically swell and increase the interlayer
space until the particles lose their coherence and form a amorphous gel (Lagaly 1993; 2006).
Accordingly, the external surface area can reach several hundreds of m2 (Schramm &Kwak,
1982; Lagaly, 2006; Michot &Villieras, 2006). However, in confined volume conditions the
formation of gels is inhibited and probably occurs only locally in restricted void space. In
theoretical calculations, based on the reduced particle thickness, the surface area yield the
highest values for MX80 at ~190m2/g, which corresponds to a mean number of 3 layers per
particle (table 4.3.6). However, under confined volume conditions such calculated values for
surface area are not directly applicable because the particles cannot expand freely (Fig. 4.4.3
c+d). For example the area provided by external surfaces of the less compacted MX80
bentonite could theoretically accommodate up to 0.4ml/g but only 0.22ml/g is contained as
external water because the volume is restricted.
For purified Na-exchanged SWy-2 montmorillonite, however, the values of theoretically
adsorbed surface water and available external water are in good agreement (Fig. 4.3.7). In this
case the numbers of layers per stack do not decrease as strong as for MX80 samples although
the packing densities are similar (between 1.35 and 1.37m2/g). This might indicate that the
relative strong decrease in particle thickness observed for MX80 is due to sample

Chapter 4 - Abiotic influence on smectite hydration ______________________________________________________________________________________________________________________________________________________________________________________________________________________________
91
heterogeneities and non clay mineral impurities which provide local voids that allow more
free expansion (Fig. 4.4.3e). The SWy-2 sample, in contrast, is notably more homogenous
(grain size separated <1µm, Na-exchanged, almost completely dehydrated). Here is noted that
in a confined volume system the surface area is not necessarily entirely available, for example
to adsorb toxins.
Generally it should be noted that the surface area calculations are based on values for
number of layer per stack which were included in the peak fitting of the CALCMIX program
that should be considered as a best approximation rather that absolute values. However the
results show that it is not applicable to consider values of several hundreds of square meters in
confined volume conditions but it is as well not recommended to assume a constant surface
area for hydrating smectite.
Influence of the confined volume on aggregates (bulk textural scale)
The effect of texture and micro porosity in confined volume can be seen in samples with
sufficiently low uptake rates (< 1E-04ml/g/h). These experiments reveal relatively rapid pore
water intake which serves as a reservoir that is subsequently redistributed to occupy interlayer
space (Fig. 4.3.4.c and 4.3.10a). It is considered likely that smectite particles adjacent to the
same pore space take up similar amounts of water and form clusters with the same water layer
abundance (Fig. 4.4.3e). The formation of such hydration clusters is indicated by the
increasing ordering of WL structures observed during hydration. Water layer distributions in
the confined volume experiments show an enhanced probability that structures of the same
thickness lie adjacent to each other (Fig. 4.3.6c, 4.3.9d). This contrasts the general assumption
of random ordering for swelling in relative humidity (R=0) and as well the R=1 ordering that
was described to occur on a particle scale in experiments done by Moore and Hower (1986).
Here ordered arrangements of different thicknesses were observed to be more stable.
The difference between Na- and Ca-smectites tends to decrease with increasing packing
density because the importance of micro texture becomes increasingly negligible with
compaction as noted by Pusch (2001b; 2006a). This was observed concerning the final
amount of water uptake that was seen to be strongly dependent on interlayer cation at low
packing densities and almost independent at higher densities (Fig. 4.3.3). Although during
hydration the degree of homogenization increases and texture changes play an important role
attaining a uniform hydration behaviour, the confined volume studies conducted by Pusch
(2001b) revealed that density variations persist. He showed that even at very high packing

Chapter 4 - Abiotic influence on smectite hydration ______________________________________________________________________________________________________________________________________________________________________________________________________________________________
92
densities, softer and more pervious zones are formed by partly or completely interconnected
”external” voids that are filled with more or less dense clay gels. A schematic representation
of the hydration on the bulk texture scale for Na- and Ca-smectite under confined volume
conditions is presented in Fig. 4.4.2.
Fig. 4.4.2. Schematic sketch of water uptake and hydration of smectite in confined volumeconditions (bulk textural scale). a+b) Initial stages of hydration dominated by pore waterintake. c+d) Pore water serves as a reservoir for interlayer expansion leading to the formationof hydration aggregates. e+f) Interlayer hydration and local particle separation leads to theexpansion of aggregates and pore closure. In the case of Na-smectite (e) the formation of gelsfill remaining pore spaces and voids associated with mineral impurities (inserted image).
Na-smectite Ca-smectite
a) b)
c) d)
e) f)
pore water
pore water
gel
aggregateaggregate
Differences between Na-smectite and Ca-smectite at initial stages are the smaller number
of layers par stack in the case of Na-smetite and a poorer connectivity of the porespaces,
whereas Ca-smectite is characterized by thicker stacks and a better connectivity (Fig.

Chapter 4 - Abiotic influence on smectite hydration ______________________________________________________________________________________________________________________________________________________________________________________________________________________________
93
4.4.2a+b). Therefore pore water enters the Ca-smectite more rapidly compared to the Na-
smectite. Where water came in contact with the powder, hydration aggregates are formed
(Fig. 4.4.2c+d). Because of the increased expansion of Na-smectite aggregates, the access for
water is restricted and the rate of intake relative to the Ca-smectite decreased. At saturated
state the formation of gels in voids seals the Na-smectite, whereas in the case of Ca-smectite
some porosity remains (Fig. 4.4.2e+f).
4.4.3. The influence of initial conditions
Initial variations in sample conditions, namely packing density, pore-size distributions and
particle orientation (texture) have been shown to influence hydration behaviour to a large
extent (Wilson et al., 2004). The influence of packing density is for example visible in the
case of MX80 where the more densely packed sample incorporate less total water into the
powder compared to the dry and more loosely packed powder (Fig. 4.3.10a+b). Despite these
differences in total water uptake, the amount of water in the interlayer is almost the same,
indicating the higher porosity accommodates the additional external water measured. It is also
evident that if the initial hydration is elevated the increased wet packing density is higher and
the amount of available pore space for additional water uptake becomes restricted (Fig.
4.3.10c).
The incorporation of water in the powder prior to conducting the hydration experiment
results in a similar behaviour compared to the equivalent highly compacted dry sample.
However once the sample dries after the period of experimentation a significant macro
porosity is expected to be created. The initial state of pore structure and particle orientation
was not quantified as part of this study but these variations between samples are considered to
be relative low compared to those presented in other studies (Wilson et al., 2004). A
consistent and reproducible method was used to introduce the powders into the reaction-cell
before hydration and therefore textural differences were minimized. Textural variations
present are more likely to represent the natural state of the clay powder rather than introduced
during loading of the cell. Such heterogeneities are typical of bentonite powders, which
contain non-platy minerals (table 3.1) and a range of grain size distributions. In contrast, the
separated fine grained clay mineral fractions appear to be more homogenous in nature due to
their close to monomineralic content and reduced range of grain size.

Chapter 4 - Abiotic influence on smectite hydration ______________________________________________________________________________________________________________________________________________________________________________________________________________________________
94
4.4.4. Implications of confined volume laboratory analogue for understanding natural systems
The varying amounts of external and interlayer water incorporated into saturated
bentonites is expected to have significant effects on the rate of elemental transfer, and can be
described by combining equations of free diffusion and surface adsorption (Bourg et al.,
2003). Successful numerical modelling of elemental transport, including the migration of
radionuclides (Bors et al., 1997) in the repository setting is reliant on the type of quantitative
data presented here. Loosely bound, external water is more likely to be lost at lower
temperatures during any subsequent heating and dehydration event, which might occur in the
vicinity of radioactive waste containers. This contrasts with the more strongly bound
interlayer water that is released at temperatures of generally 100°C and higher (Farmer
&Russel, 1971; MacEwan &Wilson, 1980; Bray et al., 1998).
The separation of interlayer and true particle surface adsorption is also required to
improve knowledge of these potential reaction sites in sorption and desorption processes. In
confined volume swelling of compacted bentonite it is observed that the decrease in particle
thickness and the corresponding increase in surface area is somewhat restricted compared to
the uninhibited particle swelling in solution. Therefore transport calculations involving
reactive surface areas based on free swelling experiments would lead to significant errors in
the estimations. On a qualitative level it is also essential to consider the scale of hydration
involved, particularly when evaluating reaction or exchange rates on the layer-, particle- or
bulk textural-scale.
Based on the result represented in table 4.4.2 the water uptake rates calculated for the
different experiments can be used to estimate the time required to saturate a bentonite barrier
of 1m thickness. As expected, materials that contain mostly Na-smectite (IBECO, MX80 and
SWy-2) have relatively low saturation velocities (between ~2 and 5E-09m/s) and therefore the
time required to attain the stable state varies between 6.5 and 24 years. In the case of the
IBECO bentonite the increased ionic strength has a notably strong effect on the saturation
time with only 1.8 years required to reach this state. This is almost 5 years less time than
when hydrated with ground water. Using finer grained monomineralic smectite separates
appears to successfully slow down the rate of water inflow. Separates of the SWy-2 Wyoming
montmorillonite hydrated with 1M NaCl required 9.5 years to reach saturation compared to
11 years when hydrated with purified water. These differences highlight the influence of clay
microstructure on the solution infiltration rate that is seen to be more pronounced in the less

Chapter 4 - Abiotic influence on smectite hydration ______________________________________________________________________________________________________________________________________________________________________________________________________________________________
95
compacted, bulk IBECO (the ~1.15 compared to ~1.37g/cm3 packed sample). The influence
of the initial packing density is as well visible in the decreased hydration velocity of the more
strongly compacted MX80 sample (1.43g/cm3). An inflow rate of 1E-09m/s yields the longest
time required to saturate the 1m barrier with 24 years. This compares to the 14.9 years needed
for the less compacted equivalent (1.35g/cm3) based on an inflow rate of 2E-09m/s. Here, the
decreased degree of compaction (5.6%) leads to the 1.6 times increase in hydration time. The
hydration velocity for the Ca-smectite based bentonites varied between 2 and 8E-08m/s and
therefore hydration of 1m material would need between 8months (0.67 years) and 1.4 years.
For these samples, the hydration behaviour is notably less sensitive to the composition of the
infiltrating natural solution. The industrially available TIXOTON would require just 8-10
months to saturate the barrier irrespective of whether hydrated in sea water or ground water.
Table 4.4.2. Calculated saturation velocities for the different clays powders used in this study. The time to saturate 1m of compacted smectite is calculated based on the distance across the reaction cell (24mm) and the time required to reach the fully hydrated state.
IBECO TIXOTON MX80 SWy-2 Nau-1 Ground
water Sea
water Ground water
Sea water
dehydrated 1.35 g/cm3
dehydrated 1.43 g/cm3
Hydrated 1.6 g/cm3
Purified water
NaCl Purified water
Saturation velocity [m/s] Interlayer water
5E-09 (6.5 y)
9E-09 (3.4 y)
8E-08 (0.14y)
5E-08 (0.69y)
5E-09 (6.9y)
2E-09 (17.7 y)
5E-09 (7 y)
6E-09 (5.3 y)
4E-09 (7.9 y)
2E-08 (1.38)
External water
5E-09 (6.5 y)
1E-08 (2.6 y)
5E-08 (0.67 y)
4E-08 (0.8 y)
3E-09 (9.5 y)
2E-09 (17.7 y)
3E-09 (9.5 y)
3E-09 (11 y)
3E-09 (11.7y)
--
Total water
5E-09 2E-08 5E-08 4E-0 2E-09 1E-09 3E-09
3E-09 3E-9 2E-08
Time to saturate 1m of compacted smectite [years] Total 6.5 1.8 0.67 0.8 14.9 24 9.5 11 9.5 1.4

96

___________________________________________________________________________
CHAPTER 5
-
BACTERIAL INFLUENCE ON
SMECTITE HYDRATION
___________________________________________________________________________

Chapter 5 - Bacterial influence on smectite hydration _______________________________________________________________________________________________________________
98
CHAPTER 5 BACTERIAL INFLUENCE ON SMECTITE HYDRATION
Abstract
This chapter presents experimental results on the interaction between smectite (NAu-1, SWy-
2 and MX80) and the facultative anaerobic, heterotrophic Shewanella putrefaciens in two
types of model conditions: i) Low solid to liquid ratio in agitated oxygenated conditions and
ii) high solid to liquid ratio in anaerobic conditions. The former was chosen to study smectite-
bacteria interaction in a solution dominated environment where the reaction rates are most
enhanced. The latter was designed to simulate the subsurface case expected in planned
underground repository waste sites. Bacterial cell counts in the low solid to liquid ratio batch
reactor experiments revealed the prolonged survival of S. putrefaciens with smectite
compared to growth in commonly used laboratory media. Compared to the sterile control, the
pH of the bacteria containing smectite-solution was found to be dependent on the growth
phase with lower pH values recorded during initial stages of the experiment (lag and
exponential phase) when protons are produced during aerobic respiration. The final death
phase showed a more alkaline pH due to reduced buffering of the cells in combination with
the release of lyses products. Variations in solution chemistry detected by ICP-OES indicated
the consummation and/or partial binding of elements, especially in the case of nontronite were
the concentration of Ca and Fe was observed to decrease. The final concentration of cations in
solution measured at the end of the experimental run showed enhanced values compared to
initial measurements which is attributed to elemental release during lyses, however Ca was
assumed to remain in the exopolymeric substance (EPS). Microscopic investigations
(confocal microscopy, ESEM and TEM coupled to EDX) showed the association of biofilm
and smectite-aggregates, the prolonged persistence of biofilm and the partial dissolution of
nontronite surrounded by Si-rich gels and EPS. In contrast, the MX80 bentonite was not seen
to be affected by bacterial activity. The presence of bacteria in compacted Na-smectite
samples hydrated under confined volume conditions was seen to enhance total water uptake
and to increase the number of water layers detected in the clay interlayer. Additional water
was seen to be stored as external water in nontronite whereas, in the case of Na-smectite, both

Chapter 5 - Bacterial influence on smectite hydration _______________________________________________________________________________________________________________
99
interlayer water and external water uptake were seen to be enhanced. The characterization of
reaction products showed the presence of sulphate and phosphate phases in the bacteria
containing nontronite sample which indicates changed redox conditions. Intensity differences
in texture preparations indicate textural changes whereas differences in the response to heat
and chemical treatment suggest the presence of organic coatings and enhanced layer charge
properties. Bacteria containing MX80 (Na-smectite) showed dissolution of accessory phases,
namely calcite and eventually pyrite, and the synchronous precipitation of lepidocrocite and
green rust. The different response to the bacterial activity is attributed to variations in
composition and texture since nontronite contains high amounts of divalent Ca that facilitates
the attachment of S. putrefaciens to the smectite surface by cationic “binding”. Fe(III) appears
to provoke the production of chelators trapping the Fe and increasing the overall degree of
mineral dissolution. The reduction of Fe also serves, additionally, as TEA (terminal electron
acceptor) under anaerobic conditions. Due to its composition, montmorillonite is less affected
by chemical alteration but it is sensitive to microstructural changes, including the aggregation
of clay particles in voids created by cells lyses. Therefore it can be concluded that the
influence of bacteria on smectite hydration in confined volume systems is highly dependent
on the precise crystal chemistry of the clay and its microstructure which results in a variety of
different alteration mechanisms. Even though the bacteria are not considered to stay alive
over a significant period of time, detrimental effects induced during initial activity have been
shown to remain for at least 1½ years and should be taken into account when considering
future applications.
Chapter 5 - Bacterial influence on smectite hydration _______________________________________________________________________________________________________________
100
5.1. Introduction
Bacteria inhabit most environments of the Earth’s surface and upper crust and are well
known to interact with mineral surfaces where nutrients often accumulate (Brown et al., 1977;
Ellwood et al., 1982; Bright &Fletcher, 1983; Van Loosdrecht et al., 1990; Lehman et al.,
2001). Due to electrostatic interactions between bacterial cells and positively charged
minerals, they are easily attached and often concentrated (Maurice &Warren, 2006). In soils,
bacteria tend to be specifically associated with clay minerals because they are, relative to the
bulk soil, enriched in ions, water, and organic matter (Theng &Orchard, 1995; Tazaki, 2006).
At the same time, ion exchange reactions, especially with smectite clays, contribute to
buffering the pH and stimulate bacterial growth (Stotzky, 1966a; Stotzky &Rem, 1966;
Stotzky, 1967).
The attachment of the (normally negatively charged) bacteria to the negatively charged
clay minerals is often aided by the formation of exopolymeric substances (EPS, Little et al.
(1997)) that are considered to change surface charge properties of clays (Maurice &Warren,
2006). EPS are also known to induce particle aggregation as well as to enhance mineral
dissolution associated with biofilm assemblages (Welch &Vandevivere, 1994; Labille et al.,
2005; Jaisi et al., 2007). Moreover certain elements, such as Si and Fe can accumulate in the
EPS and were reported to induce smectite crystallization as suggested for clays in deep sea
sediments (Ueshima &Tazaki, 2001).
Many important bacterial reactions in soils and sediments take place at the aerobic-
anaerobic interface (Roden et al., 2004) where organic matter supports large biotic O2
demands that consume the supply faster than it can be replaced (Megonigal et al., 2003). As
molecular oxygen diffuses more slowly through water than through air, anaerobic
environments are often associated with water bodies (e.g. wetlands, rivers, lakes, estuaries,
coastal marine sediments and water columns, aquifers). In the case of an underground
repository, after the system is closed, the conditions will rapidly switch from initially aerobic
to reducing conditions because oxygen will be rapidly consumed (Montes-Hernandez et al.,
2005a). Therefore it is essential to study bacteria related reactions both in presence and
absence of oxygen.
The bacteria Shewanella putrefaciens is a facultative anaerobe and can respire under both
conditions. In the absence of oxygen, they use other electron acceptors to gain energy, such as
Fe(III). This species is insoluble in pure water at neutral pH and, as a consequence, the
bacteria are forced to use the Fe(III) that is present in Fe-bearing minerals such as ferrihydrite,

Chapter 5 - Bacterial influence on smectite hydration _______________________________________________________________________________________________________________
101
hematite, goethite and clay minerals (Stucki et al., 1987; Roden &Zachara, 1996; Dong et al.,
2000; Zachara et al., 2002; Dong et al., 2003b; Bonneville et al., 2004; Stucki, 2006)
The dissimilatory reduction of Fe(III) in smectites, especially in nontronite, has been
shown to drastically alter the properties of the clay. Kim et al. (2004) observed, for example,
that in batch experiments Shewanella sp. triggered the transformation of smectite to illite. The
reduction of the Fe(III) in the octahedral sites of the smectite lattice led to a greater charge
discrepancy and to a net increase in negative layer charge. This charge subsequently collapsed
the interlayer space, reduced the thickness of the hydrated interlayer and increased cation (K+)
fixation (Kostka et al., 1999; Stucki et al., 2000; 2003; Kim et al., 2004; Komadel et al., 2006;
Stucki, 2006).
Recent studies on Fe-smectites also showed that bacterial modifications can include
partial dissolution of the clay particles (Kostka et al., 1999; Dong et al., 2003a). It is
suggested that either Fe(III) reduction causes a charge imbalance in smectite that can trigger
mineral dissolution or bacterially produced substances, such as organic acids and chelators,
dissolve the mineral prior to Fe-reduction (O'Reilly et al., 2006). In the latter case, Fe(III)
would be released into solution and become accessible for dissimilatory microbial reduction.
Here, the production of specific iron chelators (siderophores) is a common process in order to
make iron more bioavailable (Neilands, 1989; Gram, 1994; Hersman et al., 2000).
In aerobic conditions, bacteria do not need to reduce metals for it is energetically much
more efficient to reduce oxygen (Madigan et al., 2003). Based on investigations of polluted
aquifers, Bennett and coworkers (1996) proposed that microbes selectively dissolve minerals
based on their nutrient requirements. Laboratory experiments, showed that P- and Fe-bearing
silicates and glasses are colonized and dissolved when the contained elements act as limiting
nutrients (Rogers et al., 1998; Rogers &Bennett, 2004). In the case of smectites, it is their
unique ability to adsorb or exchange cations that make them a potentially rich nutrient source
for bacteria (Stotzky, 1966a; , 1967).
A large proportion of clay-bacterial interactions take place under confined volume
conditions as is the case in soils or engineered systems like nuclear waste repositories. In
Chapter 4, it was shown that the hydration behaviour of smectites under confined volume
conditions is notably different from the free swelling system. However, the effects that
bacteria have under such conditions have not been well studied yet. Any consumption of
cations or changes in layer charge properties could have strong effects on the hydration
capacity of swelling clays.
Chapter 5 - Bacterial influence on smectite hydration _______________________________________________________________________________________________________________
102
In this study, the experiments where therefore designed to quantify the impact of the
bacteria Shewanella putrefaciens on the swelling behaviour of two types of smectites,
nontronite and montmorillonite, (SWy-2 and MX80) in two types of experiments: i) Agitated
batch experiments with low solid to liquid ratio in oxygenated conditions and ii) the
subsurface environment with a high solid to liquid ratio, diffusion controlled transport, and
anaerobic conditions. The latter was again constructed to serve as a laboratory analogue for
the underground storage of nuclear waste (Chapter 4). In situ X-ray diffraction monitoring
techniques of reaction processes combined with mineralogical and geochemical investigation
of the reaction products reveal the importance of bacteria activity in swelling clay systems.
5.2. Analytical procedure
5.2.1. Agitated batch experiments
Batch experiments of smectites in solution were designed to quantify the impact of the
bacteria Shewanella putrefaciens on both pure clay separates (monomineralic) and bentonite
mixtures (polymineralic). Nontronite (NAu-1) and montmorillonite were prepared as purified
separates (SWy-2) and a MX80-bentonite powder was selected from an industrial source. The
clay was first pre-sterilized in the oven at 110°C for 3h and then dispersed in sterilized water
(sterilized by autoclaving at 121°C for 15 min). A portion of sterilized clay (0.01 and
0.04g/ml) was then incubated with washed bacteria cultures prepared with varying cell
densities (see table 5.3.1). Simultaneously abiotic control experiments were conducted for
comparison. Clay-bacterial suspensions were continuously mixed with an agitator or magnetic
stirrer. At selected intervals samples were extracted for ICP-OES analysis using a sterile
syringe and filtered using a 0.2µm polycarbonate filter. The extracted samples where then
acidified using concentrated HNO3 and stored in a dark cool place prior to analysis. The pH
was controlled using a pH-meter on pre-sampled aliquots of the suspensions in order to
prevent contamination. Bacterial density was determined by viable cell counts (Chapter 3) in
order to monitor their response to the smectitic material. Bacterial solutions were examined
by ESEM, which allowed direct imaging of the material in the hydrated state. Samples were
pipetted onto self-adhesive conductive carbon stickers that were placed on the aluminum
SEM sample holder. This procedure was done as rapidly as possible only minutes before
placing into the microscope. The chamber pressure was set between 5.9-6 torr (0.0078-0.008

Chapter 5 - Bacterial influence on smectite hydration _______________________________________________________________________________________________________________
103
bar) and temperatures between 8°C and 22°C resulting in a relative humidity between 55 and
75%.
In order to study the composition of the bacteria and the nature of clay-bacteria interaction
at the small scale, transmission electron microscopy (TEM) was undertaken coupled with
energy dispersive X-ray spectroscopy (EDX). For study, dried dispersed samples were
prepared by directly pipetting dilute suspensions onto copper grids and then left to dry under
room conditions. For investigation of the solid reaction-cell samples, the material was first
dispersed in de-ionized water and then diluted (several 10 fold dilutions). Suspended clay
samples extracted from the batch experiments were diluted 10 to 100 times. Quantifications of
microchemical analysis were done without correction for carbon introduced during coating of
the grid. Textural (oriented) clay samples were also prepared from the batch control
experiments for XRD characterization of mineralogical changes following clay-bacteria
interaction.
5.2.2. Confined volume experiments using reaction-cell XRD
In situ reaction-cell XRD was applied to monitor the influence of S. putrefaciens on clay
under confined volume conditions. Powdered material (~ 5g) of nontronite and
montmorillonite containing MX80-bentonite was added to 0.6-0.8ml of bacteria containing
water or a culture medium (density 108) and mixed with a sterile spatula. The clay-bacterial
mixture was then loaded into the reaction-cell and pressed in order to control porosity (see
appendix for procedure). As an internal standard for X-ray diffraction, delaminated kaolinite
was added to the upper surface and worked into the sample powder using a razor blade. Once
sealed with a capton foil, the reaction-cells were measured by XRD in order to obtain a
reference profile representing zero reaction time. During hydration the frequency of
measurements was adapted to the reaction rate but kept to a minimum to limit radiation
damage of bacteria. After each irradiation the chambers were resealed by the pressure cap and
the experimental solution reattached to allow percolation from the Teflon© bottle located at
the top of the chamber (Fig. 5.2.1). Anaerobic conditions were controlled applying the GEN-
bag anaerobic system provided by BioMerieux©, which consists of generators that produce
CO2.

Chapter 5 - Bacterial influence on smectite hydration _______________________________________________________________________________________________________________
104
reaction-cell(teflon)
O-ring
capton foil
screws
teflon bottle
Fig. 5.2.1. a) Schematic representation of the reaction-cell device(without upper sealing plate). b) Set up for flow-through experimentswith solution bottles attached. At any stage of the hydration experiment,the reaction-cell in a) can be placed in the X-ray diffractometer formeasurement.
a) b)
4cm 4cm
5.2.3. Analyses of reaction products
After completion of the experiment runs, the hydrated reaction products were extracted
from the reaction-cell device and investigated for changes in composition and mineral
content. For solution chemistry measurements, between 0.2-0.5g of the clay paste were
removed from the freshly opened reaction-cells, dispersed and diluted 20 times in Millipore©
water (e.g. 0.2g of paste was diluted with 4ml of water to give a concentration of 50mg clay
per ml solution). The samples were homogenized using an ultra sonic bath (2 times for 15
minutes) and allowed to sediment for 24h. After repeated ultra sonic treatment, the samples
were centrifuged (3500 rpm for 15 minutes), filtrated (< 0.22µm) and acidified using
concentrated HNO3. The same procedure was applied for HCl extraction where, instead of
water, 1N HCl was used as the leaching agent. Samples for Fe(II) measurements were
dissolved in 0.5N HCl (0.5N HCl extraction method) and incubated for 12 hours to extract
Fe(II). Solutions were filtered and then analyzed by ICP-OES.
Viable cell counting (Chapter 3) was applied on clay samples extracted from the reaction-
cell by suspending known amounts of solids in corresponding amounts of water (e.g. 0.3g and
3ml) prior to serial dilutions and plate testing. TEM in combination with EDX was applied on
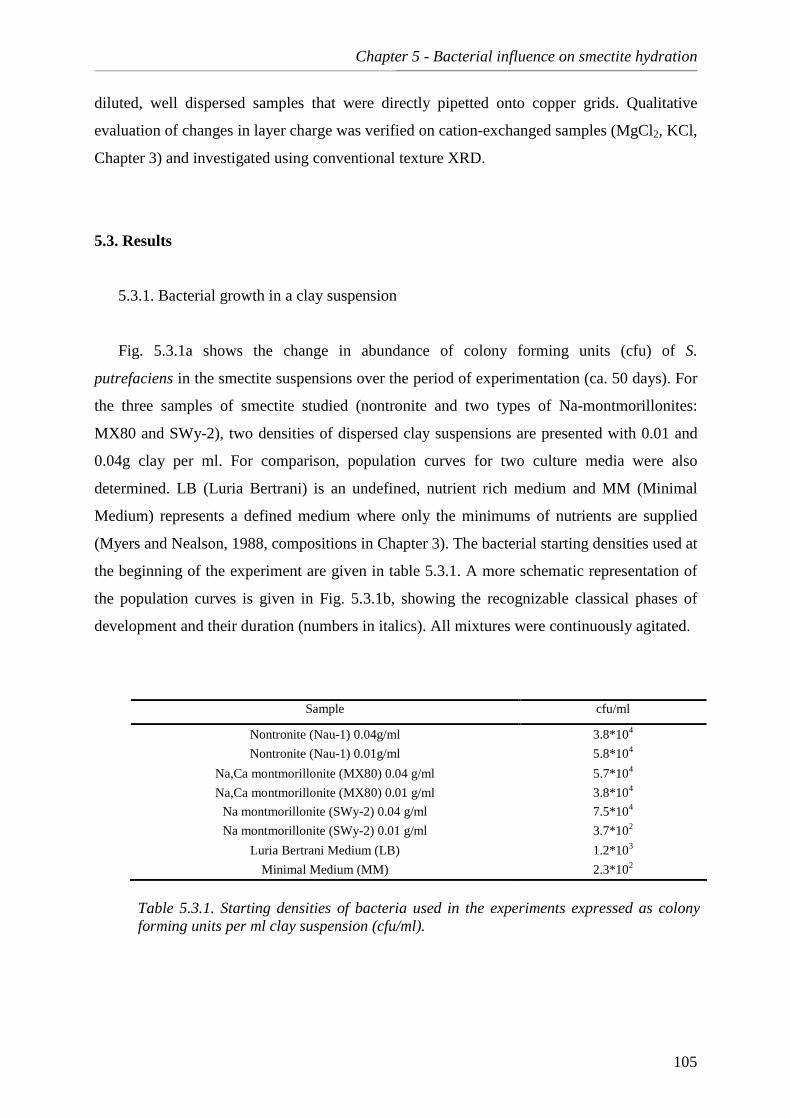
Chapter 5 - Bacterial influence on smectite hydration _______________________________________________________________________________________________________________
105
diluted, well dispersed samples that were directly pipetted onto copper grids. Qualitative
evaluation of changes in layer charge was verified on cation-exchanged samples (MgCl2, KCl,
Chapter 3) and investigated using conventional texture XRD.
5.3. Results
5.3.1. Bacterial growth in a clay suspension
Fig. 5.3.1a shows the change in abundance of colony forming units (cfu) of S.
putrefaciens in the smectite suspensions over the period of experimentation (ca. 50 days). For
the three samples of smectite studied (nontronite and two types of Na-montmorillonites:
MX80 and SWy-2), two densities of dispersed clay suspensions are presented with 0.01 and
0.04g clay per ml. For comparison, population curves for two culture media were also
determined. LB (Luria Bertrani) is an undefined, nutrient rich medium and MM (Minimal
Medium) represents a defined medium where only the minimums of nutrients are supplied
(Myers and Nealson, 1988, compositions in Chapter 3). The bacterial starting densities used at
the beginning of the experiment are given in table 5.3.1. A more schematic representation of
the population curves is given in Fig. 5.3.1b, showing the recognizable classical phases of
development and their duration (numbers in italics). All mixtures were continuously agitated.
Table 5.3.1. Starting densities of bacteria used in the experiments expressed as colony forming units per ml clay suspension (cfu/ml).
Sample cfu/ml
Nontronite (Nau-1) 0.04g/ml 3.8*104
Nontronite (Nau-1) 0.01g/ml 5.8*104
Na,Ca montmorillonite (MX80) 0.04 g/ml 5.7*104
Na,Ca montmorillonite (MX80) 0.01 g/ml 3.8*104
Na montmorillonite (SWy-2) 0.04 g/ml 7.5*104
Na montmorillonite (SWy-2) 0.01 g/ml 3.7*102
Luria Bertrani Medium (LB) 1.2*103
Minimal Medium (MM) 2.3*102

Chapter 5 - Bacterial influence on smectite hydration _______________________________________________________________________________________________________________
106
LB MM
Nontronite
5.0E+06
1.0E+07
1.5E+07
2.0E+07
2.5E+07
0 10 20 30 40 500
NAu-1 0.01g/ml
NAu-1 0.04g/ml
MX80 0.01g/ml
MX80 0.04g/ml
SWy-2 0.01g/ml
SWy-2 0.04g/ml
136
236
exponen-tial
lag
stationary
death
MM MontmorilloniteNontronite
time (hours)
b)
68 164 ~400~300214
24
96
68
500600
~900
188
Fig. 5.3.1. a) Growth curves of S. putrefaciens in culture media (solid black lines, LB indicatesLuria Bertrani medium and MM the minimal medium defined by Myers & Nealson (1988)) andsmectite suspensions of two different mineral concentrations. The light grey background indicatesthe population span for the nontronite (NAu-1) culture and the dark grey background for the twomontmorillonite rich samples MX80 and SWy-2. Bacterial populations are measured as colonyforming units per ml of suspension (cfu/ml) plotted against reaction time (days). b) Schematicrepresentation of the growth curves showing the main differences in the duration of recognizedphases (numbers in italics).
Montmorillonite
time (days)
a)
The shape of the population curves is considered to be typical of bacterial growth in a
batch culture where nutrients are not replaced and waste products are not removed. The
curves show four more or less distinct phases known to characterize a typical growth cycle
(Madigan et al., 2003). An initial lag phase is characterized by a low growth rate and is
normally present if the bacteria have to adapt to new conditions. During this time, enzymes
that are required to synthesize essential metabolites are produced. Following the initial lag,
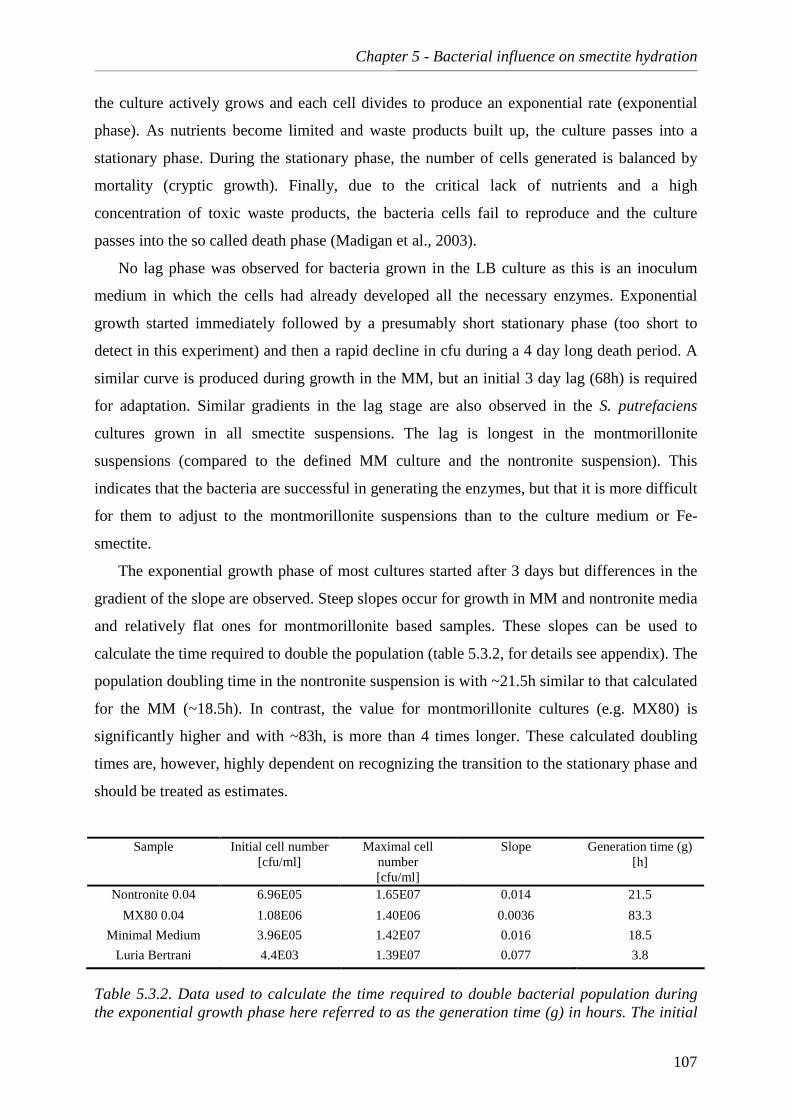
Chapter 5 - Bacterial influence on smectite hydration _______________________________________________________________________________________________________________
107
the culture actively grows and each cell divides to produce an exponential rate (exponential
phase). As nutrients become limited and waste products built up, the culture passes into a
stationary phase. During the stationary phase, the number of cells generated is balanced by
mortality (cryptic growth). Finally, due to the critical lack of nutrients and a high
concentration of toxic waste products, the bacteria cells fail to reproduce and the culture
passes into the so called death phase (Madigan et al., 2003).
No lag phase was observed for bacteria grown in the LB culture as this is an inoculum
medium in which the cells had already developed all the necessary enzymes. Exponential
growth started immediately followed by a presumably short stationary phase (too short to
detect in this experiment) and then a rapid decline in cfu during a 4 day long death period. A
similar curve is produced during growth in the MM, but an initial 3 day lag (68h) is required
for adaptation. Similar gradients in the lag stage are also observed in the S. putrefaciens
cultures grown in all smectite suspensions. The lag is longest in the montmorillonite
suspensions (compared to the defined MM culture and the nontronite suspension). This
indicates that the bacteria are successful in generating the enzymes, but that it is more difficult
for them to adjust to the montmorillonite suspensions than to the culture medium or Fe-
smectite.
The exponential growth phase of most cultures started after 3 days but differences in the
gradient of the slope are observed. Steep slopes occur for growth in MM and nontronite media
and relatively flat ones for montmorillonite based samples. These slopes can be used to
calculate the time required to double the population (table 5.3.2, for details see appendix). The
population doubling time in the nontronite suspension is with ~21.5h similar to that calculated
for the MM (~18.5h). In contrast, the value for montmorillonite cultures (e.g. MX80) is
significantly higher and with ~83h, is more than 4 times longer. These calculated doubling
times are, however, highly dependent on recognizing the transition to the stationary phase and
should be treated as estimates.
Sample Initial cell number [cfu/ml]
Maximal cell number [cfu/ml]
Slope Generation time (g) [h]
Nontronite 0.04 6.96E05 1.65E07 0.014 21.5
MX80 0.04 1.08E06 1.40E06 0.0036 83.3
Minimal Medium 3.96E05 1.42E07 0.016 18.5
Luria Bertrani 4.4E03 1.39E07 0.077 3.8
Table 5.3.2. Data used to calculate the time required to double bacterial population during the exponential growth phase here referred to as the generation time (g) in hours. The initial

Chapter 5 - Bacterial influence on smectite hydration _______________________________________________________________________________________________________________
108
and final cell numbers correspond to the beginning (68h) and end (164h, see Fig. 5.3.1.b) of the exponential phase and were used to calculate the slope.
Compared to LB medium it takes 5 times longer for the culture to double its population in
the MM culture or nontronite solution. Bacterial growth in the Na-montmorillonite
suspensions takes even more time, with generation times that are around 20 times longer
compared to that observed in LB medium. As the conditions of incubation were the same for
all samples, it is likely that the concentration of nutrients is the major factor limiting the
growth rates. One possible reason for the slower increase in cfu in the case of montmorillonite
is the extensive osmotic swelling that occurs in these gel-like suspensions (see Chapter 2).
Electrostatic repulsions within this gel structure restrict access to the montmorillonite and thus
to nutrients.
The major differences between the bacterial growth curves for smectite suspensions and
culture media are the character and duration of stationary and death phases. The stationary
stage was estimated to begin after 164h (1 week after the experiment started) for all clay
suspensions and to finish after ~300h (~13 days) for the montmorillonite and after ~400h (~17
days) for the nontronite samples (Fig 5.3.1.b). Both stationary and death phases for clay
suspensions are significantly longer than observed in the culture media. The length of the
stationary phase observed within media cannot be accurately determined but the data indicates
that it must be short (maximum at 24h). The death phase is accomplished within 6 days for
LB medium and within 10 days for MM. In contrast, the death phase in smectite suspensions
is much longer in duration with over 500h for nontronite and 600h for montmorillonite
suspensions. Compared to the MM, this is 20 to 25 times longer and could be due to two
major factors: i) a slower release of nutrients by the clay due to gradual dissolution and ii)
simultaneous sorption of toxic waste products produced by the bacteria, especially during the
death phase.
Generally, the numbers of cfu present in the various mineral cultures vary with suspension
density. In the case of monomineralic samples (nontronite and SWy-2 montmorillonite), the
number of cfu is enhanced when the suspension is more diluted. Based on maximal values for
cfu, the dilute nontronite sample supports twice the number of bacteria and the dilute SWy-2
sample three times the population. Most likely, this is due to the enhanced viscosity of the
more concentrated suspensions that decreases the bacterial mobility. In contrast, the number
of cfu developed in the MX80 bentonite is enhanced by about two times when the solution is
denser probanly because of the additional supply of accessory minerals that serve as nutrients.

Chapter 5 - Bacterial influence on smectite hydration _______________________________________________________________________________________________________________
109
The overall supply of nutrients that are derived from the smectite particles depends on the
mineral composition, the mechanism of dissolution and the quantity released into solution.
Rapid exchange of interlayer cations, predominantly Ca and Na, is expected and their
availability is dependent on solution chemistry and CEC. Stoichiometrical dissolution of
smectites has only been reported for very acidic pH values (Metz et al., 2005) but these
conditions do not apply to the experiments conducted in this study. However, in order to
compare the relative cation contents of the clays with the nutrient media, the dissolved
contents are displayed in table 5.3.3 assuming 100% dissolution. Major differences between
the clay solution and the media are the potentially higher concentrations of virtually all
cations in the smectites (Si, Al, Fe, Mg, Ca and Na), except K, which is enhanced in the
medium.
Element [% oxide]
Nontronite (NAu-1)
[g/l]
Montmorillonite SWy-2 [g/l]
Montmorillonite MX80 [g/l]
Minimal Medium [g/l]
Luria Bertrani Medium [g/]
Si 2.49 2.94 2.69 0.0001 0.0019
Al 0.54 1.04 0.99 0 0.0001
Fe 2.39 0.25 0.42 0 0.0004
Mg 0 0.18 0.13 0.0045 0.002
Ca 0.24 0.12 0.10 0.0096 0.003
Na 0.01 0.11 0.16 0.0215 -
K 0 0.04 0.05 0.1940 0.30
P 0 0 0.01 0.3620 0.13
Table 5.3.3. The amount of cationic nutrients available in g/l for the different smectites if particles were completely dissolved (100%).
During the death phase, the sorption capacity of the clays is of special importance and is
basically influenced by two important parameters: the specific surface area and the cation
exchange capacity. The montmorillonites studied here have a specific surface area that is
almost 3 times lower (about 30 m2/g, see 3.1 Chapter 3) than the nontronite sample (~84m2/g)
and, thus, have notably lower sorption capacities. However, an increase in surface area does
occur during the osmotic swelling of Na-montmorillonite particles as the layers loose their
coherence during layer expansion. The cation exchange capacities of all samples are similar at
ca. 70 meq/100g (Chapter 3).

Chapter 5 - Bacterial influence on smectite hydration _______________________________________________________________________________________________________________
110
5.3.2. Effects of bacterial action on smectite solution chemistry
The solution chemistry of key growth experiments was controlled at selected time
intervals and both H+ activity (pH) and the concentration of the main cations (Al3+, Ca2+, Fetot,
K+, Mg 2+, Na+, Si4+) measured. Smectite suspensions (density of 0.01g clay per ml distilled
water) were inoculated with washed bacteria (density 5E07 cfu/ml) giving initial bacteria
densities in cfu/ml as follows: SWy-2 montmorillonite 2.12E05, MX80 Montmorillonite
3.55E05, and NAu-1 nontronite: 1.78E05 cfu/ml. If not indicated otherwise, all experiments
were conducted in the presence of oxygen.
5.3.2.1. pH variations
Fig. 5.3.2 provides an overview of the pH evolution over the period of experimentation
for all unbuffered clay suspensions with and without bacteria. The initial smectite suspensions
have slightly alkaline pH values ranging from 9.8 to 8.12 that shift to a narrower range of 9.5
to 8.01 as they approach a stable state after 27 days. The montmorillonite suspensions have
generally higher pH values than the nontronite which might be due to proton sorption and
increased buffering of the montmorillonite clays (Bauer et al., 2001; Hofmann et al., 2004). In
all samples, the bacteria containing suspensions have, from the beginning, lower pH values
than the sterile controls. This probably reflects the introduction of acids, together with the
bacteria present in the growth medium, which were not removed during washings or were
released by the bacteria after the washings.
Fig. 5.3.2. Changes in pH over time for the different smectite suspensions(density 0.01g/ml). Montmorillonite suspensions are highlighted with a darkbackground, nontronite suspension with a light grey one. Filled symbolsindicate the presence of bacteria, empty ones present sterile controls.
Nontronite
Montmorillonite
5 10 15 20 25 30time (days)
7.50
8.00
8.50
9.00
9.50
10.00
0
NAu-1 bacteria
NAu-1 sterile
MX80 bacteria
MX80 sterile
SWy-2 bacteria
SWy-2 sterile

Chapter 5 - Bacterial influence on smectite hydration _______________________________________________________________________________________________________________
111
Fig 5.3.3.a-c shows the pH evolution separately for the individual samples, each with the
corresponding bacterial growth curve. For both the bacteria-containing and the sterile
samples, the initial pH values are higher than the final measurements. In this pH range
(pH>6), the edges are negatively charged and are available for cation exchange reactions
(Lagaly, 1993). The coupled deprotonation (release of H+) at the edges of the smectite
particles thus leads to a relative decrease in pH.
Fig. 5.3.3. Changes in pH over time for a-b) montmorillonite suspensions (aerobic), c)the nontronite (NAu-1) suspension (aerobic) and d) the montmorillonite (MX80) suspension(anaerobic). Filled symbols with solid lines indicate the evolution of pH values forsamples containing bacteria; the empty symbols with dotted lines represent sterile controls.The corresponding growth curves are presented as dashed lines, and the recognizedphases marked with vertical arrows: A-lag, B-exponential, C- stationary and D-death.
a) Montmorillonite (SWy-2)
7.5
8.0
8.5
9.0
9.5
10.0
0 10 20 30t ime (days)
0E+00
4E+06
8E+06
A B C D
pH with bacteriapH sterilegrowth curve
c) Nontronite (NAu-1)
7.5
8.0
8.5
9.0
9.5
0 10 20 30time (days)
DCB 0E+00
2E+06
4E+06
7.0
growth curve
pH with bacteriapH sterile
b) Montmorillonite (MX80)
0E+00
6
7
8
9
10
5
11
0 10 20 30time (days)
A B C+D
4E+06
2E+06
growth curve
pH with bacteriapH sterile
d) Montmorillonite (MX80)-anaerobic
0E+00
2E+06
4E+06
6
7
8
9
10
5
11
0 10 20 30time (days)
A B C+D
6E+06pH with bacteriaanaerobicgrowth curveanaerobic
In case of the SWy-2 montmorillonite (Fig 5.3.3.a), the sterile control already shows a
higher pH value at the initial stage than the bacteria containing sample (9.53 as opposed to
9.04). This is followed by a successive decrease of the pH during the first 6 days. The pH of
the sterile control shows a further decrease after 17 days, reaching the lowest value of 7.93,

Chapter 5 - Bacterial influence on smectite hydration _______________________________________________________________________________________________________________
112
followed by an increase to 8.4 after 27 days. Successive measurements (not shown) indicate
stable state conditions were reached with no further changes in pH. In contrast, the pH of the
bacteria-containing samples shows a consistent increase after ~ 6 days and these are notably
higher values than the sterile control. This period corresponds to a large portion of the
exponential growth phase (B), the stationary phase (C) and the initial stages of the death
phase (D).
Both the bacteria-containing and the bacteria free MX80 montmorillonite suspensions
show the same trend of rapidly decreasing pH during the first 2 days. The pH decrease to 7.9
in the bacteria-containing sample is the lowest observed during experimentation with a
decrease of 19% as opposed to 13% change in the abiotic control. This corresponds to the
beginning of the exponential growth phase (indicated as B in Fig. 5.3.3.b). This phase is
accomplished after ca. 7 days and the death phases start almost immediately without a
recognizable stationary phase. At the end of the death phase (after already 10 days), the pH
stabilizes. This rapid decrease of bacteria is notably different from that observed in the system
shown in Fig 5.3.1a and can be attributed to differences in the degree of agitation.
In the nontronite sample (Fig 5.3.3.c), the presence of bacteria results in a 5% lower pH
value compared to the sterile control (8.1 as opposed to 8.5 for the abiotic sample). The
lowest pH values were measured after 2 days with 7.74 for the sterile and 7.68 for the biotic
sample. Unlike for the montmorillonite samples, the pH of the nontronite suspension does not
correspond with the exponential growth phase (B) and the abiotic control shows the same
trend. A difference between the sterile and biotic sample is only visible after 17 days when a
relative pH increase occurring in the bacteria-containing sample is observed. During this time,
the culture is in the final stage of the death phase (D).
The influence of anaerobic conditions on the pH is shown in Fig 5.3.3d for the MX80
montmorillonite sample. The used anaerobic bags produce CO2 and, according to the
equilibrium with the pCO2, the pH is lowered producing more acidic suspensions (as low as
6.36 - 6.60). At the end of experimentation, near neutral conditions (6.95) are approached.
This corresponds to a relative decrease of 32% compared to the starting pH (pH 9.7) within
the first 2 days. The growth curve in the anaerobic example follows the same trend as in the
aerobic suspension but the influence of the bacteria on the pH is masked by the CO2 produced
by the bags.
The relative differences in pH (expressed in %) between bacteria-containing experiments
and the sterile controls are presented in Fig. 5.3.4. Negative values indicate a relatively lower
pH and positive values reflect a higher pH compared to the sterile control. In this plot, the

Chapter 5 - Bacterial influence on smectite hydration _______________________________________________________________________________________________________________
113
zero line reflects no difference between bacterial and abiotic experiments. All bacteria
containing samples were characterized by a relatively more acidic pH at the beginning of
experiments (increase of H+) and a more alkaline state during the intermediate to final stages
of experimentation (decrease of H+). The enhanced H+ concentration observed during initial
phases corresponds with the lag and exponential growth phase during which the bacteria are
actively adapting and the production of biomass is highest. Here, the production of carbonic
acid formed during respiration (or in case of the anaerobic experiments the artificial
production of CO2) contributes to a H+ production according to the reaction
CO2 (g) + H2O � HCO3- +H+
Additionally, the production of organic acids (such as oxalate, formate and propionate)
also leads to a decrease in pH as reported for soils, sediments and aquifers (Barker et al.,
1997).
Fig. 5.3.4. Relative difference in the pH of bacteria containing smectite suspensions fromthe abiotic control expressed as a %. The phases of growth (A-D) are indicated as shownin Fig 5.3.2. Abbreviations for the growth phases: A-lag, B-exponential, C-stationaryand D-death.
-15
-10
-5
0
5
10
15
10 20 30
time (days)
A C DB
BA C D
DBA
SWY-2
MX80
NAu-1
H+ decrease
H+ increase
Although the pH for all solutions follows the same trend, being less alkaline at the
beginning and more alkaline during the final stages, there are notable differences in the
magnitude of bacterially induced pH differences between the different clays (Fig. 5.3.4). A
relatively low deviation from the sterile control is visible for the nontronite that is quickly
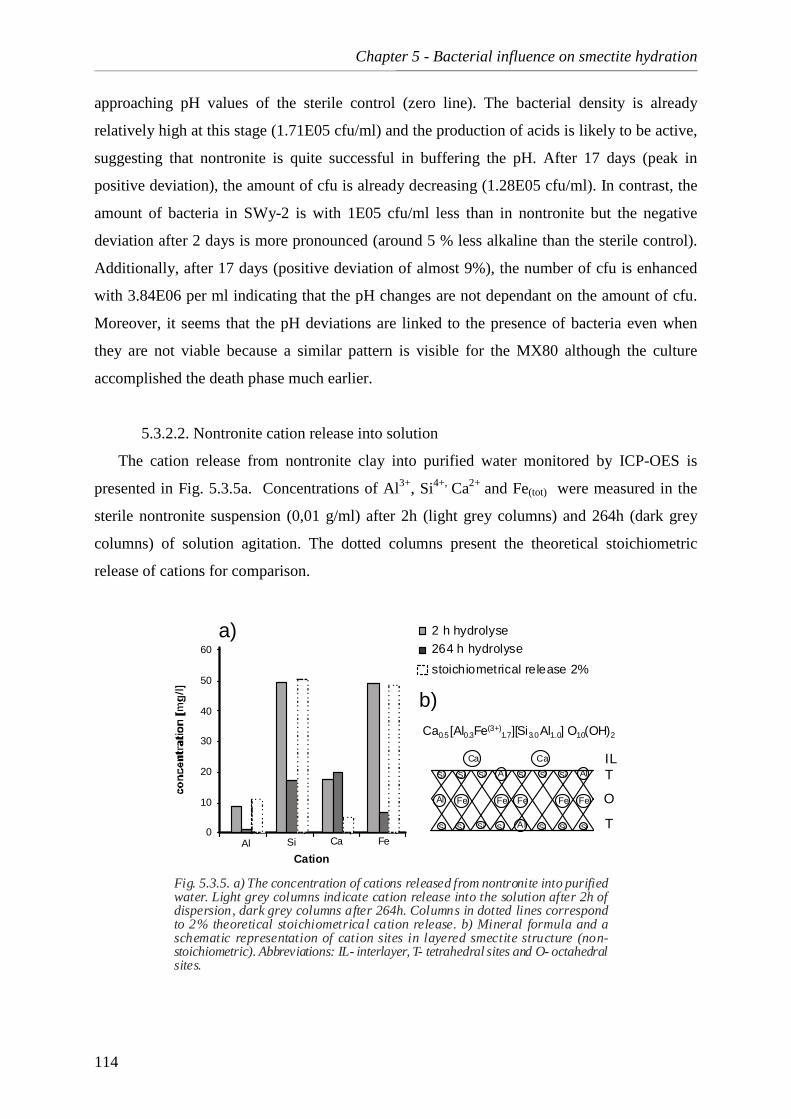
Chapter 5 - Bacterial influence on smectite hydration _______________________________________________________________________________________________________________
114
approaching pH values of the sterile control (zero line). The bacterial density is already
relatively high at this stage (1.71E05 cfu/ml) and the production of acids is likely to be active,
suggesting that nontronite is quite successful in buffering the pH. After 17 days (peak in
positive deviation), the amount of cfu is already decreasing (1.28E05 cfu/ml). In contrast, the
amount of bacteria in SWy-2 is with 1E05 cfu/ml less than in nontronite but the negative
deviation after 2 days is more pronounced (around 5 % less alkaline than the sterile control).
Additionally, after 17 days (positive deviation of almost 9%), the number of cfu is enhanced
with 3.84E06 per ml indicating that the pH changes are not dependant on the amount of cfu.
Moreover, it seems that the pH deviations are linked to the presence of bacteria even when
they are not viable because a similar pattern is visible for the MX80 although the culture
accomplished the death phase much earlier.
5.3.2.2. Nontronite cation release into solution
The cation release from nontronite clay into purified water monitored by ICP-OES is
presented in Fig. 5.3.5a. Concentrations of Al3+, Si4+, Ca2+ and Fe(tot) were measured in the
sterile nontronite suspension (0,01 g/ml) after 2h (light grey columns) and 264h (dark grey
columns) of solution agitation. The dotted columns present the theoretical stoichiometric
release of cations for comparison.
Fig. 5.3.5. a) The concentration of cations released from nontronite into purifiedwater. Light grey columns indicate cation release into the solution after 2h ofdispersion, dark grey columns after 264h. Columns in dotted lines correspondto 2% theoretical stoichiometrical cation release. b) Mineral formula and aschematic representation of cation sites in layered smectite structure (non-stoichiometric). Abbreviations: IL- interlayer, T- tetrahedral sites and O- octahedralsites.
0
10
20
30
40
50
60
Al FeSi
Cation
Ca
b)
a)
Ca0.5 [Al0.3Fe(3+)1.7][Si3.0 Al1.0] O10(OH)2
Si Si Si SiSi
SiSiSiSiSiSi
Si
Si
ILT
O
T
Al
Al
Al Al
Fe FeFeFeFe
Ca Ca
2 h hydrolyse
264 h hydrolyse
stoichiometrical release 2%

Chapter 5 - Bacterial influence on smectite hydration _______________________________________________________________________________________________________________
115
The cation concentrations after 2h show some release of Al, Fe and Si that corresponds
well to the stoichiometrical values indicating that both the tetrahedral and octahedral layers of
some small nontronite grains dissolve (ca 2%) (Fig. 5.3.5b). In contrast, the concentration of
the interlayer Ca2+ is ~3 times higher than the stoichiometric concentration, which can be
attributed to rapid exchange with K+ or H3O+ ions. The Ca concentration remained high after
264h (11 days) and corresponds to 8 % exchange of the total of exchangeable Ca (assuming
this is the only interlayer cation). The concentrations of Al, Si and Fe in the suspension show
a general decrease after the 264h period with respect to the first measurement. These
decreases are (expressed in mg/l) Al3+: 8.5 to 1.1 (~8 times less), Si4+: 48.5 to 16.8 (~3 times
less) and Fe(tot): 48.3 to 6.6 (~7 times less). The Si:Al ratio in solution increases from around
5 (stoichiometric) to 15 as the relative amount of silica in solution increases with respect to
Al. Higher amounts of Si relative to Al would indicate the preferred dissolution of tetrahedral
edges sites (Bosbach et al., 2000; Bickmore et al., 2001) but could be, as well, due to Al
precipitation from solution (values correspond to less than 1 % of nontronite dissolution). The
iron released from the octahedral sites is here mostly trivalent (divalent is rapidly oxidized)
and therefore does not stay in solution at pH 8 but is expected to precipitate as Fe(III) oxides.
The release of cations into bacteria containing nontronite-bearing solution (bacterial
density 1.78E05cfu/ml) is plotted in Fig. 5.3.6. Filled columns indicate the measured
concentrations and empty columns represent the differences (depletions) relative to the sterile
control (shown in Fig 5.3.5). The first measurements, after 2h, show some Si4+, Ca2+ and
Fe(tot) dissolved in solution and virtually no Al3+ (light grey columns). After 264h, also no Al
is detectable, whereas the concentration of Si4+ is slightly enhanced. Ca remains constant and
Fe(tot) shows a slight decrease. During this experiment, all the measured cations in solution
have a lower concentration than the abiotic control indicating bacterial induced depletions of
all measured elements. The largest differences are seen after just 2h of mixing: 12 times less
Al (-7.8mg/l), 5 times less Si (-38.8mg/l) and 12 times less Fe (-44.4 mg/l) compared to the
abiotic control. Values for Ca are around 2 times lower after 2h (-9.9mg/l) and around 2.5
times lower after 264h (-12.3mg/l). The concentrations of Al and Si after 264h approach that
of the sterile control whereas, in the case of Fe, the differences are maintained with 4.6mg/l or
3 times less Fe in the bacteria containing samples.
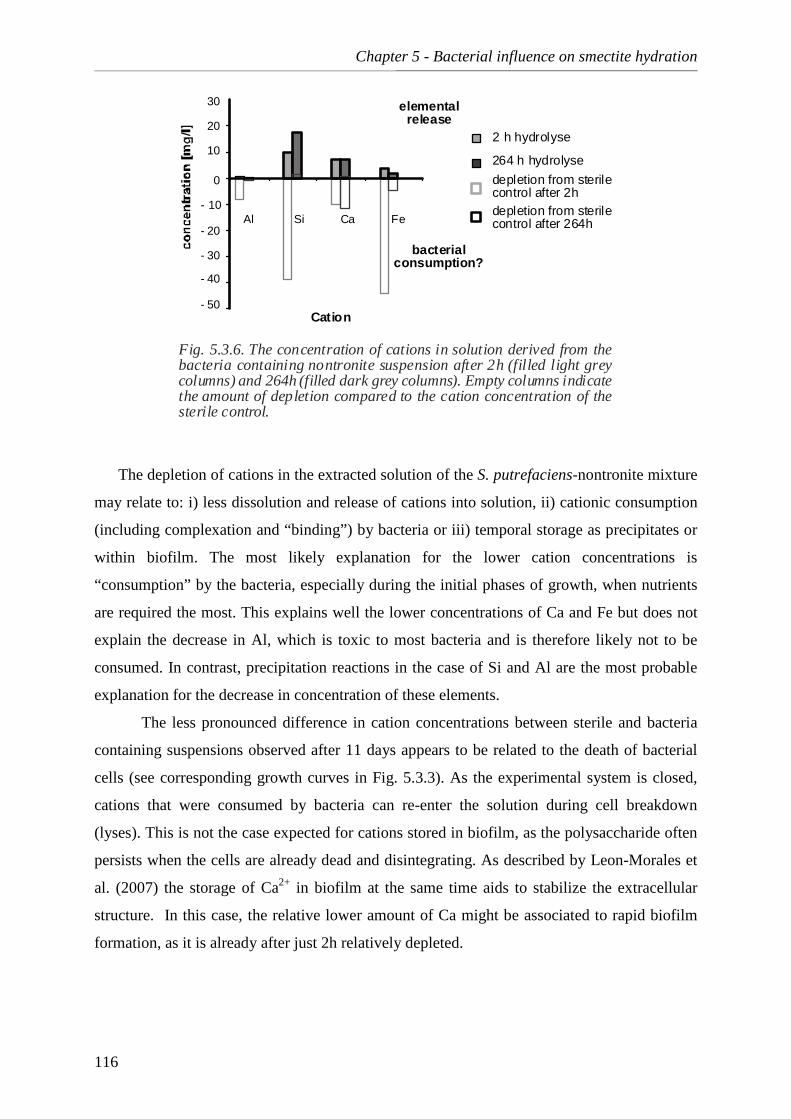
Chapter 5 - Bacterial influence on smectite hydration _______________________________________________________________________________________________________________
116
Fig. 5.3.6. The concentration of cations in solution derived from thebacteria containing nontronite suspension after 2h (filled light greycolumns) and 264h (filled dark grey columns). Empty columns indicatethe amount of depletion compared to the cation concentration of thesterile control.
0
10
20
30
- 40
- 50
- 10
- 20
- 30
Al FeSi Ca
Cation
264 h hydrolyse
2 h hydrolyse
depletion from sterilecontrol after 2hdepletion from sterilecontrol after 264h
elementalrelease
bacterialconsumption?
The depletion of cations in the extracted solution of the S. putrefaciens-nontronite mixture
may relate to: i) less dissolution and release of cations into solution, ii) cationic consumption
(including complexation and “binding”) by bacteria or iii) temporal storage as precipitates or
within biofilm. The most likely explanation for the lower cation concentrations is
“consumption” by the bacteria, especially during the initial phases of growth, when nutrients
are required the most. This explains well the lower concentrations of Ca and Fe but does not
explain the decrease in Al, which is toxic to most bacteria and is therefore likely not to be
consumed. In contrast, precipitation reactions in the case of Si and Al are the most probable
explanation for the decrease in concentration of these elements.
The less pronounced difference in cation concentrations between sterile and bacteria
containing suspensions observed after 11 days appears to be related to the death of bacterial
cells (see corresponding growth curves in Fig. 5.3.3). As the experimental system is closed,
cations that were consumed by bacteria can re-enter the solution during cell breakdown
(lyses). This is not the case expected for cations stored in biofilm, as the polysaccharide often
persists when the cells are already dead and disintegrating. As described by Leon-Morales et
al. (2007) the storage of Ca2+ in biofilm at the same time aids to stabilize the extracellular
structure. In this case, the relative lower amount of Ca might be associated to rapid biofilm
formation, as it is already after just 2h relatively depleted.

Chapter 5 - Bacterial influence on smectite hydration _______________________________________________________________________________________________________________
117
5.3.2.3. Montmorillonite cation release into solution
The concentrations of the released cations Al3+, Ca2+, Fe(tot), Mg2+, Na+ and Si4+ measured
in sterile montmorillonite-bearing solutions (10 g of MX80 and Swy-2 per ml, respectively)
is shown in Figs 5.3.7 - 5.3.8. The theoretical cation release that would correspond to the
stoichiometry is also plotted as open dotted columns. The first measurement after 2h shows
the enhanced release of the interlayer cations Ca and Na for both types of montmorillonites
(SWy-2 and MX80) into the solution (Fig. 5.3.7b and 5.3.8b). Also relatively high amounts of
Fe are detected and in contrast to the nontronite sample, only small amounts of Al or Si are
released into solution.
Fig. 5.3.7. The concentration of cations released from Wyoming montmorillonite(SWy-2) into purified water after 2h (light grey columns) and 264h (dark greycolumns). Columns in dotted lines represent stoichiometrical cation release. b)Mineral formula and a schematic representation of cation sites in the smectitestructure (non-stoichiometric). Abbreviation: IL- interlayer, T- tetrahedral sitesand O- octahedral sites.
0
20
40
60
Al Fe Si
CationCa Mg Na
80
100
Na0.16 Ca0.06[Al1.50 Mg0.3 Fe(3+)0.2]
[Si3.99 Al0.01] O10(OH)2
a) b)2 h hydrolyse264 h hydrolysestoichiometricalcation release (3%)
Si Si Si SiSi
SiSiSiSiSiSi
Si
Si
ILT
O
T
Al
Al
Fe
Ca
Mg
Na Na
Si Si
Al Al Al
Na
After 264h (11 days) of reaction, most of the cations are present in higher concentrations
compared to the first measurement. Only Fe is relatively lower in concentration, which
suggests that some precipitation occurs. Changes of the interlayer cation concentration
expressed with respect to the first measurement show 14% more Ca and 37% more Na for the
MX80 sample. For SWy-2, even higher amounts of Ca and Na are released (22% and 47%,
respectively). Fe is present in lower concentrations in the SWy-2 suspension compared to the
MX80 and its content decreases by 41% after the 11-day period. In the case of MX80, the
corresponding decrease is only 7%. This rapid release of interlayer cations is quite similar to
the behaviour of nontronite solution. The Fe detected in solution might be derived from the
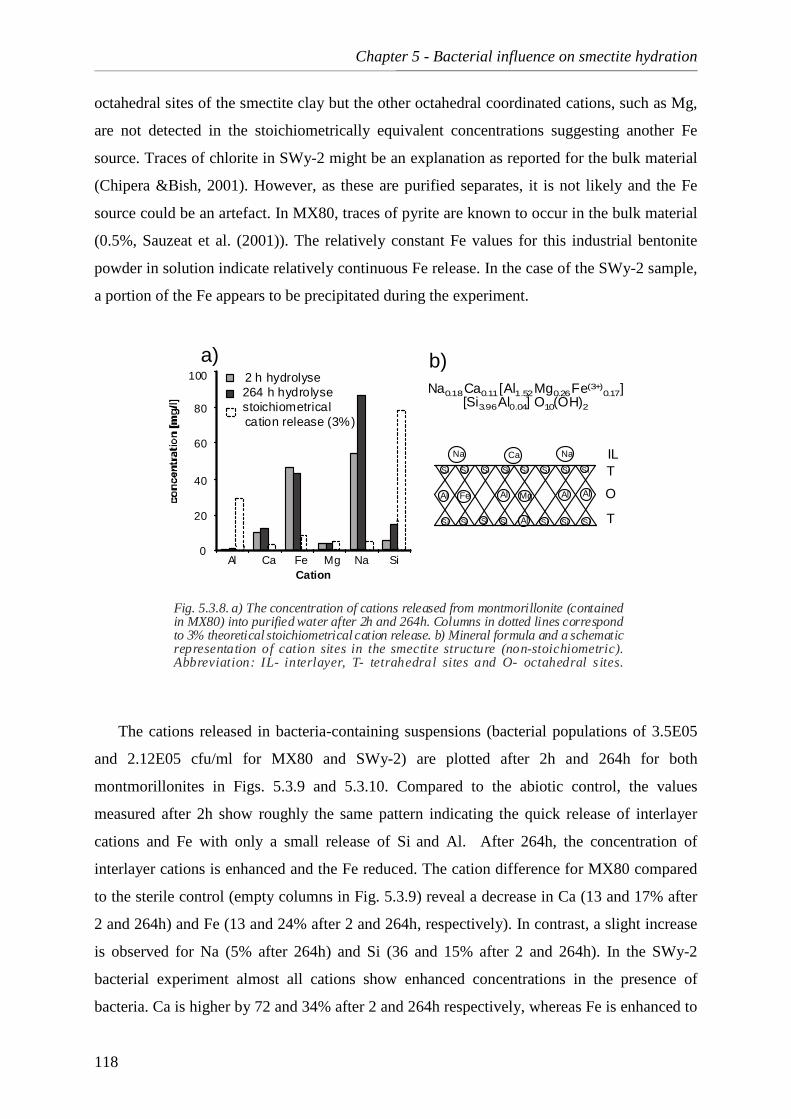
Chapter 5 - Bacterial influence on smectite hydration _______________________________________________________________________________________________________________
118
octahedral sites of the smectite clay but the other octahedral coordinated cations, such as Mg,
are not detected in the stoichiometrically equivalent concentrations suggesting another Fe
source. Traces of chlorite in SWy-2 might be an explanation as reported for the bulk material
(Chipera &Bish, 2001). However, as these are purified separates, it is not likely and the Fe
source could be an artefact. In MX80, traces of pyrite are known to occur in the bulk material
(0.5%, Sauzeat et al. (2001)). The relatively constant Fe values for this industrial bentonite
powder in solution indicate relatively continuous Fe release. In the case of the SWy-2 sample,
a portion of the Fe appears to be precipitated during the experiment.
Fig. 5.3.8. a) The concentration of cations released from montmorillonite (containedin MX80) into purified water after 2h and 264h. Columns in dotted lines correspondto 3% theoretical stoichiometrical cation release. b) Mineral formula and a schematicrepresentation of cation sites in the smectite structure (non-stoichiometric).Abbreviation: IL- interlayer, T- tetrahedral sites and O- octahedral s ites.
0
20
40
60
80
100
Al FeCation
Ca
Na0.18 Ca0.11 [Al1.52 Mg0.26 Fe(3+)0.17]
[Si3.96 Al0.04] O10(OH)2
SiMg Na
Si Si Si SiSi
SiSiSiSiSiSi
Si
Si
ILT
O
T
Al
Al
Fe
Ca
Mg
Na Na
Si Si
Al Al Al
2 h hydrolyse264 h hydrolysestoichiometricalcation release (3%)
a) b)
The cations released in bacteria-containing suspensions (bacterial populations of 3.5E05
and 2.12E05 cfu/ml for MX80 and SWy-2) are plotted after 2h and 264h for both
montmorillonites in Figs. 5.3.9 and 5.3.10. Compared to the abiotic control, the values
measured after 2h show roughly the same pattern indicating the quick release of interlayer
cations and Fe with only a small release of Si and Al. After 264h, the concentration of
interlayer cations is enhanced and the Fe reduced. The cation difference for MX80 compared
to the sterile control (empty columns in Fig. 5.3.9) reveal a decrease in Ca (13 and 17% after
2 and 264h) and Fe (13 and 24% after 2 and 264h, respectively). In contrast, a slight increase
is observed for Na (5% after 264h) and Si (36 and 15% after 2 and 264h). In the SWy-2
bacterial experiment almost all cations show enhanced concentrations in the presence of
bacteria. Ca is higher by 72 and 34% after 2 and 264h respectively, whereas Fe is enhanced to

Chapter 5 - Bacterial influence on smectite hydration _______________________________________________________________________________________________________________
119
56 and 45%, Mg by 53 and 34% and Na by 31 and 4%. Only Al and Si show negative values
after the 2h time intervals with reductions of 43 and 40% for the two elements respectively.
Al Fe SiCa Mg NaK
Cation
20
40
60
80
- 10
0
264 h hydrolyse
2 h hydrolyse
deviation from sterilecontrol after 2hdeviation from sterilecontrol after 264h
Fig. 5.3.10. The concentration of cations in solution derived from bacteriacontaining SWy-2 suspension. Empty columns indicate the amount of depletioncompared to the cation concentration of the sterile control. Virtually all cationsin solution are present in higher concentrations when bacteria are present.
20
40
60
80
100
- 20
0
Al Fe SiCa Mg NaK
Cation
264 h hydrolyse
2 h hydrolyse
deviation from sterilecontrol after 2hdeviation from sterilecontrol after 264h
Fig. 5.3.9. The concentration of cations in solution derived from bacteriacontaining MX80 suspension. Empty columns indicate the amount of depletioncompared to the cation concentration of the sterile control. In the case of Ca,Fe and K less cations are dissolved in solution when bacteria are present. Naand Si in contrast are slightly enhanced.
The lower concentrations of Ca and Fe in solution of MX80 can be interpreted to reflect
“consumption” by bacteria. Na is a nutrient for S. putrefaciens but is not depleted in any of
the samples and might indicate a continuous supply from the interlayer sites. In the case of
SWy-2, virtually all cations are enhanced when bacteria are present; this is especially true for
Ca and Fe. The active growth of the culture (compare with Fig. 5.3.1) results in nutrient
requirements and no other nutrients than the clay are supplied. With SWy-2, the rate of

Chapter 5 - Bacterial influence on smectite hydration _______________________________________________________________________________________________________________
120
dissolution might exceed the rate of consumption, leading to excess of cations. At least partly,
this can be attributed to the small particle size (<0.2 µm) of the purified sample where
relatively more edge sites for proton attack are available (Nagy, 1995) and bacterially
mediated alteration is enhanced (Vandevivere et al., 1994; Welch &Vandevivere, 1994;
Barker et al., 1998).
5.3.3. Microscopic Analysis
5.3.3.1. The role of biofilm: Confocal microscopy and ESEM
In order to evaluate the role of biofilm, both optical and electron microscopy were
undertaken on selected samples. Fig. 5.3.11a shows a confocal microscope image of MX80
bentonite that was incubated 1 week with a fresh culture of S. putrefaciens.
montmorilloniteaggregate montmorillonite
grains
montmorilloniteaggregate
a)
biofilm
25 µm 15 µm25 µm
nontronite grainsnontronite aggregate
biofilm
b)
Fig. 5.3.11. Confocal transmitted light microscopy image of smectite incubated with S. putrefaciens. a) MX80and b) nontronite. Biofilm appears within aggregates as diffuse structure.
The dark areas in the upper and lower left are montmorillonite aggregates, whereas single
montmorillonite particles are visible in the centre. Especially in the darker regions, diffuse
structures visible are attributed to patches of biofilm as described in other studies (Aouad,
2006). Fig. 5.3.11b shows a confocal microscope image of nontronite incubated with the
bacteria under the same conditions. The grains of the nontronite are much smaller and the
diffuse biofilm is concentrated around clay aggregates. In general, it is relatively difficult to
distinguish biofilm from viable bacterial colonies because the smectite sorbs the staining
products such as calcufluor and ethidium bromide for epifluorescence microscopy (see
example in appendix).

Chapter 5 - Bacterial influence on smectite hydration _______________________________________________________________________________________________________________
121
Biofilm structures are well visible in the bacteria suspensions studied by ESEM.
Examples of biofilms formed in a pure S. putrefaciens culture in minimal medium are given
in Figs. 5.3.12a (fresh biofilm) and 5.3.12c (2 week old biofilm).
mineral particles
Acc.V Spot Det WD25.0 kV 5.0 GSE 8.6 5.9 Torr 12°C
10 µm
Acc.V Spot Det WD25.0 kV 5.0 GSE 8.6 5.9 Torr 22°C
d)
biofilm
5 µm
a)precipitates
Acc.V Spot Det WD25.0 kV 5.0 GSE 8.6 5.9 Torr 12°C
5 µm
b)
biofilm
biofilm
Fig. 5.3.12. a) ESEM image of a two day old S. putrefaciens culture forming biofilm around precipitatesfrom the medium. b) Bacteria incorporated in biofilm attached to a phosphate needle that precipitatedfrom the medium. c) ESEM image of a two week old culture after the majority of cells have died.The biofilm is still visible. d) ESEM picture of biofilm forming on mineral par ticles.
Acc.V Spot Det WD25.0 kV 5.0 GSE 8.7 6.0 Torr 8°C
5 µm
c)
precipitate
biofilm
biofilm
bacteria cells
In the fresh biofilm, the net-like arrangement is associated with the needle-shaped
precipitates from the medium and seems to be built by single cells attached to each other (Fig
5.3.12b). Those single cells are generally difficult to distinguish from each other because of
the thick biofilm surrounding them (see dotted like in Fig 5.3.12b). In the 2 weeks old biofilm
shown in Fig. 5.3.12c, no single cells are distinguishable. The biofilm is either present as
fibrous, net-like structures (in the left part of the image) or as a relative homogenous mass, as
shown in the right part. Fig. 5.3.12d shows two large mineral particles (supposedly quartz)
with traces of biofilm on the surface. It seems that the cells colonized the surface and at the
same time excreted substances that trace the former presence of the living cells.
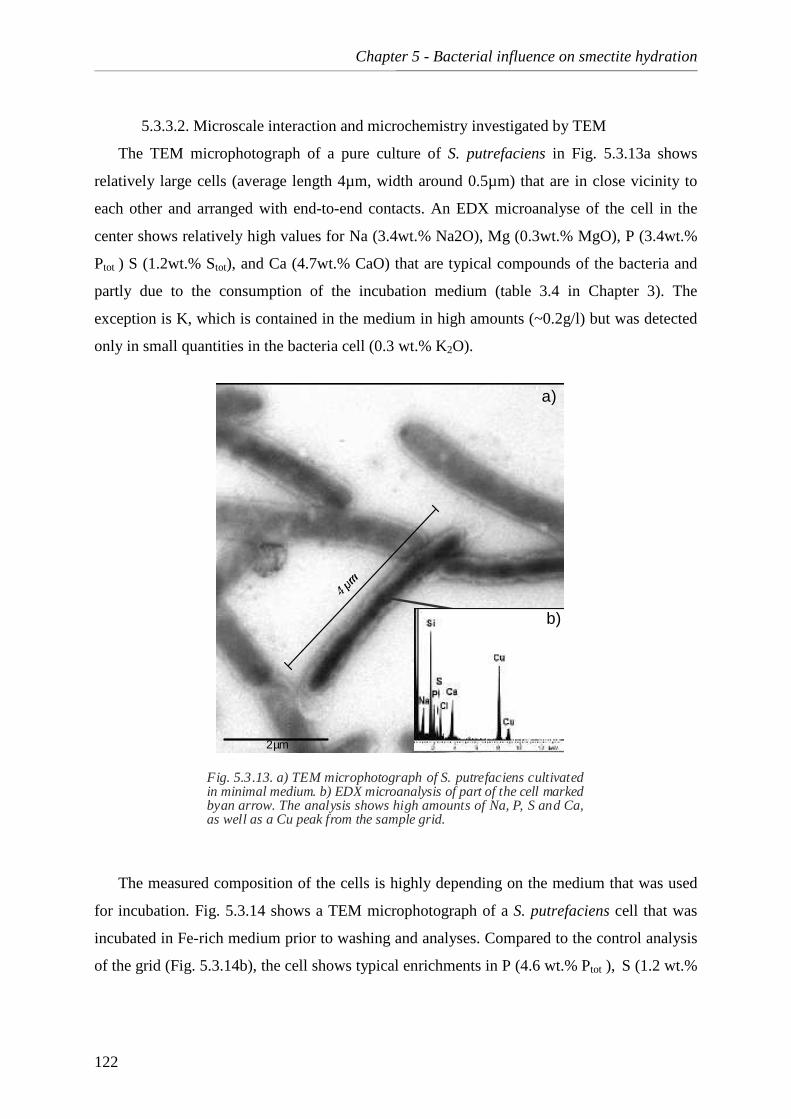
Chapter 5 - Bacterial influence on smectite hydration _______________________________________________________________________________________________________________
122
5.3.3.2. Microscale interaction and microchemistry investigated by TEM
The TEM microphotograph of a pure culture of S. putrefaciens in Fig. 5.3.13a shows
relatively large cells (average length 4µm, width around 0.5µm) that are in close vicinity to
each other and arranged with end-to-end contacts. An EDX microanalyse of the cell in the
center shows relatively high values for Na (3.4wt.% Na2O), Mg (0.3wt.% MgO), P (3.4wt.%
Ptot ) S (1.2wt.% Stot), and Ca (4.7wt.% CaO) that are typical compounds of the bacteria and
partly due to the consumption of the incubation medium (table 3.4 in Chapter 3). The
exception is K, which is contained in the medium in high amounts (~0.2g/l) but was detected
only in small quantities in the bacteria cell (0.3 wt.% K2O).
2µm
Fig. 5.3.13. a) TEM microphotograph of S. putrefaciens cultivatedin minimal medium. b) EDX microanalysis of part of the cell markedbyan arrow. The analysis shows high amounts of Na, P, S and Ca,as well as a Cu peak from the sample grid.
a)
b)
The measured composition of the cells is highly depending on the medium that was used
for incubation. Fig. 5.3.14 shows a TEM microphotograph of a S. putrefaciens cell that was
incubated in Fe-rich medium prior to washing and analyses. Compared to the control analysis
of the grid (Fig. 5.3.14b), the cell shows typical enrichments in P (4.6 wt.% Ptot ), S (1.2 wt.%

Chapter 5 - Bacterial influence on smectite hydration _______________________________________________________________________________________________________________
123
Stot), Ca (1.5 wt.% CaO) and Fe (3.6wt.% Fetot) that might be present as coatings. As for the
other examples, the cells incubated in this medium are relatively large, here around 3µm.
Fig. 5.3.14. a) TEM microphotograph of S. putrefacienscultivated in Fe-rich minimal medium. b) EDX microanalysisof the coated grid. c) EDX microanalysis of the cell showingthe bacterium to containg elements of the medium. The darkareas of the cell are Fe-rich (the Cu-peak is from the samplegrid).
a)
O
1 µm
c)
b)
Cu
Cu
FeFeCaS
PSi
Fe
Cu
Cu
SiCu
Fig. 5.3.15. TEM microphotograph and corresponding EDXspectra of nontronite particles. Microanalysis shows typicallyhigh amounts of iron (12.1 wt% Fetot). Quantification was donewithout correcting for C content derived from the sample coating.The Cu-peak comes from the sample grid.
0,5 µm
CaAl
Si
FeFe
Cu
Cu
In order to evaluate possible effects of bacteria on the clay, pure samples of nontronite
were incubated with and without bacteria for a period of 10 days. A TEM image of the sterile
nontronite sample is presented in Fig. 5.3.15 showing an aggregate formed by small

Chapter 5 - Bacterial influence on smectite hydration _______________________________________________________________________________________________________________
124
individual particles between 0.1 and 0.5µm in size. Microchemical quantification of the
particle shows the typically high values of Fe (12.1 wt.% Fetot) and the relative low values of
Al (3.27 wt.% Al2O3) for nontronite. Ca is as well abundant (with 1.9 wt.% CaO) and mostly
derived from the clay, whereas the small amount of Na (0.4 wt.% Na2O) is probably derived
from the experimental solution (Chapter 3).
The bacteria containing nontronite sample, after 10 days of bacterial activity, is shown in
Fig. 5.3.16. Compared to the sterile one, the bacteria incubated sample shows particles with
only diffusely defined edges surrounded by a homogenous, substance.
Fig. 5.3.16. a) TEM microphotograph of nontroniteincubated with bacter ia for 10 day s. b-c)Corresponding EDX spectra showing typicalnontronite composition in darker regions and a Si-rich gel-like structure surrounding the grains. TheCu-peak comes from the sample grid. d) TEMmicrophotograph of nontronite covering a bacterialcell (position marked with arrow).
d) 0,5 µm
0,5 µm
a)
nontroniteamorphoussubstance
b)
Al
Si
CaFe
Cu
c)
Cu
Cu
Si
Cu
Dark field imaging (not shown) confirmed the amorphous character. Corresponding
microchemical analysis show high values of Fe (10.2 wt.% Fetot) and low concentrations of Al
(2.8 wt.% Al2O3) in the electronically denser regions (Fig 5.3.16b). Additionally, a small
amount of Ca was detected (1.3 wt.% CaO). In contrast, the analyses for the amorphous
material around the particles show only traces of Fe and Ca (0.5 wt.% Fetot and 0.6 wt.% CaO,
not indicated in spectra), no Al, and is mostly composed of Si (46.3 wt.% SiO2; Fig. 5.3.16c).
The S. putrefaciens cells in the clay are difficult to distinguish due to their much smaller size

Chapter 5 - Bacterial influence on smectite hydration _______________________________________________________________________________________________________________
125
(length ~0.5µm) compared to bacteria grown in pure cultures. The cells are mostly hidden
within clay aggregates. Fig. 5.3.16d shows a bacteria cell partly covered by the nontronite
particles as confirmed by the microchemical analyze that shows small amounts of P (0.4wt%
Ptot) and S (0.4 wt.% Stot) that are not present in the other analyses. The structure and
composition of the amorphous substance surrounding the clay grains implies it is more likely
a transitional gel material formed by partial dissolution of the nontronite as described in other
studies (O'Reilly et al., 2006; Furukawa &O'Reilly, 2007). Additionally, the presence of EPS
associated to the partly dissolved grains was described (Jaisi et al., 2007) but cannot be
clearly confirmed due to the lack of P and or S in the analyze.
No significant differences are visible between the sterile samples and the ones incubated
with bacteria for 10 days with MX80 bentonite.
2 µm
Fig. 5.3.17. a) TEM microphotograph of montmorillonite (MX80) showing relicts of a bacterial cell. The correspondingEXD spectrum shows typical values for montmorillonite. b) TEM microphotograph of bacteria cultivated in thepresence of MX80 bentonite. The image shows a bacterial cell with montmorillonite wrapped around it. c) EDXspectrum of the cell. d) EDX spectrum of the montmorillonite.
0,5 µm
Na
Al
Al
montmoril lonite
bacteria
montmoril lonite
a) b)
Al
Si
Ca Fe
Cu
Cu
d)
Si
Cu
Cu
Cu
Cu
CuCa
Si
Cu
PS
c)
The TEM image in Fig. 5.3.17a shows a typical example of montmorillonite clay with a
diffuse mass marking the position of swelled particles. The darker objects in the center are
most likely relicts of bacterial cells. Microchemical analyses show the presence of Na (2.3
wt.% Na2O), relatively high amounts of Ca (3.2 wt.% CaO) and some Fe (0.5 wt.% Fetot). In
some of the analyzed samples, bacteria are visible outside of the aggregates. Fig. 5.3.17b
shows a close association between a bacterium and surrounding montmorillonite grains. The
composition of the cell contains the elements P, S and Ca (P is 1 wt% Ptot, S is 1.6 wt.% Stot

Chapter 5 - Bacterial influence on smectite hydration _______________________________________________________________________________________________________________
126
and Ca is 3.3 wt.% CaO; Fig. 5.3.17c). As seen in the nontronite sample, the bacteria are
relatively small with lengths of around 0.5µm. The analyses of the clay grains contain Al, Si
and Na, which are the major cations of montmorillonite (Fig 5.3.17d).
5.4. Bacteria - compacted clay interaction under confined volume conditions
5.4.1. In situ monitoring of smectite hydration by reaction-cell X-ray diffraction
The influence of S. putrefaciens on the following aspects are reported in this section, i) the
smectites capacity for water uptake ii) the development and organization of water layer (WL)
structures incorporated into the interlayers and iii) the partitioning of solution into the
different storage sites (Chapter 4). Results in this section are given for nontronite and
montmorillonite (MX80). Additionally changes in mineral assemblage of the bulk sample
were studied.
5.4.1.1. Bacterial effects on total water uptake
Compacted nontronite powder (1.34 g/cm3) shows a high rate of water uptake in the
absence of bacteria reaching a stable state after only ~72h (Fig. 5.4.1a). During this period, a
total of 0.17ml/g entered the experimental reaction-cell. The equivalent bacteria-containing
nontronite powder (packing density 1.37 g/cm3, inoculated with 2.8E06 cfu per g, table 5.4.1)
show a slightly higher and slower water intake, reaching the steady state of 0.19ml/g after
840h. The uptake rates are accordingly higher for the sterile sample (2.4E-03ml/g/h)
compared to 2.3E-04ml/g/h (table 5.4.2). At the end of the experiment, the bacteria containing
sample shows a slightly higher amount of solution intake and contains 0.185ml/g compared to
the sterile sample with 0.182ml/g.

Chapter 5 - Bacterial influence on smectite hydration _______________________________________________________________________________________________________________
127
10000 3000 50000
0.05
0.20
0.15
0.25
0.10
0
0.05
0.20
0.15
0.25
0.10
3000200010000
time (h)time (h)
MontmorilloniteNontronite
with bacteria (1.34g/cm3)without bacteria (1.37g/cm3)
with bacteriawithout bacteria
Fig. 5.4.1. Total water uptake into smectite powder determined by weight.
a)
(1.6g/cm3)
b)
For montmorillonite (Fig 5.4.1b), the uptake is notably slower and less solution enters the
powder. The sterile powder shows 0.10ml/g of solution intake after 1998h compared to
0.16m/g after 3100h with bacteria (initial density 5.7E04 cfu/g), and water inflow rates of
5.0E-05ml/g/h and 5.2E-05ml/g/h, respectively. As seen for nontronite, the total water uptake
with bacteria is enhanced but this effect is more pronounced in the montmorillonite, with
~37% more uptake than during sterile clay hydration.
For nontronite, the bacteria appear mostly to influence the rate of total water uptake
(lowering uptake rate) whereas for montmorillonite the amount of total uptake is the most
affected (enhancing uptake).
Solution
Ionic
strength Bacterial density initial
(cfu/g) Bacterial density during
experiment (cfu/g)
Nontronite MM 0.039 2.8E06 4.6 E06 (after 2000h)
Montmorillonite Salt Solution 0.011 5.7E04 4E06 (after 600h)
Table 5.4.1. Ionic strength of solutions and bacterial densities.
5.4.1.2. Bacterial effect on interlayer water uptake
The water layer distribution was obtained from the X-ray diffraction patterns using
CALCMIX as described in Chapter 3. Fig. 5.4.2 shows the development of water layer (WL)
structures expressed in % against time (hours) for nontronite (a+b) and montmorillonite (c+d)
with and without bacteria.

Chapter 5 - Bacterial influence on smectite hydration _______________________________________________________________________________________________________________
128
Effect on nontronite interlayer water uptake
For sterile nontronite, the initial hydration state consisted of a mixture of the following
water-layer (WL) structures: 45% 3-WL, 44% 2-WL and 11 % 0-WL (Fig. 5.4.2a). The curve
for normalized solution uptake (normalized to the maximal uptake after 1 year, data not
shown) shows rapid intake corresponding to the formation of the 1 and 3-WLs. These
structures are formed at the expense of the 2-WL structure and replace the initially non
hydrated structure (0-WL). During the experiment, the abundance of WL structures reaches a
stable state after 2000h and, after 5000h (~ 30 weeks) of experimentation the water layers
have a final composition of 62% 3-WL, 29% 2-WL and 9 % 1-WL. In the bacteria-containing
sample, the initial water layer structures show slightly higher hydration states than the sterile
control, composed of 45% 3-WL, 35% 2-WL and 2 % 4-WL (Fig. 5.4.2b). These differences
most likely represent some initial hydration during the addition of the water-bearing bacterial
preparation. During hydration and the initial stage of rapid uptake into the experimental
reaction-cell, the 3 and 4- WL structures develop largely at the expense of the 2-WLs. At the
end of the experimental run, the 3-WL dominates with 85%, the 4-WL decreases slightly to
10% and the 2-WL has only 5% abundance at the steady state. The addition and presence of
bacteria during nontronite hydration led to the presence of thicker water layer structures, with
the dominance of 3- and 4-WLs and to more prolonged changes in the hydration state than the
sterile control. Compared to the 2000hours needed to reach the steady state condition, the
bacteria containing nontronite had not stabilized after 5000h of experiment time.
Effect on montmorillonite (MX80) interlayer water uptake
In the case of the montmorillonite (contained in MX80), the development of the water
layer structures is slower and more complex. For the sterile sample (Fig. 5.4.2.c), the initial
state comprises 45% 3-WL, 15% 2-WL and 40 % 1-WL. The 1-WL structure decreases
continuously until disappearing completely after 1038h, when the 4-WL structure (10%)
develops. The 2-WL remains stable as long as the 1-WL is present and, subsequently
decreases until stabilizing at 10% after 1038h. The 3-WL continuously increases from the
beginning of hydration and stabilizes after 1998h as the most abundant structure (80 %). The
highest rates of total water uptake (normalized curve) correspond to the initial increase in 2-
WLs during the first hours of hydration and the more persistent increase in 3-WLs occurring
up to 1500h.
When bacteria are present, the 1 and 2-WLs (each with initial 30% abundance, Fig.
5.4.2d) decrease more rapidly than observed in the sterile sample and both structures are

Chapter 5 - Bacterial influence on smectite hydration _______________________________________________________________________________________________________________
129
replaced by thicker hydrated structures. Here, the 1-WL decreases to ~17 % and its
disappearance matches with the formation of 4-WL (starting with 18%) after 630h. In the case
of the 2-WL, it decreases down to 5% and disappears after 1279h. This corresponds with the
formation of a structure at ~22.4Å (for reasons of simplicity referred to as 5-WL structure)
that remains constant at 5%. As seen for the sterile sample, the 3-WL structure dominates but
develops more quickly in the presence of bacteria. The stable state is reached in a third of the
time, after just ~630h, and stabilizes with 68% 3-WL, 27% 4-WL and 5% 5-WL structures.
The total water intake also continues after stabilization of the interlayer structure (after
2500h), showing a similar behaviour to the abiotic (sterile) sample.
Fig. 5.4.2. a-b) Abundance of water layers for nontronite (NAu-1) and montmorillonite (MX80)without and with S. putrefaciens, expressed in percent (%) vs. the reaction time (in hours).Encircled symbols indicate the number of water layers within the hydrating interlayer. The dashedlines show the normalized total water uptake determined by weight.
time (h)0 3000 4000 500020001000
Nontronite with bacteriab)
0
20
40
60
80
100
Nontronite without bacteriaa)
time (h)0 3000 4000 500020001000
0
20
40
60
80
100
Montmorillonite with bacteriad)
0
20
40
60
80
100
300020001000500 1500 2500 35000
time (h)
0
20
40
60
80
100
300020001000500 1500 2500 35000
time (h)
Montmorillonite without bacteriac)
4
1
3
2
normalized water uptake
normalized water uptakenormalized water uptake
3
2
41
5
1
3
2
3
24
0
.
The thicker water structures formed in montmorillonite in the presence of bacteria follow
the same trend observed in the nontronite clay. Expressing the WL distributions as mean
thicknesses (d-values) shows generally higher initial values for nontronite (16.1 and 17.7Å for

Chapter 5 - Bacterial influence on smectite hydration _______________________________________________________________________________________________________________
130
the sterile and bacteria containing sample) than for the montmorillonite (15.6 and 15.7Å for
the sterile and bacteria containing sample, table 5.4.2). Subtracting the initial mean
thicknesses from the values representing the final stage of swelling yields a mean d-value
difference (∆d). The ∆d values of the bacteria containing samples are higher confirming the
formation of more space consuming WL structures, whereas the difference between the sterile
and bacteria containing samples notably is more pronounced for montmorillonite.
Table 5.4.2. Water layer abundance (%) and corresponding basal lattice d-values for sterile and Shewanella-bearing nontronite and MX80 bentonite clays.
Nontronite MX80
Sterile With bacteria Sterile With bacteria
Water layers d-value Initial Final Initial Final Initial Final Initial Final 0 9.6 0.11 1 12.2 0.09 0.35 0.05 0.4 0.30 2 15.2 0.44 0.29 0.45 0.80 0.15 0.10 0.30 3 18.5 0.45 0.62 0.20 0.15 0.45 0.80 0.40 0.68 4 20.2 0.10 0.27 5 22.8 0.05
Mean thickness (Å)
16.1 17 17.7 18.5 15.6 18.3 15.7 19.2
∆d 0.9 1.05 2.7 3.5
Organization (ordering) of interlayer water in nontronite
The organization of WL structures with and without bacteria is shown in Fig. 5.4.3,
normalized to the random case. The deviation from R=0 for the sterile and bacteria containing
nontronite is given in Fig. 5.4.3a and b. Without bacteria, the deviation from random stacking
is positive for the same WL structures indicating an elevated probability for this arrangement.
Highest values are obtained for the probability that 1-WL follows 1 (p11: 0.61-0.81) but, as
well, p22 is a probable combination (p22: 0.51-0.66). Values for p33 are lower (0.23-0.38)
but show, relative to the random case, a higher probability. Accordingly, other combinations
are less probable (e.g. p32 ranging between -0.17 and -0.30; p23 ranges between -0.45 and -
0.57). When bacteria are present, the deviations from R0 are less systematic. Combinations
for the same WL structures are favoured as a tendency (e.g. p22, but maximum is only 0.25).
The only combination that seems to have a systematic higher probability is that 4-WLs are
followed by 3 (p43 with highest values of 0.75). As the system with bacteria is generally more
hydrated, a direct comparison is difficult. However, with increasing hydration a
systematically increase in ordering was observed (Chapter 4) indicating that the presence of
bacteria induces the observed fluctuations.

Chapter 5 - Bacterial influence on smectite hydration _______________________________________________________________________________________________________________
131
Organization (ordering) of interlayer water in montmorillonite (MX80)
In case of the MX80, the deviations are generally more systematic (Fig. 5.4.3.c +d) and
values are lower compared to the nontronite indicating the tendency towards random stacking.
Without bacteria, the probabilities for the same WL structures to be adjacent to each other is
however slightly lower than the random case (maximum value for p22 is -0.2). In contrast,
slightly enhanced probabilities are visible for 3-WL followed by 2-WL (p32 ranging from
0.06 to 0.25), and for 2-WLs followed by 1-WL (p21 ranging between 0.12 and 0.47). The
probability of 1-WL is followed by 3-WL is also higher that random (p13 ranging from 0.03
to 0.25).
Fig. 5.4.3. Ordering of mixed water layer structures expressed as a deviation from the R0(random) stacking state for a) nontronite without bacteria, b) nontronite with bacteria, c)montmorillonite (MX80) without bacteria, and d) montmorillonite (MX80) with bacteria.
p33p22 p12 p31p11
p21p32 p13
p23
R=0
0.5
1.0
0
-0.5
-1.0
Montmoril lonite (MX80) without bacteriac) d) Montmorillonite (MX80) with bacteria
R=0 0
-0.5
1.0
p33p22 p42p44 p32p43 p34
R=0
Nontronite without bacteriaa) b) Nontronite with bacteria
0.5
0
-0.5
1.0
0.5
-1.0
p33p22
p32 p23
p11
p21p31
-1.0
p33p22 p31p11 p21
p32
p13
p23
R=0
p12
0
-0.5
1.0
0.5
-1.0
This pattern indicates a preferred stacking order of 3-WL-1-WL-2-WL. When bacteria are
present, the deviations from random are, for most of the combinations, less pronounced. The
probability that 2-WL is followed by the same 2-WL is slightly enhanced (p22 ranges
between 0.1 and 0.23) as is the 2-WL followed by 1-WL (p21 maximally 0.34) and the 1-WL

Chapter 5 - Bacterial influence on smectite hydration _______________________________________________________________________________________________________________
132
is followed by the 3-WL (p13 between 0.05 and 0.28). The combination 2-WL followed by 3-
WL (maximum value for p23 is -0.57) is not very probable. Therefore the preferred stacking
order with bacteria in montmorillonite is as a tendency toward 2-WL-1-WL-3-WL structures,
having like in the abiotic sample, the 1-WL in the center.
5.4.1.3. Bacterial effects on the storage of water
Measured and calculated water contents for nontronite (a+b) and montmorillonite
contained in MX80 (c+d) are plotted in Fig. 5.4.4. The amount of interlayer water was
calculated from the relative abundances of water layer structures obtained by CALCMIX in
combination with published data (Bérend et al., 1995; Cases et al., 1997; Jänchen et al., 2006;
Milliken &Mustard, 2007). For details, see Chapter 3 and the appendix. Subtracting this
values from the total water uptake (determined by weight; cp. Fig 5.4.1.) gives the non-
interlayer water (displayed as surface and pore water). Significant amounts of solution were
introduced during the mixing process of clay and bacteria (each containing 0.25ml solution
with or without bacteria per g clay). Therefore, the initial water is included in Fig 5.4.4.
Fig. 5.4.4. a-d. Storage of water in interlayer and non-interlayer sites from nontronite(NAu-1) and montmor illonite (MX80) without and with S. putrefaciens.
0
0.70
0.60
0.40
0.20
0.10
0.50
0.30
1000 2000 3000 4000 50000
Nontronite without bacteria
a)
total water content
pore & surface water
interlayer water
time (h)
Nontronite with bacteria
b)
0
0.70
0.60
0.40
0.20
0.10
0.50
0.30
1000 2000 3000 4000 50000
time (h)
total water content
interlayer water
pore & surface water
0
0.70
0.60
0.40
0.20
0.10
0.50
0.30
1000 15000 500 2000 2500 3000 3500time (h)
Montmorillonite (MX80) without bacteria
c)
total water content
interlayer water
pore & surface water
0
0.70
0.60
0.40
0.20
0.10
0.50
0.30
1000 15000 500 2000 2500 3000 3500time (h)
Montmorillonite (MX80) with bacteria
d)
total water content
interlayer water
pore & surface water
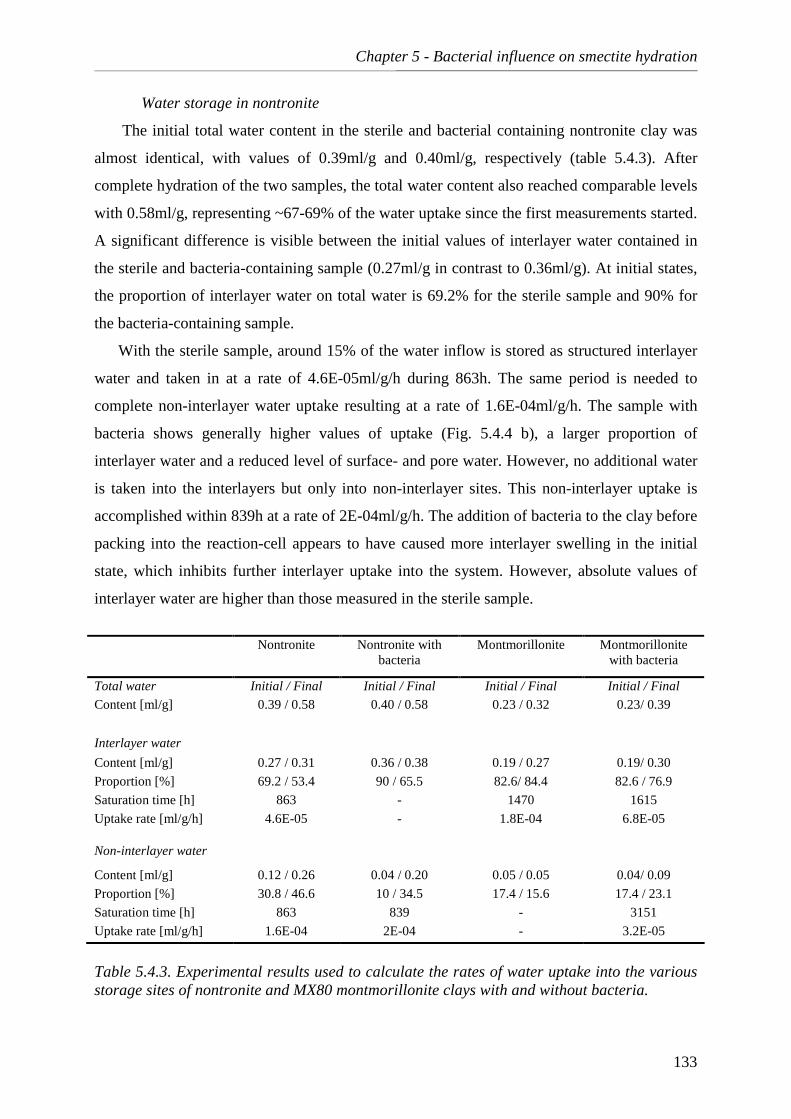
Chapter 5 - Bacterial influence on smectite hydration _______________________________________________________________________________________________________________
133
Water storage in nontronite
The initial total water content in the sterile and bacterial containing nontronite clay was
almost identical, with values of 0.39ml/g and 0.40ml/g, respectively (table 5.4.3). After
complete hydration of the two samples, the total water content also reached comparable levels
with 0.58ml/g, representing ~67-69% of the water uptake since the first measurements started.
A significant difference is visible between the initial values of interlayer water contained in
the sterile and bacteria-containing sample (0.27ml/g in contrast to 0.36ml/g). At initial states,
the proportion of interlayer water on total water is 69.2% for the sterile sample and 90% for
the bacteria-containing sample.
With the sterile sample, around 15% of the water inflow is stored as structured interlayer
water and taken in at a rate of 4.6E-05ml/g/h during 863h. The same period is needed to
complete non-interlayer water uptake resulting at a rate of 1.6E-04ml/g/h. The sample with
bacteria shows generally higher values of uptake (Fig. 5.4.4 b), a larger proportion of
interlayer water and a reduced level of surface- and pore water. However, no additional water
is taken into the interlayers but only into non-interlayer sites. This non-interlayer uptake is
accomplished within 839h at a rate of 2E-04ml/g/h. The addition of bacteria to the clay before
packing into the reaction-cell appears to have caused more interlayer swelling in the initial
state, which inhibits further interlayer uptake into the system. However, absolute values of
interlayer water are higher than those measured in the sterile sample.
Nontronite Nontronite with
bacteria Montmorillonite Montmorillonite
with bacteria
Total water Initial / Final Initial / Final Initial / Final Initial / Final
Content [ml/g] 0.39 / 0.58 0.40 / 0.58 0.23 / 0.32 0.23/ 0.39
Interlayer water
Content [ml/g] 0.27 / 0.31 0.36 / 0.38 0.19 / 0.27 0.19/ 0.30
Proportion [%] 69.2 / 53.4 90 / 65.5 82.6/ 84.4 82.6 / 76.9
Saturation time [h] 863 - 1470 1615
Uptake rate [ml/g/h] 4.6E-05 - 1.8E-04 6.8E-05
Non-interlayer water
Content [ml/g] 0.12 / 0.26 0.04 / 0.20 0.05 / 0.05 0.04/ 0.09
Proportion [%] 30.8 / 46.6 10 / 34.5 17.4 / 15.6 17.4 / 23.1
Saturation time [h] 863 839 - 3151
Uptake rate [ml/g/h] 1.6E-04 2E-04 - 3.2E-05
Table 5.4.3. Experimental results used to calculate the rates of water uptake into the various storage sites of nontronite and MX80 montmorillonite clays with and without bacteria.

Chapter 5 - Bacterial influence on smectite hydration _______________________________________________________________________________________________________________
134
Water storage in montmorillonite (MX80)
The montmorillonite, in contrast to the nontronite clay, takes the majority of water into the
interlayers (between 76.9 and 84.4%). In the sterile and bacteria containing montmorillonite
samples, the proportions of total, interlayer and non-interlayer (surface and pore) water are
the same in the initial state prior to water inflow (Fig 5.4.4c+d). The 0.23ml/g initial total
water content is distributed as 82.6% interlayers (0.19ml/g) and 17.4% non-interlayer
(0.05g/ml). A significant difference in the total water content between the sterile and bacteria
samples is observable after hydration is complete, with higher amount of water incorporated
in the presence of bacteria (0.39ml/g as opposed to 0.32ml/g). The additional 0.07ml/g is
distributed almost equally between the interlayer and non-interlayer sites (0.03ml/g and
0.04ml/g, respectively). Therefore the presence of bacteria in montmorillonite sample leads to
a general enhancement of water content at all sites.
Changes in particle thickness
Because of the initially elevated hydration state, the number of layers per particle is, in the
case of the nontronite sample, already low at the beginning (N=7 with bacteria and 8 without).
For MX80, the number of layers per stack is 9 for both initial samples, which during
hydration decreases to 3 for the bacteria containing sample and to 5 in the sterile sample
(table 5.4.4). Theoretically, this corresponds to an enhanced surface area when bacteria are
present (190m2/g as opposed to 114m2/g for the sterile sample) that could accommodate
larger volumes of water than actually observed. Based on these values, a maximal of ~29%
surfaces participation is estimated in the sterile system and, when bacteria are present, the
participation is 31%.
Layers per
stack initial
Layers per stack final
External surface area Initial [m2/g]
External surface area final [m2/g]
Maximal surface
adsorbed water [ml/g]
Maximal participation of
surface [%]
MX80 with bacteria 9 3 63.4 190 0.46*/0.29** 19.6*/31**
MX80 sterile 9 5 63.4 114.1 0.27*/0.17** 18.5*/29.4**
Table 5.4.4. Mean number of layers per stack and corresponding theoretical surface area for MX80 montmorillonite with and without bacteria.*Assuming 19 layers per stack for the “dry” state and *4 and **2.5 mmol H2O/g for the amount of adsorbed surface water.

Chapter 5 - Bacterial influence on smectite hydration _______________________________________________________________________________________________________________
135
5.4.2. Characterization of reaction products
5.4.2.1. Powder XRD
Powder XRD of nontronite
The whole rock XRD patterns of the nontronite clay (initial and final measurements) for
bacteria containing and sterile samples are presented in Fig. 5.4.5 a and b.
Fig. 5.4.5. a) XRD patterns of initial (black) and final (grey) bacteria containingnontronite powders extracted from the reaction-cell experiments. Basal reflectionsof hydrated nontronite (Ntr) and the internal standard kaolinite (Kln) are indicatedwith corresponding d-values in Å. Additionally both samples contain goethite (Gt),tridymite (Trd), biotite (Bt) and precipitations of the Al-sulphate basaluminite (Bal).Mirabilite (Mir) and vivianite (Viv) are only contained in the final reaction products(bold). b) XRD patterns of the initial sterile nontronite (black) and the finalmeasurements made at the end of the experiment (grey). The final reaction productsshow enhanced basaluminite precipitation (bold).
1400
800
0
1000
600
400
200
1200
34 42 502 10 18 26°2 Theta
Kln7,1
(001)Kln3,56
(002)Kln2,38
(003)
Ntr9,35
(002)Ntr6,23
(003)
Kln2,55
Kln2,49
Kln2,33
Ntr3,11
(005)
Kln2,29
Kln1,99
Ntr2,33
(006)Ntr4,54
(004)
Kln4,34
Gt4,15
Trd3,82
Bal3,84
Mir3,24
Bt1,94
Bal1,89
Trd2,52
Ntr18,7
(001)
Gt2,18
Gt2,45
Viv2,96
Quz3,34
a)
34 42 502 10 18 26°2 Theta
0
600
400
200
Bal3,84
Bal1,89
b)
bacteria-containing
sterile

Chapter 5 - Bacterial influence on smectite hydration _______________________________________________________________________________________________________________
136
The kaolinite (indicated in grey) which was added to the upper surface of the pressed
powder sample as an internal standard and shows sharp multiple reflections at 7.1Å (001) and
3.56Å (002). The reflections of nontronite (presented for the hydrated state) correspond to a
predominantly 3-WL hydrate and are positioned at 18.7Å (001), 9.35Å (002), 6.23Å (003),
4.54Å (004) 3.11Å (006) and 2.33Å (007). Additionally, tridymite (reflections at 3.82Å and
2.52Å), biotite (1.94Å) and goethite (4.15Å and 2.18Å) are detected in the sample pattern.
The Al-hydroxo-sulfate basaluminite (Al4(OH)10SO4) is present in both samples with
reflections at 3.84Å and 1.89Å. In the bacteria containing sample (Fig. 5.4.4.a), mirabilite
(Na2SO4 *10H2O) is visible with a reflection at 3.24Å which is most probably precipitated
from the medium. Additionally, some vivianite (Fe3(PO4)2 * 8(H20)) is present with a peak at
2.96Å.
Powder XRD of montmorillonite (MX80)
Selected whole rock XRD patterns of the hydrating sterile MX80 bentonite clay, are
presented in Fig. 5.4.6.
3500
2000
0
2500
1500
1000
500
Fig. 5.4.6. a) Selected XRD patterns of sterile MX80 measuredin situ during the reaction-cell experiment. The initial measurementis shown in black and the last measurement (after 9600 h) inlight grey. The d-values for montmorillonite (Mnt) present mostlya mixture of 2- and 3-WL hydrates. All samples contain illite(Ill), quartz (Qtz) and feldspar (Fsp). Non-silicates are presentas bassanite (Bas), rhodochrosite (Rds), and in somemeasurements, calcite (Cal) is visible. b) The amount of greenrust is observed to increase and decreases during the period ofthe experiment, suggestive of precipitation and subsequentdissolution. All d-values are given in Å.
10 18 26 34 42 50
3000
4000
4500
°2 Theta2
Mnt~18,76
Mnt~15,86
Ill9,95
Mnt6,26
Mnt5,18
Mnt4,72
Ill4,47
Qtz4,26
Fsp4,04
Fsp
Mnt3,14
Bas3,48
Rds2,17
Cal3,88
(001)
(001)
Mnt9,50
(002) (003)
(003)
(004)
Qtz3,34
(005)
Montmorillonite~3-WL
Ill2,56
a)
Montmorillonite~2-WL
non-silicates
Ill ite
Quartz &Feldspars
b)
Cal2,29
b)
green rust7,58

Chapter 5 - Bacterial influence on smectite hydration _______________________________________________________________________________________________________________
137
As the montmorillonite hydrates, the d-values of the basal reflections change
continuously and are simplified to a 2 and 3 water layer structure end-member. Reflections
for predominantly 2-WL are present at 15.88Å (001), 5.18Å (003), 3.14Å (005) whereas the
3-WL endmember occurs at 18.76Å (001), 9.5Å (002), 6.26Å (003) and 4.72Å (004) (for
details of the WL structures see Fig. 5.4.2 c+d).
An illite-type mica is visible in all measurements with strong reflections at 9.95Å (001),
and 4.47Å (002). The change in intensity of the illite (001) reflection is due to superposition
with the montmorillonite (002) reflection at 9.50Å and not due to an increase in illite content
(Fig. 5.4.6b). Other silicates that are present in both the initial and final reaction states are
quartz (reflections at 4.26Å and 3.34Å) and feldspar (albite end-member) with several
reflections that are not all indicated (e.g. 4.04Å, 3.22Å, 3.17Å and 3.14Å). Some of the
feldspar reflections are only visible in some measurements, as their intensity is highly
orientation dependent.
Non-silicate reflections are present in some measurements but are not present in all
patterns, such as the calcite (CaCO3, visible reflection at 3.88Å and 2.29Å), rhodochrosite
(MnCO3, visible reflection at 2.17Å) and calcium sulfate bassanite (CaSO4 *0.5H2O, visible
reflection at 3.48Å). These minerals are considered to represent local precipitates from
solutions that are readily re-dissolved during local changes in the saturation level of dissolved
Ca, Mn and SO4. The only non-silicate showing a clear sequence of crystallization is an iron
carbonate hydroxide (Fe6(OH)12(CO3) referred to as “green rust” which is identifiable by a
strongest reflection at 7.58Å (Fig. 5.4.6b). This reflection is not present at initial (almost dry)
states, but occurs with fluctuating intensities throughout experimentation indicating active Fe
dissolution and precipitation reactions. This reaction product was also described in other
studies (Sauzeat et al., 2001) but it appears to be most easily detected under hydrated
conditions.
Fig 5.4.7a shows selected XRD patterns for the bacteria containing MX80 bentonite in the
reaction-cell over a time span of 3150h. As for the sterile sample, the dominant reflections are
montmorillonite (reflections are indicated for 2 and 3 water layers), an illite-type mica (10.0Å
4.48Å 2.56Å), quartz (4.26Å and 3.34Å) and feldspar (mostly albite). The reflection of an
iron carbonate hydroxide is present in all measurements except the first. The intensity of the
peak at 7.58Å remains stable during the whole experiment (Fig. 5.4.7b). Unlike the sterile
sample, a reflection of lepidocrocite ((γ-FeOOH) visible at 2.46Å) shows a sequential
increase in intensity that indicates continuous precipitation (Fig. 5.4.7c). Another sequence is
visible for calcite (2.48Å) with decreasing intensity. This is even more visible for the

Chapter 5 - Bacterial influence on smectite hydration _______________________________________________________________________________________________________________
138
reflection at 1.91Å, showing the highest intensity at the beginning with a successive decrease
in intensity followed by a complete disappearance within the first 190h of experimentation
(Fig. 5.4.7d). The reflection of rhodochrosite (visible reflection at 2.17Å) is, like the bassanite
reflection at 2.99Å, not visible in all samples.
3500
2000
0
2500
1500
1000
500
34 42 502 10 18 26
3000
Fig. 5.4.7. a) Selected XRD patterns of bacteria containing MX80 measured in situduring the reaction-cell experiment. The initial measurement is shown in black and thelast measurement (after 3150 h) in light grey. The d-values for montmorillonite (Mnt)present mostly a mixture of 2- and 3-WL hydrates. All samples contain illite (Ill), quartz(Qtz) and feldspar (Fsp). Non-silicates are bassanite (Bas), rhodochrosite (Rds) andin some measurements calcite (Cal). Reflections indicating dissolution/precipitationare shown in the magnified images: b) increase of green rust c) increase of lepidocrocite(Lpc) and d) decrease of calcite (Cal). The 2.42 Å peak of pyrite (Py) is perhaps presentin c). All d-values are given in Å.
°2 Theta
Mnt~18,8
Mnt~15,6
Ill10,0
Mnt6,27
Mnt5,20
Mnt4,72
Ill4,48
Qtz4,26
Fsp4,04
Fsp
Mnt3,14
Fsp2,86
b) c) d)
Rds2,17
b)Ill
10,0
Mnt9,5
green rust7,58
(001)
(001)
Mnt9,49
(002) (003)
(003)
(004)
Qtz3,34
(005)
Montmorillonite~3-WL
Ill2,56
a)
Cal1,91 d)Lpc
2,46c)
Montmorillonite~3-WL
non-silicates
Illite
Quartz &Feldspars
Cal3,88
Cal2,48
Py?2,42
Bas2,99
Bas1,85
Lpc?1.95
5.4.2.2. XRD-texture characterization of samples
Sample powders extracted from the reaction-cell holders after completion of the hydration
cycle were measured as laboratory texture preparations to investigate changes in basal

Chapter 5 - Bacterial influence on smectite hydration _______________________________________________________________________________________________________________
139
reflections. These samples were both measured in the untreated state and after saturation with
cations (KCl and MgCl2) and organic complexes, (ethylene glycol and glycerol) used to
characterize the clay samples. For nontronite, the texture sample of the original material that
was not incubated in the reaction-cell chamber was prepared as a reference.
Texture characterization of nontronite
Fig. 5.4.8a shows the XRD patterns for the air dried (AD) and ethylene glycol (EG)
saturated samples prepared from the original material, as well as from the sterile reaction-cell
and the bacteria containing reaction-cell.
Fig. 5.4.8. a) XRD patterns of air dried (AD) and glycolated (EG) texture preparationsof the original nontronite sample (upper sketch, light grey), of the sample extractedfrom the sterile reaction-cell (middle dark grey) and the sample extracted from theS. putrefaciens containing reaction-cell (black). b) Enlarged image of the (001)reflection with d-values. The numbers in italics indicate the relative air humidity (RH)for air dried samples at the time of measurement.
b)
2 10 18 26 34°2 Theta
0
15000
10000
5000
20000
15000
10000
5000
25000
20000
15000
10000
5000
original sample
bacteria containing wet -cell
(001)
2 10°2 Theta
16,83Å 15,21Å
16,96Å 14,92Å
16,78Å 15,19Å
a)
RH 48%
RH 37%
RH 48%
(002) (005)
air dried (AD)glycolated (EG)
air dried (AD)glycolated (EG)
(002) (005)
(002) (005)
(001)
(001)
air dried (AD)glycolated (EG)
(001) reflectionswhole patterns
kaolinite (001)
kaolinite (002)
kaolinite (001)
kaolinite (002)
kaolinite (001)
kaolinite (002)
bacteria free wet-cell

Chapter 5 - Bacterial influence on smectite hydration _______________________________________________________________________________________________________________
140
The basal reflections of ethylene glycol treated nontronite are the most characteristic of
this mineral with an intense (001) basal reflection and relatively intense (002) refletions (005),
typical for the high amounts of Fe in the octahedral sites (Moore &Reynolds, 1997). The
other basal reflections are those of Kaolinite standard. No precipitates or other mineral phases
are detectable either in the sterile or in the bacteria-containing samples.
In Fig 5.4.8b, the (001) nontronite reflections are shown for air dried and ethylene glycol
saturated samples. The air dried state of the samples shows only minor differences in d-values
with a range from 14.91 to 15.25Å, which can be attributed to variations in relative humidity
that was elevated in case of the original and bacteria containing samples (both with 48%) as
opposed to the sterile sample that was equilibrated in 37% RH. These d-values confirm that
after the 1½ year experiment period, the interlayer cation is still divalent (supposedly Ca2+). In
contrast, the d-values of glycolated samples are independent of the relative humidity and all
reflections show an expected shift towards higher d-values due to the intercalation of the
molecule. Compared to the glycolated original sample (see dotted line in Fig. 5.4.8b), the
sterile reaction-cell sample shows a d-value slightly higher than the original, indicating an
increased accessibility for the EG-molecule (16.96 vs. 16.83Å). The value for the bacteria
containing sample shows a lower d-value (16.78Å) and a reduced accessibility for the
molecule that might be due to coatings of organic matter.
Measurements of the full-width-at-half-maximum (FWHM) of the glycolated (001)
reflection show higher values for the bacteria containing sample compared to the sterile
control (0.744 vs. 0.705°, table 5.4.5) but both confined volume derived samples show lower
values than the original one (0.867°). Higher FWHM values indicate a broader peak and, in
the case of the original sample, this might indicate the presence of very small grains that are
contributing to the peak broadening. In contrast the reaction-cell samples, the sharper peaks
(lower values for FWHM) could indicate some dissolution of such grains. The bacteria
containing sample shows a peak broadening relative to the sterile control, suggestive of
decreased particle size. Values for the FWHM and d-values do not correlate (plot not shown),
which indicates that differences in broadening are independent of EG saturation state.
Generally, the XRD maximal peak intensity for the bacteria-containing sample is lower
compared to the sterile reaction-cell. Most likely the bacteria cause textural changes by
producing lower basal intensities due to a poor preferred orientation.

Chapter 5 - Bacterial influence on smectite hydration _______________________________________________________________________________________________________________
141
Table 5.4.5. XRD peak characteristics (001 reflection) of nontronite materials after various chemical and physical treatments. *FWHM= full width at half maximum.
Original sample Sterile reaction-cell sample Bacteria containing reaction-cell sample
d-value (Å)
Intensity (cps)
*FWHM° d-value (Å)
Intensity (cps)
FWHM° d-value (Å)
Intensity (cps)
FWHM°
Air dried 15.21 9504 1.287 14.92 2098 0.957 15.19 1520 1.029
Ethylene glycol 16.83 1075 0.867 16.96 2389 0.705 16.78 1610 0.744
MgCl2+glycerol 14.83 2651 0.921 14.64 1520 0.888 14.25 1240 0.890
80°C 14.02 1551 1.289 14.12 1649 1.258
120°C 11.08 3927 1.880 11.29 3909 2.033
160°C 9.90 4088 1.125 9.93 4295 1.189
200°C 9.81 4283 1.049 9.78 4590 1.021
A qualitative evaluation of layer charge was undertaken by exchanging the samples with
Mg followed by glycerol saturation. If the charge approaches vermiculitic values, this
treatment leads to a shift of the (001) reflection towards lower d-values (Brown &Brindley,
1984; Moore &Reynolds, 1997). Fig. 5.4.9 shows the diffraction patterns of the Mg
exchanged and glycerol saturated sterile sample, as well as the bacteria-containing reaction-
cell samples and the original sample.
Fig. 5.4.9. XRD patterns of Mg-exchanged and glycerol-saturated texture preparations extracted from sterile (S)and bacteria containing (B) reaction-cell experiments.The enlarged image shows the position of 001 reflectionsand their corresponding d-values. The light grey patternrepresents the Mg-exchanged and glycerol- saturatedoriginal sample (O) that was taken as a reference.
14, 83ÅO
0
20000
15000
10000
5000
25000
30000
2 10 18 26 34°2 Theta
14 ,25ÅB
14,64ÅS
4 8
(001)

Chapter 5 - Bacterial influence on smectite hydration _______________________________________________________________________________________________________________
142
As the nontronite has in general a relatively high layer charge (~0.5 per half unit cell), the
original sample shows relatively low d-values (14.83Å as opposed to the 17Å of typical
smectites). The d-value of the sterile reaction-cell sample shows a decrease to 14.64Å,
whereas the d-value of the bacteria-containing sample decreases relatively strongly to 14.25Å.
The latter value is typically vermiculitic (14.2-14.3Å, Brown & Brindley 1984) and indicates
an increased layer charge.
As both reaction-cell samples were anoxic over a long period (1½ years), the changed
redox conditions already might have led to an increased layer charge. The bacteria containing
sample shows an additional increase that may be linked to additional dissimilatory Fe-
reduction due to bacterial respiration. However, a cation fixation (K+) within smectite
interlayers or neo-formation of illite (Kim et al., 2004) was not observed in these samples
indicating that the layer charge did not exceed 0.8 per unit cell.
In order to test the presence of organics in the interlayer space, the samples were
successively heated up to 200°C and the d-values measured at selected stages. As water
leaves the structure relatively easily, differences in the response to the heat treatment can help
to identify organic contaminations that, depending on the compound, leaves the structure at
higher temperatures typically more than 105°C, (Birkel et al., 2002). Fig. 5.4.10 shows the
XRD patterns of the samples from sterile and bacteria containing reaction-cells for 3 different
temperatures compared to the AD state (Fig. 5.4.10a). After heating to 80°C for 24h (Fig.
5.4.10b), the reflections show a strong decrease in maximal intensity and a shift towards
lower d-values (14.02Å for the sterile and 14.12Å for the bacteria-containing sample). The
difference in d-value between the sterile and bacteria containing sample is slightly enhanced
in the measurement after heating to 120°C (Fig. 5.4.10c) with lower d-values for the sterile
sample (11.08Å vs. 11.29Å). Heating to 160°C leads almost to a complete loss of interlayer
water and both d-values shift to around 9.90Å (Fig. 5.4.10d). After heating to 200°C (not
shown in plot) the d-values change to 9.81Å and 9.78Å for the sterile and bacteria containing
samples (table 5.4.5), and the complete loss of interlayer water is accomplished.

Chapter 5 - Bacterial influence on smectite hydration _______________________________________________________________________________________________________________
143
Fig. 5.4.10. XRD patterns of nontronite reaction-cell experiments with and withoutbacteria. a) Air dried, b) heated to 80°C, c) heated to 120°C and d) heated to 160°C.
14,12Å14,02Å
25000
20000
15000
10000
5000
25000
20000
15000
10000
5000
2 7 12°2 Theta
2 7 12
°2 Theta2 7 12
°2 Theta
2 7 12
°2 Theta
25000
20000
15000
10000
5000
25000
20000
15000
10000
5000
air dried
sterile
bacteriacontaining
sterile
bacteriacontaining
80°C 24h
sterile
bacteriacontaining
120°C 24h
sterile
bacteriacontaining
160°C 24h
9,90,Å9,93,Å11,29Å
11,08Å
15,19Å
14,92Å
b)a)
d)c)
0 0
00
Slight differences in d-values in the range of 0.1Å are observed at 80 and 120°C which,
although small, might indicate minor contamination with organic matter in the case of the
bacteria-containing sample. As organic molecules are usually relatively large, they are not
likely to be present in the interlayer space but as coatings that restrict the dehydration, as seen
in the bacteria-containing sample. The identical d-values after heating to 200°C exclude
artefacts such as different sample thickness. Another possibility is that the enhanced layer
charge leads to a more vermiculite-like behaviour as they generally loose their water later
than smectites and have collapse at temperatures more than 600°C (MacEwan &Wilson,
1980).
Texture characterization of montmorillonite (MX80)
The reaction-cell derived MX80 samples were prepared as texture samples, without
separating the clay fraction. No differences are visible in the diffraction pattern of the sterile
and bacteria MX80 samples (Fig. 5.4.11). The d-values are very similar for the (001)
reflections at 12.58Å and 12.56Å, respectively (see Fig.4.11b). At a relative humidity
between 42 and 45%, these d-spacings still correspond to montmorillonite with predominantly

Chapter 5 - Bacterial influence on smectite hydration _______________________________________________________________________________________________________________
144
Na as the interlayer cation (MacEwan &Wilson, 1980). The presence of bacteria in those
samples did not lead to significant exchange of interlayer cations.
Fig. 5.4.11. a) XRD patterns of montmorillonite (MX80 sample) measuredas air dried texture slides prepared from the sterile (grey) and bacteriacontaining (black) reaction-cells. The numbers in brackets indicate the orderof diffracting basal planes (00l series of montmorillonite) and theircorresponding d-values in Å. b) Enlarged image of the (001) reflection. Thenumbers in italics indicate the relative air humidity (RH) during measurement.
a)10000
8000
6000
4000
2000
02 10 18 26 34 5042
b)
4 6 8
RH 45%RH 42%
(001)~12,6
°2 Theta
B12,56ÅS
12,58Å
(002)~6,3
(003)~4,2
(004)~3,15
(001)-reflection
The effect of heat treatment on the material is shown in Fig. 5.4.12. Compared to the air
dried samples (Fig. 5.4.12a), the heat treated preparations show a strong decrease in intensity
and both peaks shift to lower d-values (9.74Å for the sterile and 9.69Å for the bacteria-
containing sample already after 80°C). Successive heating up to 200°C showed no significant
changes (table 5.4.6.) The collapse of the structure to ~ 9,7Å after heating lies between the
typical values for Na+ (9.6Å) and Ca2+ (9.8Å) in the interlayers, indicating the probable
presence of both cations. In case of MX80, the bacteria had no effect on the properties of the
montmorillonite and no intercalation of any organic compounds is visible.

Chapter 5 - Bacterial influence on smectite hydration _______________________________________________________________________________________________________________
145
Fig. 5.4.12. a) XRD patterns of montmorillonite (MX80) measured as air driedtexture slides prepared from the sterile (S, grey, RH 45%) and bacteria containing(B, black, RH 42%) reaction-cells. b) XRD patterns of the collapsed interlayerstructure after heat treatment (24h 80°C).
sterile
bacteriacontaining
a)10000
0
2000
4000
6000
8000
2 7 12°2 Theta
air dried
S12,58Å
B12,56Å
sterile
bacteriacontaining
0
500
1000
1500
2000
2500
3000
3500
2 7 12
°2 Theta
b) 80°C 24h
S9,74Å
B9,69Å
Table 5.4.6. XRD peak characteristics (001 reflection) of MX80 montmorillonite after various chemical and physical treatments.
Sterile reaction-cell sample Bacteria containing reaction-cell sample
d-value (Å)
Intensity (cps)
FWHM° d-value (Å) Intensity (cps)
FWHM°
Air dried 12.58 6969 1.247 12.56 8016 1.190 Ethylene glycol 16.91 7195 0.520 16.87 7837 0.509
80°C 9.74 1397 0.808 9.69 1466 0.777 120°C 9.70 1409 0.764 9.69 1470 0.778 160°C 9.69 1447 0.751 9.63 1521 0.733 200°C 9.67 1505 0.762 9.67 1603 0.749
5.4.2.3. Chemistry of solution extractions
The long-term effect of bacteria on the solution chemistry was measured on solution
extractions. Therefore, aliquots of samples taken from the reaction-cell experiments were
dispersed in a leaching solution (water and/or HCl) and measured with ICP-OES. The relative
contribution of experimental solutions, infiltrated during the reaction-cell experiments, to the
leaching solution was calculated. Significant values are only visible for K+, which contributes
with ~10mg/l (table 5.4.7). As well, cations contained in the Millipore© water used for
extraction contribute to the measured concentrations with 0.84mg/l Mg contained in the
purified water. All other cations in the solution derive mainly from the clay and/or bacteria, if
present.

Chapter 5 - Bacterial influence on smectite hydration _______________________________________________________________________________________________________________
146
Table 5.4.7. Contribution of experimental solutions (minimal medium in the case of nontronite and salt solution in the case of MX80) to cationic content of leaching solutions.
Ion nontronite (MM) montmorillonite (salt solution) Millipore water
Composition [mg/l]
contribution to leaching [mg/l]
Composition [mg/l]
contribution to leaching [mg/l]
Na 46 1.01 0.25 5.5E-3 0.11 K 486 10.7 180 3.96 0.147
Mg 24 0.53 0.837 Ca 20 0.44 20 0.44 2.2
Nontronite
The absolute values for cation release into water are shown in Fig. 5.4.13a for both the
bacteria containing and bacteria free nontronite (initial experimental solution was MM).
Compared to the sterile control the cation contents are enhanced when bacteria are present
(e.g. 7.9% more Al3+ with 329 vs. 303mg/l, 10.5% more Ca2+ with 467 vs. 418mg/l and 6.7%
more Fetot with 675 vs. 630mg/l). The exception is the silica, which is not present to a
significantly higher amount (285mg/l with bacteria and 284 mg/l in the sterile sample). In
order to estimate the cation release in terms of dissolution, the values are displayed
normalized to a theoretical stoichiometric dissolution of 10% (Fig. 5.4.13b). Positive values
indicate a higher cation release, negative values a lower cation release and zero would
indicate 10% dissolution. Al3+, Ca2+ and total iron are released into solution to a higher
amount than the reference. All three cations are enhanced when bacteria are present. Si, in
contrast, is barely found in solution (value corresponds to ~ 1.4% of mineral dissolution).
Fig. 5.4.13. Concentration of cations leached into solution of samplestaken from nontronite reaction-cell experiments (with and withoutbacteria). a) Absolute concentrations, b) normalized to 10% ofstoichiometric cation release (zero line).
0
100
200
300
400
500
600
700
Al Ca Fe Si
Cation
with bacteriawithout bacteria
a)
Cation
b)
10%0
300
Al Ca Fe
Si
700
- 300
- 700
- 1100

Chapter 5 - Bacterial influence on smectite hydration _______________________________________________________________________________________________________________
147
Metal cations were also measured in the acid extract that, due to the low pH, allows them
to stay in solution and not to precipitate as insoluble oxides. Fig 5.4.14 shows the cations
released into acid compared to water. Al is enhanced to 42-47% and Fe to 52-58% and, in
both cases, the amount of cations is higher when bacteria are present. Additionally, the
difference between the biotic and abiotic release is more pronounced. In HCl, the bacteria
induced release is enhanced by a factor of ~1.19-1.21 for Al and Fe relative to the sterile
control, whereas in water, the difference is by a factor of 1.08-1.07 for Al and Fe,
respectively. As the experiments were running over a long time period, the Al and the Fe
were, in all probability, precipitated at earlier stages (the presence of Al-sulfate and Fe-
phosphate was detected in XRD patterns). The HCl treatment dissolved these precipitates and
therefore the amount of Al can be taken as an indicator of the amount of clay dissolution for
there are no other sources for this element in these samples (corresponding dissolution of
23.1% which is 3.7% more than for the sterile sample with 19.4%).
Fig. 5.4.14. A comparison between the concentrations ofcations extracted from nontronite using water (solid lines)and HCl (dashed lines). The results show higher cationiccontent for HCl leaching especially for Fe. Generallybacteria containing samples (grey columns) release morecations into solution than bacteria free (white columns).
0
1000
200
400
600
800
1200
1400
1600
1800
Al Fe
Cation
with bacteria
without bacteria
with bacteria HCl
without bacteria HCL
In the nontronite structure, Al is situated in tetrahedral sites and partially substitutes Si
(responsible for the layer charge deficiency). It is not likely that only the Al sites are
dissolved, thus the Al should represent the true dissolution of the tetrahedral lattice even when
Si is detected to a lesser extent. Fe in solution is sensitive to redox state and it is described

Chapter 5 - Bacterial influence on smectite hydration _______________________________________________________________________________________________________________
148
separately. Nevertheless, it is visible that the total Fe concentration in acid is enhanced and
always present in higher amounts when bacteria are present.
Montmorillonite (MX80)
Cation release of the long-term MX80-montmorillonite sample into Millipore© water is
shown in Fig. 5.4.15a for both the bacteria containing and the sterile sample. Generally, the
difference between the biotic and abiotic samples is less pronounced compared to the
nontronite. No difference is visible for Al, which is generally not found in high amounts
(around 38mg/l in both cases). The interlayer cations Na and Ca are typically released to a
higher extent in both cases and are slightly less in the presence of bacteria with 2% less Na
(450 vs. 469mg/l) and Ca (393 vs. 401mg/l). The only cation that is released into water to a
higher amount in the presence of bacteria is Fe, with an enhanced concentration of about 8%
(71 vs. 65mg/l).
0
300
CationAl Fe
100
200
400
500
Ca Na Si
with bacteriawithout bacteria
0
500
-200
250
-400
Al
Ca Fe
Si
Na
Cation
with bacteriawithout bacteria
a) b)
3%
Fig. 5.4.15. Concentration of cations leached into solution of samples takenfrom the MX80 montmorillonite reaction-cell experiments (with and withoutbacteria). a) Absolute values obtained from ICP-OES analyses. b) Normalizedto 3% stoichiometric cation release (zero line).
Fig. 5.4.15.b shows the relative amounts of cations released into solution normalized to a
3% stoichiometrical release as a reference (represented by the zero line). Positive values are
basically obtained for the interlayer cations Ca, and Na. Fe is also shows positive values
(correspond to 5% dissolution). Low concentrations are obtained for Al and Si indicating a
true dissolution of less than 1% with a stable Si/Al ratio (~2.5 as opposed to initial 2.7).
Cation release into HCl (Fig. 5.4.16.) shows, however, higher values for Al when bacteria are

Chapter 5 - Bacterial influence on smectite hydration _______________________________________________________________________________________________________________
149
present. The Si/Al ratio (Si not shown in plot) shifts to 1.3, indicating a higher release of Al
into solution. Fe is enhanced as well in the acid leaching when bacteria are present. This
indicates that the bacterial effect on metal release into solution is masked by precipitation
(precipitation of green rust and lepidocrocite visible in XRD patterns) and is only seen in high
pH extracts. Other cations show no significant differences with HCL.
Fig. 5.4.16. Comparison between the concentrations ofcations extracted from montmorillonite using water (solidlines) and HCl (dashed lines). The results show highercationic content for HCl leaching analysis of bacteriacontaining montmorillonite samples. Without bacteria(white columns) the values are comparable to the waterextracts.
with bacteria
without bacteriawith bacteria HClwithout bacteria HCL
0
100
20
40
60
80
Al FeCation
Like in nontronite, the interlayer cations in montmorillonite are easily released in solution.
Even the enhanced amount of Al in the acid leaching indicates that maximal dissolution does
not exceed 1.4%. Fe is released to a higher amount and might be as well derived from the
traces of the pyrite contained in the samples, as sulfate measurements suggest this to some
extent (data not shown). Generally, the MX80 structure seems to be less affected by the
experiments than the nontronite, especially visible by the low amount of Si and Al dissolved.
5.4.2.4. The role of Fe-reduction under confined volume conditions
Fig 5.4.17 shows the Fe(II) production measured in HCl extractions of samples taken
from the reaction-cell experiments with and without bacteria. These are compared to values
taken from Andrade et al.(2002) and Kim et al. (2003; 2004) for initial Fe(II) values (empty
dotted column) and from Kim et al. (2004) for final values after clay bacteria interaction
(filled dotted column). Both confined volume samples show, relative to the initial content of
0.21mmol/g, enhanced Fe(II) concentrations. In the bacteria containing sample, the amount of
Fe(II) is enhanced with 0.57mmol vs. 0.47 in the sterile control. This value is relatively low

Chapter 5 - Bacterial influence on smectite hydration _______________________________________________________________________________________________________________
150
compared to batch experiments conducted by Kim and co-workers (2004) that yielded
1.2mmol/g. Expressed in % of reduced iron relative to the total iron content (4.3mmol/g, table
5.4.8), the bacteria containing sample indicates a reduction of 13.4%. However, already the
anaerobic conditions induced a partial reduction that is visible for the sterile control sample.
Fig. 5.4.17. Measured Fe(II) values for reaction-cellextractions (solid lines) with and without bacteria. Dottedcolumns represent values taken from the literature, whichshow initial Fe(II) concentration (empty column) and thatafter clay-bacteria interaction in batch experiments (Kimet al. 2004, striped column).
Fe(II)
0.70
1.40
0
without bacteriawith bacteria
Kim et al. 2004:inatural in itial Fe(II) contentFe(II) content after 2 weeks
Fe2O3+FeO [wt %] Fe(III) +Fe(II) [wt%]
Fe tot/g clay [mmol] max. initial Fe (II) [mmol/g]
34.2 23.9 4.3-4.5** 0.21*
Table 5.4.8. Theoretical iron content of the nontronite sample (NAu-1) as described by Keeling et al. (2000),*Andrade et al. (2002); Kim et al.( 2004) and **O’Reilly et al.(2005).
In order to quantify the amount of Fe(II) that can be attributed to bacterial activity, the
difference relative to the sterile controls is plotted in Fig. 5.4.18 for the bacteria containing
reaction-cell and two batch experiments. Positive values indicate enhanced, and negative
values decreased Fe(II), relative to the sterile controls. The reaction-cell sample (no viable
cells were present at the time of measurement) shows enhanced Fe(II) values with 21.2%,
which is more Fe(II) than the sterile control indicating enhanced iron reduction. This is
different from observations in experiments containing viable cells as seen from the Fe(II)
values of two batch experiments. Both examples show, with respect to the sterile control,
negative values due to Fe-consumption. This is the case for the anaerobic experiment which
has 7.5% less Fe(II) compared to the sterile control (0.27mmol with bacteria and 0.29mmol
without bacteria vs. an initial concentration maximal 0.21mmol/g). This trend is, as expected,

Chapter 5 - Bacterial influence on smectite hydration _______________________________________________________________________________________________________________
151
enhanced for the aerobic sample where Fe(II) is consumed and due to oxygen respiration is
not produced by Fe-reduction.
Fig. 5.4.18. Relative differences in Fe(II) content for the bacteria-containing reaction-cell experiments in % (dark grey column) whennormalized to the sterile control. Anaerobic batch cultures (lightgrey column) and aerobic batch cultures (empty column). The numbersin brackets represent the absolute differences in mmol/g.
30
20
0
-10
10
-20
-30
-40
reaction-cell experiment
batch experiments
anaerobic
aerobic
(0,1mmol/g)
(-0,02mmol/g)
(-0,08mmol/g)
As discussed in Chapter 5.3, the bacteria consume or sorb cations during their growth and,
even if Fe-reduction occurs due to respiration, the released Fe(II) is partly stored by bacteria
or within biofilms. This iron is, therefore, not detected in the analyses as long as the cells are
intact. In the case of the reaction-cell experiments, no viable S. putrefaciens cells were
detected after the 1½ years of experiment, and thereore Fe(II) that was eventually consumed
or attached to cells re-enters the system.
5.4.2.5. Microscopical observations of long-term experiments
During the long-term confined volume experiments, systematic monitoring by microscopy
was not possible however, some limited observations were done after around 7 weeks. An
example is given in Fig 5.4.19a that shows a TEM-microphotograph of bacteria containing
nontronite incubated under confined volume conditions for around 52 days. The kaolinite
standard is present as hexagonal platelets and nontronite is visible as a particle with a
relatively well defined shape in the upper right of the image. The EDX microchemical data
shows the typically high values of Fe (44.4 wt.% Fetot) and Si (57 wt.% SiO) and some Ca
(2.1 wt.% CaO; Fig. 5.4.19b). A bacterial cell showing beginning lyses is present in the left

Chapter 5 - Bacterial influence on smectite hydration _______________________________________________________________________________________________________________
152
part where microchemical analysis shows the presence of S (0.9 wt.% Stot) and Cl (5.3 wt.%),
that is typically associated with the bacteria. Additionally, elements derived from the smectite
such as Si (2.6 wt.% SiO), Ca (2.5 wt.% CaO) and Fe (1.5 wt.% Fetot) are present (Fig.
5.4.19c). Here, it is not clear to what extent the analysis is influenced by the surrounding clay,
or clay that is attached to the cell. However, the relative high values for Ca in comparison to
low values of Si indicate an accumulation of elements on or in the bacterial cell. A gel-like
structure, like previously observed in batch experiments (5.3), was not observed in this
sample.
0,5 µm
Fig. 5.4.19. a) TEM microphotograph of nontronite and S. putrefaciens takenfrom reaction-cell experiment. The size of the bacterium does not exceed0.7µm in length and is partly damaged. b) EDX microanalysis of the nontronitegrain shown in a) contains Si, Al, Fe, Ca and K. c) EDX microanalysis ofthe bacterial cell showing the same cations along with additional S and Cldue to the presence of bacteria. The Cu is derived from the sample grid.
a)
nontronite
kaolinite
bacterium
Si
Fe
Fe
Cu
Cu
Cu
Al P
SK
Ca
c)
b)
It should be noted that imaging bacteria in reaction-cell experiments is difficult as they
are, compared to batch experiments, very small, present in low numbers and normally covered
by clay. However, it can be seen that under this confined volume conditions, S. putrefaciens
survived several weeks (1½ month) and that they consumed most likely cations derived from
the clay.

Chapter 5 - Bacterial influence on smectite hydration _______________________________________________________________________________________________________________
153
5.5. Discussion
5.5.1. The influence of smectite on bacterial activity
The influence of smectite on the bacteria growth is basically a function of the physico-
chemical properties of the clay and the requirements of the bacteria. The basic chemical
necessities for the growth of S. putrefaciens are the supply of nutrients, energy and water in
an environment of moderate pH.
Nutrients & energy
It was shown that microorganisms selectively colonize mineral surfaces that contain
required nutrients indicating that the bacteria clearly profit from their proximity to the solid
surface (Bennett et al., 1996; Rogers et al., 1998; Bennett et al., 2001). This is visible in the
growth experiments where, independently of the type of smectite, S. putrefaciens survived
despite smectite been the only available substrate (Fig. 5.3.1). Additionally, this species is
observed to quickly adapt its metabolism to use smectite as a substrate. This is visible in the
similar lag and exponential growth phase when incubated with nontronite and minimal
medium (MM), where the latter is especially adapted to the needs of S. putrefaciens (Fig.
5.3.1). The continuous supply of cations appears to be particularly beneficial for the culture,
especially those derived from nontronite that providing high amounts of Fe and Ca.
Particluarly important is carbon, which was not supplied in the growth experiments but,
as S. putrefaciens is heterotroph, it does need a source of pre-existing organic materials. Raw
bentonite materials, such as MX80, often contain organic carbon (0.19% Corg, Sauzeat et al.
2000) and, in this case, the Corg values (0.02 and 0.08g/l for a suspension density of 0.01 and
0.04g/ml, respectively) lie between the values of the carbon-rich culture media (> 2g/l) and
the carbon-poor sediments in natural environments (0.001-0.015g/l, Roszak & Colwell,
1987). The amount of carbon in the powdered MX80 bentonite sample might explain why the
number of cfu/ml is enhanced with the increasing clay concentration in solution, for this
enhances the amount of accessory minerals and organic substances (table 3.1).
The purified smectite samples, in contrast, are not expected to contain significant
amounts of Corg because they were (due to grain size separations) washed several times.
Nevertheless, the bacteria were observed to stay alive for significant periods of time (> 4
weeks). One possibility is that during the stationary phase, starved cells release Corg and aid

Chapter 5 - Bacterial influence on smectite hydration _______________________________________________________________________________________________________________
154
the growth of surviving cells (Dean &Hinshelwood, 1966; Postgate, 1976). To a certain
amount, this could recycle the carbon in the system compensating the relative lack in the
purified samples.
The fact that smectites generally have enormous surface areas per gram powder should be
beneficial in solutions because bacteria can stay attached to surfaces that accumulate
nutrients. This is advantageous, especially when nutrients become short in supply and S.
putrefaciens is -despite flagellum- not likely to be very motile in order to economize energy.
Although smectites serve as a substrate for S. putrefaciens, the exposure to the clay
induces stress. Bacteria incubated with smectite were, for example, seen to be drastically
reduced in cell size compared to cultures incubated in growth medium (Fig. 5.3.17). This has
been reported for bacteria in natural environments with limited nutrients that attained larger
sizes when cultured in the laboratory and can be taken as a clear sign for nutrient stress
(Dawson et al., 1981; Roszak &Colwell, 1987). The probable cause of this stress is that
smectite does not contain all the necessary concentrations of nutrients for fully developed
growth. This effect is even more enhanced in the compacted clay under confined volume
conditions although nutrients are present in higher concentrations. In this environment the
high solid liquid ratio clearly restricts the motility of bacteria.
The role of surfaces on nutrient supply
The increase in external surface area observed during the free swelling of smectite in
batch solution provides more opportunities for bacteria to attach to these mineral surfaces.
The osmotic swelling of Na-montmorillonite induces extensive particle delamination along
individual silicate interlayers (Schramm &Kwak, 1982; Lagaly, 1993; , 2006) and therefore
presents additional and freshly exposed external surface area. Additional surface area can be
beneficial for bacterial growth as the reactive surface area is a fundamental factor enhancing
mineral dissolution leading to additional cationic supply (Lasaga, 1995; Nagy, 1995). On the
other hand, the osmotic swelling of Na-montmorillonite can form a colloidal suspension that
is not favourable for bacteria movement because of the strong electrostatic repulsions between
the both negatively charged bacteria and clay surfaces (Fig. 5.5.1). In the presence of divalent
cations, these repulsions can be overcome, as in the nontronite suspension containing
relatively higher concentrations of Ca2+ (Lagaly, 1993; , 2006).
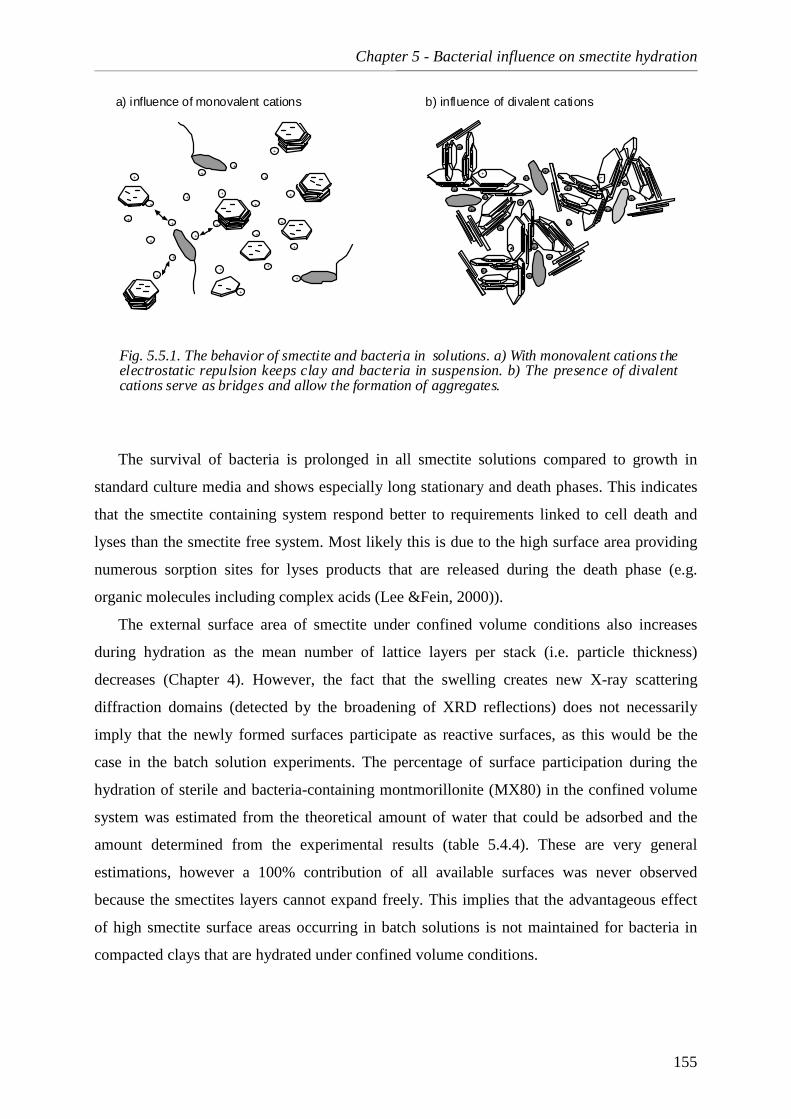
Chapter 5 - Bacterial influence on smectite hydration _______________________________________________________________________________________________________________
155
+
+
+
+
+
+
+
+ +
+
+
+
+
+
+
+
+
+
+
+
+
+
+
a) influence of monovalent cations
+ +
++
++
++
+ +
++
+ +
++
+ +
++
+++ +
+ +
+ +
++
+ +
+ +
+ +
b) influence of divalent cations
Fig. 5.5.1. The behavior of smectite and bacteria in solutions. a) With monovalent cations theelectrostatic repulsion keeps clay and bacteria in suspension. b) The presence of divalentcations serve as bridges and allow the formation of aggregates.
The survival of bacteria is prolonged in all smectite solutions compared to growth in
standard culture media and shows especially long stationary and death phases. This indicates
that the smectite containing system respond better to requirements linked to cell death and
lyses than the smectite free system. Most likely this is due to the high surface area providing
numerous sorption sites for lyses products that are released during the death phase (e.g.
organic molecules including complex acids (Lee &Fein, 2000)).
The external surface area of smectite under confined volume conditions also increases
during hydration as the mean number of lattice layers per stack (i.e. particle thickness)
decreases (Chapter 4). However, the fact that the swelling creates new X-ray scattering
diffraction domains (detected by the broadening of XRD reflections) does not necessarily
imply that the newly formed surfaces participate as reactive surfaces, as this would be the
case in the batch solution experiments. The percentage of surface participation during the
hydration of sterile and bacteria-containing montmorillonite (MX80) in the confined volume
system was estimated from the theoretical amount of water that could be adsorbed and the
amount determined from the experimental results (table 5.4.4). These are very general
estimations, however a 100% contribution of all available surfaces was never observed
because the smectites layers cannot expand freely. This implies that the advantageous effect
of high smectite surface areas occurring in batch solutions is not maintained for bacteria in
compacted clays that are hydrated under confined volume conditions.
Chapter 5 - Bacterial influence on smectite hydration _______________________________________________________________________________________________________________
156
Smectites and pH control
In experiments conducted under aerobic conditions bacteria clearly produce CO2 by
respiring oxygen. According to the simplified reaction below, the aerobic respiration leads to
the production of protons and a decrease in pH:
CO2 (g) + H2O � HCO3- +H+
The influence of aerobic respiration is visible during the initial stages of the batch solution
experiments when a rapid decrease in pH is seen to exceed the normal pH drop caused by
deprotonation at smectite edge sites. The availability of such edge sites buffers and stabilizes
the pH of the solution (Lagaly, 1993; Apelo &Postma, 1994). The closest match to the sterile
control with the quickest pH adaptation was observed in the nontronite solution, which is
probably due to a higher concentration of edge-sites in this <0.5 micron grain size fraction
(Lagaly, 1993). In the case of the coarser polymineralic MX80 bentonite, the pH is buffered
to a lesser extent (Fig. 5.3.3.b). Here, the strong pH decrease within the first two days can be
attributed to dissolution of traces of pyrite, which when oxidized, releases protons (Lowson,
1982; Nordstrom, 1982). In contrast, the more alkaline condition reached once the stable state
was attained (pH ca. 8.6) can be attributed to calcite dissolution leading to OH- production
according to the reaction:
CaCO3 + H2O � Ca2++ HCO3- + OH-
In addition to well documented interaction of clays and H+ ions, the bacterial cell walls
can also become protonated and, thus, influence the measured pH (Haas, 2004; Claessens,
2006). During respiration, cells pump protons into the wall matrix which, in turn, can
protonate surface functional groups and render them electrically neutral (Koch, 1986; Haas,
2004). In contrast, dead cells no longer induce a proton gradient, so the cell wall tends to
become more anionic and capable of accommodating protons (Urrutia et al., 1992). The effect
of these reactions is evident during the later stages of the solution experiments where the pH
of all solutions increases with respect to the sterile control (Fig. 5.3.5). When lysis is
complete, however, the pH returns to the value of the sterile control.

Chapter 5 - Bacterial influence on smectite hydration _______________________________________________________________________________________________________________
157
5.5.2. Physical and chemical influence of bacteria on smectite clay
The effects that bacteria can have on the properties of smectites are closely linked to their
activity and, therefore, their viability. Bacterial activity can directly influence these clays by
consuming mineral derived compounds, aided by the production of organic substances like
chelators or EPS. Respiration has both indirect effects on smectite (solution Eh and pH is
changed) as well as direct effects in the case of anaerobic metal respiration because the layer
charge is changed. Finally, a number of textural effects in smectite powders can be attributed
to bacterial activity, particularly those linked to binding and the formation of particle
aggregates. Here, biofilm can persist long after cell death and have long term textural effects
even after all bacterial activity has ceased.
5.5.2.1. Complexation and binding of potential nutrients and effects on smectite
Nontronite
Fe is the principle cation in the octahedral layers of the mineral nontronite with an
abundance of ca. 34 wt.% (Fetot). It was noted that a bacterial colonization of the mineral
surfaces is a systematic process involving chelators, especially to complex Fe (Rogers
&Bennett, 2004). Fe is an important macronutrient and, as a key component in cytochromes,
it plays a major role in cellular respiration (Madigan et al., 2003). In the batch solution
experiments containing both nontronite and S. putrefaciens, the Fe was clearly depleted with
respect to the sterile control (Fig. 5.3.6). As Fe(III) has a low solubility in water at near
neutral pH and, it should be quickly lost from the aqueous phase and precipitated as oxides
and/or hydroxides. However, when bacteria were present, an enhanced depletion of Fe in the
solution was observed that could be due to iron coatings formed at the bacteria cells surface
(Ehrlich, 1999; Coby &Picardal, 2005).
Additionally, the production of iron binding ligands (siderophores) could aid the
formation of Fe-complexes localized on the cell where they are available for transport into the
cell (Birkel et al., 2002; Faraldo-Gomez &Sansom, 2003). Such binding ligands are reported
to be formed in abundance during active exponential growth (Kalinowski et al., 2000) and
have been described for the S. putrefaciens strain used in this study (Gram, 1994). As
siderophores are usually produced in Fe(III)-limiting conditions, the high Fe content of
nontronite (Fetot ~34 wt.%) might at first glance be considered unsuitable for the formation of

Chapter 5 - Bacterial influence on smectite hydration _______________________________________________________________________________________________________________
158
Fe binding ligands. However, the metal in the octahedral sites is only slowly released.
Moreover this “potentially” available iron might induce the production of chelating agents as
it was described for Pseudomonas mendocina strains where only in presence of Fe-oxides the
production of iron chelators was enhanced (Hersman et al., 1995; Hersman et al., 2000).
Independent of organic ligands is the depletion of Ca in nontronite suspensions. As water
hydrates the interlayer sites and interlayer cations become highly reactive, undergo rapid
exchange with the infiltrating solution (Banfield &Hamers, 1997; Barker et al., 1997) and
become available for bacterial adsorption (Stotzky, 1966a). This effect is visible in nontronite
solution experiments where the presence of bacteria was observed to rapidly deplete the
concentration of Ca in solution (Fig. 5.3.6). Investigations with TEM coupled with EDX
microanalyses indicate that smectite derived Ca is concentrated in or on S. putrefaciens cells
(e.g. Fig. 5.3.17.). This was also observed for the MX80 montmorillonite, although the
amount of interlayer Ca was relatively low compared to nontronite.
The concentration of Ca at bacterial surfaces may simply occur by electrostatic forces. As
a divalent cation, Ca has a relatively high affinity to be strongly adsorbed on bacterial
surfaces and was described by Beveridge (1989) for Bacillus subtilis as “binding”. Since both
bacteria cells and smectite surfaces are (at near neutral pH) negatively charged, the Ca can
help to bridge the equally charged surfaces, particularly in solution of higher ionic strength
where the thickness of the diffuse ion layer is suppressed (Ellwood et al., 1982; Banfield
&Hamers, 1997).
Because the electrostatic mechanism of Ca binding is only active as long as the bacteria
cells are intact, cations should be reintroduced into the system when cells undergo lyses.
However, this is not observed and Ca stays continuously depleted in solution even when cells
are dead (Fig. 5.3.6). Precipitations associated with Ca (e.g. calcite) were not detected, which
could explain the depletion, but abundant EPS were visible both by confocal and electron
microscopy (Fig. 5.3.11, 5.3.12 and 5.3.16a). As the EPS are seen to persist after cell death
(e.g. Fig. 5.3.12c), the prolonged storage of Ca in the EPS is likely and helps at the same time
to stabilize the biofilm structure (Körstgens et al., 2001; Konhauser, 2007). However, longer
term experiments of 1 ½ years length showed enhanced values of virtually all cations (Fig.
5.4.13). This indicates that even the biofilm structure decomposes with time and the sorbed
elements are indeed eventually remobilized.

Chapter 5 - Bacterial influence on smectite hydration _______________________________________________________________________________________________________________
159
5.5.2.2. Effects of bacterial respiration on smectite
As discussed above, aerobic respiration can affect the properties of smectites by leading
to a decrease in pH that is known to be the major factor concerning mineral dissolution rates
(Lasaga, 1995; Nagy, 1995; Barker et al., 1997). This pH decrease is visible in batch solution
experiments during the initial stages even though values that would significantly contribute to
dissolution (e.g. a pH lower than 5 and higher than 9, Blum & Lasaga (1988)) were only
temporally observed (e.g. MX80, Fig. 5.3.3.).
Effects of respiration on nontronite
Under anaerobic confined volume conditions oxygen is not available and another terminal
electron acceptor (TEA) is required. S. putrefaciens is capable of reducing the Fe(III) that is
contained in the nontronite structure and induces significant alteration of this mineral as
shown in the various studies using batch cultures (agitated low solid to liquid ratio
experiments). Dissimilatory Fe(III) reduction in the octahedral sites modifies the charge
imbalance, resulting in higher layer charge and stronger cation fixation (Stucki et al., 1987;
Stucki et al., 2003; Kim et al., 2004; Stucki &Kostka, 2006). These factors are closely linked
to interlayer hydration characteristics and should be taken into account. In other studies, the
bacterially-induced reduction of Fe was described to occur both before and after mineral
dissolution (Dong et al., 2003a; O'Reilly et al., 2006).
Indications of a layer charge increase due to Fe-reduction in the confined volume
nontronite experiments are provided from XRD texture preparations of Mg-exchanged and
glycerol saturated samples. The low (001) basal d-spacing (14.25Å) of these samples
indicates higher layer charges equivalent to those of vermiculite swelling clays (Fig. 5.4.9).
The sterile control sample also showed lower basal d-spacings (14.64Å) indicative of an
increased layer charge that are caused by the anaerobic conditions, however, the degree of
alteration is less intensive. Fe-reduction is also visible in the chemical results where the
production of Fe(II) is detected in both bacterial and sterile conditions (Fig. 5.4.17). The
relative increase of Fe(II) due to bacterial respiration and Fe reduction is probably linked to
partial dissolution of the nontronite particles. However, the values for reduced iron are
relatively low for the confined volume experiments because i) the reaction rate is low (high
solid to liquid ratio without agitation) and ii) the clay restricts the movement of the bacteria.
Fe-reduction only takes place under anaerobic conditions and most oxygen poor environments
are compacted, confined volume systems with high solid to liquid ratios, such as soils,
aquifers and engineered systems like waste repositories. The constraints presented from the

Chapter 5 - Bacterial influence on smectite hydration _______________________________________________________________________________________________________________
160
reaction-cell laboratory analogue are considered to provide more useful estimates for
predicting the rates of Fe-reduction under repository conditions than those based on batch
solution experiments,
5.5.2.3. Bacterially induced dissolution of nontronite
Both the described mechanisms of complexation/binding and bacterial respiration have
recognisable effects on the nontronite. Moreover the presence of specific organic ligands is
known to trigger the overall dissolution of minerals and could be an explanation of the partial
dissolution of nontronite (Banfield &Hamers, 1997; Barker et al., 1997; Kostka et al., 1999;
Banfield &Welch, 2000). Clear signs of this bacterially induced dissolution are visible by the
relative Si-depletion in nontronite when compared to the sterile control (Fig. 5.3.7). The rapid
dissolution and the release of Si are most obvious during the initial stages of the solution
experiments. Microscopic investigations reveal the formation of a Si rich amorphous phase
surrounding nontronite particles (Fig. 5.3.16). This relationship suggests partial mineral
dissolution followed by precipitation when the system is supersaturated with respect to silicic
acid. These observations are in accordance with recently published observations on
nontronite-S. oneidensis interaction by Furukawa & O’Reilly (2007). The nontronite samples
may however contain a certain amount of quartz even in the <0.5µm fraction (Keeling et al.,
2000) and it is possible that these small grains dissolve rapidly and precipitate as an
amorphous phase. In this case, the Si is not only derived from the tetrahedral sites of the
smectite.
In Fig. 5.5.2, a schematic representation illustrates the overall effect that bacteria have
on nontronite. At unstable edge sites Fe(III) is mobilized and most likely trapped by orgainic
ligands that keep the iron in solution (5.5.2a). At the same time Ca in released from the
interlayer sites and serves as bridges between the bacteria and the clay, and thus facilitating
the access (5.5.2b). The complexed Fe is transported to the cells and might be either
transported into the cell or be present as coatings on the surface. Increasing dissolution of the
nontronite leads to Si-release that is precipitated in the EPS associated with the smectite and
the bacteria.

Chapter 5 - Bacterial influence on smectite hydration _______________________________________________________________________________________________________________
161
nontronite
catecholate
Fe(III)-siderophorecomplex
SiFe(III)Ca
Fe(III)
R
R R
( -1)
(-1)
(-1)+ 3H
+
+
H2SiO4 aq
SiO2 amorph
Si4+
+
basal nontronite surface
R
R
+
OHO
Fe(III)
Fig. 5.5.2. Schematic sketch showing the interaction of nontronite and S. putrefaciens at the latticelayer scale. a) Octahedrally coordinated Fe(III) is mobilized at unstable edge sites and the Ca frominterlayer sites is released into solution. Bacterially produced ligands (here catecholate) formsiderophore complexes with Fe(III) as the central cation (modified after Konhauser, 2007). b) Calciumacts as a bridge between clay and bacteria. The complex is transported to the cell, the Fe(III) isdismantled and reduced or is involved in the formation of Fe(III)-coatings at the cell surface. As thecomplexation leads to continuous dissolution, Si is released and precipitated as amorphous silica,which is presumably associated with EPS.
a)
H2O
b)
S. putrefaciens
EPS?
Fe (I II )
R
R R
(- 1)
(-1)
( -1) Fe(II) +e-
Ca+
+Ca+
+ Ca+
+
Ca++
Ca2+
Tetrahedrally coordinated Al is also depleted from nontronite during initial stages of the
batch solution experiments but it re-enters the solution during the final phase. Al is, like Fe,
known to form bridges between bacterial cells and Si, as it was reported for B. subtilis by Fein
and co-workers (2002). It is therefore likely that the metals are partly associated with active
cells and released when the cells die. The relative depletion of Si and Al observed at the
beginning of the experiment and the re-introduction into the system during the decline of the

Chapter 5 - Bacterial influence on smectite hydration _______________________________________________________________________________________________________________
162
bacteria population confirms this as a possible mechanism. Analyses of the long term
confined volume experiments also show enhanced Al release in the (formerly) bacteria –
containing sample, which confirms that dissolution mechanisms are also dominant. Unlike Si,
no other source of Al exists in these samples. As both the S. putrefaciens cells and associated
biofilm are not likely to persist the 1½ year’s period of experimentation, any adsorbed or
bound cations are re-introduced into the system.
5.5.2.4. Textural alteration
Whereas chemical alteration was basically observed in bacteria containing nontronite,
textural alteration is observed for both nontronite and montmorillonite (MX80) sample. The
interaction of bacteria and smectite is known to be an aggregate forming process, particularly
when associated with EPS production (Jaisi et al., 2007). Such mechanisms of aggregate
formation are confirmed by microscopic investigations of the smectite-in-solution
experiments where EPS are seen to be closely associated with the clustering and attachment
of both bacteria and clay particles (cp. Fig. 5.3.12 and 5.3.13). Other indicators of particle
aggregation are seen in the confined volume experiments where the basal intensities of
smectite X-ray diffraction peaks are consistently lower in the presence of bacteria indicating
poor particle orientation.
Both in compacted MX80 and nontronite clay, the presence of bacteria appear to create
additional local porosity. In nontronite this additional pore space leads to a reduced ordering
of the water layer structures (Fig. 5.4.3). Such fluctuations in stacking probabilities might
represent unsystematic heterogeneities in water supply caused by bacterial water uptake. In
contrast, the sterile sample shows a more systematic pattern indicating hydration of layers in
clusters, as documented by the abiotic experiments (Chapter 4). For MX80, the effects are
even more pronounced with enhanced water intake and the formation of thicker water layer
structures that require more volume (Fig. 5.4.2). As packing densities are the same in MX80
experiments, the additional space is attributed to bacterial activity that causes i) formation of
aggregates due to organic matter and clay interaction and ii) new porosity due to lyses.
Additionally, the dissolution of accessory minerals in MX80 may contribute to additional
pore space. A schematic representation is given in Fig. 5.5.3. During initial stages of
hydration the bacteria are present in pore spaces and attached to mineral surfaces via binding
cations (Fig. 5.5.3a). As the smectite hydrates and the pores get closed the bacteria are likely
to produce EPS in order to protect themselves (5.5.2b). With increasing compaction the

Chapter 5 - Bacterial influence on smectite hydration _______________________________________________________________________________________________________________
163
bacteria die and disintegrate providing additional porespace, whereas the EPS remains, is
associated with aggregates and accumulates cation (Fig. 5.5.3c).
Fig. 5.5.3. Bacteria in confined volumeconditions. a) Directly after closing thereaction cell the bacteria occupy open poresbetween mineral grains and aggregates. b)Pores are closed due to increased swellingduring smectite hydration. Exudates ofbacteria cause aggregation in their vicinity.c) After lyses of bacteria, newly formedporosity becomes available for additionalswelling.
++
++
++
++
++
++ ++++
a) b)
c)
++
++++
++++
++
The amount of new pore space created by lyses should, however, not be overestimated.
Simplifying the bacteria to be a water-filled prolate spheroid with an average dimension of
2*0.5*0.5µm (size of a femtoliter, fl) one bacterium can be estimated to have a volume of ca.
0.26µm3. The resulting increase in porosity occurs in the dimension of nanoliters and is,
therefore, not of a magnitude to be detected in the methods applied. The breakdown of the
cells alone does not contribute significantly to the porosity and it is more likely that a
combination of aggregation, cell death and mineral dissolution are the main factors enhancing
the available pore spaces (see biomineralization in appendix).
5.5.3. Concluding remarks
Generally, it is noted that the interaction between S. putrefaciens and smectite is very
complex and several mechanisms are observed that depend on a number of physical and
chemical variables. In the case of nontronite, the mineral properties are altered whereas for
montmorillonite, the observed changes concern more the spatial organization and
microstructure, but provoke no chemical alteration.

Chapter 5 - Bacterial influence on smectite hydration _______________________________________________________________________________________________________________
164
Batch experiments containing larger volumes of solution and lower proportions of clay
clearly do show increased reaction rates and hence a more advanced state of reaction process.
This type of study enhances knowledge of bacteria-smectite-solution interactions, allowing
recognition of specific mechanisms and the fate of smectite derived cations. Basic
mechanisms, such as complexation and binding, are likely to operate in compacted clays
hydrated in confined volume conditions and the precise kinetics of these reactions under such
conditions are more applicable to underground waste repositories. Therefore the reduced rates
of reactions derived from the confined volume experiments are considered to be much more
useful for predictive modeling of compacted clay systems.

___________________________________________________________________________
CHAPTER 6
-
IMPLICATIONS OF SMECTITE
HYDRATION IN BIOTIC AND
ABIOTIC ENVIRONMENTS
___________________________________________________________________________

Chapter 6 - Implications of smectite hydration in abiotic and biotic environments _______________________________________________________________________________________________________________
166
CHAPTER 6 IMPLICATIONS OF SMECTITE HYDRATION IN ABIOTIC AND BI OTIC
ENVIRONMENTS
6.1. Environmental processes and the importance of laboratory analogue experiments
The approach of studying environmental processes at and close to the Earth’s surface
classically combines direct investigations of natural systems, laboratory experiments and
numerical modelling. As experiments conducted in the laboratory can be closely monitored
and controlled, qualitative and quantitative data are provided which help constrain selected
processes and aid our understanding of larger scale, complex natural and engineered systems
(Wogelius &Vaughan, 2000). Laboratory experiments can therefore provide useful analogues
that simulate the key processes operating in natural systems.
In this study, a flow-through reaction-cell (known as a “wet-cell”) was successfully
applied to study the progressive hydration of compacted swelling clays during the infiltration
of aqueous solutions under confined volume conditions. This experimental setup is suggested
to provide a useful analogue for predicting hydration behaviour in an underground waste
repository site, where bentonite (smectite-rich) clays are likely to be used as a low
permeability seal. Many of the conditions expected to occur in the underground repository
were simulated in the experiments, including i) a range of high solid to liquid ratios, ii)
hydration under anaerobic conditions and iii) both abiotic and biotic (bacteria containing)
systems as well as both diffusive and advective mechanisms of transport. This approach was
combined with the more traditional batch experimental approach required to study low solid
to liquid ratios and agitated systems.
From the results of this thesis, it is evident that the hydration mechanisms dominant in
batch experiments are not necessarily active in the confined volume state. This aspect is often
ignored in many published studies (Komine, 2004; Komine &Ogata, 2004). For example, the
hydration of Na-montmorillonite is dominated by osmotic swelling in solutions of low
electrolyte concentration (Lagaly, 1993; , 2006) whereas, under confined volume conditions,
the space for expansion is significantly limited and therefore the interlayer distance required
for tactoid formation (>20Å) is difficult to achieve. Based on the results obtained with the
reaction-cell experiments it can be stated that the phenomenon of osmotic swelling is only
locally observable and the majority of Na-smectite undergo restricted expansion associated

Chapter 6 - Implications of smectite hydration in abiotic and biotic environments _______________________________________________________________________________________________________________
167
with the build up of swelling pressure. Local osmotic swelling in Na-smectite is likely to
occur by gel formation in open pores. This process is of importance because gels lead to
lower hydraulic conductivity and will also influence the rate and nature of elemental transport
(Pusch, 2001b; Pusch, 2006b). Here, an important aspect is the connectivity of such gels that
might facilitate diffusive transport (Pusch &Weston, 2003) Additionally, in contrast to
smectite particles, gels are isotropic and, thus, transport is independent of the fabric. Such
gels also readily form aggregates when in contact with solutions of elevated ionic strength
(Fig. 4.3.2.) or in presence of bacterial exudates, as discussed in Chapter 5 (e.g. Fig. 5.3.11
and Fig. 5.4.4.c+d). These kind of textural changes are clearly seen to enhance permeability
and the storage of external (non-interlayer) water in many of the experiments conducted.
Another important point is that the activity of bacteria is notably different for compacted
smectite under confined volume conditions when compared to freely dispersed smectite in
batch solution. It was observed that smectites in batch solutions have numerous beneficial
effects on bacterial growth and survival. These effects are linked to their composition and
exchange properties of key elements that are important for bacteria (Fig. 5.3.1, table 6.1).
Some cations (e.g. Ca and Fe) act as nutrients whereas Fe(III) additionally, serves as terminal
electron acceptor (TEA) for respiration. In the case of bentonites, the accessory minerals are
also dissolved and contribute to the nutrient supply, such as pyrite (in MX80) that serves as a
source for both Fe and S.
Other important properties of smectite aiding bacterial growth are: their variable edge
charge, which can buffer the pH of the solution, and the high specific surface area that is
available to adsorb toxic waste derived from metabolic activity (Dean &Hinshelwood, 1966;
Postgate, 1976; Roszak &Colwell, 1987). However, in compacted clays, hydrated under
confined volume conditions, the effects of buffering and/or adsorption are probably not the
most significant factors influencing bacterial growth on the local scale (table 6.1). The results
presented here indicate that the restricted transport properties of the compacted clay are the
largest inhibiting factor. In the hydrating state, the available pore space becomes so
restricted, and probably disconnected, that the bacteria become immobile and cannot access
distant nutrients. In such a state, the bacteria-clay contacts become the principle sites of
nutrient transfer, once the cations in the surrounding pore water have been depleted. Another
factor leading to a decrease in the rate of transport within hydrating clay is the decreasing rate
of water inflow when the sample reaches its saturation state. At the beginning of a clay
hydration, water is drawn in relatively rapidly by suction (adhesive and cohesive properties of
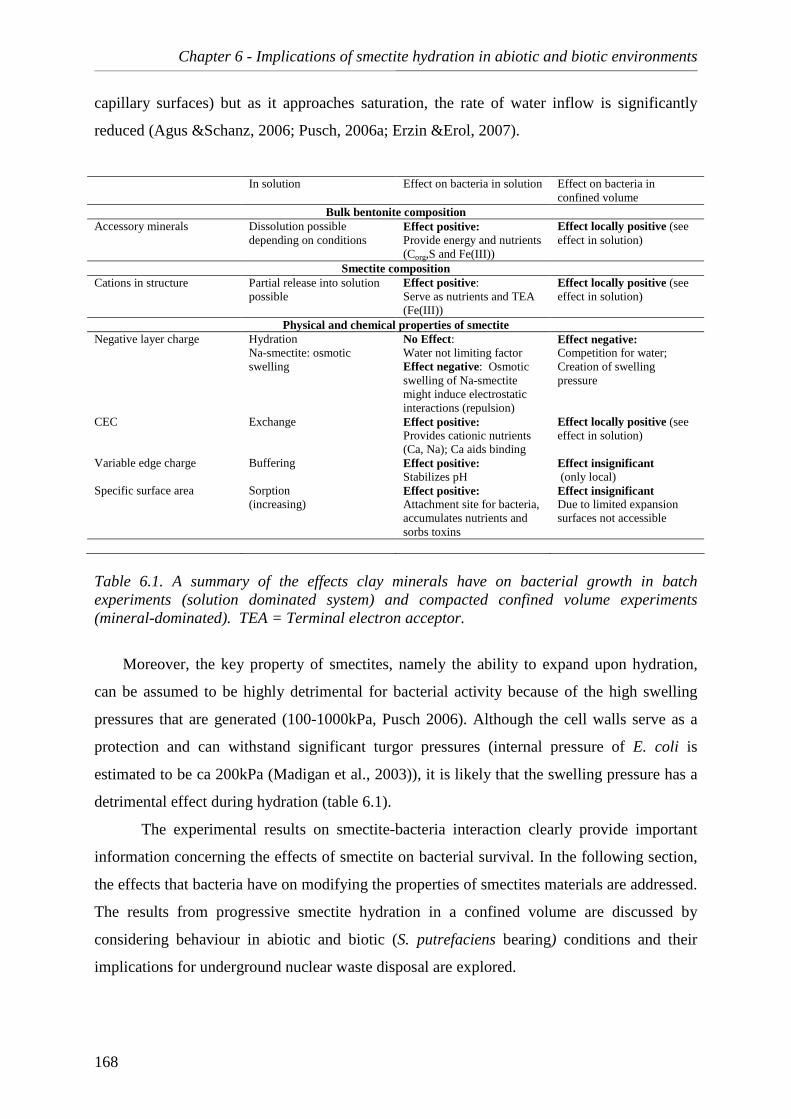
Chapter 6 - Implications of smectite hydration in abiotic and biotic environments _______________________________________________________________________________________________________________
168
capillary surfaces) but as it approaches saturation, the rate of water inflow is significantly
reduced (Agus &Schanz, 2006; Pusch, 2006a; Erzin &Erol, 2007).
In solution Effect on bacteria in solution Effect on bacteria in confined volume
Bulk bentonite composition Accessory minerals Dissolution possible
depending on conditions Effect positive: Provide energy and nutrients (Corg,S and Fe(III))
Effect locally positive (see effect in solution)
Smectite composition Cations in structure Partial release into solution
possible Effect positive: Serve as nutrients and TEA (Fe(III))
Effect locally positive (see effect in solution)
Physical and chemical properties of smectite Negative layer charge Hydration
Na-smectite: osmotic swelling
No Effect: Water not limiting factor Effect negative: Osmotic swelling of Na-smectite might induce electrostatic interactions (repulsion)
Effect negative: Competition for water; Creation of swelling pressure
CEC Exchange Effect positive: Provides cationic nutrients (Ca, Na); Ca aids binding
Effect locally positive (see effect in solution)
Variable edge charge Buffering Effect positive: Stabilizes pH
Effect insignificant (only local)
Specific surface area Sorption (increasing)
Effect positive: Attachment site for bacteria, accumulates nutrients and sorbs toxins
Effect insignificant Due to limited expansion surfaces not accessible
Table 6.1. A summary of the effects clay minerals have on bacterial growth in batch experiments (solution dominated system) and compacted confined volume experiments (mineral-dominated). TEA = Terminal electron acceptor.
Moreover, the key property of smectites, namely the ability to expand upon hydration,
can be assumed to be highly detrimental for bacterial activity because of the high swelling
pressures that are generated (100-1000kPa, Pusch 2006). Although the cell walls serve as a
protection and can withstand significant turgor pressures (internal pressure of E. coli is
estimated to be ca 200kPa (Madigan et al., 2003)), it is likely that the swelling pressure has a
detrimental effect during hydration (table 6.1).
The experimental results on smectite-bacteria interaction clearly provide important
information concerning the effects of smectite on bacterial survival. In the following section,
the effects that bacteria have on modifying the properties of smectites materials are addressed.
The results from progressive smectite hydration in a confined volume are discussed by
considering behaviour in abiotic and biotic (S. putrefaciens bearing) conditions and their
implications for underground nuclear waste disposal are explored.

Chapter 6 - Implications of smectite hydration in abiotic and biotic environments _______________________________________________________________________________________________________________
169
6.2. Application of confined volume experiments: constraints for backfill hydration
The key requirement that an underground repository has to fulfil is to eliminate the risk
of radionuclide transport from nuclear waste to the biosphere (OECD, 1999; ANDRA, 2005;
OECD, 2006; Pusch, 2006a; 2006b). A smectite based material is considered to be suitable as
backfill, basically, because of its properties that are dependent on the hydration capacity
namely the i) low hydraulic conductivity, ii) the self sealing capacity and iii) a low diffusion
and transport capacity for radionuclides (Pusch, 2006b). As discussed in Chapter 4, the
hydration of smectite and related characteristics involves water retention on a range different
scales and this should be taken into account when evaluating possible detrimental effects on a
bentonite backfill. Table 6.2 compiles the main mechanisms of hydration as a function of
different scales and summarizes the observed biotic and abiotic effects.
Å-scale: layers
nm-scale:particles
µm/mm-scale:clusters andbulk texture
m-scale: barrier
Basic mechanism
upon hydration Abiotic effects Biotic effects
Na-
montmorillonite Ca-
montmorillonite Na-
montmorillonite Ca-nontronite
Solvation of interlayer cations leads to
interlayer hydration and
expansion
High ionic strength led to formation of thicker WL structures because of increased porosity
High ionic strength
compresses diffuse double layer around IL cations leading to thinner WL
structures
Enhanced interlayer
expansion due to increased porosity
Partial dissolution and changes in layer
charge
Number of layers per particle
decreases and external surfaces might be formed
(less than in open systems)
Higher packing density restricts
particle separation
No effect visible
Decreased number of layers per particle due
to increased porosity
Decreased sorption capacity
if partially dissolved
Expansion of particle-clusters and formation of gels lead to the closure of pore
space
High ionic strength causes
gels to aggregate and to increase
porosity Increased
packing leads to closure of pores
Not determined
Bacterial induced
formation of aggregates creating
additional porosity
Bacterial induced
formation of aggregates and
partial clay dissolution
Possible effects on a bentonite barrier
- HC lower than Ca-smectite - HC increased by ionic strength
- HC higher than Na-smectite - generally less affected by solution chemistry
- self sealing capacity disturbed by formation of aggregates -transport facilitated by enhanced porosity
-HC enhanced by chemical alteration (layer charge) - transport facilitated by dissolution and formation of aggregates
Table 6.2. Compilation of bentonite clay backfill properties and possible abiotic and biotic effects as a function of scale. IL = Interlayer water WL = Water layer HC = Hydraulic conductivity.

Chapter 6 - Implications of smectite hydration in abiotic and biotic environments _______________________________________________________________________________________________________________
170
6.2.1. Predicting the rates of clay barrier saturation
The low hydraulic conductivity is one of the key properties of bentonites and it is
essential that it is maintained when applied as a back fill material (Hermann-Stengele
&Plötze, 2000; Karnland &Sandén, 2000; Pusch, 2006b; Pusch et al., 2007). This property is
basically a consequence of the interlayer hydration that leads to particle expansion, which
results in the closure of the available pore space. The pathways for solution transport are thus
restricted on all scales as indicated by the vertical arrow in table 6.2. The major control on
interlayer hydration appears to be the type of smectite used, and in particular the hydration
energy of interlayer cation present, which controls the amount and rate of interlayer water
uptake (Norrish, 1954; MacEwan &Wilson, 1980; Montes-Hernandez et al., 2003a). For
example, compared to Na-smectite the uptake for Ca-smectite was observed to be more rapid
and thicker hydrated interlayers were formed (e.g. Fig. 4.3.3, Fig. 4.3.12). The slow hydration
rate in the case of Na-smectites revealed that the interlayer hydration is, in turn, highly
dependant on the initial porosity because water that is entering the confined volume reaction-
cell is first accommodated in pores that then serve as reservoir to fill the interlayer space
(4.3.4. c+d, 4.3.10a). During the later stages of hydration, interlayers were seen to be the
dominant storage site for water in all Na-smectite dominated systems providing a constant
low hydraulic conductivity when infiltrated with water of a low ionic concentration.
In contrast, despite the higher hydration energy of Ca, water in Ca-activated bentonite
was predominantly stored as external water (surface- and pore water) and not within
interlayers. This behaviour is attributed to the differences in the microstructure on the
aggregate and bulk texture scale whereby the thicker particles of Ca-smectite yield an
enhanced porosity. This porosity is reduced during interlayer swelling, but is not completely
sealed due to the absence of osmotically driven swelling and local gel formation as in Na-
smectites (Chapter 4, fig. 4.4.3). Changes in the textural properties of Na-smectite clays are
intimately linked with the enhancement of saturation velocity during the infiltrations of
solutions with elevated ionic strength (Chapter 4, fig. 4.3.13). Such an enhancement can be
attributed to the aggregation of clay particles, combined with the suppression of osmotic
swelling. Despite these effects, the total amount of structured interlayer water taken in during
hydration is still enhanced in the case of Na-smectite compared to Ca-smectite, whereas the
quantity of external water (surface- and pore water) is relatively reduced (Chapter 4, fig.
4.3.13 b+d). This is the main reason Na-smectite that shows lower rates of water saturation
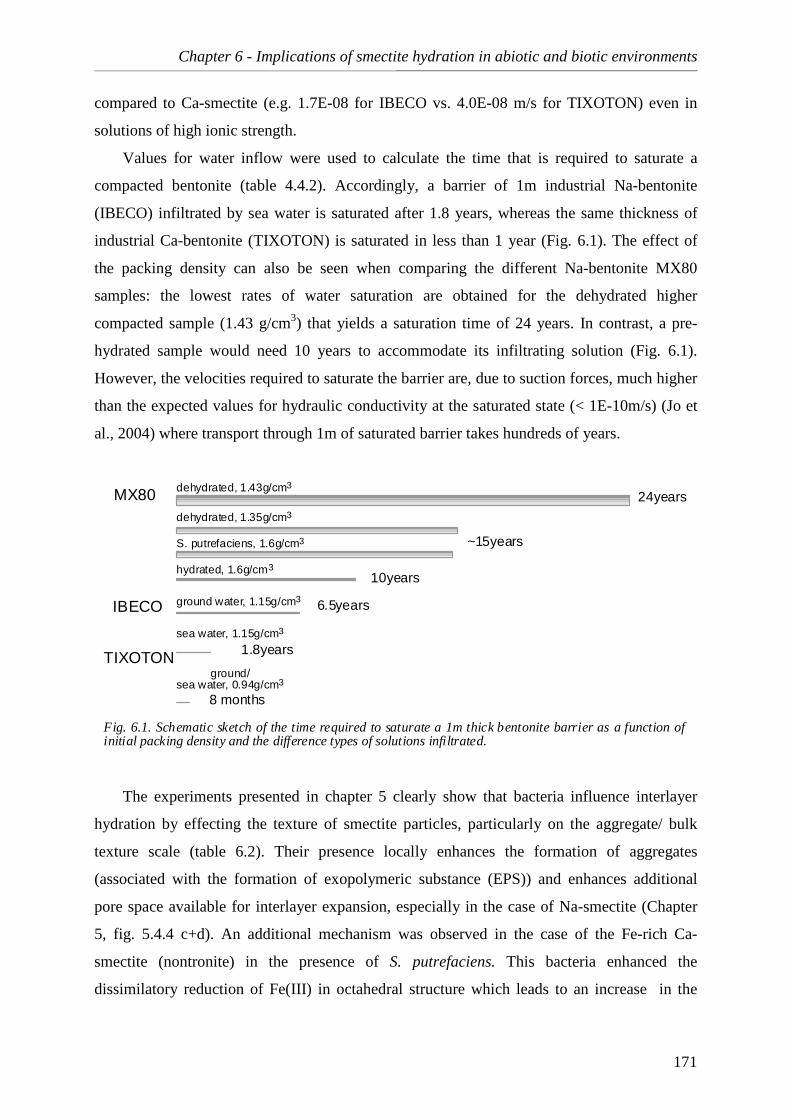
Chapter 6 - Implications of smectite hydration in abiotic and biotic environments _______________________________________________________________________________________________________________
171
compared to Ca-smectite (e.g. 1.7E-08 for IBECO vs. 4.0E-08 m/s for TIXOTON) even in
solutions of high ionic strength.
Values for water inflow were used to calculate the time that is required to saturate a
compacted bentonite (table 4.4.2). Accordingly, a barrier of 1m industrial Na-bentonite
(IBECO) infiltrated by sea water is saturated after 1.8 years, whereas the same thickness of
industrial Ca-bentonite (TIXOTON) is saturated in less than 1 year (Fig. 6.1). The effect of
the packing density can also be seen when comparing the different Na-bentonite MX80
samples: the lowest rates of water saturation are obtained for the dehydrated higher
compacted sample (1.43 g/cm3) that yields a saturation time of 24 years. In contrast, a pre-
hydrated sample would need 10 years to accommodate its infiltrating solution (Fig. 6.1).
However, the velocities required to saturate the barrier are, due to suction forces, much higher
than the expected values for hydraulic conductivity at the saturated state (< 1E-10m/s) (Jo et
al., 2004) where transport through 1m of saturated barrier takes hundreds of years.
dehydrated, 1.43g/cm3
ground water, 1.15g/cm3
ground/sea water, 0.94g/cm3
S. putrefaciens, 1.6g/cm3
MX80dehydrated, 1.35g/cm3
hydrated, 1.6g/cm3
IBECO
sea water, 1.15g/cm3
TIXOTON
24years
~15years
10years
6.5years
1.8years
8 months
Fig. 6.1. Schematic sketch of the time required to saturate a 1m thick bentonite barrier as a function ofinitial packing density and the difference types of solutions infiltrated.
The experiments presented in chapter 5 clearly show that bacteria influence interlayer
hydration by effecting the texture of smectite particles, particularly on the aggregate/ bulk
texture scale (table 6.2). Their presence locally enhances the formation of aggregates
(associated with the formation of exopolymeric substance (EPS)) and enhances additional
pore space available for interlayer expansion, especially in the case of Na-smectite (Chapter
5, fig. 5.4.4 c+d). An additional mechanism was observed in the case of the Fe-rich Ca-
smectite (nontronite) in the presence of S. putrefaciens. This bacteria enhanced the
dissimilatory reduction of Fe(III) in octahedral structure which leads to an increase in the
Chapter 6 - Implications of smectite hydration in abiotic and biotic environments _______________________________________________________________________________________________________________
172
layer charge (Chapter 5, fig. 5.4.9 and fig. 5.4.17). As the layer charge is responsible for
interlayer hydration, Fe-reduction would be expected to be highly detrimental for the sealing
capacity of the backfill clay and could lead to enhanced rates of water uptake and higher rates
of elemental transport. However, in the confined volume experiments these effects were not
observed because the bacterially induced Fe-reduction was only locally active. Contrarily, the
rate of hydration was seen to be decreased when bacteria were present (7.9E-09 vs. 9.3E-08
m/s), which could be caused by the clogging effects of EPS or other organic substances.
A scenario that would be highly detrimental to the sealing capacity of the clay barrier
would be substantial smectite dissolution. This is most evident in the Fe-rich Ca-smectite
(nontronite) batch reactions (high solution content) (Chapter 5, fig. 5.3.16) and to a lesser
extent in compacted material hydrated under confined volume conditions (see section
5.5.2.4.) Such a material is, generally, not considered to be used as backfill but it is likely to
form by solution alteration of bentonite in contact with the steel (Fe) containers (Wilson et al.,
2006). According to the obtained results, the partial alteration of smectite in the presence of
Fe-reducing bacteria could decrease the hydration capacity of this material considerably if
bacterial action is sustained over significant periods of time. However, the extent of of Fe-
reducing bacteria activity is likely to be less significant on a repository scale compared to
small-scaled laboratory experiments where relatively high populations of bacteria were
introduced. Less abundant bacterial populations are certainly expected to be characteristic of
the saturated underground backfill. Because the bacteria are not mobile under such conditions,
they are not considered to survive or evolve over long periods of time (Pedersen, 2000;
Pedersen et al., 2000). Any detrimental effects induced by the presence of bacteria would only
occur in permeable, open portions of a bentonite barrier, such as along microcracks caused
during hydration-dehydration cycles (Montes-Hernandez et al., 2003b). In such sites,
bacterially-induced dissolution could become an important contributing mechanism to the
breakage of the bentonite seal.
To summarize, the rate of water uptake is a function of a range of multi-scale hydration
mechanisms that are highly dependent on the type of smectite. Because of microstructural
characteristics, Ca-smectite exhibit higher rates of hydration but these types of clays are
notable less sensitive to changes in solution chemistry. Bacterially induced textural and
chemical alteration has the potential of enhancing the rates of water uptake whereas EPS
production appears to aid the sealing of smectite based material.

Chapter 6 - Implications of smectite hydration in abiotic and biotic environments _______________________________________________________________________________________________________________
173
6.2.2. Diffusion and transport capacity for radionuclides
Because of the restricted hydraulic conductivity it is generally assumed that diffusion
controlled processes are dominant in compacted bentonite (Bors et al., 1997; Molera et al.,
2003; Pusch, 2006b). As cations can be more easily fixed on the negatively charged clay
surfaces it is further assumed that anion diffusion will be more operative (Oscarson et al.,
1994) including the transport of anionic forms of long-lived radionuclides such as 129I and 99Tc (Molera et al., 2003). Both adsorption of cation and anion diffusion processes are largely
controlled by the availability of sorption sites and are present on the hydrated surfaces and
edges of smectite clays. Therefore, quantifications of the water budget, stored in interlayers
on surface and within pore spaces provide here some useful constraints. During hydration, it
was observed that the external surface area increases but to a lesser extent when the packing
density is increased. In the case of dehydrated and compacted MX80 bentonite, surface
calculations based on the decrease of layers per stack led to a value of around 80m2/g at a
packing density of 1.43g/cm3; this is half the surface area than the less compacted sample
(1.35g/cm3, Chapter 4). It is clear from these results that any modeling requiring an estimation
of smectite surface area should consider that this variable is highly dependent on the state of
hydration.
6.3. Limitations of the study: challenges for further research
This study aimed to simulate the hydration of compacted smectite under confined volume
conditions and to characterize, by in situ XRD measurements both biotic and abiotic effects.
Experiments were designed to constrain the importance of a range of initial characteristics,
such as packing density and initial hydration state as well as experimental conditions such as
different infiltrating solutions and the presence or not of bacteria. The packing densities
studied was restricted to the range of 0.94-1.6g/cm3, and therefore the state of compressed
bentonite blocks (> 1.8g/cm3), that are especially developed to maximize sealing, were not
tested. This provides scope for further in situ hydration experiments. In the same way, the
effects of hydration-dehydration cycles, occurring during solution inflow and subsequent
drying, could also be investigated using the reaction-cell approach, as these effects are only

Chapter 6 - Implications of smectite hydration in abiotic and biotic environments _______________________________________________________________________________________________________________
174
well documented in conditions of varying humidity (Montes-Hernandez et al., 2003a;
Montes-Hernandez et al., 2003b). Additionally further study on the effects of varying solution
chemistry is possible as there are important constrains required on the rates of mineral
dissolution in compacted smectite when influence by the percolation of more corrosive acid
and alkaline solutions (Bauer &Velde, 1999; Bauer et al., 2001).
The influence of bacteria was simplified by studying only one “model” species
Shewanella putrefaciens. These are well studied bacteria capable of respiring in both aerobic
and anaerobic conditions and have the important ability of reducing Fe(III) and modifying the
crystal-chemistry of Fe-smectite (Kostka et al., 1996; Gates et al., 1998; Kim et al., 2004;
Stucki &Kostka, 2006). However in natural and engineered systems, it is clear that such
monocultures do not exist and bacteria coexist in consortia that are better adapted. For
example, in the industrial available MX80-bentonite several species arenaturally present and
can be cultivated from the dry powder. These include spore-forming genera and species such
as Bacillus subtilis, Bacillus cereus and Brevibacillus brevis as well as desiccation-resistant
species such as Pseudomonas stutzeri (Pedersen, 2000). Additional bacteria species will be
introduced via the ground water (Meike &Stroes-Gascoyne, 2000). As a result of this natural
diversity, it is an enormous challenge to study the role of these indigenous consortia in
influencing the hydration behaviour and transport properties of the smectite-based bentonite
seal.
A general limitation in applying the results of laboratory experiments is the problem of
extrapolating over the long time period that underground waste repositories should remain
sealed (1Ma) which is determined by the long lifetime of certain radionuclides (Madsen,
1998; OECD, 1999; , 2006; Pusch, 2006b). Taking into account that this is about the time
span between the first occurrence of fossil hominids and today, gives an impression about the
“controllability” of a repository site (Asfaw et al., 2002). Therefore, continuous and careful
research is essential and should not aim to provide quick solutions to complex problems.

___________________________________________________________________________
GENERAL
CONCLUSIONS
___________________________________________________________________________

General Conclusions ______________________________________________________________________________________________________________________________________________________________________________________________________________________________
176
GENERAL CONCLUSIONS
• The reaction-cell (“wet-cell” device) employed in this study, developed by Warr &
Hoffman (2004) provides an efficient laboratory analogue for monitoring in situ the
hydration of compacted smectite clays in percolating solution. The confined volume
nature of this reaction cell is considered to simulate more closely the conditions
smectite clays will experience in an engineered underground waste repository site.
This experimental setup was successfully applied to investigate smectite hydration in
both abiotic and biotic (bacteria containing) conditions by in situ X-ray diffraction
study, combined with gravimetric measurement with minimal disturbance of the
sample set up.
• Combining XRD-peak calculations by using the CALCMIX software (Plançon
&Drits, 1999) plus water vapour adsorption data (Cases et al., 1992; Bérend et al.,
1995; Cases et al., 1997; Jänchen et al., 2006) allowed successful quantification of the
amount of water stored in both interlayer and non-interlayer (surface and pore) sites
(Warr &Berger, 2007). Additionally, the changes in particle thickness were calculated
and qualitatively used to estimate changes in smectite surface area during hydration.
As these analytical results are time dependent, based on up to 25 measurements per
experiment, the dynamic changes in hydration state could be well defined.
• The combination of classical microbiological and mineralogical methods (viable cell
counts, XRD, SEM, TEM and ICP-OES) was successfully applied to study S.
putrefaciens and smectite interaction under conditions of varying solution to mineral
ratios (including variable agitated batch reactors.
• In compacted Na-smectite powders, hydration proceeded first by saturating external
sites (surface- and pore water) and then by redistributing this water into interlayer
sites. Knowledge of water storage as a function of solution chemistry and as packing
density is important for predicting smectite hydration in underground bentonite
backfill and to assess barrier performance in terms of the rate of water inflow, sealing
capacity and sorption and/or transport of radionuclides. Additional constraints for the
numerical modeling of material transport are provided based on the experimentally

General Conclusions ______________________________________________________________________________________________________________________________________________________________________________________________________________________________
177
determined mechanisms and on the rates of water intake and dynamic changes in the
textural and surface properties of the clay minerals.
• The process of bulk clay hydration occurs at different scales, ranging from the
Angstrom (lattice-layer) to the bulk (micron to mm) structure, including particles,
clusters of particles and arrangements of clusters (aggregates). The hydration
mechanism on the lattice scale is mostly influenced by the type of interlayer cation
present, whereas the bulk texture of the material is largely affected by the ionic
strength of the infiltrating solution.
• S. putrefaciens grown in smectite suspensions showed enhanced numbers in colony
forming units and prolonged survival compared to growth in standard culture medium
(LB and minimal media). This beneficial effect is attributed to the sustainable supply
of cationic nutrients, organic carbon, the buffering capacity of clay minerals, and their
large surface areas that accumulate nutrients, serve as attachment sites and adsorb
toxic waste. In the biotic systems, the pH was seen to depend on the growth phase,
with a lower pH observed during the initial stages (lag and exponential phase). This is
attributed to proton production during anaerobic respiration. In contrast, during the
final stages (the death phase) of growth, more alkaline pH values are observed that is
related to the reduced buffering of the bacterial cells and the release of lyses products.
• The rate of bacterially induced smectite alteration/dissolution in batch solutions, as
monitored by ICP-OES, showed depletion of the main cations in the nontronite
extracted solution. This is attributed to the initial consumption and/or binding of
cations by S. putrefaciens. Constant depletion of Ca occurs, most likely, due to the
production of EPS. The release of other cations during the later stages of the batch
experiments is attributed to cell lyses. When compared to the sterile control, the
compacted smectites within the confined volume reaction-cell showed enhanced
cation release in bacteria-containing nontronite solutions. This was especially evident
for Fe values after acid leaching and it corresponded to partial dissolution of
nontronite as confirmed by TEM coupled to EDX. This dissolution was observed to be
closely associated with the formation of Si-rich gels and EPS. Characterization of the
reaction products from confined volume experiments showed the presence of redox
sensitive phases and an enhanced layer charge for nontronite due to Fe(III) reduction.
Solutions extracted from the MX80 bentonite experiments showed less difference
between bacteria containing and sterile samples. The increased release of Al by acid
leaching corresponds to a maximal of 1.4% partial smectite dissolution.

General Conclusions ______________________________________________________________________________________________________________________________________________________________________________________________________________________________
178
• The presence of S. putrefaciens caused abundant textural changes, as observed by
microscopic investigations (confocal microscopy, ESEM) associated with the
formation of smectite-aggregates and biofilm. In confined volume conditions, the
presence of bacteria in Na-smectite clay was seen to enhance both the uptake of
interlayer water and the amount of externally stored surface- and pore water. In this
type of compacted smectite, an increase in the total thickness of hydrated interlayers
occurs due to bacterial enhancement of sample porosity (XRD and CALCMIX). In the
case of nontronite, additional water was stored as external water indicating a similar
enhancement of porosity but, here, the rate of water inflow into the reaction cell
decreases in the presence of S. putrefaciens indicating the probable clogging of the
pores by biofilm. The presence of these bacteria during nontronite hydration also led
to a decrease in the ordering of water layers indicating increased heterogeneities.
• The interaction between S. putrefaciens and the different types of smectites tested
clearly encourages the growth of bacteria in clay solutions. Their role in providing a
cationic nutrient supply, energy sources and reactive mineral surfaces are linked to the
key smectite properties that are most active in free swelling environments. However,
under confined volume conditions these effects are significantly limited by the
hindered mobility of bacteria and the buildup of swelling pressures. The most
detrimental effects occurred in the nontronite clay because of chemical alteration most
likely triggered by chelators and other bacterially produced substances.
Concerning the possible application of bentonites as backfill material, it can be concluded
that the bacteria, present during the initial stages of water inflow, will certainly influence the
hydration behaviour and modify the properties of the clay barrier, especially by bacterially
produced substances that reside after the cells death (chelators, EPS). Therefore, although it is
generally considered that bacteria might not survive in a hydrating bentonite (except in the
form of spores), their presence should be taken into account when predicting the hydration
and sealing properties of smectite-based material. In order to study bacteria–mineral
interactions, in both natural and engineered systems, an interdisciplinary approach and the
understanding of multi-scale processes are essential to design and control safer clay barrier
systems.

___________________________________________________________________________
RÉFÉRENCES
___________________________________________________________________________

References ______________________________________________________________________________________________________________________________________________________________________________________________________________________________
180
Agus, S. S. and T. Schanz (2006). Drying, wetting, and suction characteristic curves of a bentonite-
sand mixture. Geotechnical Special Publication. ANDRA (2005). Dossier 2005 - Argile, Andra, France. Andrade, S., R. Hypolito, H. H. G. J. Ulbrich and M. L. Silva (2002). "Iron(II) oxide determination in
rocks and minerals." Chemical Geology 182(1): 85-89. Aouad, G. (2006). Influence de Pseudomonas aeruginosa sur la degradation de silicates: incidence sur
la stabilite de matrices de confinement de dechets et d'un machefer industriel. Ecole st Observatoire des Science de la Terre UMR7517. Strasbourg, Université Louis Pasteur: 137.
Aouad, G., J. L. Crovisier, V. A. Geoffroy, J. M. Meyer and P. Stille (2006). "Microbially-mediated glass dissolution and sorption of metals by Pseudomonas aeruginosa cells and biofilm." Journal of Hazardous Materials 136(3): 889-895.
Apelo, C. and D. Postma (1994). Geochemistry Groundwater and Pollution. Rotterdam, Balkema. Asfaw, B., W. H. Gilbert, Y. Beyene, W. K. Hart, P. R. Renne, G. WoldeGabriel, E. S. Vrba and T. D.
White (2002). "Remains of Homo erectus from Bouri, Middle Awash, Ethiopia." Nature 416(6878): 317-320.
Bailey, S. W. (1980). Structure of Layer Silicates. In: Crystal Structures of Clay Minerals and their X-Ray Identification. G.W. Brindley and G. Brown. London, Mineralogical Society. 5: 1-125.
Banfield, J. F. and R. J. Hamers (1997). "Processes at minerals and surfaces with relevance to microorganisms and prebiotic synthesis." Reviews in Mineralogy 35: 116-122.
Banfield, J. F. and S. A. Welch (2000). Microbial controls on the mineralogy of the environment. In: Environmental Mineralogy. David J. Vaughan and R.A. Wogelius. Budapest, Eotvos University Press. 2: 173-196.
Barker, W. W., S. A. Welch and J. F. Banfield (1997). "Biogeochemical weathering of silicate minerals." Reviews in Mineralogy 35: 419-428.
Barker, W. W., S. A. Welch, S. Chu and J. F. Banfield (1998). "Experimental.observations of the effects of bacteria on aluminosilicate weathering." American Mineralogist 83(11-12 PART 2): 1551-1563.
Bauer, A., T. Schäfer, R. Dohrmann, H. Hoffmann and J. I. Kim (2001). "Smectite stability in acid salt solutions and the fate of Eu, Th and U in solution." Clay Minerals 36(1): 93-103.
Bauer, A. and B. Velde (1999). "Smectite transformation in high molar KOH solutions." Clay Minerals 34(2): 259-273.
Bennett, P. C., F. K. Hiebert and W. J. Choi (1996). "Microbial colonization and weathering of silicates in a petroleum-contaminated groundwater." Chemical Geology 132(1-4 SPEC. ISS.): 45-53.
Bennett, P. C., J. R. Rogers, W. J. Choi and F. K. Hiebert (2001). "Silicates, silicate weathering, and microbial ecology." Geomicrobiology Journal 18(1): 3-19.
Bérend, I., J. M. Cases, M. François, J. P. Uriot, L. Michot, A. Masion and F. Thomas (1995). "Mechanism of adsorption and desorption of water vapor by homoionic montmorillonites: 2. The Li+, Na+, K+, Rb+ and Cs+- exchanged forms." Clays & Clay Minerals 43(3): 324-336.
Bergaya, F. and G. Lagaly (2006). Chapter 1 General Introduction: Clays, Clay Minerals, and Clay Science. In: Developments in Clay Science. F. Bergaya, B.K.G. Theng and G. Lagaly, Elsevier. Volume 1: 1-18.
Beveridge, T. J. (1989). Metal ions and bacteria. In: Metal ions and bacteria. R.D. TJ Beveridge. New York, Wiley: 1-29.
Bickmore, B. R., D. Bosbach, M. F. Hochella Jr, L. Charlet and E. Rufe (2001). "In situ atomic microscopy study of hectorite and nontronite dissolution: Implications for phyllosilicate edge surface structures and dissolution mechanisms." American Mineralogist 86(4): 411-423.
Birkel, U., G. Gerolg and J. Niemeyer (2002). Abiotic reactions of organics on clay mineral surfaces. In: Developments in Soil Science. A. Violante, P.M. Huang, J.M. Bollag and L. Gianfreda. Amsterdam, Elsevier. 28A: 437-448.
Blum, A. and A. Lasaga (1988). "Role of surface speciation in the low-temperature dissolution of minerals." Nature 331(6155): 431-433.

References ______________________________________________________________________________________________________________________________________________________________________________________________________________________________
181
Bonneville, S., P. Van Cappellen and T. Behrends (2004). "Microbial reduction of iron(III) oxyhydroxides: effects of mineral solubility and availability." Chemical Geology 212(3-4): 255-268.
Bors, J., A. Gorny and S. Dultz (1997). "Sorption Characteristics of Radioiodide on Organophilic Bentonite." Radiochimica Acta 78(1): 117-121.
Bosbach, D., L. Charlet, B. Bickmore and Hochella M.F, Jr. (2000). "The dissolution of hectorite: In-situ, real-time observations using atomic force microscopy." American Mineralogist 85(9): 1209-1216.
Bourg, I. C., A. C. M. Bourg and G. Sposito (2003). "Modeling diffusion and adsorption in compacted bentonite: a critical review." Journal of Contaminant Hydrology 61(1-4): 293-302.
Bowman, J. P. (2005). Genus XIII. Shewanella. In: Bergey's Manual of Systematic Bacteriology. D.J. Brenner, N.R. Krieg, J.T. Stanley and G.M. Garrity. New York, Springer: 480-491.
Bradbury, M. H. and B. Baeyens (2003). "Porewater chemistry in compacted re-saturated MX-80 bentonite." Journal of Contaminant Hydrology 61(1-4): 329-338.
Bradley, W. F., R. E. Grim and G. F. Clark (1937). "A study of the behavior of montmorillonite on wetting." Z. Kristallogr. 97: 260-270.
Bray, H. J., S. A. T. Redfern and S. M. Clark (1998). "The kinetics of dehydration in Ca-montmorillonite: An in situ X-ray diffraction study." Mineralogical Magazine 62(5): 647-656.
Brigatti, M. F., E. Galan and B. K. G. Theng (2006). Chapter 2 Structures and Mineralogy of Clay Minerals. In: Developments in Clay Science. F. Bergaya, B.K.G. Theng and G. Lagaly, Elsevier. Volume 1: 19-86.
Bright, J. J. and M. Fletcher (1983). "Amino acid assimilation and respiration by attached and free-living populations of a marine Pseudomonas sp." Microbial Ecology 9(3): 215-226.
Brown, C. M., D. C. Ellwood and J. R. Hunter (1977). "Growth of bacteria at surfaces: Influence of nutrient limitation." FEMS Microbiology Letter 1(3): 163-166.
Brown, G. and G. W. Brindley (1984). Crystal Structures of Clay Minerals and their X-Ray Identification. London, Mineralogical Society.
Cases, J. M., I. Bérend, G. Besson, M. François, J. P. Uriot, F. Thomas and J. E. Poirier (1992). "Mechanism of adsorption and desorption of water vapor by homoionic montmorillonite. 1. The sodium-exchanged form." Langmuir 8(11): 2730-2739.
Cases, J. M., I. Bérend, M. François, J. P. Uriot, L. J. Michot and F. Thomas (1997). "Mechanism of adsorption and desorption of water vapor by homoionic montmorillonite: 3. The Mg2+, Ca2+, Sr2+ and Ba2+ exchanged forms." Clays and Clay Minerals 45(1): 8-22.
Chipera, S. J. and D. L. Bish (2001). "Baseline studies of the clay minerals society source clays: Powder X-ray diffraction analyses." Clays and Clay Minerals 49(5): 398-409.
Chipera, S. J., J. W. Carey and D. L. Bish (1997). Controlled-humidity XDR analyses: application to the study of smectite expansion/contraction. In: Advances in X-ray Analysis. J. Gilfrich. New York, Plenum Press. 39: 713-722.
Claessens, J. W. (2006). Surface chemistry and acid-base activity of Shewanella putrefaciens: Cell wall charging and metal binding to bacterial cell walls. Earth Science-Geochemistry. Utrecht, Utrecht University: 127.
Coby, A. J. and F. W. Picardal (2005). "Inhibition of NO3 - and NO2 - reduction by microbial Fe(III) reduction: Evidence of a reaction between NO 2 - and cell surface-bound Fe2+." Applied and Environmental Microbiology 71(9): 5267-5274.
Collins, D. R., A. N. Fitch and C. R. A. Catlow (1992). "Dehydration of vermiculites and montmorillonites: a time-resolved powder neutron diffraction study." Journal of Material Chemistry 2(8): 865-873.
Corliss, J. B., J. Dymond and L. I. Gordon (1979). "Submarine thermal springs of the Galapagos Rift." Science 203: 1073-1083.
Cuadros, J. and S. P. Altaner (1998). "Characterization of mixed-layer illite-smectite from bentonites using microscopic, chemical, and X-ray methods: constraints on the smectite-to-illite transformation mechanism." American Mineralogist 83(7-8): 762-774.
Cui, Y. J., M. Yahia-Aissa and P. Delage (2002). "A model for the volume change behavior of heavily compacted swelling clays." Engineering Geology 64(2-3): 233-250.

References ______________________________________________________________________________________________________________________________________________________________________________________________________________________________
182
Dawson, M. P., B. A. Humphrey and K. C. Marshall (1981). "Adhesion: A tactic in the survival strategy of a marine vibrio during starvation." Current Microbiology 6(4): 195-199.
Dean, A. C. R. and C. N. Hinshelwood (1966). Growth, funktion and regulation in acterial cells. Oxford, Claredon Press.
Delage, P., M. D. Howat and Y. J. Cui (1998). "The relationship between suction and swelling properties in a heavily compacted unsaturated clay." Engineering Geology 50(1-2): 31-48.
Delay, J., A. Vinsot, J. M. Krieguer, H. Rebours and G. Armand (2007). "Making of the underground scientific experimental programme at the Meuse/Haute-Marne underground research laboratory, North Eastern France." Physics and Chemistry of the Earth 32(1-7): 2-18.
DiChristina, T. J., R. G. Arnold, M. E. Lidstrom and M. R. Hoffmann (1988). "Dissimilative iron reduction by the marine eubacterium Alteromonas putrefaciens strain 200." Water Science and Technology 20(11-12): 69-79.
Dong, H., J. K. Fredrickson, D. W. Kennedy, J. M. Zachara, R. K. Kukkadapu and T. C. Onstott (2000). "Mineral transformation associated with the microbial reduction of magnetite." Chemical Geology 169(3-4): 299-318.
Dong, H., J. E. Kostka and J. Kim (2003a). "Microscopic evidence for microbial dissolution of smectite." Clays and Clay Minerals 51(5): 502-512.
Dong, H., R. K. Kukkadapu, J. K. Fredrickson, J. M. Zachara, D. W. Kennedy and H. M. Kostandarithes (2003b). "Microbial reduction of structural Fe(III) in illite and goethite." Environmental Science and Technology 37(7): 1268-1276.
Drits, V., J. Srodon and D. D. Eberl (1997). "XRD measurement of mean crystallite thickness of illite and illite/smectite: Reappraisal of the Kubler index and the Scherrer equation." Clays and Clay Minerals 45(3): 461-475.
Drits, V. A., D. D. Eberl and J. Srodon (1998). "XRD measurement of mean thickness, thickness distribution and strain for illite and illite-smectite crystallites by the Bertaut-Warren-Averbach technique." Clays and Clay Minerals 46(1): 38-50.
Dud'a, R., L. Rejl and D. Slivka (1992). La Grande Encyclopedie des Mineraux. Paris, Librairie Gründ.
Eberl, D. D., R. Nuesch, V. Sucha and S. Tsipursky (1998). "Measurement of fundamental illite particle thicknesses by X-ray diffraction using PVP-10 intercalation." Clays and Clay Minerals 46(1): 89-97.
Ehrlich, H. L. (1996). Geomicrobiology. New York, Marcel Dekker. Ehrlich, H. L. (1999). "Microbes as Geologic Agents: Their Role in Mineral Formation."
Geomicrobiology Journal 16(2): 135 - 153. Ellwood, D. C., C. W. Keevil, P. D. Marsh, C. M. Brown and J. N. Wardell (1982). "Surface-
associated growth." Philosophical transactions of the Royal Society of London. Series B: Biological sciences 297(1088): 517-532.
Elsass, F. (2006). Chapter 12.8 Transmission Electron Microscopy. In: Developments in Clay Science. F. Bergaya, B.K.G. Theng and G. Lagaly, Elsevier. Volume 1: 939-963.
Elzea, J. M. and H. H. Murray (1990). "Variation in the mineralogical, chemical and physical properties of the Cretaceous Clay Spur bentonite in Wyoming and Montana (USA)." Applied Clay Science 5(3): 229-248.
ENRESA (2007). Full-scale High Level Waste Engineered Barriers (FEBEX). Grimsel Test Site (GTS)- www. grimsel.com.
Erzin, Y. and O. Erol (2007). "Swell pressure prediction by suction methods." Engineering Geology 92(3-4): 133-145.
Faraldo-Gomez, J. D. and M. S. P. Sansom (2003). "Acquisition of siderophores in Gram-negative bacteria." Nat Rev Mol Cell Biol 4(2): 105-116.
Farmer, V. C. and J. D. Russel (1971). "Interlayer complexes in layer silicates." Transactions of the Faraday Society 67: 2737-2749.
Fein, J. B., S. Scott and N. Rivera (2002). "The effect of Fe on Si adsorption by Bacillus subtilis cell walls: Insights into non-metabolic bacterial precipitation of silicate minerals." Chemical Geology 182(2-4): 265-273.

References ______________________________________________________________________________________________________________________________________________________________________________________________________________________________
183
Ferrage, E., B. Lanson, N. Malikova, A. Plançon, B. A. Sakharov and V. A. Drits (2005a). "New insights on the distribution of interlayer water in bi-hydrated smectite from X-ray diffraction profile modeling of 00l reflections." Chemistry of Materials 17(13): 3499-3512.
Ferrage, E., B. Lanson, B. A. Sakharov and V. A. Drits (2005b). "Investigation of smectite hydration properties by modeling experimental X-ray diffraction patterns: Part I: Montmorillonite hydration properties." American Mineralogist 90(8-9): 1358-1374.
Flemming, H. C. (1995). "Sorption sites in biofilms." Water Science and Technology 32(8): 27-33. Fox, G. E., K. R. Pechman and C. R. Woese (1977). "Comparative cataloging of 16S ribosomal
ribonucleic acid: molecular approach to procaryotic systematics." International Journal of Systematic Bacteriology 27(1): 44-57.
Fredrickson, J. K. and T. C. Onstott (1996). "Microbes deep inside the earth." Scientific American 275(4): 68-73.
Fredrickson, J. K., J. M. Zachara, D. L. Balkwill, D. Kennedy, S. M. W. Li, H. M. Kostandarithes, M. J. Daly, M. F. Romine and F. J. Brockman (2004). "Geomicrobiology of high-level nuclear waste-contaminated vadose sediments at the Hanford Site, Washington State." Applied and Environmental Microbiology 70(7): 4230-4241.
Furukawa, Y. and S. E. O'Reilly (2007). "Rapid precipitation of amorphous silica in experimental systems with nontronite (NAu-1) and Shewanella oneidensis MR-1." Geochimica et Cosmochimica Acta 71(2): 363-377.
Garavito, A. M., P. De Canniere and H. Kooi (2007). "In situ chemical osmosis experiment in the Boom Clay at the Mol underground research laboratory." Physics and Chemistry of the Earth 32(1-7): 421-433.
Gates, W. P., A. M. Jaunet, D. Tessier, M. A. Cole, H. T. Wilkinson and J. W. Stucki (1998). "Swelling and texture of iron-bearing smectites reduced by bacteria." Clays and Clay Minerals 46(5): 487-497.
Gates, W. P., P. G. Slade, A. Manceau and B. Lanson (2002). "Site occupancies by iron in nontronites." Clays and Clay Minerals 50(2): 223-239.
Gauthier, G., M. Gauthier and R. Christen (1995). "Phylogenetic analysis of the genera Alteromonas, Shewanella, and Moritella using genes coding for small-subunit rRNA sequences and division of the genus Alteromonas into two genera, Alteromonas (emended) and Pseudoalteromonas gen. nov., and proposal of twelve new species combinations." International Journal of Systematic Bacteriology 45(4): 755-761.
Gorshkov, A. I., V. A. Drits, G. A. Dubinina, O. A. Bogdanova and A. V. Sivtsov (1992). "The role of bacterial activity in the formation of hydrothermal Fe- Mn-formations in the northern part of the Lau Basin (south-western part of the Pacific Ocean)." Izvestiya - Akademiya Nauk, Seriya Geologicheskaya 9: 84-93.
Gram, L. (1994). "Siderophore-mediated iron sequestering by Shewanella putrefaciens." Applied and Environmental Microbiology 60(6): 2132-2136.
Grim, R. E. (1962). Applied Clay Mineralogy. New York, McGraw-Hill. Gustafsson, B. G. (2004). "Sensitivity of Baltic Sea salinity to large perturbations in climate." Climate
Research 27(3): 237-251. Haas, J. R. (2004). "Effects of cultivation conditions on acid-base titration properties of Shewanella
putrefaciens." Chemical Geology 209(1-2): 67-81. Haas, J. R., T. J. Dichristina and R. Wade (2001). "Thermodynamics of U(VI) sorption onto
Shewanella putrefaciens." Chemical Geology 180(1-4): 33-54. Harvey, C. C. and G. Lagaly (2006). Chapter 10.1 Conventional Applications. In: Developments in
Clay Science. F. Bergaya, B.K.G. Theng and G. Lagaly, Elsevier. Volume 1: 501-540. Haycox, J. R., W. S. Pettitt, D. S. Collins and R. P. Young (2006). Validating 3-D numerical models
of rock fracture with laboratory and field scale studies. 5th ICEG Environmental Geotechnics: Opportunities, Challenges and Responsibilities for Environmental Geotechnics - Proceedings of the ISSMGE 5th Int. Congress.
Herbert, H. J. and H. C. Moog (1999). "Cation exchange, interlayer spacing, and water content of MX-80 bentonite in high molar saline solutions." Engineering Geology 54(1-2): 55-65.

References ______________________________________________________________________________________________________________________________________________________________________________________________________________________________
184
Hermann-Stengele, R. and M. Plötze (2000). Suitability of mineral for controlled landfill and containment. In: Environmental Mineralogy. David J. Vaughan and R.A. Wogelius. Budapest, Eotvos University Press. 2: 291-331.
Hersman, L., T. Lloyd and G. Sposito (1995). "Siderophore-promoted dissolution of hematite." Geochimica et Cosmochimica Acta 59(16): 3327-3330.
Hersman, L. E., A. Huang, P. A. Maurice and J. H. Forsythe (2000). "Siderophore production and iron reduction by Pseudomonas mendocina in response to iron deprivation." Geomicrobiology Journal 17(4): 261-273.
Hofman, H. (2003). Einfluss konzentrierter Salzlösungen auf die physiko-chemischen Eigenschaften quellfähiger Tonminerale: Konsequenzen für den Einsatz von Bentonit als Versatzmaterial in einem Endlager für schwach- bis mittelradioactive Abfälle in Salzformationen. Naturwissenschaftlich-Mathematische Gesamtfakultät. Heidelberg, Ruprecht-Karls-Universität: 189.
Hofman, U. and W. Bilke (1936). "Intercrystalline swelling of montmorillonite." Kolloidzeitschrift 77: 239-251.
Hofmann, H., A. Bauer and L. N. Warr (2004). "Behavior of smectite in strong salt brines under conditions relevant to the disposal of low- to medium-grade nuclear waste." Clays and Clay Minerals 52(1): 14-24.
Hofmann, U., R. Fahn and A. Weiss (1957). "Thixotropie bei Kaolinit und innerkristalline Quellung bei Montmorillonit - Wirkung der austauschfähigen Kationen, der Flüssigkeit und der Elektrolyte einer wäßrigen Lösung." Kolloid-Zeitschrift 151(2): 97-115.
Horgan, G. W. (1999). "An investigation of the geometric influences on pore space diffusion." Geoderma 88(1-2): 55-71.
Huber, R., M. Kurr, H. W. Jannasch and K. O. Stetter (1989). "A novel group of abyssal methanogenic archaebacteria (Methanopyrus) growing at 110°C." Nature 342(6251): 833-834.
Huheey, J. E. (1993). Inorganic Chemistry: Principles of structure and Reactivity. New York, Harpers Collins College Publishers.
Ivanov, M. V. and G. I. Karavaiko (2004). "Geological Microbiology." Microbiological Reviews 73(5): 493-508.
Jaisi, D. P., H. Dong, J. Kim, Z. He and J. P. Morton (2007). "Nontronite particle aggregation induced by microbial Fe(III) reduction and exopolysaccharide production." Clays and Clay Minerals 55(1): 96-107.
Jänchen, J., D. L. Bish, D. T. F. Möhlmann and H. Stach (2006). "Investigation of the water sorption properties of Mars-relevant micro- and mesoporous minerals." Icarus 180(2): 353-358.
Jo, H. Y., C. H. Benson and T. B. Edil (2004). "Hydraulic conductivity and cation exchange in non-prehydrated and prehydrated bentonite permeated with weak inorganic salt solutions." Clays and Clay Minerals 52(6): 661-679.
Jolley, D. M. (2002). Radionuclide uptake and transport on microbes in potential repository drifts at Yucca Mountain, Nevada. Materials Research Society Symposium - Proceedings.
Jorand, F., B. M. R. Appenzeller, M. Abdelmoula, P. Refait, J. C. Block and J. M. R. Genin (2000). "Assessment of vivianite formation in Shewanella putrefaciens culture." Environmental Technology 21(9): 1001-1005.
Kalinowski, B. E., L. J. Liermann, S. Givens and S. L. Brantley (2000). "Rates of bacteria-promoted solubilization of Fe from minerals: A review of problems and approaches." Chemical Geology 169(3-4): 357-370.
Karaborni, S., B. Smit, W. Heidug, J. Urai and E. Van Oort (1996). "The swelling of clays: Molecular simulations of the hydration of montmorillonite." Science 271(5252): 1102-1104.
Karnland, O. (2003). "Session 3: Introduction and Conclusions by Session Chairman." Applied Clay Science 23(1-4): 167.
Karnland, O. and T. Sandén (2000). Long Term Test of Buffer Material at Aspo Hard Rock Laboratory, Sweden. Materials Research Society Symposium - Proceedings.
Karnland, O., T. Sandén, L.-E. Johannesson, T. Eriksen, M. Jansson, S. Wold, K. Pedersen and B. Rosborg (2000). Long term test of buffer material Final report on the pilot parcels. SKB Technical Report TR-00-22.

References ______________________________________________________________________________________________________________________________________________________________________________________________________________________________
185
Kawano, M. and K. Tomita (2001). "Microbial biomineralization in weathered volcanic ash deposit and formation of biogenic minerals by experimental incubation." American Mineralogist 86(4): 400-410.
Keeling, J. L., M. D. Raven and W. P. Gates (2000). "Geology and characterization of two hydrothermal nontronites from weathered metamorphic rocks at the Uley Graphite Mine, South Australia." Clays and Clay Minerals 48(5): 537-548.
Kim, J., H. Dong, J. Seabaugh, S. W. Newell and D. D. Eberl (2004). "Role of Microbes in the Smectite-to-Illite Reaction." Science 303(5659): 830-832.
Kim, J. W., Y. Furukawa, T. L. Daulton, D. Lavoie and S. W. Newell (2003). "Characterization of microbially Fe(III)-reduced nontronite: Environmental cell-transmission electron microscopy study." Clays and Clay Minerals 51(4): 382-389.
Kim, J. W., Y. Furukawa, H. Dong and S. W. Newell (2005). "The effect of microbial FE(III) reduction on smectite flocculation." Clays and Clay Minerals 53(6): 572-579.
King, F., M. Kolar, S. Stroes-Gascoyne, P. Bellingham, C. H. U. James and P. V. D. Awe (1999). Modelling the activity of sulphate-reducing bacteria and the effects on container corrosion in an underground nuclear waste disposal vault. Materials Research Society Symposium - Proceedings.
King, F., M. Kolar, S. Stroes-Gascoyne and P. Maak (2004). Model for the microbiological corrosion of copper containers in a deep geologic repository. Materials Research Society Symposium Proceedings.
Klug, H. P. and L. E. Alexander, Eds. (1954). X-ray diffraction procedures for polycrystalline and amorphous materials.
Koch, A. L. (1986). "The pH in the neighborhood of membranes generating a protonmotive force." Journal of theoretical biology 120(1): 73-84.
Kohler, B., A. Singer and P. Stoffers (1994). "Biogenic nontronite from marine white smoker chimneys." Clays & Clay Minerals 42(6): 689-701.
Komadel, P., J. Madejova and J. W. Stucki (2006). "Structural Fe(III) reduction in smectites." Applied Clay Science 34(1-4): 88-94.
Komine, H. (2004). "Simplified evaluation for swelling characteristics of bentonites." Engineering Geology 71(3-4): 265-279.
Komine, H. and N. Ogata (2004). "Predicting swelling characteristics of bentonites." Journal of Geotechnical and Geoenvironmental Engineering 130(8): 818-829.
Konhauser, K. (2007). Introduction to Geomicrobiology. Oxford, Blackwell Publishing. Körstgens, V., H. C. Flemming, J. Wingender and W. Borchard (2001). "Influence of calcium ions on
the mechanical properties of a model biofilm of mucoid Pseudomonas aeruginosa." Water Science and Technology 43(6): 49-57.
Kostka, J. E., E. Haefele, R. Viehweger and J. W. Stucki (1999). "Respiration and dissolution of iron(III)-containing clay minerals by bacteria." Environmental Science and Technology 33(18): 3127-3133.
Kostka, J. E., J. W. Stucki, K. H. Nealson and W. U. Jun (1996). "Reduction of structural Fe(III) in smectite by a pure culture of Shewanella putrefaciens strain MR-1." Clays and Clay Minerals 44(4): 522-529.
Kronhauser, K. (2007). Introduction to Geomicrobiology. Oxford, Blackwell Publishing. Kühnel, R. A. and S. J. van der Gaast (1993). "Humidity controlled diffractometry and its
applications." Advances in X-ray Analysis 36: 439-449. Labille, J., F. Thomas, M. Milas and C. Vanhaverbeke (2005). "Flocculation of colloidal clay by
bacterial polysaccharides: Effect of macromolecule charge and structure." Journal of Colloid and Interface Science 284(1): 149-156.
Lagaly, G. (1993). Reaktionen des Tonminerale. In: Tonminerale und Tone: Struktur, Eigenschaften und Einsatz in Industrie und Umwelt. J. K. and L. G. Darmstadt, Steinkopff Verlag: 89-167.
Lagaly, G. (2006). Chapter 5 Colloid Clay Science. In: Developments in Clay Science. F. Bergaya, B.K.G. Theng and G. Lagaly, Elsevier. Volume 1: 141-245.
Laird, D. A., C. Shang and M. L. Thompson (1995). "Hysteresis in crystalline swelling of smectites." Journal of Colloid and Interface Science 171: 240-245.
References ______________________________________________________________________________________________________________________________________________________________________________________________________________________________
186
Lasaga, A. C. (1995). Fundamental appoaches in describing mineral dissolution and precipitation rates. In: Chemical Weathering Rates of Silicate Minerals, Reviews in Mineralogy. A.F. White and S.L. Brantley, Mineralogical Society of America. 31: 23-81.
Lee, J.-U. and J. B. Fein (2000). "Experimental study of the effects of Bacillus subtilis on gibbsite dissolution rates under near-neutral pH and nutrient-poor conditions." Chemical Geology 166(3-4): 193-202.
Lee, J. V., D. M. Gibson and J. M. Shewan (1977). "A numerical taxonomic study of some pseudomonas like marine bacteria." Journal of General Microbiology 98(2): 439-451.
Lee, K., J. E. Kostka and J. W. Stucki (2006). "Comparisons of structural Fe reduction in smectites by bacteria and dithionite: An infrared spectroscopic study." Clays and Clay Minerals 54(2): 195-208.
Lehman, R. M., F. S. Colwell and G. A. Bala (2001). "Attached and Unattached Microbial Communities in a Simulated Basalt Aquifer under Fracture- and Porous-Flow Conditions." Appl. Environ. Microbiol. 67(6): 2799-2809.
Leon Morales, C. F., M. Strathmann and H. C. Flemming (2007). "Influence of biofilms on the movement of colloids in porous media. Implications for colloid facilitated transport in subsurface environments." Water Research 41(10): 2059-2068.
Liermann, L. J., A. S. Barnes, B. E. Kalinowski, X. Zhou and S. L. Brantley (2000a). "Microenvironments of pH in biofilms grown on dissolving silicate surfaces." Chemical Geology 171(1-2): 1-16.
Liermann, L. J., B. E. Kalinowski, S. L. Brantley and J. G. Ferry (2000b). "Role of bacterial siderophores in dissolution of hornblende." Geochimica et Cosmochimica Acta 64(4): 587-602.
Likos, W. J. (2004). "Measurement of crystalline swelling in expansive clay." Geotechnical Testing Journal 27(6): 540-546.
Little, B. J., P. A. Wagner and Z. Lewandowski (1997). "Spatial relationships between bacteria and mineral surfaces." Reviews in Mineralogy 35: 154-159.
Lloret, A. and M. V. Villar (2007). "Advances on the knowledge of the thermo-hydro-mechanical behaviour of heavily compacted "FEBEX" bentonite." Physics and Chemistry of the Earth 32(8-14): 701-715.
Lloyd, J. R. (2003). "Microbial reduction of metals and radionuclides." FEMS Microbiology Reviews 27(2-3): 411-425.
Lovley, D. R. (1991). "Dissimilatory Fe(III) and Mn(IV) reduction." Microbiological Reviews 55(2): 259-287.
Lovley, D. R., D. E. Holmes and K. P. Nevin (2004). "Dissimilatory Fe(III) and Mn(IV) reduction." Advances in Microbial Physiology 49: 219-286.
Lovley, D. R., E. J. P. Phillips, Y. A. Gorby and E. R. Landa (1991). "Microbial reduction of uranium." Nature 350(6317): 413-416.
Lowenstam, H. A. (1981). "Minerals formed by organisms." Science 211(4487): 1126-1131. Lower, S. K., M. F. Hochella Jr and T. J. Beveridge (2001). "Bacterial recognition of mineral surfaces:
Nanoscale interactions between Shewanella and a-FeOOH." Science 292(5520): 1360-1363. Lowson, R. T. (1982). "Aqueous oxidation of pyrite by molecular oxygen." Chemical Reviews 82(5):
461-497. MacDonell, M. T. and R. R. Colwell (1985). "Phylogeny of the vibrionaceae, and recommendation for
two new genera, listonella and shewanella." Systematic and Applied Microbiology 6(2): 171-182.
MacEwan, D. M. C. and M. J. Wilson (1980). Interlayer and Intercalation Complexes of Clay Minerals. In: Crystalstructure of Clay Minerals and their X-ray Identification. G.W. Brindley and G. Brown. London, Mineralogical Society. 5: 197-242.
Madigan, M. T., J. M. Martinko and J. Parker (2003). Brock biology of microorganisms.10th ed. Upper Saddler River, Pearson Prentice Hall.
Madsen, F. T. (1998). "Clay mineralogical investigations related to nuclear waste disposal." Clay Minerals 33(1): 109-129.

References ______________________________________________________________________________________________________________________________________________________________________________________________________________________________
187
Marcos, N. (2002). "Lessons from nature - The behaviour of technical and natural barriers in the geological disposal of spent nuclear fuel." Acta Polytechnica Scandinavica, Civil Engineering and Building Construction Series(124).
Marshall, K. C., R. Stout and R. Mitchell (1971). "Selective sorption of bacteria from seawater." Canadian Journal of Microbiology 17(11): 1413-1416.
Marshall, M. J., A. S. Beliaev, A. C. Dohnalkova, D. W. Kennedy, L. Shi, Z. Wang, M. I. Boyanov, B. Lai, K. M. Kemner, J. S. McLean, S. B. Reed, D. E. Culley, V. L. Bailey, C. J. Simonson, D. A. Saffarini, M. F. Romine, J. M. Zachara and J. K. Fredrickson (2006). "c-type cytochrome-dependent formation of U(IV) nanoparticles by Shewanella oneidensis." PLoS Biology 4(8): 1324-1333.
Martin, P. L. and J. M. Barcala (2005). "Large scale buffer material test: Mock-up experiment at CIEMAT." Engineering Geology 81(3): 298-316.
Maurice, P. A. and L. A. Warren (2006). Introduction to geomicrobiology: Microbial interactions with minerals. CMS Workshop Lectures. 14: 1-35.
McNeil, B. L. (1970). "Prediction of Interlayer Swelling of Clays in Mixed-Salt Solutions." Proceedings of the Soil Science Society of America 34(2): 201-206.
Megonigal, J. P., M. E. Hines, P. T. Visscher, D. H. Heinrich and K. T. Karl (2003). Anaerobic Metabolism: Linkages to Trace Gases and Aerobic Processes. In: Treatise on Geochemistry. Oxford, Pergamon: 317-424.
Meike, A. and S. Stroes-Gascoyne (2000). Review of Microbial Responses to Abiotic Environmental Factors in the Context of the Proposed Yucca Mountain Repository. UCRL-ID-141064. U.S.D.o. Energy, Lawrence Livermore National Laboratory
212. Meleshyn, A. (2005). Monte Carlo Simulationen zur Untersuchung von Quell- und Sorptionsprozessen
in Wyoming-Montmorillonite im Hinblick auf seine Verwendung als Barrierematerial in Endlagern für radioactive Abfälle. Hannover, University of Hannover: 86.
Méring, J. (1946). "The hydration of montmorillonite." Transactions of the Faraday Society 42: 205-219.
Méring, J. (1949). "L'interférence des Rayons X dans les system à stratification désordonnée." Acta Crystallographica 2: 371-377.
Mermut, A. R. and A. F. Cano (2001). "Baseline studies of the clay minerals society source clays: Chemical analyses of major elements." Clays and Clay Minerals 49(5): 381-386.
Mermut, A. R. and G. Lagaly (2001). "Baseline studies of the clay minerals society source clays: Layer-charge determination and characteristics of those minerals containing 2:1 layers." Clays and Clay Minerals 49(5): 393-397.
Metz, V., K. Amram and J. Ganor (2005). "Stoichiometry of smectite dissolution reaction." Geochimica et Cosmochimica Acta 69(7): 1755-1772.
Meunier, A., B. Lanson and D. Beaufort (2000). "Vermiculitization of smectite interfaces and illite layer growth as a possible dual model for illite-smectite illitization in diagenetic environments: A synthesis." Clay Minerals 35(3): 573-586.
Michot, L. J. and F. Villieras (2006). Chapter 12.9 Surface Area and Porosity. In: Developments in Clay Science. Faiza Bergaya, B.K.G. Theng and G. Lagaly, Elsevier. Volume 1: 965-978.
Milliken, R. E. and J. F. Mustard (2007). "Estimating the water content of hydrated minerals using reflectance spectroscopy. II. Effects of particle size." Icarus 189(2): 574-588.
Molera, M., T. Eriksen and M. Jansson (2003). "Anion diffusion pathways in bentonite clay compacted to different dry densities." Applied Clay Science 23(1-4): 69-76.
Monsalvo, R., L. de Pablo and M. L. Chàvez (2006). "Hydration of Ca-montmorillonite at basin conditions: A Monte Carlo molecular simulation." Revista Mexicana de Ciencias Geologicas 23(1): 84-95.
Montes-Hernandez, G., J. Duplay, L. Martinez, Y. Geraud and B. Rousset-Tournier (2003a). "Influence of interlayer cations on the water sorption and swelling-shrinkage of MX80 bentonite." Applied Clay Science 23(5-6): 309-321.
Montes-Hernandez, G., J. Duplay, L. Martinez and C. Mendoza (2003b). "Swelling-shrinkage kinetics of MX80 bentonite." Applied Clay Science 22(6): 279-293.

References ______________________________________________________________________________________________________________________________________________________________________________________________________________________________
188
Montes-Hernandez, G., B. Fritz, A. Clement and N. Michau (2005a). "Modelling of geochemical reactions and experimental cation exchange in MX80 bentonite." Journal of Environmental Management 77(1): 35-46.
Montes-Hernandez, G., B. Fritz, A. Clement and N. Michau (2005b). "A simplified method to evaluate the swelling capacity evolution of a bentonite barrier related to geochemical transformations." Applied Geochemistry 20(2): 409-422.
Montes-Hernandez, G., N. Marty, B. Fritz, A. Clement and N. Michau (2005c). "Modelling of long-term diffusion-reaction in a bentonite barrier for radioactive waste confinement." Applied Clay Science 30(3-4): 181-198.
Mooney, R. W., A. G. Keenan and L. A. Wood (1952). "Adsorption of water vapor by montmorillonite. II. Effect of exchangeable ions and lattice swelling as measured by X-ray diffraction." Journal of the American Chemical Society 74(6): 1371-1374.
Moore, D. M. and J. Hower (1986). "Ordered interstratification of dehydrated and hydrated Na- smectite." Clays & Clay Minerals 34(4): 379-384.
Moore, D. M. and R. C. Reynolds (1997). X-Ray Diffraction and the Identification and Analysis of Clay Minerals 2nd Edition. New York, Oxford University Press.
Müller-Vonmoos, M. and E. E. Kohler (1993). Geotechnik und Entsorgung. In: Tonminerale und Tone: Struktur, Eigenschaften und Einsatz in Industrie und Umwelt. J. K. and L. G. Darmstadt, Steinkopff Verlag: 312-357.
Muller, D., C. Medigue, S. Koechler, V. Barbe, M. Barakat, E. Talla, V. Bonnefoy, E. Krin, F. Arsene-Ploetze, C. Carapito, M. Chandler, B. Cournoyer, S. Cruveiller, C. Dossat, S. Duval, M. Heymann, E. Leize, A. Lieutaud, D. Lievremont, Y. Makita, S. Mangenot, W. Nitschke, P. Ortet, N. Perdrial, B. Schoepp, P. Siguier, D. D. Simeonova, Z. Rouy, B. Segurens, E. Turlin, D. Vallenet, A. Van Dorsselaer, S. Weiss, J. Weissenbach, M. C. Lett, A. Danchin and P. N. Bertin (2007). "A tale of two oxidation states: bacterial colonization of arsenic-rich environments." PLoS genetics 3(4).
Murray, H. H. (1977). "Industrial Minerals Outlook for the Paper Industrie." TAPPI 60(8): 70-72. Muurinen, A. and J. Lehikoinen (1999). "Porewater chemistry in compacted bentonite." Engineering
Geology 54(1-2): 207-214. Myers, C. R. and K. H. Nealson (1988). "Bacterial manganese reduction and growth with manganese
oxide as the sole electron acceptor." Science 240(4857): 1319-1321. Myers, C. R. and K. H. Nealson (1990). "Respiration-linked proton translocation coupled to anaerobic
reduction of manganese(IV) and iron(III) in Shewanella putrefaciens MR-1." J. Bacteriol. 172(11): 6232-6238.
Nadson, G. A. (1903). Mikroorganizmy kak geologicheskie deyateli (Microorganisms as Geological Agents). St. Petersburg, Tip. Saikina. Nagelschmidt, G. (1936). "The structure of montmorillonite." Z. Kristallogr. 93: 481-487. Nagy, K. L. (1995). "Dissolution and precipitation kinetics of sheet silicates." Reviews in Mineralogy
and Geochemistry 31(1): 173-233. Nazina, T. N., I. M. Kosareva, V. V. Petrunyaka, M. K. Savushkina, E. G. Kudriavtsev, V. A.
Lebedev, V. D. Ahunov, Y. A. Revenko, R. R. Khafizov, G. A. Osipov, S. S. Belyaev and M. V. Ivanov (2004). "Microbiology of formation waters from the deep repository of liquid radioactive wastes Severnyi." FEMS Microbiology Ecology 49(1): 97-107.
Neilands, J. B. (1989). Siderophore systems in bacteria and fungi. In: Bacteria in Nature. J.S. Poindexter and E.R. Leadbetter. New York, Plenum Press: 141-163.
Nordstrom, D. K. (1982). Aqueous pyrite oxidation and the consequent formation of secondary iron minerals. In: Acid Sulphate Weathering. K. J.S., F. D.S. and H. L.R. Madison, Soil Science of America Special Publication. 10: 37-56.
Norrish, K. (1954). "Crystalline Swelling of Montmorillonite: Manner of Swelling of Montmorillonite." Nature 173(256-257).
Norrish, K. and J. P. Quirk (1954). "Crystalline swelling of montmorillonite: Use of Electrolytes to Control Swelling." Nature 173: 255-256.
O'Driscoll, M. (1988). "Bentonite: overcapacity in need of markets." Industrial Minerals 250: 43-67. O'Driscoll, M. (1989). "US Pacific Northwest: an outpost of industrial mineral wealth." Industrial
Minerals 259: 19-55.

References ______________________________________________________________________________________________________________________________________________________________________________________________________________________________
189
O'Loughlin, E. J., P. Larese-Casanova, M. Scherer and R. Cook (2007). "Green rust formation from the bioreduction of α-FeOOH (Lepidocrocite): Comparison of several Shewanella species." Geomicrobiology Journal 24(3-4): 211-230.
O'Reilly, S. E., Y. Furukawa and S. Newell (2006). "Dissolution and microbial Fe(III) reduction of nontronite (NAu-1)." Chemical Geology 235(1-2): 1-11.
Obuekwe, C. O. and D. W. S. Westlake (1982). "Effect of reducible compounds (potential electron acceptors) on reduction of ferric iron by Pseudomonas species." Microbios Letters 19(74): 57-61.
OECD (1999). Confidence in the evaluation of safety deep geological repositories - Its development and communication. N.E. Agency.
OECD (2006). "Safety of Geological Disposal of High-level and Long-lived Radioactive Waste in France: An International Peer Review of the Dossier 2005 Argile Concerning Disposal in the Callovo-Oxfordian Formation." OECD Papers 6: 88-164.
Olson, K. R. (1985). "Characterization of pore size distributions within soils by mercury intrusion and water-release methods." Soil Science 139(5): 400-404.
Oscarson, D. W., H. B. Hume and J. W. Choi (1994). "Diffusive transport in compacted mixture of clay and crushed granite." Radiochim. Acta 65: 189-194.
Payne, A. N. and T. J. DiChristina (2006). "A rapid mutant screening technique for detection of technetium [Tc(VII)] reduction-deficient mutants of Shewanella oneidensis MR-1." FEMS Microbiology Letters 259(2): 282-287.
Pedersen, K. (2000). Microbial processes in radioactive waste disposal. TR-00-04. SKB. Stockholm: 93.
Pedersen, K., M. Motamedi, O. Karnland and T. Sandén (2000). "Cultivability of microorganisms introduced into a compacted bentonite clay buffer under high-level radioactive waste repository conditions." Engineering Geology 58(2): 149-161.
Perdrial, N. (2007). Nature et rôle des matières solides en suspension dans la dynamique du transfert des éléments polluants. Ecole et Observatoire des Sciences de la Terre UMR 7517. Strasbourg, Université Louis Pasteur. PhD: 284.
Plançon, A. and V. A. Drits (1999). Programs for calculation of diffraction by oriented powders of two- and three component mixed layer clay minerals. CALCMIX .
Postgate, J. R. (1976). Death in macrobes and microbes. In: The survival of vegetative microbes. T.R.G. Gray and J.R. Postgate. London, Cambridge University Press: 1-19.
Prost, R. (1975). "Étude de l’hydratation des argiles : interactions eau-minérale et mécanisme de la rétention de l’eau." Annales d’Agronomie 26: 463-535.
Pusch, R. (2001a). Experimental study of the effect of high porewater salinity on the physical properties of a natural smectitic clay. TR-01-07. SKB. Stockholm: 32.
Pusch, R. (2001b). The microstructure of MX-80 clay with respect to its bulk physical properties under different environmental conditions. TR-01-08. SKB. Stockholm: 108.
Pusch, R. (2006a). Chapter 6 Mechanical Properties of Clays and Clay Minerals. In: Developments in Clay Science. F. Bergaya, B.K.G. Theng and G. Lagaly, Elsevier. Volume 1: 247-260.
Pusch, R. (2006b). Chapter 11.4 Clays and Nuclear Waste Management. In: Developments in Clay Science. F. Bergaya, B.K.G. Theng and G. Lagaly, Elsevier. Volume 1: 703-716.
Pusch, R., J. Kasbohm, J. Pacovsky and Z. Cechova (2007). "Are all smectite clays suitable as "buffers"?" Physics and Chemistry of the Earth, Parts A/B/C 32(1-7): 116-122.
Pusch, R. and R. Weston (2003). "Microstructural stability controls the hydraulic conductivity of smectitic buffer clay." Applied Clay Science 23(1-4): 35-41.
Reynolds, R. C. (1980). Interstratified Clay Minerals. In: Crystal Structures of Clay Minerals and their X-ray Identification. G.W. Brindley and G. Brown. London, Mineralogical Society. 5: 249-304.
Reynolds, R. C. (1985). NEWMOD a Computer Program for the calculation of One-Dimensional Diffraction Patterns of Mixed-Layered Clays. R.C. Reynolds. Hanover, USA.
Rivkina, E. M., E. I. Friedmann, C. P. McKay and D. A. Gilichinsky (2000). "Metabolic activity of Permafrost Bacteria below the freezing point." Applied and Environmental Microbiology 66(8): 3230-3233.

References ______________________________________________________________________________________________________________________________________________________________________________________________________________________________
190
Roden, E. E., D. Sobolev, B. Glazer and G. W. Luther Iii (2004). "Potential for microscale bacterial Fe redox cycling at the aerobic-anaerobic interface." Geomicrobiology Journal 21(6): 379-391.
Roden, E. E. and J. M. Zachara (1996). "Microbial reduction of crystalline iron(III) oxides: Influence of oxide surface area and potential for cell growth." Environmental Science and Technology 30(5): 1618-1628.
Rogers, J. R. and P. C. Bennett (2004). "Mineral stimulation of subsurface microorganisms: Release of limiting nutrients from silicates." Chemical Geology 203(1-2): 91-108.
Rogers, J. R., P. C. Bennett and W. J. Choi (1998). "Feldspars as a source of nutrients for microorganisms." American Mineralogist 83(11-12 PART 2): 1532-1540.
Rosenberg, D. R. and P. A. Maurice (2003). "Siderophore adsorption to and dissolution of kaolinite at pH 3 to 7 and 22°C." Geochimica et Cosmochimica Acta 67(2): 223-229.
Roszak, D. B. and R. R. Colwell (1987). "Survival Strategies of Bacteria in the Natural Environment." Microbiological Reviews 51(3): 365-379.
Rotenberg, B., V. Marry, J.-F. Dufreche, N. Malikova, E. Giffaut and P. Turq (2007). "Modelling water and ion diffusion in clays: A multiscale approach." Comptes Rendus Chimie 10(10-11): 1108-1116.
Rothfuchs, T., N. Jockwer and C. L. Zhang (2007). "Self-sealing barriers of clay/mineral mixtures - The SB project at the Mont Terri Rock Laboratory." Physics and Chemistry of the Earth 32(1-7): 108-115.
Sarmento, M. R., J. C. Oliveira and R. B. Boulton (2000). "Selection of low swelling materials for protein adsorption from white wines." International Journal of Food Science and Technology 35(1): 41-47.
Sato, T., T. Watanabe and R. Otsuka (1992). "Effects of layer charge, charge location, and energy change on expansion properties of dioctahedral smectites." Clays & Clay Minerals 40(1): 103-113.
Sauzeat, E., T. F. Villiéras, M. François, M. Pelletier, O. Barrés, J. Yvon, D. Guillaume, J. Dubbessy, C. Pfeiffert, R. Ruck and M. Cathelineau (2001). Caractérisation minéralogique, cristallochimique et texturale de l’argile MX-80. LEM-CREGU. France, ANDRA Technical Report.
Schramm, L. L. and J. C. T. Kwak (1982). "Influence of exchangeable cation composition on the size and shape of montmorillonite particles in dilute suspension." Clays & Clay Minerals 30(1): 40-48.
Shaw, D. J. (1992). Charged interfaces. In: Introduction of Colloid and Surface Chemistry Oxford, Butterworth-Heinemann: 174-189. Sposito, G. and R. Prost (1982). "Structure of water adsorbed on smectites." Chemical Reviews 82(6):
553-573. Sposito, G., N. T. Skipper, R. Sutton, S. H. Park, A. K. Soper and J. A. Greathouse (1999). "Surface
geochemistry of the clay minerals." Proceedings of the National Academy of Sciences of the United States of America 96(7): 3358-3364.
Stotzky, G. (1966a). "Influence of clay minerals on microorganisms. 3. Effect of particle size, cation exchange capacity, and surface area on bacteria." Canadian Journal of Microbiology 12(6): 1235-1246.
Stotzky, G. (1966b). "Influence of clay minerals on microorganisms. II. Effect of various clay species, homoionic clays, and other particles on bacteria." Canadian Journal of Microbiology 12(4): 831-848.
Stotzky, G. (1967). "Clay minerals and microbial ecology." Transactions of the New York Academy of Sciences 30(1): 11-21.
Stotzky, G. and L. T. Rem (1966). "Influence of clay minerals on microorganisms. I. Montmorillonite and kaolinite on bacteria." Canadian Journal of Microbiology 12(3): 547-563.
Stotzky, G. and L. T. Rem (1967). "Influence of clay minerals on microorganisms. IV. Montmorillonite and kaolinites on fungi." Canadian Journal of Microbiology 13(11): 1535-1550.
Stroes-Gascoyne, S. and F. P. Sargent (1998). "The Canadian approach to microbial studies in nuclear waste management and disposal." Journal of Contaminant Hydrology 35(1-3): 175-190.
References ______________________________________________________________________________________________________________________________________________________________________________________________________________________________
191
Stroes-Gascoyne, S. and J. M. West (1994). Microbial issues to the Canadian concept for the disposal of nuclear fuel waste. Atomic Energy of Canada Limited, AECL (Report): 1-39.
Stucki, J. W. (1988). Structural iron in smectites. In: Iron in soils and clay minerals. J.W. Goodman and B.A. Schwertmann. Dordrecht, D. Reidel Publishing Company: 625-675.
Stucki, J. W. (2006). Chapter 8 Properties and Behaviour of Iron in Clay Minerals. In: Developments in Clay Science. F. Bergaya, B.K.G. Theng and G. Lagaly, Elsevier. Volume 1: 423-475.
Stucki, J. W., P. Komadel and H. T. Wilkinson (1987). "Microbial reduction of structural iron(III) in smectites." Soil Science Society of America Journal 51(6): 1663-1665.
Stucki, J. W. and J. E. Kostka (2006). "Microbial reduction of iron in smectite." Comptes Rendus - Geoscience 338(6-7): 468-475.
Stucki, J. W., K. Lee, L. Zhang and R. A. Larson (2003). "Effects of iron oxidation state on the surface and structural properties of smectites." Pure and Applied Chemistry 74(11): 2145-2158.
Stucki, J. W., J. Wu, H. Gan, P. Komadel and A. Banin (2000). "Effects of iron oxidation state and organic cations on dioctahedral smectite hydration." Clays and Clay Minerals 48(2): 290-298.
Suzuki, S., S. Prayongphan, Y. Ichikawa and B. G. Chae (2005). "In situ observations of the swelling of bentonite aggregates in NaCl solution." Applied Clay Science 29(2): 89-98.
Tamura, K., H. Yamada and H. Nakazawa (2000). "Stepwise hydration of high-quality synthetic smectite with various cations." Clays and Clay Minerals 48(3): 400-404.
Tazaki, K. (2006). Chapter 9 Clays, Microorganisms, and Biomineralization. In: Developments in Clay Science. F. Bergaya, B.K.G. Theng and G. Lagaly, Elsevier. Volume 1: 477-497.
Tchoubar, D. and N. Cohaut (2006). Chapter 12.5 Small-Angle Scattering Techniques. In: Developments in Clay Science. F. Bergaya, B.K.G. Theng and G. Lagaly, Elsevier. Volume 1: 879-907.
Theng, B. K. G. and V. A. Orchard (1995). Interactions of clays with microorganisms and bacterial survival in soil: A physicochemical perspective. In: Environmental Impact of Soil Component Interactions. P.M. Huang, J. Berthelin, J.-M. Bollag, W.B. McGill and A.L. Page. Boca Raton, Lewis Publishers: 123-143.
Todar, K. (2006). Textbook of Bacteriology, University of Wisconsin-Madison. Ueshima, M. and K. Tazaki (2001). "Possible role of microbial polysaccharides in nontronite
formation." Clays and Clay Minerals 49(4): 292-299. Urrutia, M. M., M. A. Kemper, R. J. Doyle and T. J. Beveridge (1992). "The membrate-induced
proton motive force influences the metal binding ability of Bacillus subtilis cell walls." Appl. Environ. Microbiol. 58: 3837-3844.
Van Loosdrecht, M. C. M., J. Lyklema, W. Norde and A. J. B. Zehnder (1989). "Bacterial adhesion: A physiochemical approach." Microbial Ecology 17(1): 1-15.
Van Loosdrecht, M. C. M., J. Lyklema, W. Norde and A. J. B. Zehnder (1990). "Influence of interfaces on microbial activity." Microbiological Reviews 54(1): 75-87.
Vandevivere, P., S. A. Welch, W. J. Ullman and D. L. Kirchman (1994). "Enhanced dissolution of silicate minerals by bacteria at near-neutral pH." Microbial Ecology 27(3): 241-251.
Velde, B. (1992). Introduction to clay minerals. London, Chapman & Hall. Venkateswaran, K., D. P. Moser, M. E. Dollhopf, D. P. Lies, D. A. Saffarini, B. J. MacGregor, D. B.
Ringelberg, D. C. White, M. Nishijima, H. Sano, J. Burghardt, E. Stackebrandt and K. H. Nealson (1999). "Polyphasic taxonomy of the genus Shewanella and description of Shewanella oneidensis sp. nov." International Journal of Systematic Bacteriology 49(2): 705-724.
Vervey, E. J. W. and J. T. G. Overbeek (1948). Theory of the Stability of Lyophobic Colloids: The interaction of Sol Particles Having an Electric Double Layer. New York, Elsevier.
Villar, M. V. and A. Lloret (2007). "Dismantling of the first section of the FEBEX in situ test: THM laboratory tests on the bentonite blocks retrieved." Physics and Chemistry of the Earth 32(8-14): 716-729.
Warr, L. and J. Berger (2007). "Hydration of bentonite in natural waters: Application of "confined volume" wet-cell X-ray diffractometry." Physics and Chemistry of the Earth 32(1-7): 247-258.
Warr, L. N. and H. Hofmann (2003). "In situ monitoring of powder reactions in percolating solution by wet-cell X-ray diffraction techniques." Journal of Applied Crystallography 36(3 II): 948-949.
References ______________________________________________________________________________________________________________________________________________________________________________________________________________________________
192
Watanabe, T. and T. Sato (1988). "Expansion Characteristics of Montmorillonite and Saponite Under Various
Relative Humidity Conditions." Clay Science 7(3): 129-138. Welch, S. A. and P. Vandevivere (1994). "Effect of microbial and other naturally occurring polymers
on mineral dissolution." Geomicrobiology Journal 12(4): 227-238. Wersin, P. (2003). "Geochemical modelling of bentonite porewater in high-level waste repositories."
Journal of Contaminant Hydrology 61(1-4): 405-422. Wersin, P., E. Curti and C. A. J. Appelo (2004). "Modelling bentonite-water interactions at high
solid/liquid ratios: Swelling and diffuse double layer effects." Applied Clay Science 26(1-4 SPEC. ISS.): 249-257.
Westlake, D. W. S., K. M. Semple and C. O. Obuekwe (1966). "Corrosion by ferric iron-reducing bacteria isolated from oil production systems."
Willey, J., L. Sherwood and C. Woolverton (1996). Microbiology, McGraw-Hill. Wilson, J., G. Cressey, B. Cressey, J. Cuadros, K. V. Ragnarsdottir, D. Savage and M. Shibata (2006).
"The effect of iron on montmorillonite stability. (II) Experimental investigation." Geochimica et Cosmochimica Acta 70(2): 323-336.
Wilson, J., J. Cuadros and G. Cressey (2004). "An in situ time-resolved XRD-PSD investigation into Na-montmorillonite interlayer and particle rearrangement during dehydration." Clays and Clay Minerals 52(2): 180-191.
Woese, C. R. (1987). "Bacterial evolution." Microbiological Reviews 51(2): 221-271. Woese, C. R. and G. E. Fox (1977). "Phylogenetic structure of the prokaryotic domain: The primary
kingdoms." Proceedings of the National Academy of Sciences of the United States of America 74(11): 5088-5090.
Wogelius, R. A. and D. J. Vaughan (2000). Analytical, experimental and computational methods in environmental mineralogy. In: Environmental Mineralogy. R.A. Wogelius and D.J. Vaughan. Budapest, Eötvös University Press: 7-87.
Wu, J., C. B. Roth and P. F. Low (1988). "BIOLOGICAL REDUCTION OF STRUCTURAL IRON IN SODIUM-NONTRONITE." Soil Science Society of America Journal 52(1): 295-296.
Zachara, J. M., R. K. Kukkadapu, J. K. Fredrickson, Y. A. Gorby and S. C. Smith (2002). "Biomineralization of poorly crystalline Fe(III) oxides by dissimilatory metal reducing bacteria (DMRB)." Geomicrobiology Journal 19(2): 179-207.
Zachara, J. M. and J. P. McKinley (1993). "Influence of hydrolysis on the sorption of metal cations by smectites: Importance of edge coordination reactions - Dedicated to Paul W. Schindler on his retirement." Aquatic Sciences 55(4): 250-261.

___________________________________________________________________________
APPENDIX
___________________________________________________________________________

Appendix
194
a) b)
c) d)
e) f)
Preparation of bacteria containing reaction-cell experiments. a) Bacteria containing solution ispipetted onto pre-dried smectite powder. b) Bacteria and smectite are mixed close to the flame of aBunsen burner using a heat sterilized spatula. c) Powder is introduced into the reaction-cell andpressed down to enhance packing density. d) After adding some delaminated kaolinite as internalstandard the reaction-cell is sealed by an X-ray transparent capton foil and fixed with an o-ring.e) In order to maintain constant reaction volume the reaction-cell is additionally closed by a pressurecap that is fixed by screws. Solution is provided from a Teflon© bottle situated on top of the reaction-cell. f) Only the bottle and the pressure cap are temporarily removed for XRD-measurements.
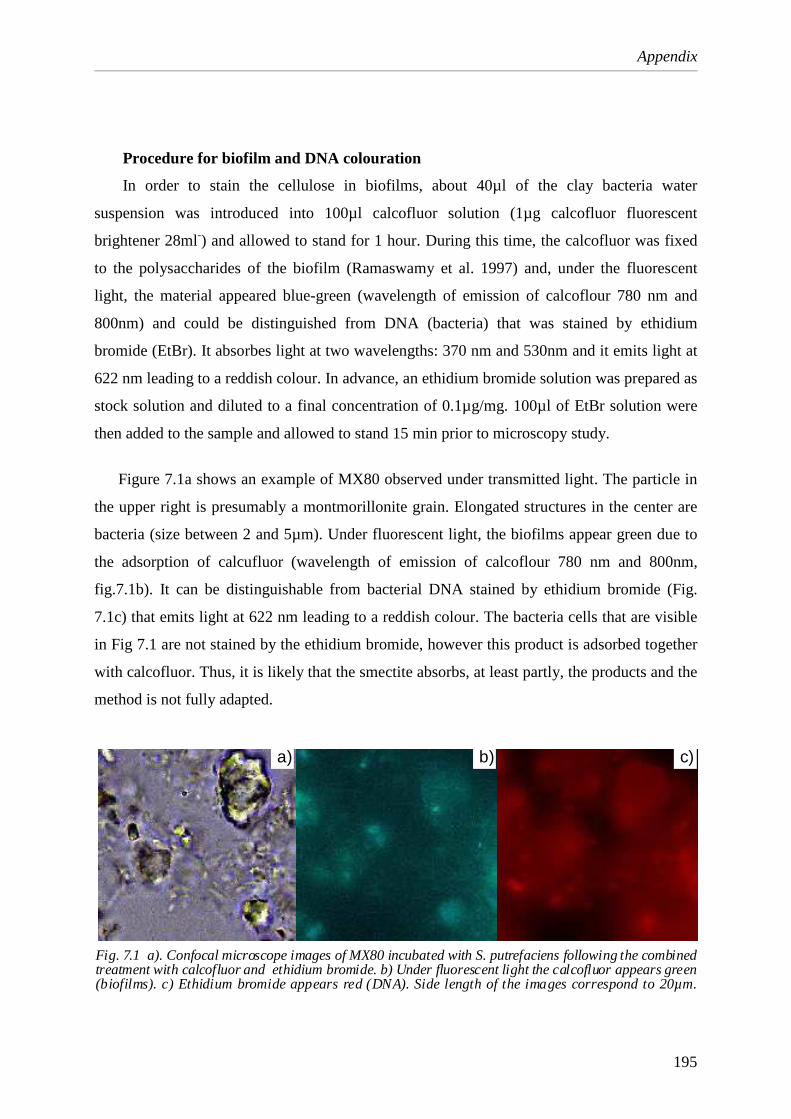
Appendix
195
Procedure for biofilm and DNA colouration
In order to stain the cellulose in biofilms, about 40µl of the clay bacteria water
suspension was introduced into 100µl calcofluor solution (1µg calcofluor fluorescent
brightener 28ml-) and allowed to stand for 1 hour. During this time, the calcofluor was fixed
to the polysaccharides of the biofilm (Ramaswamy et al. 1997) and, under the fluorescent
light, the material appeared blue-green (wavelength of emission of calcoflour 780 nm and
800nm) and could be distinguished from DNA (bacteria) that was stained by ethidium
bromide (EtBr). It absorbes light at two wavelengths: 370 nm and 530nm and it emits light at
622 nm leading to a reddish colour. In advance, an ethidium bromide solution was prepared as
stock solution and diluted to a final concentration of 0.1µg/mg. 100µl of EtBr solution were
then added to the sample and allowed to stand 15 min prior to microscopy study.
Figure 7.1a shows an example of MX80 observed under transmitted light. The particle in
the upper right is presumably a montmorillonite grain. Elongated structures in the center are
bacteria (size between 2 and 5µm). Under fluorescent light, the biofilms appear green due to
the adsorption of calcufluor (wavelength of emission of calcoflour 780 nm and 800nm,
fig.7.1b). It can be distinguishable from bacterial DNA stained by ethidium bromide (Fig.
7.1c) that emits light at 622 nm leading to a reddish colour. The bacteria cells that are visible
in Fig 7.1 are not stained by the ethidium bromide, however this product is adsorbed together
with calcofluor. Thus, it is likely that the smectite absorbs, at least partly, the products and the
method is not fully adapted.
a) b) c)
Fig. 7.1 a). Confocal microscope images of MX80 incubated with S. putrefaciens following the combinedtreatment with calcofluor and ethidium bromide. b) Under fluorescent light the calcofluor appears green(biofilms). c) Ethidium bromide appears red (DNA). Side length of the images correspond to 20µm.

Appendix
196
Estimating the generation times of exponentially growing cultures
The generation time is a growth parameter that indicates the time a population needs to
double in cfu. There is a direct relationship between initially present cells (N0) and the
number present after exponential growth (N), since one cell doubles to become two, those two
double to become 4 and so on. The generation time is included in this relationship where n is
the number of generations:
N = N02n
From knowledge of the initial and final cell numbers, it is possible to calculate the
number of generations and, from there, the time (t/n). The generation time can be as well
calculated directly from the slope of the line obtained in a semi-logarithmic plot of the
exponential growth (Fig. 7.2):
Slope = 0.301/g
slope for nontronite:= (log 1.56E07- log 6.96 E05) /(164 - 68)= 0,014generation time:= 0,301/ 0,014= 21,5
Fig. 7.2. Calculation of generation time based on the slope ofexponential growth in a semilogarithmic graph. The plot shows thelines for nontronite (light grey), Minimal Medium (MM; black) andmontmorillonite (dark grey).The slope is calculated by dividing ∆ yby ∆x. It is then sufficient to divide the number 0,301 by the valuesfor the slope to obtain the generation time (details see Madigan etal. 2003).The example calculation is done for nontronite.
68 h 164 h
y1
x2x1
y2nontronite: 0,014
Montmorillonite
MM
1.56E07
6.96E05

Appendix
197
Procedure for analyzing reaction-cell extracts
Between 0.2 -0.5 g of the sample where taken from the freshly opened reaction-cells.
Then, a 20 fold amount of Millipore water was added (0.2g corresponds to 4ml of water,
yielding a ratio of 50mg per ml for all samples). Precise amounts of sample material were
determined by weighing previously weighed sample tubes after adding the sample. The
samples were disaggregated in the ultra sonic bath twice for 15 minutes and allowed to stand
for 24h. After repeated ultrasonic treatment, the samples were centrifuged (3500rpm for 15
minutes), filtrated by using a filter (0.22µm) and acidified by using concentrated HNO3. The
same procedure was applied for the HCl extraction where a 1N HCl was used as the leaching
agent instead of water. As the samples were already acidified, further treatment with HNO3
was no longer necessary.
Calculating the amount of interlayer water
The relative abundance of water layers obtained from CALCMIX-calculations were used
to estimate the amount of interlayer water using data from isotherm absorption experiments of
montmorillonites (Bérend et al., 1995; Cases et al., 1997). The nontronite values were
estimated based on data of Jähnchen et al. (2006) and Milliken & Mustard (2007). An
example calculation on SWy-2 is given for the following abundances: 58% 0-WL, 34% 1-WL
and 8% 2-WL. The relative abundances of WL structures were multiplied with corresponding
values for WL structures (see table 7.1):
(0.58* 0) + (0.34* 0.12 ) + (0.08 * 0.24 ) = 0 + 0.04 + 0.02= 0.06ml/g.
IBECO seal 80 (Na+)
TIXOTON-TE (Ca2+)
MX80
(Na+/Ca2+)
SWy-2-Montmorillonite
(Na+)
Nontronite (NAu-1) (Ca2+)
1-WL 0.12 0.11 0.09 0.12 0.12
2-WL 0.24 0.22 0.18 0.24 0.25
3-WL 0.36 0.33 0.27 0.36 0.37
4-WL 0.49 0.44 0.36 - 0.51
Table 7.1. Values used to calculate interlayer water (ml/g) as taken from water vapour adsorption isotherms (Bérend et al., 1995; Cases et al., 1997) for the homoionic montmorillonites and from (Sauzeat et al., 2001) for MX80. Values for nontronite were taken from (Jänchen et al., 2006; Milliken &Mustard, 2007). As values for 3 and 4-WL structures were not presented in the literature the data was interpolated based on values for 1 and 2-WLs.

Appendix
198
Calculation of surface areas based on number of particles per stack
The number of layers per stack (N; the particle thickness) changes during hydration and,
therefore, was adjusted in the CALCMIX-software calculations. In each experiment, the N
value obtained for the initial and most dehydrated states was taken as a reference. In most of
the samples, this was around 18 particles per stack and, although higher numbers were
obtained in other studies, the lower values were taken to be consistent and, thus, assumed to
correspond to the N value during the outgassing conditions of BET measurements. The
decrease in layers per stack can be expressed as a relative increase in surface. The increase of
the external surface was calculated based on the following relationships:
Change in number of surfaces (∆N):
∆N = Ninit / N * 2 Ninit = Number of layers per stack at dry state N = Number of layers per stack (CALCMIX)
Calculation of theoretical corresponding surface area (Scalc):
Scalc = SSABET/ (∆N * 2) SSABET = measured BET surface area ∆N = Change in number of layers
The limitations of this method were obtained when calculating the maximal surface area
for monolayer particles (table 7.2.). Here, smectites with divalent interlayer cations,
theoretically, yield higher values than possible. This is basically due to the higher hydration
energy of Ca that induces interlayer hydration at all relative pressures and, consequently, the
BET surface area does include internal surfaces already at the “dry” state (Cases et al., 1997).
IBECO TIXOTON MX80 Nontronite SWy-2
Particles per stack initial (corresponding to BET)
18 18 19 15 18
BET - surface area [m2/g]
55.33 103.01 30.03 83.98 27.64
Calculated maximal surface area [m2/g]* 995.94 (1854) 570.6 (1259.7) 498.1
Table 7.2. Theoretical surface area based on changes in layers per stack. * Assuming 1 layer per stack (monolayers). Values for materials with divalent interlayer cations (TIXOTON and nontronite) overestimate the theoretical surface area.

Appendix
199
CALCMIX
Example of the user interface of the CALCMIX results page after fitting a whole rock profile taken from the user manual (Plançon & Drits, 1999).

Appendix
200
Comparison between the measured and manually fitted (calculated) patterns using
CALCMIX:

Appendix
201
2 4 6 8 10 12 142 Theta
0
500
2500
3000
3500
4000
1500
2000
1000
2 4 6 8 10 12 142 Theta
0
500
2500
3000
3500
4000
1500
2000
1000
bacteria containing MX80 (1.6g/cm3)
sterile, pre-hydrated MX80 (1.6g/cm3)
2 4 6 8 10 12 142 Theta
0
500
2500
3000
3500
1500
2000
1000
2 4 6 8 10 12 142 Theta
0
500
2500
3000
3500
1500
2000
1000
measurement
Selected measured and calculated X-ray diffraction patters from the confined volumereaction-cell experiments (hydrated sterile and bacteria containing MX80).
calculation

Appendix
202
0
16000
8000
4000
12000
0
16000
8000
4000
12000
2 4 6 8 10 12
2 Theta2 4 6 8 10 12
2 Theta
0
3500
2500
1500
1000
3000
2000
500
2 4 6 8 10 12
2 Theta
0
3500
2500
1500
1000
3000
2000
500
2 4 6 8 10 12
2 Theta
bacteria containing, hydratednontronite
sterile, hydrated nontronite
measurement calculation
0
2500
1500
500
2000
1000
2 4 6 8 10
2 Theta
0
2500
1500
500
2000
1000
2 4 6 8 10
2 Theta
pre-dried, sterile nontronite
Selected measured and calculated X-ray diffraction patters from the confined volumereaction-cell experiments (Pre-dried and hydrated, sterile and bacteria containingnontronite).

Appendix
203
Biomineralisation
Biologically induced mineralization often occurs is a passive way, as a byproduct of the
cells metabolic activity (Lowenstam, 1981) or due to the fact that they serve as nucleation
sites (Ehrlich, 1996; , 1999; Kronhauser, 2007). The precipitation of amorphous silica was,
for example, observed by TEM in biotic nontronite solution experiments and could be
attributed to bacterially induced dissolution followed by precipitations. Furukawa and
O’Reilly (2007) observed, in addition, the formation of Si globules which was interpreted to
occur in combination with polymerization and stabilization by “biomolecules”.
Another precipitate that was observed only in bacteria containing nontronite samples
(XRD) was the hydrated iron phosphate vivianite ( Fe3(PO4)2 * 8H2O) that formed as a
function of Fe(II) concentration and dissolved phosphate (Kronhauser, 2007). As this mineral
was only detected at later stages of the experimentation and because its formation was
described to be inhibited by viable S. putrefaciens cells (Jorand et al., 2000), it is likely that it
precipitated after cell death by using phosphate, which was released during cell lyses. A
similar process can be assumed for the precipitation of the sodium sulfate mirabilite (Na2 SO4
*10H2O) which was, as well, only visible in bacteria containing samples.
In case of both, the sterile and S. putrefaciens containing longterm MX80 experiments, the
presence of “green rust”, an iron carbonate with the generalized formula Fe6(OH)12(CO3), was
detected. Regarding its formation, the Fe might derive from pyrite, which makes up about
0.5% of the whole rock samples (Chapter 3). Because of this small amount, it could not be
clearly detected in XRD patterns (Fig. 5.4.7) but it might have contributed to Fe oxide
formation. Pyrite is oxidized in contact with the experimental solution pyrite according to the
(simplified) reaction:
FeS2 + 15/2 O2 + 7/2 H2O � Fe(OH)3 + 2SO42- + 4H+
This reaction leads, besides a decrease in pH and the formation of sulphate and the
precipitation of Fe(III)-hydroxides, which are then available to form the iron carbonate. The
carbonate required for this formation might derive from the dissolved calcite according to the
reaction:
CaCO3 + H2O � Ca2++ HCO3- + OH-
Appendix
204
This reaction buffers the pH to some degree and leads, at the same time, to a release of
Ca2+ cations. It is possible that the calcium participates together with the sulfate (released
from pyrite oxidation) to form the bassanite, frequently found both in bacteria containing and
bacteria free samples:
Ca2+ + 0.5 H2O + SO42- � CaSO4 *0.5 H2O
Precipitation of green rust is visible in both the bacteria containing and the sterile sample.
In the latter, the X-ray diffraction reflection of this mineral is constantly changing in intensity,
which indicates an alternating dissolution and precipitation reactions. The same effect is
visible in the case of calcite, bassanite and rhodocrosite (MnCO3). As rhodochrosite formation
requires iron reduction in combination with and excess of HCO3- its presence and
disappearance indicates fluctuations in both Eh and pH conditions (Kronhauser, 2007).
In the presence of bacteria, the system appears less susceptible to mineralogical
fluctuations. This is visible with the continuous dissolution of calcite, the synchronous
formation of lepidocrocite (γ-FeOOH) and in the stable reflection of green rust. O’Loughlin
and co-workers (2007) stated that the formation of green rust occurs as a result of bacterially
reduced lepidocrocite. Nevertheless, this could not be confirmed from the MX80 experiments,
since both phases co-exist and the anaerobic conditions alone induce the formation of the rust
phase. In contrast, it seems that the presence of bacteria leads to a stabilization of the redox
conditions and a buffering of pH. However, direct measurements of this parameters in the
reaction-cells are not possible yet.
