jubilee line - site investigation - · pdf file1 student no. eep50181 1.0 summary this...
TRANSCRIPT
1
Student no. eep50181
1.0 SUMMARY
This Geotechnical Report relates to a Site Investigation undertaken by Messrs Soil Mechanics
Limited on behalf of London Underground Limited involving Package 4 of the proposed
Jubilee Line Extension in the Bermondsey area of London.
A total of twenty (20 no.) boreholes (14 Cable Percussive, 2 Cable Percussive followed by
rotary drilling, 2 open hole drilled then rotary drilled, 2 Cable Percussive and Self-Boring
Pressuremeter tests) were completed across the site in order to determine the nature and
consistency of the soils beneath the site. This programme of works commenced on the 24th
September, 1990 and ended on the 14th
November, 1990. Drilling depths range from -24.93
mOD (27.60 mbgl) in BH 413P to -49.84 mOD (53.05 mbgl) in BH404T, with the majority
of excavations being completed to a depth of 30.00 to 40.00 mbgl. The soils encountered
include Made Ground, Alluvium and Terrace Gravels (Superficial deposits) overlying solid
geology of the London Clay Formation, Lambeth Group, Thanet Sand Formation and Upper
Chalk Formation. Piezometers were subsequently installed following excavations, and
monitoring completed.
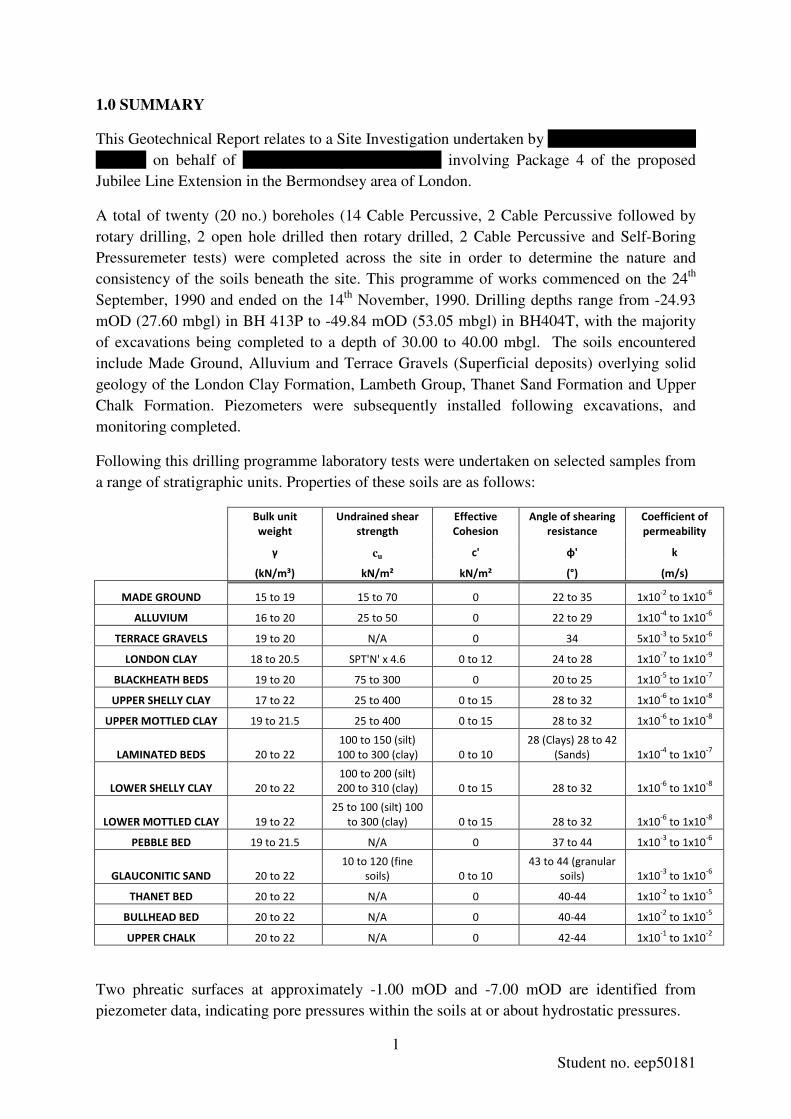
Following this drilling programme laboratory tests were undertaken on selected samples from
a range of stratigraphic units. Properties of these soils are as follows:
Bulk unit
weight
Undrained shear
strength
Effective
Cohesion
Angle of shearing
resistance
Coefficient of
permeability
γ cu c' φ' k
(kN/m³) kN/m² kN/m² (°) (m/s)
MADE GROUND 15 to 19 15 to 70 0 22 to 35 1x10⁻²
to 1x10⁻⁶
ALLUVIUM 16 to 20 25 to 50 0 22 to 29 1x10⁻⁴
to 1x10⁻⁶
TERRACE GRAVELS 19 to 20 N/A 0 34 5x10⁻³
to 5x10⁻⁶
LONDON CLAY 18 to 20.5 SPT'N' x 4.6 0 to 12 24 to 28 1x10⁻⁷
to 1x10⁻⁹
BLACKHEATH BEDS 19 to 20 75 to 300 0 20 to 25 1x10⁻⁵
to 1x10⁻⁷
UPPER SHELLY CLAY 17 to 22 25 to 400 0 to 15 28 to 32 1x10⁻⁶
to 1x10⁻⁸
UPPER MOTTLED CLAY 19 to 21.5 25 to 400 0 to 15 28 to 32 1x10⁻⁶
to 1x10⁻⁸
LAMINATED BEDS 20 to 22
100 to 150 (silt)
100 to 300 (clay) 0 to 10
28 (Clays) 28 to 42
(Sands) 1x10⁻⁴
to 1x10⁻⁷
LOWER SHELLY CLAY 20 to 22
100 to 200 (silt)
200 to 310 (clay) 0 to 15 28 to 32 1x10⁻⁶
to 1x10⁻⁸
LOWER MOTTLED CLAY 19 to 22
25 to 100 (silt) 100
to 300 (clay) 0 to 15 28 to 32 1x10⁻⁶
to 1x10⁻⁸
PEBBLE BED 19 to 21.5 N/A 0 37 to 44 1x10⁻³
to 1x10⁻⁶
GLAUCONITIC SAND 20 to 22
10 to 120 (fine
soils) 0 to 10
43 to 44 (granular
soils) 1x10⁻³
to 1x10⁻⁶
THANET BED 20 to 22 N/A 0 40-44 1x10⁻²
to 1x10⁻⁵
BULLHEAD BED 20 to 22 N/A 0 40-44 1x10⁻²
to 1x10⁻⁵
UPPER CHALK 20 to 22 N/A 0 42-44 1x10⁻¹
to 1x10⁻²
Two phreatic surfaces at approximately -1.00 mOD and -7.00 mOD are identified from
piezometer data, indicating pore pressures within the soils at or about hydrostatic pressures.

2
Student no. eep50181
CONTENTS:
1.0 SUMMARY ......................................................................................................................... 1
2.0 INTRODUCTION ............................................................................................................... 4
3.0 SITE DETAILS ................................................................................................................... 4
3.1 TOPOGRAPHY ............................................................................................................... 4
3.2 GEOLOGY ...................................................................................................................... 4
3.2.1 Made Ground ............................................................................................................ 5
3.2.2 Alluvium (includes Peat) .......................................................................................... 5
3.2.3 River Terrace Gravels ............................................................................................... 5
3.2.4 London Clay.............................................................................................................. 5
3.2.5 Blackheath Beds........................................................................................................ 5
3.2.6 Reading Formation – Lambeth Group ...................................................................... 5
3.2.6.1 Upper Mottled Clay ........................................................................................... 5
3.2.6.2 Lower Mottled Clay ........................................................................................... 6
3.2.7 Woolwich Formation – Lambeth Group ................................................................... 6
3.2.7.1 Upper Shelly Clay .............................................................................................. 6
3.2.7.2 Laminated Beds ................................................................................................. 6
3.2.7.3 Lower Shelly Clay ............................................................................................. 6
3.2.8 Upnor Formation – Lambeth Group ......................................................................... 6
3.2.8.1 Pebble Bed ......................................................................................................... 6
3.2.8.2 Glauconitic Sand ................................................................................................ 7
3.2.9 Thanet Sand Formation ............................................................................................. 7
3.2.9.1 Thanet Beds ....................................................................................................... 7
3.2.9.2 Bullhead Bed ...................................................................................................... 7
3.2.10 Upper Chalk Formation .......................................................................................... 7
4.0 GROUND INVESTIGATION............................................................................................. 7
4.1 EXCAVATIONS ............................................................................................................. 8
4.2 IN-SITU TESTING ......................................................................................................... 9
4.3 INSTALLATIONS ........................................................................................................ 10
4.4 SAMPLING ................................................................................................................... 10
4.5 LABORATORY TESTING........................................................................................... 10
4.6 GROUNDWATER MONITORING ............................................................................. 11
5.0 GROUND CONDITIONS ................................................................................................. 11
5.1 STRATIGRAPHY ......................................................................................................... 11
5.2 GROUNDWATER CONDITIONS ............................................................................... 12
5.3 GEOTECHNICAL CHARACTERISATION ............................................................... 12
5.3.1 Made Ground .......................................................................................................... 12

3
Student no. eep50181
5.3.2 Alluvium ................................................................................................................. 13
5.3.3 Terrace Gravel ........................................................................................................ 14
5.3.4 London Clay............................................................................................................ 15
5.3.5 Blackheath Beds...................................................................................................... 17
5.3.6 Upper Shelly Clay ................................................................................................... 18
5.3.7 Upper Mottled Clay ................................................................................................ 19
5.3.8 Laminated Beds ...................................................................................................... 21
5.3.9 Lower Shelly Clay .................................................................................................. 22
5.3.10 Lower Mottled Clay .............................................................................................. 24
5.3.11 Pebble Bed ............................................................................................................ 25
5.3.12 Glauconitic Sand ................................................................................................... 27
5.3.13 Thanet Bed ............................................................................................................ 28
5.3.14 Bullhead Bed ......................................................................................................... 29
5.3.15 Upper Chalk .......................................................................................................... 30
6.0 CONCLUSIONS................................................................................................................ 31
7.0 REFERENCES .................................................................................................................. 33
FIGURES:
1. SITE LOCATION PLAN
2. BOREHOLE LOCATION PLAN
3. GEOLOGICAL MAP
4. CROSS SECTION BH401-BH409
5. CROSS SECTION BH409-BH419
6. PORE PRESSURE VS REDUCED LEVEL
7. SPT VS REDUCED LEVEL
8. MOISTURE CONTENT VS REDUCED LEVEL
9. PLASTICITY CHART
10. UNDRAINED SHEAR STRENGTH VS REDUCED LEVEL
11. SULPHATE & pH DATA
APPENDICES:
1. BOREHOLE LOGS
2. LABORATORY TEST RESULTS
3. PIEZOMETER READINGS

4
Student no. eep50181
2.0 INTRODUCTION
A Site Investigation was undertaken by Messrs Soil Mechanics Limited in 1990 - carried out
in accordance with the 1987 specifications for Ground Investigation published by the
Department of Transport (Attewell, 1995, p. 39).
These works were completed on behalf of London Underground Limited and involved
Package 4 of the proposed Jubilee Line Extension, comprising of 20 boreholes (18 Cable
Percussive, 2 Rotary) sited in the Bermondsey area of London. Drilling works were
completed on the 16th
November, 1990.
The purpose of the investigation was to determine the ground conditions prior to the proposed
tunnelling in the Bermondsey area.
The following factual and interpretative report describes the works undertaken and presents
copies of the test data obtained.
3.0 SITE DETAILS
3.1 TOPOGRAPHY
The site is represented by the obtained borehole data of Package 4, and follows the proposed
tunnelling route of the extension works southeast of London Bridge Station in Bermondsey,
eastwards towards Canada Water in Rotherhithe.
In view of the proposed tunnelling programme, the site extents (in Easting’s and Northing’s)
are considered to be linear, running from 533343, 179834 (BH401) in the east, to 535222,
179445 (BH417) in the west (Figs. 1 & 2). This generally follows the River Thames at a
distance of approximately 400m from the south bank across the linear run. In plan view, the
tunnel is understood to follow the overland train line southeast of Tower Bridge Station
towards South Bermondsey Station for approximately 600m before curving eastwards and
east-north-eastwards beneath Jamaica Road to the newly proposed Bermondsey Tube Station.
Following on from Bermondsey Tube Station the proposed tunnel route continues eastwards
beneath Southwark Park. The extent of this site area terminates at the corner of Neptune
Street and Moodkee Street on the ‘Canada Estate’.
Across the site the street levels are relatively flat, ranging from 1.9mOD in the western
extent, to 3.6mOD in the east (EDINA, 2010).
3.2 GEOLOGY
The site is considered to be located on a number of solid and drift deposits at or near ground
level (Fig. 3) identified in BGS solid and drift 1:50,000 maps (256 - North London; 270 -
South London). For simplicity, the geological units which are likely to be encountered at
depth across the site, from superficial to solid geological units are described below in order of
youngest to oldest.

5
Student no. eep50181
3.2.1 Made Ground
Often very variable in thickness, these deposits are representative of the urbanisation and
industrial development (Burland et al. 2001, p62). This stratum can be considered as highly
variable in nature, consisting of a mix of concrete, rubble, brick and refuse intermingled with
gravel and sands frequently within a matrix of silt or clay.
3.2.2 Alluvium (includes Peat)
This stratum is localised around the River Thames, generally resting unconformably upon
River Terrace Gravels (Ellison, 2004). The Alluvium consists predominantly of silty clay and
clayey silt, with locally developed beds of fine-to coarse-grained sand. Interbedded peat is
known to occur eastwards of Southwark and Westminster, with the most extensive deposits
extending west to the Rotherhithe tunnel (Ellison, 2004).
3.2.3 River Terrace Gravels
These deposits consist of variable proportions of sand and gravel, having been deposited in a
braided river system approximately 5km wide across the River Thames floodplain (Ellison,
2004). The appended geological map (Fig. 3) suggests that deposits in this region of London
are representative of the Taplow Gravel Formation, resting unconformably upon the solid
geology of the area.
3.2.4 London Clay
The London Clay Formation is predominantly argillaceous in its upper part, with the majority
of the formation comprising overconsolidated heavily bioturbated, fissured bluish-grey
slightly calcareous, silty to very silty clay (Ellison, 2004) often containing pyrite and
carbonate concretions (claystone) of ferroan calcite (Huggett, 1994 in Ellison, 2004). This
upper part is often oxidised and weathered to a brown colouration, whilst the basal unit is
notably sandier and siltier than the upper horizons (Burland et al, 2001).
3.2.5 Blackheath Beds
Underlying the London Clay, this stratum is generally less than 1m thick (Burland et al,
2001), and generally comprises of sands, gravels and pebble beds (Hight et al. 2004; Ellison,
2004).
3.2.6 Reading Formation – Lambeth Group
3.2.6.1 Upper Mottled Clay
Identified principally within cores in central and eastern London, this stratum consists
predominantly of mottled clay, silty clay and silts with colours including pale brown, pale
grey-blue, dark brown, pale green, red-brown and crimson, based upon the oxidation state of
the constituents (Ellison, 2004). At the base of this unit laminated sand and/or silt with minor
burrowing and local ripple laminations are evident (Hight et al, 2004).

6
Student no. eep50181
3.2.6.2 Lower Mottled Clay
Although similar to the Upper Mottled Clay, this lower horizon also includes purple to the list
of potential colourations (Ellison, 2004). Furthermore, it is also noted to contain carbonate
nodules up to 0.5m in diameter, particularly in the top parts – in east London these appear to
have coalesced to form a limestone up to 1.6m thick (Hight et al, 2004). Minor amounts of
irregularly cemented calcareous clayey sands are recorded in east London, becoming
increasingly dominant further eastwards (Hight et al, 2004).
3.2.7 Woolwich Formation – Lambeth Group
3.2.7.1 Upper Shelly Clay
Distributed mainly in south London between Westminster and Bermondsey (Ellison et al,
2004; Height et al, 2004), this strata is generally a maximum thickness of 3m, comprising
grey shelly clay thinly interbedded with grey-brown silt and fine sand (Height et al, 2004).
Locally, there is a weakly cemented shell bed up to 0.43m thick, whilst between Bermondsey
and Lewisham a continuous grey limestone bed (the Paludina Limestone) can be identified,
with a thickness of 0.1-1.83m (Ellison, 2004).
3.2.7.2 Laminated Beds
Generally resting conformably on the Lower Shelly Clay, this stratum generally comprises of
thinly interbedded and laminated fine- to medium-grained sands, silts and clays with
scattered shells (Ellison, 2004). Localised bodies of sand of thicknesses up to 4m – probable
buried channels – are known to occur particularly around the Lambeth and Bermondsey
areas, and typically comprise of pale olive to pale brown medium-grained well sorted sands
(Hight et at, 2004).
3.2.7.3 Lower Shelly Clay
Generally thickening from central London towards the south-east, this rests disconformably
on the Lower Mottled Clay of the Reading Formation, whilst the top of the unit is generally
sharp or transitional with the Laminated Beds or the Upper Mottled Clay (Ellison, 2004). The
predominant lithology is that of dark grey to black clay, with abundant shell fragments (Hight
et al, 2004). Some beds are almost entirely formed of weakly cemented shells, whilst less
often brownish grey clay beds, slightly cemented with siderite (Ellison, 2004) are identifiable
through this highly variable stratum. An oyster-rich bed can occur locally near the base
(Hight et al, 2004).
3.2.8 Upnor Formation – Lambeth Group
3.2.8.1 Pebble Bed
This unit can only be identifiable as a separate substratum from the lower Glauconitic Sand
unit in the London area (Ellison, 1991 in Hight et al, 2004).In this area this strata is up to 3m
thick, generally comprising of well-rounded flint pebbles, generally less than 30mm in
diameter, but have been identified as large as 200mm (Hight et al, 2004; Ellison, 2004).

7
Student no. eep50181
3.2.8.2 Glauconitic Sand
Dominated by fine- to medium-grained sand and clayey sands with variable amounts of
glauconite grains of fine to medium sands – grey to greenish grey when fresh, weathering to
pale grey-brown and yellow brown (Hight et al, 2004). Localised carbonate concretions have
developed either as hard irregular masses or powdery patches up to 0.5m in diameter (Ellison,
2004). Sporadic beds of well-rounded flint pebbles (Hight et al, 2004) occur throughout this
unit, as do clay dominated units of up to 0.3m thickness (Ellison, 2004).
It is important to note that the relationship between the Lambeth Group Formations is most
complex in London’s central and south-east extents, (Ellison, 2004), with interbedding
between the Reading and Woolwich Formations common, and the Upnor Formation less so.
3.2.9 Thanet Sand Formation
3.2.9.1 Thanet Beds
Consisting of a generally coarsening-upwards sequence of fine-grained heavily bioturbated
grey sands (Ellison, 2004), these beds reach a maximum thickness of approximately 30m
within the London Basin (Royse et al, 2008). The lower beds are noticeably clayey and silty,
whilst bioturbation structures are identifiable by wisps of dark grey clay and silty clay
(Ellison, 2004).
3.2.9.2 Bullhead Bed
Marking the bottom of the Thanet Sand Formation, this bed is considered to be a basal
conglomerate, consisting of sporadic rounded black flint pebbles (Royse et al, 2008) set
within a dark greenish grey, clayey fine- to coarse-grained sandy matrix with glauconite
pellets (Ellison, 2004).
3.2.10 Upper Chalk Formation
Essentially a very fine-grained white Limestone, this formation consists predominantly of
coccoliths composed almost entirely of calcium carbonate in the form of low magnesian
calcite, with sporadic to occasional flint bands (Ellison, 2004). In the London area the lower
parts of this formation is mapped as the Lewes Chalk, or the Lewes Nodular Chalk, which is
best defined as a hard to very hard nodular Chalk with interbedded soft to hard gritty Chalks
and regular flint bands (Bristow et al, 1997).
4.0 GROUND INVESTIGATION
The following works were undertaken in order to assess the soils and subsoils beneath the
proposed Package 4 Jubilee Line extension. These works were undertaken by Messrs Soil
Mechanics Ltd, commencing on the 24th
September, 1990, and ending on the 17th
December,
1990.

8
Student no. eep50181
4.1 EXCAVATIONS
A total of twenty (20 no.) boreholes were completed across the site in order to determine the
nature and consistency of the soils beneath the site. This programme of works commenced on
the 24th
September, 1990 and ended on the 14th
November, 1990. Drilling depths range from -
24.93 mOD (27.60 mbgl) in BH 413P to -49.84 mOD (53.05 mbgl) in BH404T, with the
majority of excavations being completed to a depth of 30.00 to 40.00 mbgl. Chiselling of
harder strata horizons was undertaken where necessary. Hand-dug starter pits were completed
at all locations to a depth of between 0.60 mbgl (metres below ground level) and 1.20 mbgl in
order to check for utilities before drilling was commenced.
Fourteen (14 no.) of these boreholes were completed using Cable Percussive techniques in
shell diameters of between 150mm and 250mm depending on the number of reductions
required per borehole (depth and geology dependant).
A further two (2 no.) boreholes were initially excavated using open hole drilling (404T,
407T) using a tricone rock bit, followed by Rotary drilling to the base of the boreholes.
Similarly, two (2 no.) boreholes (410T and 415T) were commenced using Cable Percussive
methods, followed by Rotary drilling methods to the base of the boreholes. In all four
boreholes Rotary drilling employed polymer mud flush and SK6L wireline 100mm coring
equipment.
The remaining two (2no.) boreholes (403P and 413P) were drilled using Cable Percussive
equipment with the inclusion, at times, of Self-Boring Pressuremeter (SBP) tests), used
primarily to drill and test the London Clay Formation and Upper Mottled Clays and, where
applicable, the Thanet Sand Formation.
A more in-depth summary of each borehole is outlined in Table 1 below.

9
Student no. eep50181
Table 1 – Borehole data including location, start and finish dates, depths and inspection pit information.
4.2 IN-SITU TESTING
A number of tests were undertaken within the boreholes during excavation. These included
the following:
Standard Penetration Tests (SPT), with Split spoon testing completed within clay and silt
horizons and Cone Penetration Testing (CPT) were completed within sand and gravel
horizons during Cable Percussive excavation. Both methods are essentially the same,
although split spoon testing allows a sample to be retrieved, whilst CPT methods involve a
solid cone penetrating the strata, and therefore no sample in obtained. These tests involve an
initial number of seating blows to a depth of 150mm from the test start datum, with the
number of blows required to drive the split spoon or cone a further 300mm counted, giving
an N-value.
Down-hole falling head permeability tests were undertaken during the drilling operations
within a number of the boreholes (403, 404T, 409, 411 413P, 414, 416, 417, 418, 419).
BH Drilling Method Eastings Northings
Hand
Dug Pit
Depth
(mBGL)
Start Finish
Depth
(m) Date
Reduced
Level
(mOD)
Date
Reduced
Level
(mOD)
401 Cable Percussive 533344 179834 1.2 24/09/1990 2.96 29/09/1990 -36.74 39.70
402 Cable Percussive 533435 179831 1.1 24/09/1990 3.45 03/10/2009 -33.05 36.50
403 Cable Percussive 533557 179755 1.2 22/10/1990 3.4 02/11/1990 -36.60 40.00
403P Cable Percussive/SBP 533551 179737 1.2 01/10/1990 3.52 21/10/1990 -34.48 38.00
404T Open Hole/Rotary 533638 179605 1.1 24/09/1990 3.21 03/10/1990 -49.84 53.05
405 Cable Percussive 533761 179560 1.2 02/10/1990 3.51 14/10/1990 -36.49 40.00
406 Cable Percussive 533888 179456 1.2 04/10/1990 3.48 15/10/1990 -33.32 36.80
407T Open Hole/Rotary 534043 179407 1.2 08/10/1990 3.26 19/10/1990 -47.11 50.37
408 Cable Percussive 534223 179348 0.8 05/10/1990 2.91 12/10/1990 -32.09 35.00
409 Cable Percussive 534389 179384 0.8 11/10/1990 2.55 18/10/1990 -27.25 29.80
410T
Cable
Percussive/Rotary 533406 179414 0.6 17/10/1990 2.79 30/10/1990 -40.71 43.50
411 Cable Percussive 534455 179389 1.2 15/10/1990 2.42 22/10/1990 -37.83 40.25
412 Cable Percussive 534478 179436 1.2 04/10/1990 2.54 15/10/1990 -33.46 36.00
413P Cable Percussive/SBP 534525 179429 1 30/10/1990 2.67 14/11/1990 -24.93 27.60
414 Cable Percussive 534649 179451 1.2 15/10/1990 2.89 28/10/1990 -37.06 39.95
415T
Cable
Percussive/Rotary 534905 179439 0.8 06/10/1990 2.5 18/10/1990 -38.30 40.80
416 Cable Percussive 535100 179499 0.95 16/10/1990 2.51 22/10/1990 -27.49 30.00
417 Cable Percussive 515222 179446 1 19/10/1990 1.95 31/10/1990 -33.05 35.00
418 Cable Percussive 534815 179469 1.1 17/10/1990 3.12 24/10/1990 -36.83 39.95
419 Cable Percussive 534985 179460 1 16/10/1990 2.52 21/10/1990 -27.48 30.00

10
Student no. eep50181
Self-boring Pressuremeter (SBP) tests were conducted within boreholes 403P and 413P.
These tests enable a variety of total and effective stresses to be determined in-situ for clays
and silts, including undrained shear strength (cu) and pore water pressures (Clarke, 1990). In
sands, this test method can determine the angle of shearing resistance, angle of dilation, and
the secant and tangential shear modulus (Hughes et al, 1977).
4.3 INSTALLATIONS
The majority of the boreholes excavated during this investigation were installed with one
piezometer and sand filter in order to enable groundwater measurements and fluctuations
across the line of section. Exceptions to this include six (6 no.) boreholes (402, 403, 407T,
410T, 415T and 416) which were dual-installed with an upper and lower piezometer, and
BH403P, which was not installed. Following installation or completion all boreholes were
backfilled with bentonite.
4.4 SAMPLING
In excess of 1200 samples have been collected for testing and characterisation. These
involved different sampling methodology involving the following:
• Undisturbed Samples within clayey and silty horizons – Obtained predominantly
using 100mm diameter driven tubes. Some samples obtained using pushed piston
methods.
• Small disturbed samples – Obtained from SPT tests in clayey and silty horizons, or
taken at intervals determined by the drilling methodology.
• Bulk disturbed samples – Obtained following CPT testing on sand and gravel
horizons.
• Core samples – extracted from rotary cored boreholes (404T, 407T, 410T and 415T)
• Water samples – Extracted from a number of boreholes on occasions where
groundwater levels were noted.
4.5 LABORATORY TESTING
A number of tests were conducted on a selection of the samples extracted from the borehole
programme in order to give a good and detailed spread of the site data. Laboratory testing
was undertaken by Messrs Soil Mechanics Ltd, with the following tests undertaken:
• Index Properties testing on clayey and silty samples in order to identify the Liquid and
Plastic Limits of the samples, their Plasticity Index, and the natural moisture contents.
• Undrained triaxial tests were undertaken on undisturbed clay and silt samples in order
to calculate the undrained shear strength (cu) values of a selection of samples. Where
deemed appropriate, the laboratory cut three (3no.) 38mm diameter undisturbed
samples from the original 100mm diameter samples in order to subject the soil to
different cell pressures.
• Soil and water sulphate tests, including pH testing, were undertaken on a number of
water, undisturbed and disturbed samples.
11
Student no. eep50181
The results of all the laboratory tests are located in Figures 7 to 11.
4.6 GROUNDWATER MONITORING
Monitoring of all the installed piezometers was undertaken in the period of the 4th
October
1990 to the 17th
December 1990. All installations were monitored for the depth of the
groundwater on several occasions over this period with the exception of BH403.
The results from groundwater monitoring have been plotted on the cross-sections (Figures 4
& 5), with pore pressures calculated and plotted in Figure 6.
5.0 GROUND CONDITIONS
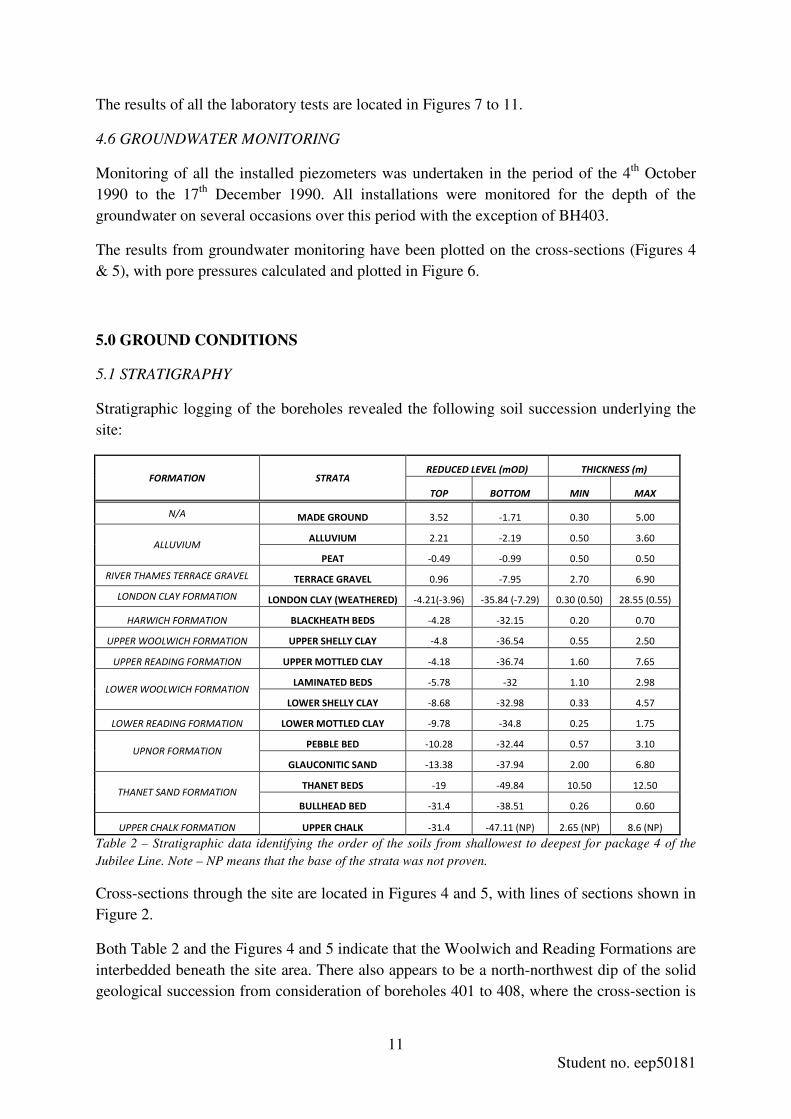
5.1 STRATIGRAPHY
Stratigraphic logging of the boreholes revealed the following soil succession underlying the
site:
FORMATION STRATA REDUCED LEVEL (mOD) THICKNESS (m)
TOP BOTTOM MIN MAX
N/A MADE GROUND 3.52 -1.71 0.30 5.00
ALLUVIUM ALLUVIUM 2.21 -2.19 0.50 3.60
PEAT -0.49 -0.99 0.50 0.50
RIVER THAMES TERRACE GRAVEL TERRACE GRAVEL 0.96 -7.95 2.70 6.90
LONDON CLAY FORMATION LONDON CLAY (WEATHERED) -4.21(-3.96) -35.84 (-7.29) 0.30 (0.50) 28.55 (0.55)
HARWICH FORMATION BLACKHEATH BEDS -4.28 -32.15 0.20 0.70
UPPER WOOLWICH FORMATION UPPER SHELLY CLAY -4.8 -36.54 0.55 2.50
UPPER READING FORMATION UPPER MOTTLED CLAY -4.18 -36.74 1.60 7.65
LOWER WOOLWICH FORMATION LAMINATED BEDS -5.78 -32 1.10 2.98
LOWER SHELLY CLAY -8.68 -32.98 0.33 4.57
LOWER READING FORMATION LOWER MOTTLED CLAY -9.78 -34.8 0.25 1.75
UPNOR FORMATION PEBBLE BED -10.28 -32.44 0.57 3.10
GLAUCONITIC SAND -13.38 -37.94 2.00 6.80
THANET SAND FORMATION THANET BEDS -19 -49.84 10.50 12.50
BULLHEAD BED -31.4 -38.51 0.26 0.60
UPPER CHALK FORMATION UPPER CHALK -31.4 -47.11 (NP) 2.65 (NP) 8.6 (NP)
Table 2 – Stratigraphic data identifying the order of the soils from shallowest to deepest for package 4 of the
Jubilee Line. Note – NP means that the base of the strata was not proven.
Cross-sections through the site are located in Figures 4 and 5, with lines of sections shown in
Figure 2.
Both Table 2 and the Figures 4 and 5 indicate that the Woolwich and Reading Formations are
interbedded beneath the site area. There also appears to be a north-northwest dip of the solid
geological succession from consideration of boreholes 401 to 408, where the cross-section is

12
Student no. eep50181
from northwest to southeast. This is less evident in the remaining boreholes because the
corresponding cross-section is orientated west to east.
5.2 GROUNDWATER CONDITIONS
Groundwater levels monitored and measured within the piezometers were observed to form
two distinct phreatic surfaces present (Figure 6). An upper surface at approximately -1.00
mOD is identified, whilst a second, lower phreatic surface at approximately -7.00 mOD is
also observed.
This upper surface is considered to correspond with the permeable Terrace Gravels overlying
the relatively impermeable London Clay Formation in the northwest and west of the section
(BH 401 to BH 408), and continues in the eastern section of the site with the Terrace Gravels
overlying the less permeable beds of the Upper Shelly Clay and Upper Mottled Clay (BH
410T to BH419).
The lower groundwater surface is considered to relate to the pore pressures within the
Lambeth Group and the Thanet Sands.
The water levels measured within the piezometers plot about the hydrostatic lines drawn
through -1.00 mOD and -7.00 mOD, and it is therefore considered that pore pressures within
the strata at both shallow and deep levels closely match hydrostatic pore pressures, taking
into consideration minor fluctuations between boreholes – for example, BH 401 indicated
groundwater at 0 mbgl. Furthermore, it is not considered that there is any under-drainage of
soils beneath the site. It should be noted that piezometers which has been installed within clay
horizons may take weeks, month or longer for groundwater conditions to stabilise after the
drilling programme. The monitoring round extends for no more than three months after initial
installations, and it is therefore recommended that further monitoring be undertaken to
identify any recent changes to the groundwater conditions. The findings may or may not
indicate the pore pressures to plot closer to the hydrostatic lines at -1.00 mOD and -7.00
mOD, or may indicate that the phreatic surfaces have moved.
5.3 GEOTECHNICAL CHARACTERISATION
Whilst down-hole permeability tests and SBP tests were undertaken during the drilling
programme, this information has not been made available for this report. Therefore, these will
not be discussed in the following sections.
5.3.1 Made Ground
Encountered at ground level within all excavations, this stratum was very of very variable
thickness across the site, ranging from 0.30m (BH 416) to 5.00m (BH402). This comprised of
topsoil (0.10 to 0.20m thick), tarmac (0.05 to 0.15m), or concrete (0.05 to 0.40m), or a
combination of these, overlying soft to firm brown grey green and black silty sandy Clay with
abundant fine to coarse angular to rounded brick, concrete, ash, tile mortar, flint coal and
chalk gravels and rare cobbles of tile, chalk, concrete and timber. Although contamination
13
Student no. eep50181
testing is beyond the remit of this report, it should be noted that Made Ground within BH 403
was described as ‘oily’, whilst being described as having a ‘pungent’ odour in BH414.
Chiselling was required within six boreholes (Figures 4 and 5), whilst SPT ‘N’ values for this
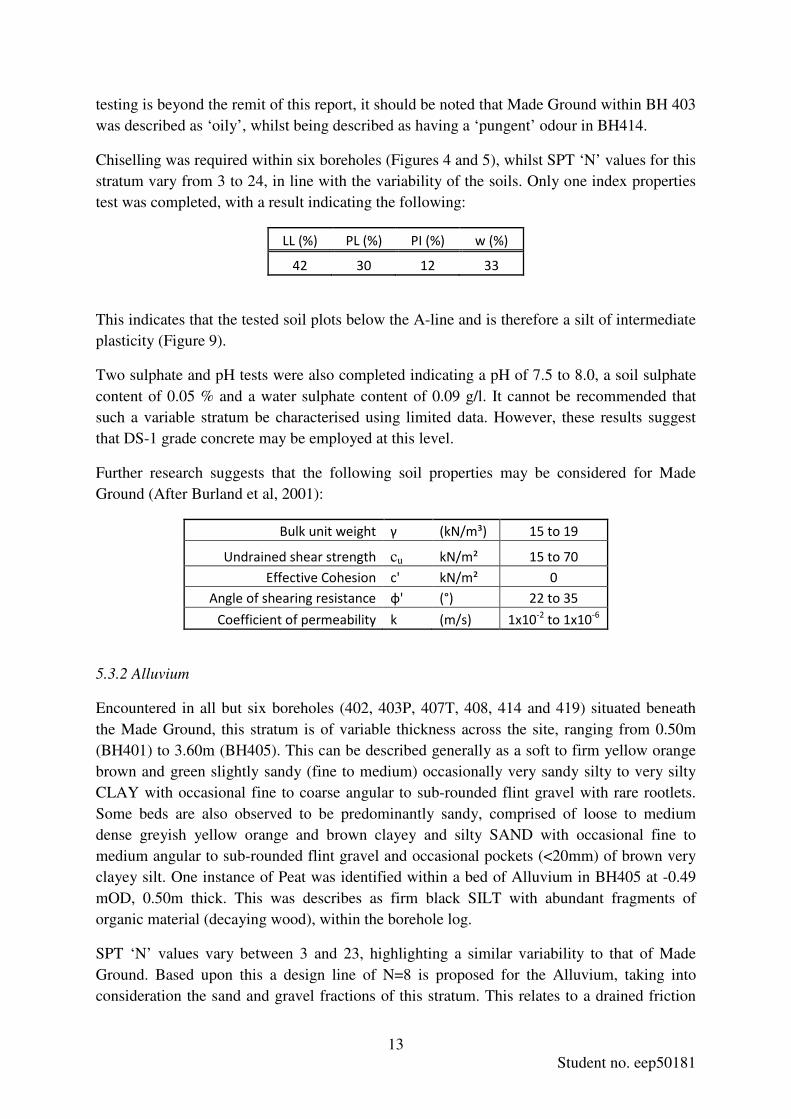
stratum vary from 3 to 24, in line with the variability of the soils. Only one index properties
test was completed, with a result indicating the following:
LL (%) PL (%) PI (%) w (%)
42 30 12 33
This indicates that the tested soil plots below the A-line and is therefore a silt of intermediate
plasticity (Figure 9).
Two sulphate and pH tests were also completed indicating a pH of 7.5 to 8.0, a soil sulphate
content of 0.05 % and a water sulphate content of 0.09 g/l. It cannot be recommended that
such a variable stratum be characterised using limited data. However, these results suggest
that DS-1 grade concrete may be employed at this level.
Further research suggests that the following soil properties may be considered for Made
Ground (After Burland et al, 2001):
Bulk unit weight γ (kN/m³) 15 to 19
Undrained shear strength cu kN/m² 15 to 70
Effective Cohesion c' kN/m² 0
Angle of shearing resistance φ' (°) 22 to 35
Coefficient of permeability k (m/s) 1x10⁻² to 1x10⁻⁶
5.3.2 Alluvium
Encountered in all but six boreholes (402, 403P, 407T, 408, 414 and 419) situated beneath
the Made Ground, this stratum is of variable thickness across the site, ranging from 0.50m
(BH401) to 3.60m (BH405). This can be described generally as a soft to firm yellow orange
brown and green slightly sandy (fine to medium) occasionally very sandy silty to very silty
CLAY with occasional fine to coarse angular to sub-rounded flint gravel with rare rootlets.
Some beds are also observed to be predominantly sandy, comprised of loose to medium
dense greyish yellow orange and brown clayey and silty SAND with occasional fine to
medium angular to sub-rounded flint gravel and occasional pockets (<20mm) of brown very
clayey silt. One instance of Peat was identified within a bed of Alluvium in BH405 at -0.49
mOD, 0.50m thick. This was describes as firm black SILT with abundant fragments of
organic material (decaying wood), within the borehole log.
SPT ‘N’ values vary between 3 and 23, highlighting a similar variability to that of Made
Ground. Based upon this a design line of N=8 is proposed for the Alluvium, taking into
consideration the sand and gravel fractions of this stratum. This relates to a drained friction
14
Student no. eep50181
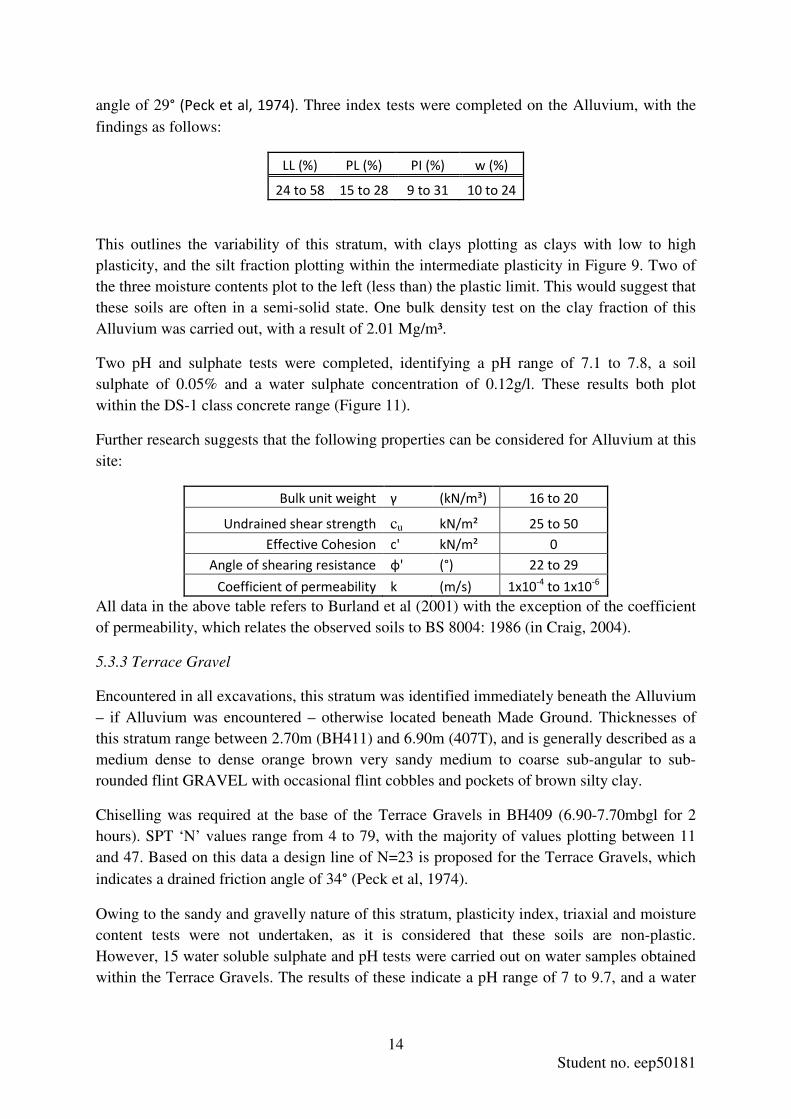
angle of 29° (Peck et al, 1974). Three index tests were completed on the Alluvium, with the
findings as follows:
LL (%) PL (%) PI (%) w (%)
24 to 58 15 to 28 9 to 31 10 to 24
This outlines the variability of this stratum, with clays plotting as clays with low to high
plasticity, and the silt fraction plotting within the intermediate plasticity in Figure 9. Two of
the three moisture contents plot to the left (less than) the plastic limit. This would suggest that
these soils are often in a semi-solid state. One bulk density test on the clay fraction of this
Alluvium was carried out, with a result of 2.01 Mg/m³.
Two pH and sulphate tests were completed, identifying a pH range of 7.1 to 7.8, a soil
sulphate of 0.05% and a water sulphate concentration of 0.12g/l. These results both plot
within the DS-1 class concrete range (Figure 11).
Further research suggests that the following properties can be considered for Alluvium at this
site:
Bulk unit weight γ (kN/m³) 16 to 20
Undrained shear strength cu kN/m² 25 to 50
Effective Cohesion c' kN/m² 0
Angle of shearing resistance φ' (°) 22 to 29
Coefficient of permeability k (m/s) 1x10⁻⁴ to 1x10⁻⁶
All data in the above table refers to Burland et al (2001) with the exception of the coefficient
of permeability, which relates the observed soils to BS 8004: 1986 (in Craig, 2004).
5.3.3 Terrace Gravel
Encountered in all excavations, this stratum was identified immediately beneath the Alluvium
– if Alluvium was encountered – otherwise located beneath Made Ground. Thicknesses of
this stratum range between 2.70m (BH411) and 6.90m (407T), and is generally described as a
medium dense to dense orange brown very sandy medium to coarse sub-angular to sub-
rounded flint GRAVEL with occasional flint cobbles and pockets of brown silty clay.
Chiselling was required at the base of the Terrace Gravels in BH409 (6.90-7.70mbgl for 2
hours). SPT ‘N’ values range from 4 to 79, with the majority of values plotting between 11
and 47. Based on this data a design line of N=23 is proposed for the Terrace Gravels, which
indicates a drained friction angle of 34° (Peck et al, 1974).
Owing to the sandy and gravelly nature of this stratum, plasticity index, triaxial and moisture
content tests were not undertaken, as it is considered that these soils are non-plastic.
However, 15 water soluble sulphate and pH tests were carried out on water samples obtained
within the Terrace Gravels. The results of these indicate a pH range of 7 to 9.7, and a water
15
Student no. eep50181
soluble sulphate level of 0.08 to 0.31 g/l. These results plot within the boundaries of DS-1
class.
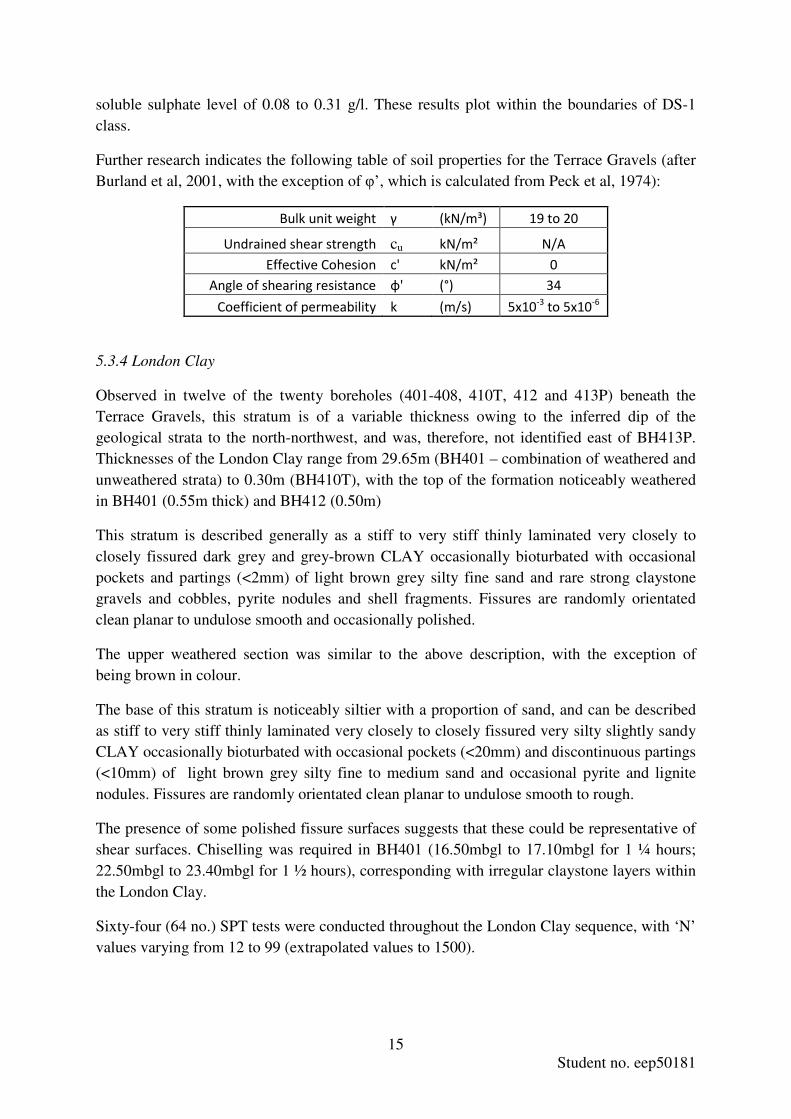
Further research indicates the following table of soil properties for the Terrace Gravels (after
Burland et al, 2001, with the exception of φ’, which is calculated from Peck et al, 1974):
Bulk unit weight γ (kN/m³) 19 to 20
Undrained shear strength cu kN/m² N/A
Effective Cohesion c' kN/m² 0
Angle of shearing resistance φ' (°) 34
Coefficient of permeability k (m/s) 5x10⁻³ to 5x10⁻⁶
5.3.4 London Clay
Observed in twelve of the twenty boreholes (401-408, 410T, 412 and 413P) beneath the
Terrace Gravels, this stratum is of a variable thickness owing to the inferred dip of the
geological strata to the north-northwest, and was, therefore, not identified east of BH413P.
Thicknesses of the London Clay range from 29.65m (BH401 – combination of weathered and
unweathered strata) to 0.30m (BH410T), with the top of the formation noticeably weathered
in BH401 (0.55m thick) and BH412 (0.50m)
This stratum is described generally as a stiff to very stiff thinly laminated very closely to
closely fissured dark grey and grey-brown CLAY occasionally bioturbated with occasional
pockets and partings (<2mm) of light brown grey silty fine sand and rare strong claystone
gravels and cobbles, pyrite nodules and shell fragments. Fissures are randomly orientated
clean planar to undulose smooth and occasionally polished.
The upper weathered section was similar to the above description, with the exception of
being brown in colour.
The base of this stratum is noticeably siltier with a proportion of sand, and can be described
as stiff to very stiff thinly laminated very closely to closely fissured very silty slightly sandy
CLAY occasionally bioturbated with occasional pockets (<20mm) and discontinuous partings
(<10mm) of light brown grey silty fine to medium sand and occasional pyrite and lignite
nodules. Fissures are randomly orientated clean planar to undulose smooth to rough.
The presence of some polished fissure surfaces suggests that these could be representative of
shear surfaces. Chiselling was required in BH401 (16.50mbgl to 17.10mbgl for 1 ¼ hours;
22.50mbgl to 23.40mbgl for 1 ½ hours), corresponding with irregular claystone layers within
the London Clay.
Sixty-four (64 no.) SPT tests were conducted throughout the London Clay sequence, with ‘N’
values varying from 12 to 99 (extrapolated values to 1500).
16
Student no. eep50181
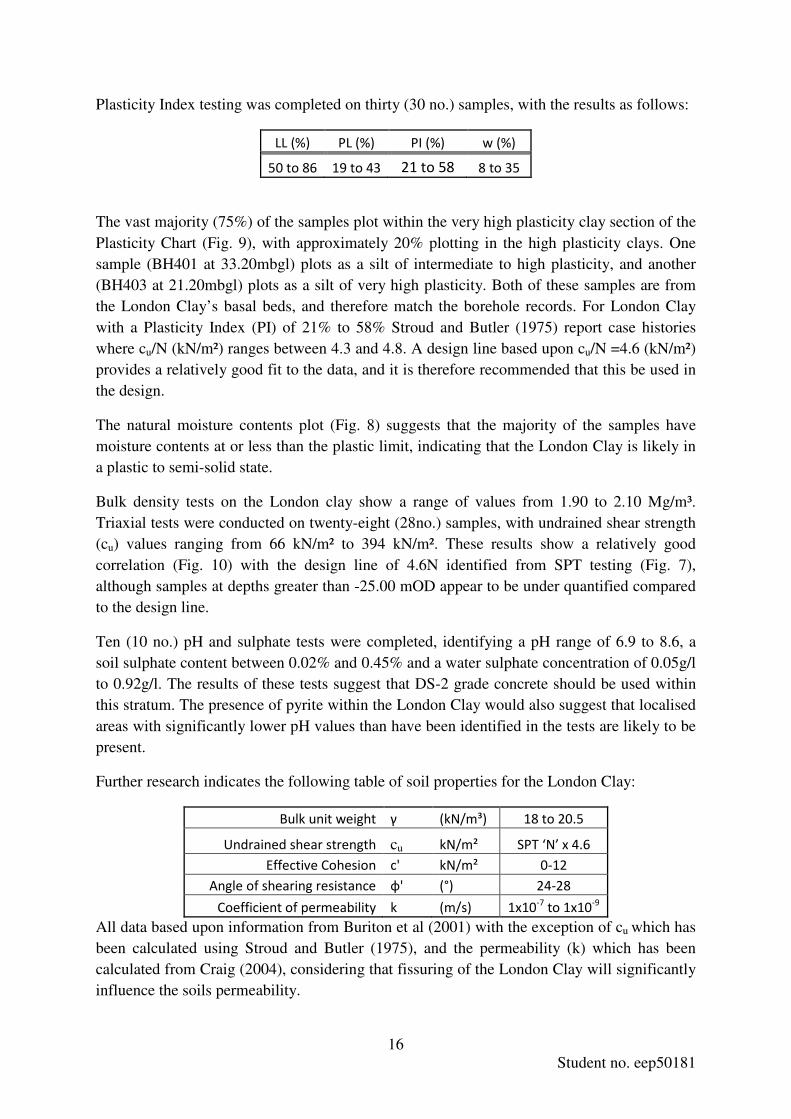
Plasticity Index testing was completed on thirty (30 no.) samples, with the results as follows:
LL (%) PL (%) PI (%) w (%)
50 to 86 19 to 43 21 to 58 8 to 35
The vast majority (75%) of the samples plot within the very high plasticity clay section of the
Plasticity Chart (Fig. 9), with approximately 20% plotting in the high plasticity clays. One
sample (BH401 at 33.20mbgl) plots as a silt of intermediate to high plasticity, and another
(BH403 at 21.20mbgl) plots as a silt of very high plasticity. Both of these samples are from
the London Clay’s basal beds, and therefore match the borehole records. For London Clay
with a Plasticity Index (PI) of 21% to 58% Stroud and Butler (1975) report case histories
where cu/N (kN/m²) ranges between 4.3 and 4.8. A design line based upon cu/N =4.6 (kN/m²)
provides a relatively good fit to the data, and it is therefore recommended that this be used in
the design.
The natural moisture contents plot (Fig. 8) suggests that the majority of the samples have
moisture contents at or less than the plastic limit, indicating that the London Clay is likely in
a plastic to semi-solid state.
Bulk density tests on the London clay show a range of values from 1.90 to 2.10 Mg/m³.
Triaxial tests were conducted on twenty-eight (28no.) samples, with undrained shear strength
(cu) values ranging from 66 kN/m² to 394 kN/m². These results show a relatively good
correlation (Fig. 10) with the design line of 4.6N identified from SPT testing (Fig. 7),
although samples at depths greater than -25.00 mOD appear to be under quantified compared
to the design line.
Ten (10 no.) pH and sulphate tests were completed, identifying a pH range of 6.9 to 8.6, a
soil sulphate content between 0.02% and 0.45% and a water sulphate concentration of 0.05g/l
to 0.92g/l. The results of these tests suggest that DS-2 grade concrete should be used within
this stratum. The presence of pyrite within the London Clay would also suggest that localised
areas with significantly lower pH values than have been identified in the tests are likely to be
present.
Further research indicates the following table of soil properties for the London Clay:
Bulk unit weight γ (kN/m³) 18 to 20.5
Undrained shear strength cu kN/m² SPT ‘N’ x 4.6
Effective Cohesion c' kN/m² 0-12
Angle of shearing resistance φ' (°) 24-28
Coefficient of permeability k (m/s) 1x10⁻⁷ to 1x10⁻⁹
All data based upon information from Buriton et al (2001) with the exception of cu which has
been calculated using Stroud and Butler (1975), and the permeability (k) which has been
calculated from Craig (2004), considering that fissuring of the London Clay will significantly
influence the soils permeability.

17
Student no. eep50181
5.3.5 Blackheath Beds
Identified within the majority of the excavations underlying the London Clay or, in its
absence, the Terrace Gravels, this stratum is of a fairly constant thickness, with depths of
between 0.20m (BH413P) and 0.70m (BH411). It was not identified within BH401 due to the
base of the London Clay not being reached, and in BH410T a void was located where this
unit would have been expected (Figure 5). Elsewhere, this unit was not identified because the
geological succession is considered to dip gently to the north-northwest, based on cross-
sectional data.
This stratum can be described as a stiff to very stiff grey brown black slightly sandy very silty
CLAY with occasional to abundant medium to coarse sub-rounded to rounded flint gravels
and rare flint cobbles and rare to occasional shell fragments with rare to occasional pockets
(<40mm) of green grey glauconitic silty sand.
Chiselling of this stratum was required within four boreholes (BH402 – 35.40mbgl to
35.60mbgl for approximately 1 ½ hours; BH403 – 25.20mbgl to 25.80mbgl for
approximately 1 hour; BH403P – 26.10mbgl to 26.50mbgl for 1 hour; BH405 – 20.70mbgl to
21.40mbgl for 3 hours). A SBP test within BH403P at 31.25mbgl was noted to have burst at
2200kPa within this strata.
Two SPT ‘N’tests were undertaken, with values of 39 and 214 (extrapolated). It is not
considered that enough data has been obtained in order to give a design value of any accuracy
for this stratum. Owing to the clayey nature of this unit, three index tests were completed,
with the results as follows:
LL (%) PL (%) PI (%) w (%)
63 to 72 25 to 27 38 to 45 22 to 25
Two of these results plot as clays with a high to very high plasticity (Figure 9), whilst one
sample (BH412 at 8.15mbgl) is regarded as non-plastic. One of the samples (BH402 at
34.00mbgl) plots to the left of its plastic limit, suggesting that some parts of this stratum are
in a semi-solid state. Seven bulk density tests were completed, with results varying from 1.93
to 2.01 Mg/m³. Furthermore, two samples were selected for triaxial testing, with cu results
varying from 111 (-4.48 mOD) to 235 kN/m² (-5.61 mOD).
Only one pH and soil sulphate test was conducted within this strata, with values of 6.3 and
0.31 % respectively, which plots within the DS-2 class.

18
Student no. eep50181
Based upon the engineering description of the Blackheath Beds beneath the site area the
following table outlines the design properties of this stratum:
Bulk unit weight γ (kN/m³) 19 to 20
Undrained shear strength cu kN/m² 75 to 300
Effective Cohesion c' kN/m² 0
Angle of shearing resistance φ' (°) 20 to 25
Coefficient of permeability k (m/s) 1x10⁻⁵ to 1x10⁻⁷
All data has been estimated using tables and data made available by Waltham, (2002) with
the exception of permeability, which has been estimated using tables in Craig (2004).
5.3.6 Upper Shelly Clay
Observed within thirteen (13 no.) of the boreholes (BH401-403, BH404-413P) beneath the
Blackheath Beds or, where this is not present, Terrace Gravels, this stratum is of a reasonably
constant thickness, ranging from 0.55m (BH412) to 2.50m (BH408), and is cut out of the line
of section due to the gently dipping nature of the geology, with the exception of BH403P,
where it is not within the sequence. This is considered to be due to the interbedded nature of
the Woolwich and Reading Beds of the Lambeth Group.
This material comprises of very stiff locally thinly laminated closely fissured dark grey and
grey-green very silty CLAY with abundant shells, occasional pockets and partings of grey-
green sandy (fine) silt and occasional sub-rounded flint gravels, with thin (<90mm)
impersistent strong to very strong grey shelly Limestone, recovered as fine to coarse sub-
angular gravel. Fissures are random to sub-vertical clean and planar.
Chiselling was required in three boreholes – BH402 through the Blackheath Beds through to
the Upper Mottled Clay (35.40mbgl to 36.50m for 7 hours); BH403 through the Blackheath
Beds to the Upper Mottled Clay (25.20mbgl to 26.70mbgl for 3 hours); BH405 (22.10mbgl to
within the Upper Mottled Clay at 25.20mbgl for 5 ½ hours). These episodes of chiselling are
considered to correlate with the Limestone and flint gravel bands identified within the
boreholes
Twelve (12 no.) SPT tests were carried out on the Upper Shelly Clay, with ‘N’ values varying
from 32 to 273 (extrapolated).
Plasticity Index tests were completed on five samples with the results as follows:
LL (%) PL (%) PI (%) w (%)
29 to 62 14 to 26 14 to 36 17 to 30
These samples plot predominantly as clays of low to intermediate plasticity, with the
exception of BH407T (13.34mbgl) which corresponds to a clay of high plasticity, with a
significantly higher liquid limit than other samples of this stratum. The natural moisture
contents plot (Fig. 8) suggests that the majority of the samples have moisture contents at or
19
Student no. eep50181
less than the plastic limit, indicating that the Upper Shelly Clay is likely in a plastic to semi-
solid state.
For a PI of 14% to 36% Stroud and Butler report cu/N (kN/m2) case histories of between 4.3
and 6. However, their chart indicates that Woolwich and Reading Clays plot significantly
lower than their best fit line, at between 3 and 3.5. A design line based upon cu/N =3 (kN/m²)
provides a relatively good fit for the data.
Bulk density tests on the Upper Shelly Clay show a range of values from 1.71Mg/m3 to
2.18Mg/m3. Triaxial tests were competed on four samples, with an Undrained Shear Strength
(cu) varying from 26 kN/m2 up to 132 kN/m
2. From consideration of the triaxial plot (Fig. 10)
and the borehole data, the lower cu value is considered to be due to the sample (-8.09 mOD in
BH408) being composed predominantly of Silt, compared to the other samples being of clay.
One pH and soil sulphate test were completed by the laboratory, with results of 6.3 and
0.03% respectively. These plot within the DS-1 grade boundaries (Fig. 11).
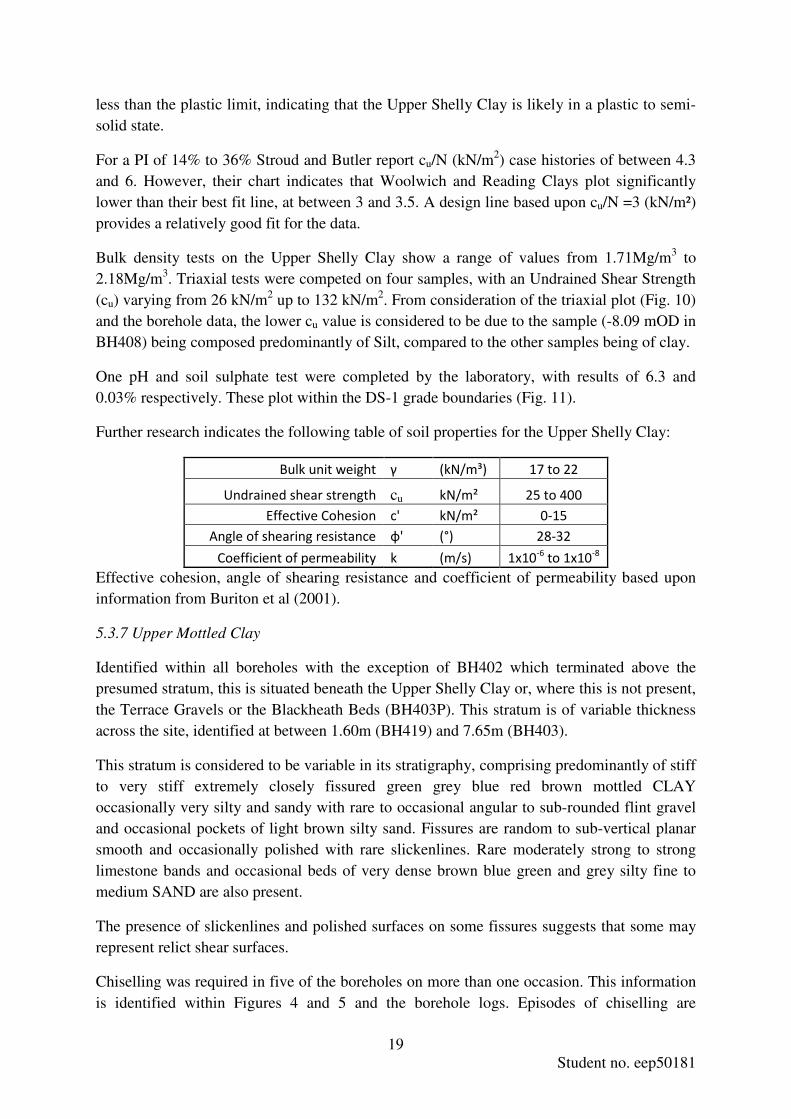
Further research indicates the following table of soil properties for the Upper Shelly Clay:
Bulk unit weight γ (kN/m³) 17 to 22
Undrained shear strength cu kN/m² 25 to 400
Effective Cohesion c' kN/m² 0-15
Angle of shearing resistance φ' (°) 28-32
Coefficient of permeability k (m/s) 1x10⁻⁶ to 1x10⁻⁸
Effective cohesion, angle of shearing resistance and coefficient of permeability based upon
information from Buriton et al (2001).
5.3.7 Upper Mottled Clay
Identified within all boreholes with the exception of BH402 which terminated above the
presumed stratum, this is situated beneath the Upper Shelly Clay or, where this is not present,
the Terrace Gravels or the Blackheath Beds (BH403P). This stratum is of variable thickness
across the site, identified at between 1.60m (BH419) and 7.65m (BH403).
This stratum is considered to be variable in its stratigraphy, comprising predominantly of stiff
to very stiff extremely closely fissured green grey blue red brown mottled CLAY
occasionally very silty and sandy with rare to occasional angular to sub-rounded flint gravel
and occasional pockets of light brown silty sand. Fissures are random to sub-vertical planar
smooth and occasionally polished with rare slickenlines. Rare moderately strong to strong
limestone bands and occasional beds of very dense brown blue green and grey silty fine to
medium SAND are also present.
The presence of slickenlines and polished surfaces on some fissures suggests that some may
represent relict shear surfaces.
Chiselling was required in five of the boreholes on more than one occasion. This information
is identified within Figures 4 and 5 and the borehole logs. Episodes of chiselling are

20
Student no. eep50181
considered to be representative of sections where the Upper Mottled Clay could be described
as hard.
Forty-nine (49 no.) SPT tests were undertaken on the Upper Mottled Clay, with ‘N’ values
varying from 15 to 333 (extrapolated).
Plasticity Index tests were completed on twenty-four (24 no.) samples with the results as
follows:
LL (%) PL (%) PI (%) w (%)
20 to 80 11 to 31 9 to 50 11 to 35
These samples plot from low plasticity clays through to very high plasticity clays
predominantly centred around the high to very high plasticity clay sections. Two samples –
BH411 at 14.30mbgl and BH405 at 25.50mbgl – plot within the intermediate and high
plasticity silts, respectively. The results indicate the variability of this stratum. The natural
moisture contents plot indicates that all samples have moisture contents that plot at or higher
than their liquid limits; clays and silts within this stratum can therefore be considered as
plastic.
For a PI of 9% to 50% Stroud and Butler report cu/N (kN/m2) case histories of between 4.3
and 7. However, their chart indicates that Woolwich and Reading Clays plot significantly
lower than their best fit line, at between 3 and 3.5. A design line based upon cu/N =3 (kN/m²)
provides the best fit for the Upper Mottled Clays clay fractions.
Bulk density tests on the Upper Mottled Clay show a range of values from 1.88Mg/m3 to
2.15Mg/m3. Triaxial tests were completed on twenty-two (22 no.) samples, with Undrained
Shear Strength (cu) varying from 22 kN/m2 up to 277 kN/m
2. From consideration of the
triaxial plot (Fig. 10) and the borehole data, the lower cu value is considered to be due a
number of the tested samples having polished fissures. In these instances it may have been
the residual strength of these samples which was being measured. Whilst the design line fits
the less fissured Clays, it is not considered to represent a good fit of the data for the strata
with polished fissures.
Nine pH tests were completed, varying from 6.4 to 8.4. Five soil sulphate tests and six water
sulphate tests were also completed, with values varying from 0.01% to 0.42% and 0.06 g/l to
0.46 g/l respectively. These values suggest that DS-2 grade concrete be used within this
strata, if necessary.
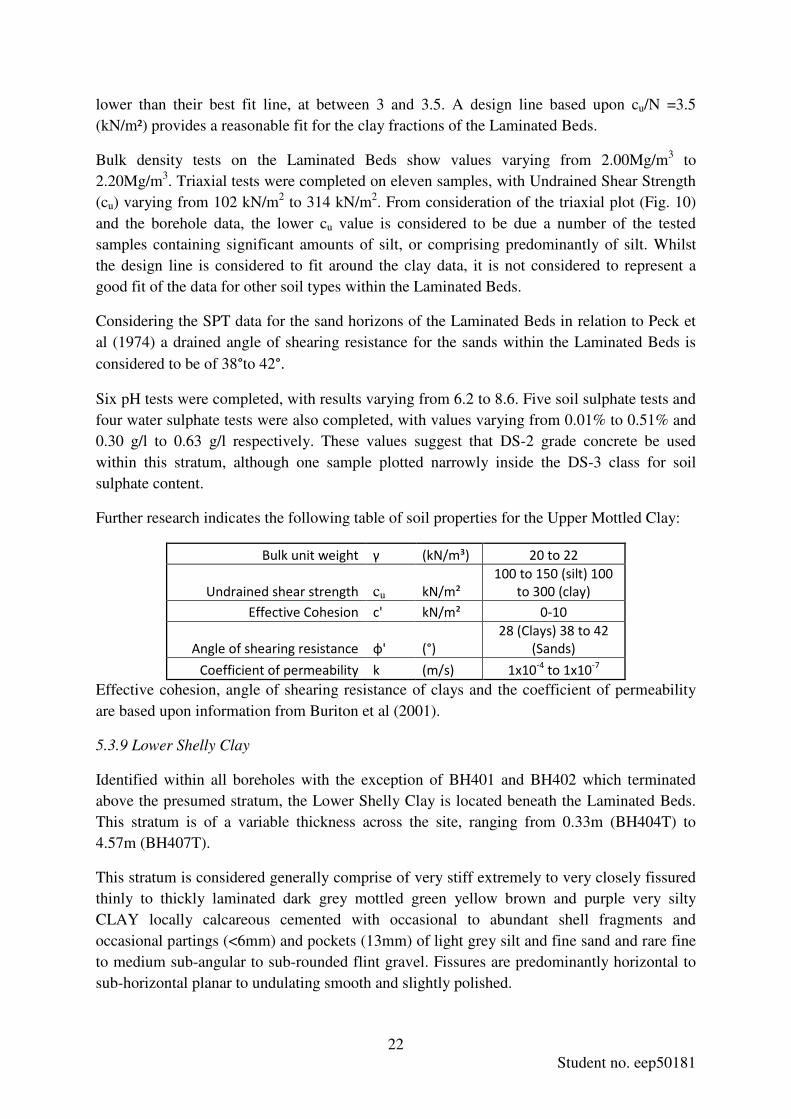
Further research indicates the following table of soil properties for the Upper Mottled Clay:
21
Student no. eep50181
Bulk unit weight γ (kN/m³) 19 to 21.5
Undrained shear strength cu kN/m² 25 to 400
Effective Cohesion c' kN/m² 0-15
Angle of shearing resistance φ' (°) 28-32
Coefficient of permeability k (m/s) 1x10⁻⁶ to 1x10⁻⁸
Effective cohesion, angle of shearing resistance, coefficient of permeability and the upper
level of undrained shear strength are based upon information from Buriton et al (2001).
5.3.8 Laminated Beds
Observed within all boreholes with the exception of BH401 and BH402, where drilling ended
before the stratum was reaches, the Laminated Beds are located beneath the Upper Mottled
Clay in all instances, with thicknesses varying from 1.10m (BH405) to 2.98m (BH418).
The Laminated Beds can be generally described as a very stiff thinly to thickly laminated
grey occasionally brown silty to very silty CLAY with occasional partings (<6mm) of brown
silt and sand and rare carbonaceous pockets, interlaminated with very dense thinly to thickly
laminated grey silty fine to medium SAND with occasional bands of grey very silty sandy
clay, and very stiff thinly laminated grey very clayey sandy SILT with rare shell fragments.
Despite its very stiff and very dense attributes chiselling was only required once during the
drilling programme, in BH409 (15.50mbgl to 15.80mbgl for 1 ½ hours). This is presumed to
be due to the very stiff nature of the very silty Clay in this instance. A void was noticed
within BH404T from -28.29 mOD to -29.30 mOD, which may relate to groundwater flow
within the Laminated Beds.
Nineteen (19 no.) SPT tests were completed within this stratum; with ‘N’ value results
ranging from 25 to 300 (extrapolated), with the majority ranging between 25 and 82. The four
values greater than this were observed within very dense Sand (188, 210 and 300) and very
stiff silt (110).
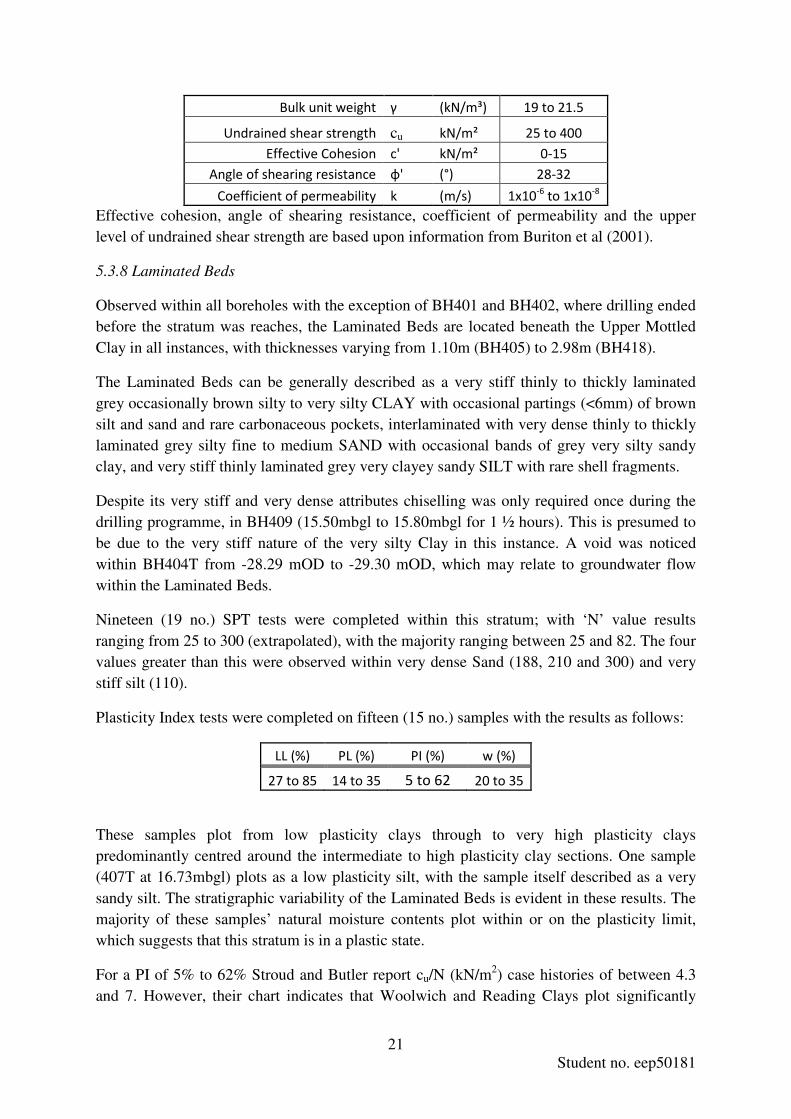
Plasticity Index tests were completed on fifteen (15 no.) samples with the results as follows:
LL (%) PL (%) PI (%) w (%)
27 to 85 14 to 35 5 to 62 20 to 35
These samples plot from low plasticity clays through to very high plasticity clays
predominantly centred around the intermediate to high plasticity clay sections. One sample
(407T at 16.73mbgl) plots as a low plasticity silt, with the sample itself described as a very
sandy silt. The stratigraphic variability of the Laminated Beds is evident in these results. The
majority of these samples’ natural moisture contents plot within or on the plasticity limit,
which suggests that this stratum is in a plastic state.
For a PI of 5% to 62% Stroud and Butler report cu/N (kN/m2) case histories of between 4.3
and 7. However, their chart indicates that Woolwich and Reading Clays plot significantly
22
Student no. eep50181
lower than their best fit line, at between 3 and 3.5. A design line based upon cu/N =3.5
(kN/m²) provides a reasonable fit for the clay fractions of the Laminated Beds.
Bulk density tests on the Laminated Beds show values varying from 2.00Mg/m3 to
2.20Mg/m3. Triaxial tests were completed on eleven samples, with Undrained Shear Strength
(cu) varying from 102 kN/m2 to 314 kN/m
2. From consideration of the triaxial plot (Fig. 10)
and the borehole data, the lower cu value is considered to be due a number of the tested
samples containing significant amounts of silt, or comprising predominantly of silt. Whilst
the design line is considered to fit around the clay data, it is not considered to represent a
good fit of the data for other soil types within the Laminated Beds.
Considering the SPT data for the sand horizons of the Laminated Beds in relation to Peck et
al (1974) a drained angle of shearing resistance for the sands within the Laminated Beds is
considered to be of 38°to 42°.
Six pH tests were completed, with results varying from 6.2 to 8.6. Five soil sulphate tests and
four water sulphate tests were also completed, with values varying from 0.01% to 0.51% and
0.30 g/l to 0.63 g/l respectively. These values suggest that DS-2 grade concrete be used
within this stratum, although one sample plotted narrowly inside the DS-3 class for soil
sulphate content.
Further research indicates the following table of soil properties for the Upper Mottled Clay:
Bulk unit weight γ (kN/m³) 20 to 22
Undrained shear strength cu kN/m² 100 to 150 (silt) 100
to 300 (clay)
Effective Cohesion c' kN/m² 0-10
Angle of shearing resistance φ' (°) 28 (Clays) 38 to 42
(Sands)
Coefficient of permeability k (m/s) 1x10⁻⁴ to 1x10⁻⁷
Effective cohesion, angle of shearing resistance of clays and the coefficient of permeability
are based upon information from Buriton et al (2001).
5.3.9 Lower Shelly Clay
Identified within all boreholes with the exception of BH401 and BH402 which terminated
above the presumed stratum, the Lower Shelly Clay is located beneath the Laminated Beds.
This stratum is of a variable thickness across the site, ranging from 0.33m (BH404T) to
4.57m (BH407T).
This stratum is considered generally comprise of very stiff extremely to very closely fissured
thinly to thickly laminated dark grey mottled green yellow brown and purple very silty
CLAY locally calcareous cemented with occasional to abundant shell fragments and
occasional partings (<6mm) and pockets (13mm) of light grey silt and fine sand and rare fine
to medium sub-angular to sub-rounded flint gravel. Fissures are predominantly horizontal to
sub-horizontal planar to undulating smooth and slightly polished.

23
Student no. eep50181
The presence of polished surfaces on fissures may suggest relict shear surfaces, whilst locally
cemented may suggest the presence of thin Limestone bands within this stratigraphic
sequence.
Chiselling was required in nine of the boreholes. This information can be viewed within
Figures 4 and 5 and the borehole logs. Episodes of chiselling are considered to be
representative of sections where the Lower Shelly Clay could be described as very stiff to
hard.
Twenty-two (22 no.) SPT tests were undertaken on the Lower Shelly Clay, with ‘N’ values
varying from 22 to 750 (extrapolated), but predominantly ranging between 22 and 76. Five
tests showed values greater than this, and were all situated within very stiff, possibly hard,
clays.
Plasticity Index tests were completed on nineteen (19 no.) samples with the results as
follows:
LL (%) PL (%) PI (%) w (%)
37 to 71 18 to 28 19 to 45 18 to 36
These samples plot from intermediate to very high plasticity clays (Figure 9), with the
majority of samples plotting in the intermediate to high plasticity range. One sample (BH417
at 13.30mbgl) plotted as a high plasticity silt, with the borehole log describing the sample as a
clay with lenses of silt and sand. The natural moisture contents of the majority of these
samples plot at or below the plastic limit of the sample, indicating that the soils are in a
plastic to semi-solid state in-situ.
For a PI of 19% to 45% Stroud and Butler report cu/N (kN/m2) case histories of between 4.3
and 5.3. However, their chart indicates that Woolwich and Reading Clays plot significantly
lower than their best fit line, at between 3 and 3.5. A design line based upon cu/N =3.5
(kN/m²) provides the best fit for clay fractions of the Lower Shelly Clay.
Bulk density tests on the Lower Shelly Clay show a range of values from 2.01Mg/m3 to
2.23Mg/m3. Triaxial tests were completed on seven samples, with Undrained Shear Strength
(cu) varying from 122 kN/m2 to 310 kN/m
2. From consideration of the triaxial plot (Fig. 10)
and the borehole data, the lower cu value is considered to be based upon the very silty nature
of the clay sample (BH414 at -13.61 mOD), with the remaining clay samples plotting at and
above 200 kN/m2. Whilst the design line plots the best-fit line of the tested samples, it is
important to note that the samples rarely plot near to the design line. This is likely due to the
variable nature of the predominantly clay-rich strata in combination with sands, silts and
fissures.
Four pH tests were completed with results varying from 6.6 to 9.9. Three soil sulphate tests
and two water sulphate tests were also completed, with values varying from 0.06% to 0.41%

24
Student no. eep50181
and 0.17 g/l to 0.51 g/l respectively. These values suggest that DS-2 grade concrete be used
within this strata, if necessary (Fig. 11).
The following table of soil properties for the Lower Shelly Clay is considered prudent for
future designs:
Bulk unit weight γ (kN/m³) 20 to 22
Undrained shear strength cu kN/m² 100-200 (silt)
200-310 (clay)
Effective Cohesion c' kN/m² 0-15
Angle of shearing resistance φ' (°) 28-32
Coefficient of permeability k (m/s) 1x10⁻⁶ to 1x10⁻⁸
Effective cohesion, angle of shearing resistance and coefficient of permeability are based
upon information from Buriton et al (2001).
5.3.10 Lower Mottled Clay
Identified within all boreholes with the exception of BH401 and BH402 which terminated
above the presumed stratum, the Lower Mottled Clay underlies the Lower Shelly Clay. This
stratum is of a variable thickness across the site, ranging from 0.25m (BH417) to 1.75m
(BH404T).
The Lower Mottled Clay generally comprises of very stiff extremely to closely fissured
yellow brown grey purple blue and green mottled CLAY occasionally very silty and rarely
interbedded with SILT, with occasional fine to medium gravels of very weak limestone and
moderately strong siltstone and rare to occasional pockets (<5mm) of light brown silty fine
sand. Fissures are vertical to sub-vertical and random, planar smooth and occasionally
polished and striated.
The presence of polished and striated surfaces on some fissures may suggest relict shear
surfaces.
Chiselling was required in ten of the boreholes. This information can be viewed within
Figures 4 and 5 and the borehole logs. Episodes of chiselling are considered to be
representative of sections where the Lower Mottled Clay could be described as very stiff to
hard. Two voids were identified within BH407T (-19.11 to -20.08 mOD and -20.56 to -21.11
mOD) either side of a pure Silt bed. It is inferred from this that flow within this portion of the
Lower Mottled Clay may occur, although this was not seen within any other excavations.
Twelve (12 no.) SPT tests were completed within the Lower Mottled Clay, with ’N’ values
varying from 44 to 500 (extrapolated). Eleven of the twelve samples have values ranging
from 44 to 250, with the higher values (inclusive of the 500 result) are all described as being
in very stiff clay.
25
Student no. eep50181
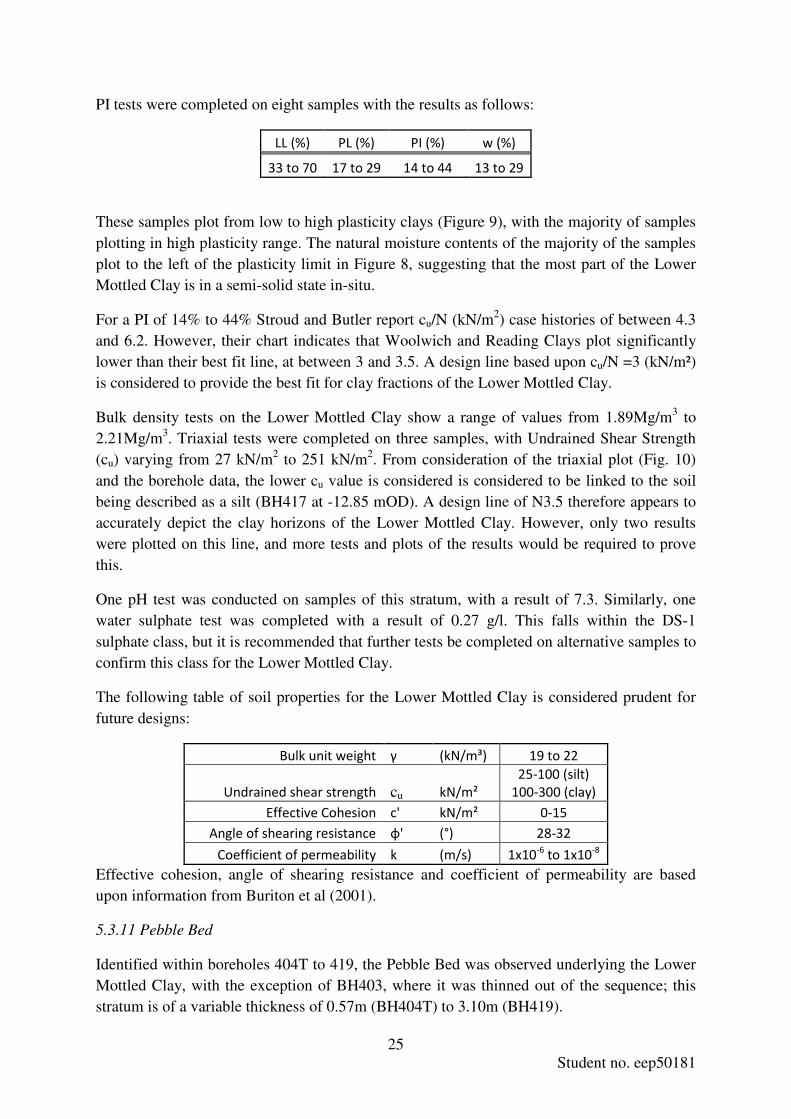
PI tests were completed on eight samples with the results as follows:
LL (%) PL (%) PI (%) w (%)
33 to 70 17 to 29 14 to 44 13 to 29
These samples plot from low to high plasticity clays (Figure 9), with the majority of samples
plotting in high plasticity range. The natural moisture contents of the majority of the samples
plot to the left of the plasticity limit in Figure 8, suggesting that the most part of the Lower
Mottled Clay is in a semi-solid state in-situ.
For a PI of 14% to 44% Stroud and Butler report cu/N (kN/m2) case histories of between 4.3
and 6.2. However, their chart indicates that Woolwich and Reading Clays plot significantly
lower than their best fit line, at between 3 and 3.5. A design line based upon cu/N =3 (kN/m²)
is considered to provide the best fit for clay fractions of the Lower Mottled Clay.
Bulk density tests on the Lower Mottled Clay show a range of values from 1.89Mg/m3 to
2.21Mg/m3. Triaxial tests were completed on three samples, with Undrained Shear Strength
(cu) varying from 27 kN/m2 to 251 kN/m
2. From consideration of the triaxial plot (Fig. 10)
and the borehole data, the lower cu value is considered is considered to be linked to the soil
being described as a silt (BH417 at -12.85 mOD). A design line of N3.5 therefore appears to
accurately depict the clay horizons of the Lower Mottled Clay. However, only two results
were plotted on this line, and more tests and plots of the results would be required to prove
this.
One pH test was conducted on samples of this stratum, with a result of 7.3. Similarly, one
water sulphate test was completed with a result of 0.27 g/l. This falls within the DS-1
sulphate class, but it is recommended that further tests be completed on alternative samples to
confirm this class for the Lower Mottled Clay.
The following table of soil properties for the Lower Mottled Clay is considered prudent for
future designs:
Bulk unit weight γ (kN/m³) 19 to 22
Undrained shear strength cu kN/m² 25-100 (silt)
100-300 (clay)
Effective Cohesion c' kN/m² 0-15
Angle of shearing resistance φ' (°) 28-32
Coefficient of permeability k (m/s) 1x10⁻⁶ to 1x10⁻⁸
Effective cohesion, angle of shearing resistance and coefficient of permeability are based
upon information from Buriton et al (2001).
5.3.11 Pebble Bed
Identified within boreholes 404T to 419, the Pebble Bed was observed underlying the Lower
Mottled Clay, with the exception of BH403, where it was thinned out of the sequence; this
stratum is of a variable thickness of 0.57m (BH404T) to 3.10m (BH419).
26
Student no. eep50181
The pebble bed is best described as a very dense yellow-brown mottled blue green purple red
and grey clayey slightly sandy fine to coarse sub-angular to rounded GRAVEL with horizons
of grey very stiff silty sandy CLAY and rare to occasional pockets of blue-green glauconitic
silty fine sand.
Chiselling was required in twelve of the boreholes. This information can be viewed within
Figures 4 and 5 and the borehole logs. Episodes of chiselling are considered to be
representative of sections where the Pebble Beds are very dense.
Forty-seven (47 no.) SPT tests were completed within the Pebble Bed, with ’N’ values
varying from 36 to 690 (extrapolated) with one test measuring zero penetration after 50
blows. The majority of values range from 108 to 375; From this data a design line of N=195
should be used for design purposes within the Pebble Bed. Considering data from Peck et al
(1974) this corresponds to a drained angle of shearing resistance of approximately 44º, with a
lower bound of 37º.
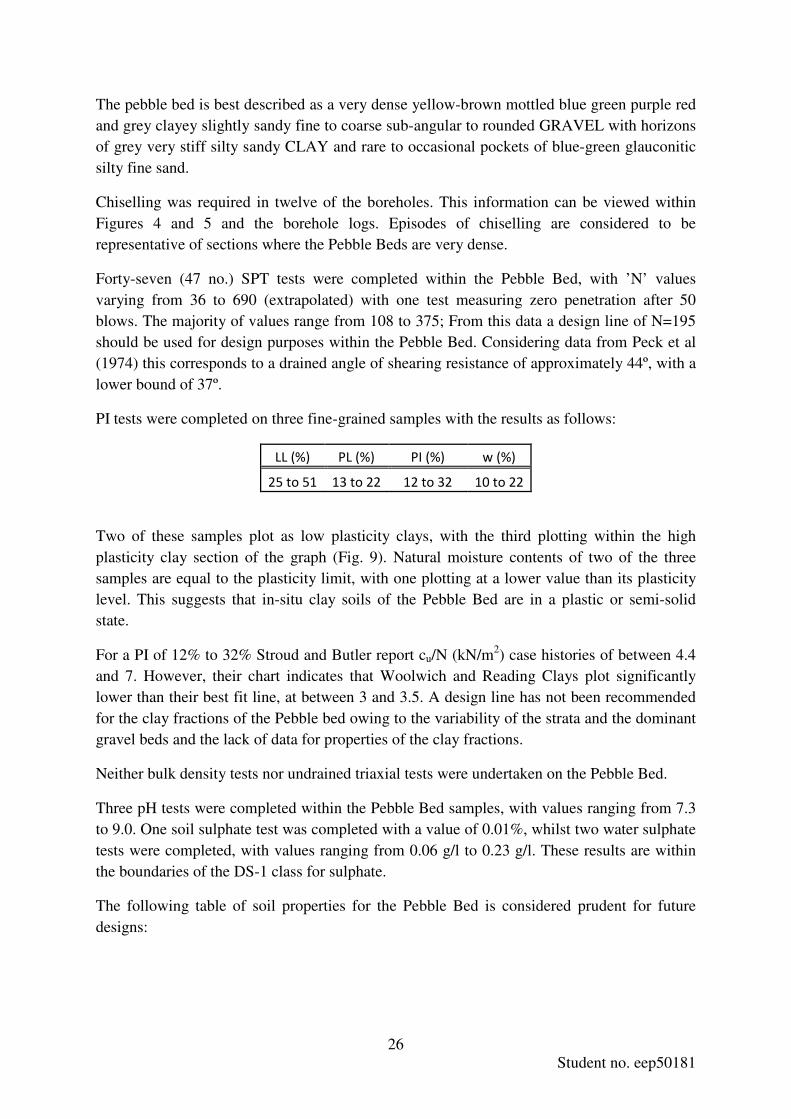
PI tests were completed on three fine-grained samples with the results as follows:
LL (%) PL (%) PI (%) w (%)
25 to 51 13 to 22 12 to 32 10 to 22
Two of these samples plot as low plasticity clays, with the third plotting within the high
plasticity clay section of the graph (Fig. 9). Natural moisture contents of two of the three
samples are equal to the plasticity limit, with one plotting at a lower value than its plasticity
level. This suggests that in-situ clay soils of the Pebble Bed are in a plastic or semi-solid
state.
For a PI of 12% to 32% Stroud and Butler report cu/N (kN/m2) case histories of between 4.4
and 7. However, their chart indicates that Woolwich and Reading Clays plot significantly
lower than their best fit line, at between 3 and 3.5. A design line has not been recommended
for the clay fractions of the Pebble bed owing to the variability of the strata and the dominant
gravel beds and the lack of data for properties of the clay fractions.
Neither bulk density tests nor undrained triaxial tests were undertaken on the Pebble Bed.
Three pH tests were completed within the Pebble Bed samples, with values ranging from 7.3
to 9.0. One soil sulphate test was completed with a value of 0.01%, whilst two water sulphate
tests were completed, with values ranging from 0.06 g/l to 0.23 g/l. These results are within
the boundaries of the DS-1 class for sulphate.
The following table of soil properties for the Pebble Bed is considered prudent for future
designs:

27
Student no. eep50181
Bulk unit weight γ (kN/m³) 19 to 21
Undrained shear strength cu kN/m² N/A
Effective Cohesion c' kN/m² 0
Angle of shearing resistance φ' (°) 37-44
Coefficient of permeability k (m/s) 1x10⁻³ to 1x10⁻⁶
Bulk unit weight, effective cohesion, angle of shearing resistance and coefficient of
permeability are based upon information from Buriton et al (2001).
5.3.12 Glauconitic Sand
Identified within all boreholes with the exception of boreholes 401, 402 and 403P which were
not bored to a deep enough level to observe this stratum, the Glauconitic Sands varies in
thickness (proven) across the site, from 2.00m (BH406) to 6.80m (BH412).
The Glauconitic Sand is a highly variable unit comprised of very dense grey-green and blue-
green occasionally mottled clayey and silty fine to medium SAND with rare to occasional
fine to medium rounded to sub-rounded flint gravel occasional to abundant pockets (<20mm)
grey and blue silty clay and rare nodules (30-50mm) of weak grey highly weathered
Limestone, interbedded with very stiff dark green grey and blue silty to very silty sandy
CLAY with occasional fine to medium flint gravels and rare to occasional partings of brown
very silty clay.
Chiselling was required in six of the boreholes. This information can be viewed within
Figures 4 and 5 and the borehole logs. Episodes of chiselling are considered to be
representative of sections where the Glauconitic Sands are very dense and/or where bands of
weak Limestone are located.
Eighty-nine (89 no.) SPT tests were undertaken within the Glauconitic Sand, with ‘N’ values
varying from 30 to 750 (extrapolated). The majority of values range between 60 and 250,
with a recommended design line for the granular horizons of the Glauconitic Sand of N=120.
Considering data from Peck et al (1974) an undrained angle of friction in the order of 43-44º
is recommended for design purposes.
PI tests were completed on twelve samples with the results as follows:
LL (%) PL (%) PI (%) w (%)
29 to 41 16 to 23 6 to 23 15 to 33
These samples plot as low to intermediate plasticity clays, with two samples plotting as low
plasticity silts (Figure 9). The natural moisture contents of the majority of the samples plot
close to and within the plastic limit of the sample, suggesting that the majority of the fine-
grained part of the Glauconitic Sand is in a plastic state, although approximately 25% of the
tested samples plotted as semi-solid.

28
Student no. eep50181
For a PI of 6% to 23% Stroud and Butler report cu/N (kN/m2) case histories of between 5 and
7. However, their chart indicates that Woolwich and Reading Clays plot significantly lower
than their best fit line, at between 3 and 3.5. Triaxial tests were completed on five samples,
with Undrained Shear Strength (cu) varying from 13 kN/m2 to 118 kN/m
2. From
consideration of the triaxial plot (Fig. 10) and the borehole data, the lower cu values (13, 45
kN/m2) are described as very sandy clays, whilst the upper values are sandy clays. This
highlights the bearing of silts and sands on the undrained triaxial test. In response to this, a
design line of cu/N=0.75 is considered to provide a best fit for the sandy clays within the
Glauconitic Sand identified during this investigation.
Bulk density tests on the Glauconitic Sand show a range of values from 2.00Mg/m3 to
2.18Mg/m3.
Two pH tests were completed on Glauconitic Sand samples, with results ranging from 6.3 to
8.7. Two soil sulphate tests were also undertaken, with results ranging from 0.01% and
0.33%, with the latter result correlating with a DS-2 class.
The following table of soil properties for the Glauconitic Sand is considered prudent for
future designs:
Bulk unit weight γ (kN/m³) 20 to 22
Undrained shear strength cu kN/m² 10-120 (fine
soils)
Effective Cohesion c' kN/m² 0-10
Angle of shearing resistance φ' (°) 43-44 (granular
soils)
Coefficient of permeability k (m/s) 1x10⁻³ to 1x10⁻⁶
Effective cohesion and coefficient of permeability are based upon information from Buriton
et al (2001).
5.3.13 Thanet Bed
Proved within boreholes 404T-419 (other boreholes not drilled to a deep enough level) the
Thanet Beds are observed underlying the Glauconitic Sand in all instances, with a variable
thickness of between 10.50m (BH411 - proved) and 12.50m (BH417 – not proved).
The Thanet Bed is comprised of very dense grey grey-brown and grey-green glauconitic fine
to medium SAND with rare fine sub-rounded flint gravels, becoming slightly silty to silty
with occasional pockets (<30mm) of grey clay with depth.
Chiselling was not required within the Thanet Bed during the drilling programme.
One hundred and one (101 no.) SPT tests were completed within the Thanet Bed, with ‘N’
values varying from 94 to 1000 (all data required extrapolating from raw data) with two tests
incurring zero penetration. The majority of values range from 94 to 300, with a recommended
design line of N=175. Considering data from Peck et al (1974) an undrained angle of friction

29
Student no. eep50181
of 44º is recommended for design purposes. However, Buriton et al (2001) recommend that
40º be used for this strata.
Two PI tests were completed on Thanet Bed samples with the results as follows:
LL (%) PL (%) PI (%) w (%)
26 to 31 14 to 15 11 to 17 14 to 15
These samples plot as low plasticity clays, with their natural moisture contents both plotting
at the same percentage as their plastic limits. This suggests that in-situ clay horizons within
the Glauconitic Sand are in a plastic state, albeit at the plastic limit.
Owing to the sandy nature of the Thanet Bed not triaxial testing was undertaken. It is not
considered relevant to propose a design line for the Thanet Bed based upon clay data as it is
considered that the unit will behave in a granular manner.
Bulk density tests were not conducted on the Thanet Bed.
Two pH tests were completed on the Thanet Bed samples, with results ranging from 8.2 to
8.4. Two soil sulphate tests were also undertaken, with the results varying from 0.04% to
0.15%. These plot within the boundaries of the DS-1 class for concrete.
The following table of soil properties for the Thanet Bed is considered prudent for future
designs:
Bulk unit weight γ (kN/m³) 20 to 22
Undrained shear strength cu kN/m² N/A
Effective Cohesion c' kN/m² 0
Angle of shearing resistance φ' (°) 40-44
Coefficient of permeability k (m/s) 1x10⁻² to 1x10⁻⁵
Bulk unit weight is based upon information from Buriton et al (2001), whilst the coefficient
of permeability is based upon BS 8004:1986 (in Craig, 2004).
5.3.14 Bullhead Bed
Identified beneath the Thanet Bed within six boreholes (407T, 410T, 411, 414, 415T and
418) the Bullhead Bed is of a relatively constant thickness of between 0.26m (BH418) and
0.60m (415T).
This unit comprises of very dense dark grey and black fine to medium SAND with abundant
fine to coarse angular to rounded flint gravels and cobbles, occasionally clayey to very clayey
(very stiff) and silty to very silty. In summary, this unit can be considered as a conglomerate.
Chiselling was required throughout the Bullhead Bed in BH414 (37.00mbgl to 37.30mbgl for
1 hour) because here the unit was comprised almost entirely of flint cobbles within a clay
matrix.

30
Student no. eep50181
Two SPT tests were completed within the Bullhead Bed, with ‘N’ values varying from 138 to
300, with both values being extrapolated from the raw data. Owing to these results it is
recommended that the design line of N=175 for the Thanet Bed is also suitable for the
Bullhead Bed.
No other tests were conducted on the Bullhead Bed. It is recommended that for design
purposes this unit follows the recommendations in the Thanet Bed.
5.3.15 Upper Chalk
Located beneath the Bullhead Bed of the Thanet Sand Formation, the Upper Chalk was
identified within six of the twenty boreholes (407T, 410T, 411, 415T and 418). The base of
this stratum was not proven, whilst the maximum thickness of the unit (unproven) was 8.60m
within BH407T.
The excavated Upper Chalk is best described as a weak to moderately weak white CHALK
with occasional rinded flint cobbles with very closely to medium spaced fractures often
infilled between 2mm and 9mm with light brown comminuted Chalk. This Chalk is described
as a Grade of between II and IV. However under new CIRIA documentation (Spink, 2002)
this is better defined as a chalk of between C4 and A3, but predominantly of C3 to C4.
Chiselling was required in BH411 (37.80mbgl to 38.20mbgl for 2 hours), presumed to be due
to flint cobbles.
Eight SPT tests were undertaken within the Upper Chalk, with ‘N’ values varying from 61 to
260 (extrapolated), with seven of the tests recording blows (N/300mm) of 61 to 85. The
recommended design line for the Upper Chalk in this instance is N=75. At this N-value Peck
et al (1974) suggest that an angle of shearing resistance in the order of 42º to 44º is
achievable.
No other tests were conducted on the Upper Chalk.
The following table of soil properties for the Thanet Bed is considered prudent for future
designs:
Bulk unit weight γ (kN/m³) 20 to 22
Undrained shear strength cu kN/m² N/A
Effective Cohesion c' kN/m² 0
Angle of shearing resistance φ' (°) 42-44
Coefficient of permeability k (m/s) 1x10⁻¹ to 1x10⁻²
Bulk unit weight and effective cohesion is based upon information from Buriton et al (2001),
whilst the coefficient of permeability is based upon BS 8004:1986 (in Craig, 2004).
31
Student no. eep50181
6.0 CONCLUSIONS
General geological conditions beneath the site suggest that solid geological strata are gently
dipping to the north-northwest.
An upper phreatic surface at approximately -1.00 mOD is identified, whilst a second, lower
phreatic surface at approximately -7.00 mOD is also observed. The upper surface is
considered representative of the intersection between the Terrace Gravels and London Clay,
whilst the lower level is representative of pore pressures within the Lambeth Group and
underlying strata.
Engineering Descriptions:
Made Ground - soft to firm brown grey green and black silty sandy Clay with abundant fine
to coarse angular to rounded brick, concrete, ash, tile mortar, flint coal and chalk gravels and
rare cobbles of tile, chalk, concrete and timber.
Alluvium - soft to firm yellow orange brown and green slightly sandy (fine to medium)
occasionally very sandy silty to very silty CLAY with occasional fine to coarse angular to
sub-rounded flint gravel with rare rootlets. Some beds are also observed to be predominantly
sandy, comprised of loose to medium dense greyish yellow orange and brown clayey and
silty SAND with occasional fine to medium angular to sub-rounded flint gravel and
occasional pockets (<20mm) of brown very clayey silt.
Terrace Gravels - medium dense to dense orange brown very sandy medium to coarse sub-
angular to sub-rounded flint GRAVEL with occasional flint cobbles and pockets of brown
silty clay.
London Clay - stiff to very stiff thinly laminated very closely to closely fissured dark grey
and grey-brown CLAY occasionally bioturbated with occasional pockets and partings
(<2mm) of light brown grey silty fine sand and rare strong claystone gravels and cobbles,
pyrite nodules and shell fragments. Fissures are randomly orientated clean planar to undulose
smooth and occasionally polished.
Blackheath Beds - stiff to very stiff grey brown black slightly sandy very silty CLAY with
occasional to abundant medium to coarse sub-rounded to rounded flint gravels and rare flint
cobbles and rare to occasional shell fragments with rare to occasional pockets (<40mm) of
green grey glauconitic silty sand.
Upper Shelly Clay - very stiff locally thinly laminated closely fissured dark grey and grey-
green very silty CLAY with abundant shells, occasional pockets and partings of grey-green
sandy (fine) silt and occasional sub-rounded flint gravels, with thin (<90mm) impersistent
strong to very strong grey shelly Limestone, recovered as fine to coarse sub-angular gravel.
Fissures are random to sub-vertical clean and planar.
Upper Mottled Clay - stiff to very stiff extremely closely fissured green grey blue red brown
mottled CLAY occasionally very silty and sandy with rare to occasional angular to sub-

32
Student no. eep50181
rounded flint gravel and occasional pockets of light brown silty sand. Fissures are random to
sub-vertical planar smooth and occasionally polished with rare slickenlines. Rare moderately
strong to strong limestone bands and occasional beds of very dense brown blue green and
grey silty fine to medium SAND are also present.
Laminated Beds - very stiff thinly to thickly laminated grey occasionally brown silty to very
silty CLAY with occasional partings (<6mm) of brown silt and sand and rare carbonaceous
pockets, interlaminated with very dense thinly to thickly laminated grey silty fine to medium
SAND with occasional bands of grey very silty sandy clay, and very stiff thinly laminated
grey very clayey sandy SILT with rare shell fragments.
Lower Shelly Clay - very stiff extremely to very closely fissured thinly to thickly laminated
dark grey mottled green yellow brown and purple very silty CLAY locally calcareous
cemented with occasional to abundant shell fragments and occasional partings (<6mm) and
pockets (13mm) of light grey silt and fine sand and rare fine to medium sub-angular to sub-
rounded flint gravel. Fissures are predominantly horizontal to sub-horizontal planar to
undulating smooth and slightly polished.
Lower Mottled Clay - very stiff extremely to closely fissured yellow brown grey purple blue
and green mottled CLAY occasionally very silty and rarely interbedded with SILT, with
occasional fine to medium gravels of very weak limestone and moderately strong siltstone
and rare to occasional pockets (<5mm) of light brown silty fine sand. Fissures are vertical to
sub-vertical and random, planar smooth and occasionally polished and striated.
Pebble Bed - very dense yellow-brown mottled blue green purple red and grey clayey slightly
sandy fine to coarse sub-angular to rounded GRAVEL with horizons of grey very stiff silty
sandy CLAY and rare to occasional pockets of blue-green glauconitic silty fine sand.
Glauconitic Sand - very dense grey-green and blue-green occasionally mottled clayey and
silty fine to medium SAND with rare to occasional fine to medium rounded to sub-rounded
flint gravel occasional to abundant pockets (<20mm) grey and blue silty clay and rare nodules
(30-50mm) of weak grey highly weathered Limestone, interbedded with very stiff dark green
grey and blue silty to very silty sandy CLAY with occasional fine to medium flint gravels and
rare to occasional partings of brown very silty clay.
Thanet Beds - very dense grey grey-brown and grey-green glauconitic fine to medium SAND
with rare fine sub-rounded flint gravels, becoming slightly silty to silty with occasional
pockets (<30mm) of grey clay with depth.
Bullhead Beds - very dense dark grey and black fine to medium SAND with abundant fine to
coarse angular to rounded flint gravels and cobbles, occasionally clayey to very clayey (very
stiff) and silty to very silty.
Upper Chalk - weak to moderately weak white CHALK with occasional rinded flint cobbles
with very closely to medium spaced fractures often infilled between 2mm and 9mm with light
brown comminuted Chalk.
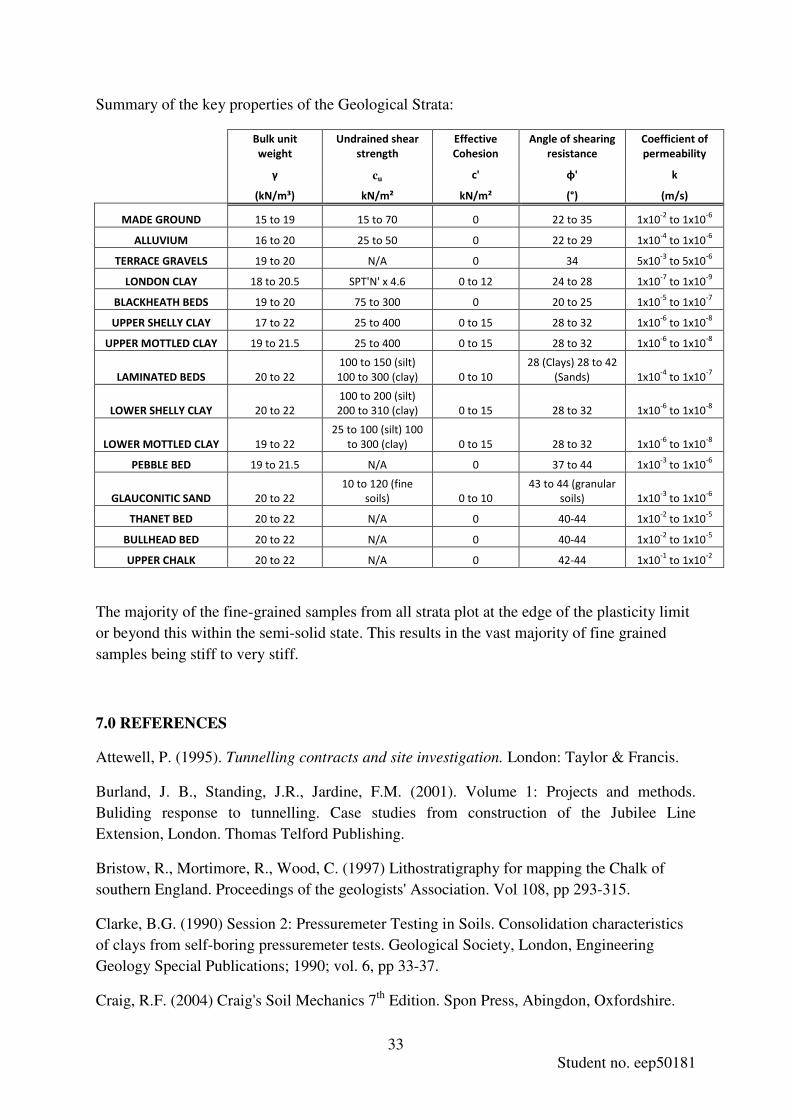
33
Student no. eep50181
Summary of the key properties of the Geological Strata:
Bulk unit
weight
Undrained shear
strength
Effective
Cohesion
Angle of shearing
resistance
Coefficient of
permeability
γ cu c' φ' k
(kN/m³) kN/m² kN/m² (°) (m/s)
MADE GROUND 15 to 19 15 to 70 0 22 to 35 1x10⁻²
to 1x10⁻⁶
ALLUVIUM 16 to 20 25 to 50 0 22 to 29 1x10⁻⁴
to 1x10⁻⁶
TERRACE GRAVELS 19 to 20 N/A 0 34 5x10⁻³
to 5x10⁻⁶
LONDON CLAY 18 to 20.5 SPT'N' x 4.6 0 to 12 24 to 28 1x10⁻⁷
to 1x10⁻⁹
BLACKHEATH BEDS 19 to 20 75 to 300 0 20 to 25 1x10⁻⁵
to 1x10⁻⁷
UPPER SHELLY CLAY 17 to 22 25 to 400 0 to 15 28 to 32 1x10⁻⁶
to 1x10⁻⁸
UPPER MOTTLED CLAY 19 to 21.5 25 to 400 0 to 15 28 to 32 1x10⁻⁶
to 1x10⁻⁸
LAMINATED BEDS 20 to 22
100 to 150 (silt)
100 to 300 (clay) 0 to 10
28 (Clays) 28 to 42
(Sands) 1x10⁻⁴
to 1x10⁻⁷
LOWER SHELLY CLAY 20 to 22
100 to 200 (silt)
200 to 310 (clay) 0 to 15 28 to 32 1x10⁻⁶
to 1x10⁻⁸
LOWER MOTTLED CLAY 19 to 22
25 to 100 (silt) 100
to 300 (clay) 0 to 15 28 to 32 1x10⁻⁶
to 1x10⁻⁸
PEBBLE BED 19 to 21.5 N/A 0 37 to 44 1x10⁻³
to 1x10⁻⁶
GLAUCONITIC SAND 20 to 22
10 to 120 (fine
soils) 0 to 10
43 to 44 (granular
soils) 1x10⁻³
to 1x10⁻⁶
THANET BED 20 to 22 N/A 0 40-44 1x10⁻²
to 1x10⁻⁵
BULLHEAD BED 20 to 22 N/A 0 40-44 1x10⁻²
to 1x10⁻⁵
UPPER CHALK 20 to 22 N/A 0 42-44 1x10⁻¹
to 1x10⁻²
The majority of the fine-grained samples from all strata plot at the edge of the plasticity limit
or beyond this within the semi-solid state. This results in the vast majority of fine grained
samples being stiff to very stiff.
7.0 REFERENCES
Attewell, P. (1995). Tunnelling contracts and site investigation. London: Taylor & Francis.
Burland, J. B., Standing, J.R., Jardine, F.M. (2001). Volume 1: Projects and methods.
Buliding response to tunnelling. Case studies from construction of the Jubilee Line
Extension, London. Thomas Telford Publishing.
Bristow, R., Mortimore, R., Wood, C. (1997) Lithostratigraphy for mapping the Chalk of
southern England. Proceedings of the geologists' Association. Vol 108, pp 293-315.
Clarke, B.G. (1990) Session 2: Pressuremeter Testing in Soils. Consolidation characteristics
of clays from self-boring pressuremeter tests. Geological Society, London, Engineering
Geology Special Publications; 1990; vol. 6, pp 33-37.
Craig, R.F. (2004) Craig's Soil Mechanics 7th
Edition. Spon Press, Abingdon, Oxfordshire.
34
Student no. eep50181
EDINA (2010). Carto, Land-Form Register, Ordnance Survey,
http://digimap.edina.ac.uk/carto3/index.jsp?useJS=true accessed on 14th
February, 2010.
Ellison, R.A. (2004). Geology of London. Special Memoir for 1:50 000 Geological sheets
256 (North London), 257 (Romford), 270 (South London) and 271 (Dartford) (England and
Wales). British Geological Survey, Keyworth, Nottingham.
Hight, D.W., Ellison, R.A., Page, D.P. (2004) Engineering in the Lambeth Group. CIRIA,
London.
Hughes, J.M.O., Wroth, C.P., Windle, D. (1977) Pressuremeter tests in sands. Geotechnique
Vol. 27 Issue 4, pp 455-477.
Peck, R.B., Hanson, W.E., Thorburn, T.H. (1974) Foundation Engineering, 2nd
Edition. John
Wiley and Sons, New York.
Royse, K.R., Rutter, H.K., Entwisle, D.C. (2008) Property attribution of 3D geological
models in the Thames Gateway, London: new ways of visualising geoscientific information.
Bulletin of Engineering Geology and the Environment, Vol. 68 pp 1-16.
Spink, T.W. (2002) The CIRIA Chalk description and classification scheme. Quarterly
Journal of Engineering Geology and Hydrogeology Vol. 35 Iss. 4 p 363-369.
Stroud, M.A., Butler, F.G. (1975) The Standard Penetration Test and the Engineering
Properties of Glacial Materials. Proceedings of the symposium on Engineering Properties of
glacial materials, Midlands, U.K.
Waltham, T.(2002) Foundations of Engineering Geology 2nd
Edition. Spon Press, Abingdon,
Oxfordshire.