jst-sentan · demonstrated by prof. hamaguchi within jst-sentan program (system development type)....
TRANSCRIPT

Development of Systems and Technologies for Advanced Measurement and Analysis
Highlights of JST-SENTAN 2014-2015
Contents
1Kazuyuki Hamada (System Instruments Co., Ltd.)Team
Leader
Shin-ichiro Nishimura (Hokkaido University)SubLeader
Fully Automated Glycan Analyzer for the Development of Disease Early Diagnostic SystemTitleP.04
2Kenichi Kawamura (Tokyo Instruments, Inc.)Team
Leader
Koichi Iwata (Gakushuin University)SubLeader
Development of Two-dimensional Multi-confocal Raman MicroscopeTitleP.06
3Sumiya Nagatsuka (Konica Minolta, Inc.)Team
Leader
Junji Tanaka (Saitama Medical University)SubLeader
Diagnostic Device Based on Diff erential Phase Contrast by X-ray Talbot-Lau InterferometryTitleP.08
4Kiyoshi Ogawa (SHIMADZU Corporation)Team
Leader
Mitsutoshi Seto (Hamamatsu University School of Medicine)SubLeader
Development and Optimization of Mass MicroscopeTitleP.10
5Shinji Omori (Sony Corporation)Team
Leader
Shuki Mizutani (Tokyo Medical and Dental University)SubLeader
Dielectric Spectro-cytometer: A New Technology for Label-Free Single Cell Analysis and SamplingTitleP.12
6Yutaka Unuma (SHARP Corporation)Team
Leader
Norie Araki (Kumamoto University)SubLeader
Automated 2D Electrophoresis and Electro-Blotting DeviceTitleP.14
7Hiroyuki Fukuyama (Tohoku University)Team
Leader
Yoichi Takasaki (ULVAC-RIKO, Inc.)SubLeader
High-temperature Thermophysical Proterty Measurement using Electromagnetic Levitation in DC Magnetic FieldTitleP.16
8Norihiko Fukatsu (Nagoya Institute of Technology)Team
Leader
Tomoko Ohshima (TYK Corporation)SubLeader
Hydrogen Sensor for Molten Metals Based on Alumina-base Proton Conducting OxideTitleP.18
9Hisamitsu Higashiyama (S.T.Japan Inc.)Team
Leader
Akira Sakamoto (Saitama University)SubLeader
Portable Raman Imaging Spectrometer Using Dimension-Compressed Imaging Optical FibersTitleP.20
10Katsuya Hioka (JEOL RESONANCE Inc.)Team
Leader
Tetsuro Asakura (Tokyo University of Agriculture and Technology)SubLeader
Ultra Fast Magic Angle Spinning Module in the Solid State NMR with a Rotor of 1mm DiameterTitleP.22
11Shinsuke Ishihara (Kyoto Electronics Manufacturing Co., Ltd.)Team
Leader
Keiji Sakai (University of Tokyo)SubLeader
Technology development of Innovative viscoelasticity measurement systemTitleP.24
12Sukehiro Ito (Hitachi High-Technologies Corporation)Team
Leader
Tatsuo Ushiki (Niigata University)SubLeader
Development of an Real-Time Stereo SEMTitleP.26
13Ryohei Kokawa (SHIMADZU Corporation)Team
Leader
Hirofumi Yamada (Kyoto University)SubLeader
Atomic Resolution Scanning Probe Microscope Working in Air/LiquidTitleP.28
14Hisataka Takenaka (NTT advanced technology Corporation)Team
Leader
Hiroshi Ito (National Institute of Advanced Industrial Science and Technology (AIST))SubLeader
Development of AFM Tip Characterizers and Evaluating the Tip ShapeTitleP.30
Life Science
Material Science
P.02Overview

15Jun Kawai (Kyoto University)Team
Leader
Portable Total Refl ection X-Ray Fluorescence Elemental AnalyzerTitle P.32
23Shigeo Okubo (Shinnihondenko Co., Ltd.)Team
Leader
Ryohei Sato (Osaka University)SubLeader
Development of Handy-type Smart Radiation Becquerel CounterTitleP.48
16Akio Kuroda (Hiroshima University)Team
Leader
Automated Asbestos Counting System Based on Bio-fl uorescence MethodTitle P.34
21Yasuhiro Ito (Japan Vilene Company, Ltd.)Team
Leader
Tetsuo Yasutaka (National Institute of Advanced Industrial Science and Technology (AIST))SubLeader
Rapid and Simultaneous Monitoring Method for Radiocesium in WaterTitleP.44
17Chikao Nagasawa (Tokyo Metropolitan University)Team
Leader
Makoto Tsukamoto (EIKO Instruments Corporation)SubLeader
Lidar System for Simultaneous Measurements of CO2 Density, Wind and Temperature Profi lesTitleP.36
22Yoshitaka Minai (Musashi University)Team
Leader
Hiroshi Iwamoto (Environmental Technology Service Co., Ltd.)SubLeader
Certifi ed Reference Materials for Determination of Environmental RadioactivityTitleP.46
18Satoshi Nomura (HORIBA Ltd.)Team
Leader
Takashi Kakiuchi (Kyoto University)SubLeader
High Accuracy and High Stability pH Combination Electrode Equipped with Ionic Liquid Salt BridgeTitleP.38
24Shinji Ohsuka (Hamamatsu Photonics K.K.)Team
Leader
Jun Kataoka (Waseda University)SubLeader
Development of Sensitive and Handy Compton CameraTitleP.50
19Nobuyuki Takegawa (Tokyo Metropolitan University)Team
Leader
Noritomo Hirayama (Fuji Electric, Co., Ltd.)SubLeader
Development of an Online Aerosol Particle Combined Analysis SystemTitleP.40
25Tadayuki Takahashi (Japan Aerospace eXploration Agency (JAXA))Team
Leader
Yoshikatsu Kuroda (Mitsubishi Heavy Industries (MHI), Ltd.)SubLeader
Advanced Gamma-ray Imaging System with an Ultra-wide Angle Field of View and a High SensitivityTitleP.52
20Shoichi Uematsu (Yazaki Corporation)Team
Leader
Gen Inoue (University of Tokyo)SubLeader
Ultra Compact Measurement System for Carbon Dioxide MonitoringTitleP.42
Environmental Science
Rediation Measurement
P.54Name Index P.55Institution Index P.57Technology Index
1

The Japan Science and Technology Agency (JST) is one of the core institutions responsible
for the implementation of science and technology policy in Japan.
Mission: Contributing to the Generation of Science & Technology Innovation
As a core institution responsible for the implementation of Japan’s 4th Science and Technology
Basic Plan, JST contributes to the creation of S&T Innovation.
Our visions:
1. We actualize S&T Innovation through our creative R&D.
2. We maximize research achievements by integrating the world’s knowledge as a “network-type
research institute.”
3. We establish Japan’s S&T infrastructure to accelerate S&T Innovation.
1. About JST
2. About “JST-SENTAN (Development of Advanced Measurement and Analysis Systems)” Program
Creative and original R&D is a key to generating innovation. To boost these activities, JST
promotes the development of systems and technologies for advanced measurement and analy-
sis. Our program offers suitable support types to match different needs of each development
phase.
Since FY2012, in addition to our original support types, priority development areas are set after
scientific, technological and social issues. As the priority development areas, “Radiation Mea-
surement” and “Green Innovation” have been set for FY2012, then “Life innovation area” for
FY2013.
●Objectives
Overview
2

●Program Scheme
●Scope of JST-SENTAN Program
3

Life Science
Fully Automated Glycan Analyzer for the Development of Disease Early Diagnostic System
Participating organizationSystem Instruments Co.,Ltd., Hokkaido University, Bruker Daltonics K. K., Science & Technology Systems, Inc.
Apparatus nameFully automated glycan analyzer
KeywordsGlycoblotting method, Human serum glycoproteins, Disease-relevant glycans, High throughput glycomics, Biomarkers, Early diagnosis
It is thought that glycans can be potential candidates for novel diagnostic and therapeutic biomarkers because drastic structural changes in human serum glycoproteins are often observed during cancer cell differentiation and progression. Although there have been substantial advances in our understanding of the effects of glycosylation on some biological systems, we still do not fully understand the significance and mechanism of glycoform alteration detected widely in many human diseases due to their highly complicated structures and extremely tedious and time-consuming processes for glycan enrichment analysis. We have developed for the first time a fully automated glycan analyzer based on “glycoblotting method” known as only one method allowing rapid and large-scale clinical glycomics of human whole serum glycoproteins. We discovered novel glycan biomarkers from serum samples of patients suffering from various cancers such as hepatocellular carcinoma (HCC), pancreatic cancer, renal cancer, and so on.
Abstract
Kazuyuki Hamada System Instruments Co.,Ltd.
Team Leader
Shin-ichiro NishimuraHokkaido University
Sub Leader
FDD
ResultNo.1
4

ContactPerson in charge:Shin-Ichiro NishimuraAffiliation:Hokkaido UniversityE-mail:[email protected]
Life Science
Publications1) Nishimura S-I., “TOWARD AUTOMATED GLYCAN ANALYSIS”, Advances in Carbohydrate Chemistry and
Biochemistry, ELSEVIER, 65, 219-271 (2011) 2) Nishimura S-I., et al ., “Glycomics for drug discovery: Metabolic perturbation in androgen-independent pros-
tate cancer cells induced by unnatural hexosamine mimics”, Angew. Chem. Int. Ed. 51, 3386-3390 (2012)3) Kamiyama T., et al ., “Identification of novel serum biomarkers of hepatocellular carcinoma using glycomic analysis”, Hepatology 57, 2314-2325 (2013)
4) Nouso K., et al ., “Clinical utility of high-throughput glycome analysis in patients with pancreatic cancer”, J. Gastroenterology 48, 1171-1179 (2013)
5) Miyahara K., et al ., “Serum glycan as a prognostic marker in patients with advanced hepatocellular carci-noma treated with sorafenib”, Hepatology, 59, 355-356 (2014)
Technical Performance1) Whole N-glycan structural characterization of 96 human serum samples/24 hours2)Quantitation of 50̃60 glycan structures3)High repeatability and reproducibility4) Flexibility in the labeling reagents and structural profiling methods such as HPLC-, LC-ESIMS, and MALDI-TOFMS platform
Technical Overview We demonstrated that the “SweetBlot” machine, an automated glycoblotting platform, can be combined with MALDI-TOFMS by a designated robot for the transportation of MALDI plate carrying labeled serum glycans. The “Sweetblot” greatly accelerated whole serum glycan-enrichment and subsequent labeling in an all-in-one protocol for 96-well filter-plate format. It requires very little material (human serum, 10̃100 micro L) and takes only ̃14 hours to complete whole glycan profiling of 96 samples when combined with glycomics using general mass spectrometry. For example, use of automated glycan analyzer established herein allowed for rapid and quantitative N-glycan profiling of 103 human serum samples (83 HCC patients and 20 normal donors) concurrently. To identify the essential features to optimally classify the sera between the two relevant classes, disease and normal, we applied a sequential forward-selection algorithm that sequentially selected a better combination of N-glycan peaks based on leave-one-out (LOO) error rates of a k-nearest neighbor classifier (k = 3). When we chose the ratio of every two peaks
among the acquired that show significant difference (two-sided t -test, P < 0.001) between disease and control, the algorithm finally selected three combinations of N-glycan ratio features that distinguished HCC samples from normal controls with 99% accuracy. In a similar manner, we have discovered a variety of potential prognostic biomarkers for renal cancer and HCC as well as early diagnosis of pancreatic cancer. Most common theme in the glycan analysis has long been considered to be the need to develop simplified and cost effective techniques that could be used by non-specialists. In addition, it seems likely that the expense and complexity of many of the existing tools limits the ability of the broader biology community to address questions in carbohydrate research. Thus, the automated glycan analyzer based on glycoblotting method was demonstrated to provide a convenient, noninvasive diagnostic tool for many diseases that have previously been difficult in early diagnosis or differentiation.
Whole N-glycomes of pigeon egg white revealed by “glycoblotting”M. Amano & K. Hirose et al., in prep.
5

Life Science
Development of Two-dimensional Multi-confocal Raman Microscope
Participating organizationTokyo Instruments, Inc., Gakushuin University
Apparatus nameTwo-dimensional multi-point confocal Raman microscope (Product name: Phalanx-R)
Keywords Raman spectroscopy, Confocal microscopy, 3D imaging, Bio-imaging, Fast imaging
A two-dimensional multi-point confocal Raman microscope ”Phalanx-R” that enables one to obtain Raman microscopic image of living cells and tissues in real time. ”Phalanx-R”is based on the prototype developed and demonstrated by Prof. Hamaguchi within JST-SENTAN program (system development type). In the Raman microscope, an excitation laser beam is split into 21 by 21, totally 441 beamlets and shined on a sample. Consequently, two-dimensional Raman image is obtained without raster scan of the excitation beam or the sample. This makes the measurement 441 times faster than conventional confocal Raman microscopes with a single excitation beam.
Abstract
Kenichi Kawamura Tokyo Instruments, Inc.
Team Leader
Koichi IwataGakushuin University
Sub Leader
DRR
ResultNo.2
Fig. 1 Appearance of inverted-type two-dimensional multi-point confocal Raman microscope. The left unit consists of an optical microscope, a multi-point confocal optic unit, and an exci-tation laser. The right one consists of a trans-mission-grating spectrograph and a CCD de-tector. The two units are linked with a fiber bundle.
6

ContactPerson in charge:Kenichi KawamuraAffiliation:Tokyo Instruments, Inc.E-mail:[email protected]
Life Science
Technical Overview The two-dimensional multi-point Raman microscope “Phalanx-R” can obtain a Raman image in a moment without scanning an excitation spot or a sample. The laser beam is split into 21 by 21, totally 441 beamlets of square matrix array and is shined onto a sample. Interval of the spots is 560 nm in the focal plane when a 100x objective is used. Consequently, the field of view covers an area of 11 by 11 square microns in the case. The Raman scattering from each spot is collected with the objective lens and transferred through a confocal optical system and a fiber bundle. The fiber bundle is used for rearranging two-dimensionally distributed Raman scattering beamlets into a one-dimensional line to be introduced to the spectrometer. At its input end, the element
fibers are arranged in square-matrix array with unprecedentedly high precision, so that the Raman scattering from each spot is coupled to the corresponding fiber element. At the other end, element fibers are rearranged into dual one-dimensional arrays of 221 and 220. The dual arrays lie in parallel with each other, which results in dual series of spectra lying side by side in a CCD image. Thus, totally 441 spectra are recorded simultaneously at once. Each pair of excitation beamlet and its corresponding fiber element conforms to confocal optical system, which enhances contrast and spatial resolutions. Therefore, one can observe the interior of a transparent sample three-dimensionally as well as minimize the hindrance by background auto-fluorescence.
Technical Performance
Excitation wavelength 532 nm. Customizable.Number, formation of spots 21x 21 square matrix. Customizable.Interval of spots 560 nm (@ 532 nm). CustomizableDimensions (W x D x H) 1,500 x 700 x 800 mm.Weight Approx. 100 kg.
Spatial resolution X-Y: 350 nm, Z: 900 nm (@532 nm, 100x NA1.4). Near diffrac-tion limit.
Spectral range400 - 2400 cm-1 (1300-lines/mm grating, 441 spots).150 - 3100 cm-1 (1300-lines/mm grating, 100 spots).Customizable.
Spectral resolution >7 cm-1 (@532 nm, 1300-lines/mm grating). Customizable.
Fig. 2 Raman image of polystyrene beads. The image is of ring breathing mode at 1000 cm-1. The excitation pattern here is a square matrix of 21 by 21, totally 441 spots with the interval of 0.56 mm. The image was measured in one second without sample scan.
Fig. 3 Raman image of a human epithelial cheek cell. The Ra-man image is of CH stretching mode at 2950 cm-1. The excitation pattern here is a square matrix of 10 by 10, totally 100 spots with the interval of 3.3 mm. The image was measured by scanning the sample so as to interpo-late the interval of the excitation spots (interpolation) and to expand the field of view (tile).
7

Life Science
Diagnostic Device Based on Differential Phase Contrast by X-ray Talbot-Lau Interferometry
Participating organizationKonica Minolta, Inc., Saitama Medical University, Tohoku University,
Apparatus nameX-ray Talbot-Lau interferometry for clinical use
Keywords X-ray interferometry, Phase contrast, New imaging technology
We’ve developed a diagnostic system based on differential phase contrast by an X-ray Talbot-Lau interferometry, which has high sensitivity to depict soft tissue such as tendon and cartilage in human body. With Talbot-Lau interferometry, three different types of images can be simultaneously obtained by calculations: an attenuation image, a small-angle-scattering (dark-field) image, and a differential phase image. We examined its feasibility for clinical diagnoses of joint diseases with the differential phase image. The joints of healthy volunteers were imaged, and the results indicated that the developed device had sufficient sensitivity to image cartilages. Therefore, this diagnostic device based on X-ray Talbot-Lau interferometry is very promising and will offer better diagnosis.
Abstract
Sumiya Nagatsuka Konica Minolta, Inc.
Team Leader
Junji TanakaSaitama Medical University
Sub Leader
DCC
ResultNo.3
Abstract of the device
8

ContactPerson in charge:Sumiya NagatsukaAffiliation:Konica Minolta, Inc.E-mail:[email protected]
Life Science
Publications1) Momose A et al , Phase Tomography by X-ray Talbot Interferometry for Biological Imaging, Jpn J Appl Phys, 45, 5254-5262, 2006
2) Yashiro W et al , Efficiency of Capturing a Phase Image Using Cone-Beam X-ray Talbot Interferometry, J Opt Soc Am A, 25, 2025-2039, 2008
3) Kido K et al , Bone cartilage imaging with X-ray interferometry using a practical X-ray tube, SPIE Proc. 7622 76224O, 2010
Technical Performance The cartilage of metacarpophalangeal joint of the third finger of a healthy volunteer was clearly depicted. The refraction angle of the surface of the cartilage was 0.14 μrad.
Technical Overview The system consists of three X-ray gratings, a conventional X-ray tube, an object holder, an X-ray image sensor and a com-puter for image processing. The gratings were named G0, G1 and G2 respectively. An X-ray generator of a tungsten anode was operated with a tube voltage of 40 kVp, and a tube cur-rent of 100 mA. The mean X-ray energy was 28 keV. The pitch-es of G0, G1 and G2 were 22.8 μm, 4.3 μm, and 5.3 μm, re-spectively. The opening width of G0 was 7 μm, and the duty cycle of G1 and G2 was 0.5. G1 and G2 were located 1.1 m and 1.36 m from G0, respectively. G1 was a π/2 phase grating
for 28 keV X-rays, and G2 was an amplitude grating, whose gold pattern height was 43 μm. The object to be imaged was placed in front of G1. The area size of G1 and G2 was 60 mm x 60 mm, and the effective field of view was 49 mm x 49 mm tak-ing account of the magnification of the image. All gratings were fabricated with X-ray lithography and gold electroplating. A flat panel detector was located behind G2 and its pixel size was 85 μm. The in vivo image was obtained with this system with a three-step fringe-scan.
Example of the image data
9
Life Science
Development and Optimization of Mass Microscope
Participating organizationSHIMADZU Corporation, Hamamatsu University School of Medicine, Keio University
Apparatus nameMass Microscope (iMScope)
Keywords Mass Imaging, Microscope, Lipid, Metabolite, Life Science
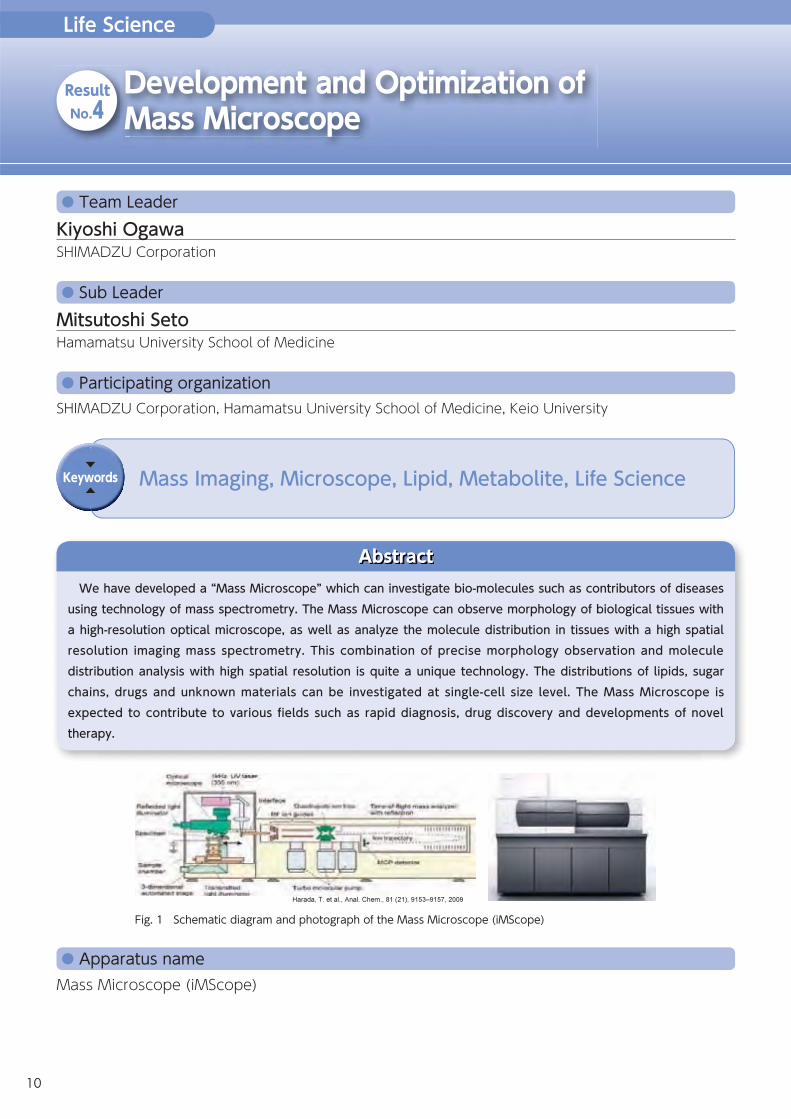
We have developed a “Mass Microscope” which can investigate bio-molecules such as contributors of diseases using technology of mass spectrometry. The Mass Microscope can observe morphology of biological tissues with a high-resolution optical microscope, as well as analyze the molecule distribution in tissues with a high spatial resolution imaging mass spectrometry. This combination of precise morphology observation and molecule distribution analysis with high spatial resolution is quite a unique technology. The distributions of lipids, sugar chains, drugs and unknown materials can be investigated at single-cell size level. The Mass Microscope is expected to contribute to various fields such as rapid diagnosis, drug discovery and developments of novel therapy.
Abstract
Kiyoshi Ogawa SHIMADZU Corporation
Team Leader
Mitsutoshi SetoHamamatsu University School of Medicine
Sub Leader
DMM
ResultNo.4
Fig. 1 Schematic diagram and photograph of the Mass Microscope (iMScope)
10

ContactPerson in charge:Kiyoshi OgawaAffiliation:SHIMADZU CorporationE-mail:[email protected]
Life Science
Publications1) Harada, T. et al. , Visualization of Volatile Substances in Different Organelles with an Atmospheric-Pressure
Mass Microscope, Anal. Chem., 81 (21), 9153‒9157, 20092) Kubo, A et al. , Semi-quantitative Analyses of Metabolic Systems of Human Colon Cancer Metastatic
Xenografts in Livers of Superimmunodeficient NOG Mice, Anal. Bioanal. Chem. , 400, (7), 1895-1904, 2011.
3) Takizawa, Y. et al. , Specific Localization of Five Phosphatidylcholine Species in the Cochlea by Mass Microscopy, Audiology & Neurotology, 16, No. 5, 315-322, 2011
Technical Performance
Items SpecificationsSample chamber Atmospheric pressureResolution of optical microscope 1µmSpatial resolution of MS imaging Less than 5µmAnalysis speed 0.2sec/PixelMass range 50~3000 DaMass resolving power 10,000 (@ m/z 1,000)MSn analysis Available
Technical Overview We have developed a Mass Microscope which enables us to observe morphology of a tissue by high resolution optical mi-croscope, and simultaneously enables us to analyze the distri-bution of bio-molecules in the tissue using technology of mass spectrometry. The optical microscope equips high magnitude objective lenses, so users can observe the morphology of sam-ples in detail. Mass analysis is performed with AP-MALDI (At-mospheric Pressure Matrix-Assisted Laser Desorption / Ioniza-tion) method. Sample is coated or mixed with substance called “Matrix”, and it is irradiated by focused laser light under atmo-spheric pressure for ionizing molecules. Matrix plays a role to assist the soft ionization process. The laser light of the Mass Mi-croscope is focused less than 5 micrometers, so it enables us to obtain information of single-cell level molecular distributions.
The Mass Microscope also equips ion-trap which enables MS/MS or MSn analysis. The MS/MS or MSn analysis is a very power-ful tool to identify unknown molecules detected in the tissues. Fig. 2 shows the distribution of lipids in cochlea of guinea pig. It indicates that the Mass Microscope can clearly visualize the distributions of bio-molecules in a very small organ such as co-chlea. The Mass Microscope has started to be utilized for research-es of medical and pharmaceutical field, for example it has con-tributed to discover specific molecules for serious diseases. And also it is expected to be a useful tool in the industrial fields such as organic material analysis.
Fig. 2 Molecule distribution in Cochlea of guinea pig
11

Life Science
Dielectric Spectro-cytometer: A New Technology for Label-Free Single Cell Analysis and Sampling
Participating organizationSony Corporation, Tokyo Medical and Dental University
Apparatus nameDielectric Spectro-cytometer (DSCM)
Keywords Label-free, Single-cell analysis, Dielectric spectro-cytometer
Recently, in medical and biological researches, some leading-edge studies focus on realization of regenerative medicine, cell therapy, and genetic diagnosis. For cell/gene-based researches and diagnoses, the information from cell analysis is important. A label-Free cell analysis and collection method which is applicable to regenerative medicine does not exist to date. A newly developed dielectric spectro-cytometer realizes label-free cell analysis by analyzing dielectric spectra of single cells in a microchip flow channel. This apparatus also allows sampling target cells according to dielectric spectra. The dielectric spectro-cytometer introduces a novel concept of single-cell analysis without staining target cells. This technology is expected to contribute to the state-of-the-art research fields such as regeneration medicine.
Abstract
Shinji Omori Sony Corporation
Team Leader
Shuki MizutaniTokyo Medical and Dental University
Sub Leader
Dfff
ResultNo.5
Fig. 1 Principle of dielectric spectro-cytometer Fig. 2 Electrode integrated microfluidic chip for cell analysis and cell sorting
12
ContactPerson in charge:Yoichi KatsumotoAffiliation:Sony CorporationE-mail:[email protected]
Life Science
Technical Overview One of the instruments commonly used for cell analysis in medical and biological researches is a flow cytometer. It ana-lyzes with high throughput cells labeled with fluorescent dyes flowing in a narrow channel by irradiating laser light. Because this method requires labeling of cells with dyes specific to the cell types in advance, analysis and sampling of cells in native states is impossible. Sony and Tokyo Medical and Dental University have been de-veloping, since 2009, a new analysis system named dielectric spectro-cytometer. We aim at developing the technology to an-alyze and sample single cells by using the difference of their electric properties, without labeling material like fluorescent
dyes (Fig. 1 and 2). We have developed the ultra-fast impedance analyzer and detector with embedded electrodes inside the microfluidic chip and constructed the prototype of an automated analysis and sampling system (Figure 2). The microfluidic chip consists of polymer films originally used for flexible substrates for circuit-ries in electronics products. This allows low-cost, large volume production through use of industrial fabrication processes for circuit substrates. Therefore, the chip is cheap and thus dispos-able for each sample to avoid sample contamination and other problems.
Publications1) Yoichi Katsumoto et al., “Single cell dielectric spectroscopy in a micro-channel”, Proceedings of the 15th
International Conference on Miniaturized Systems for Chemistry and Life Sciences , pp.613-615 (2011).2) Kazuya Tatsumi et al., “Numerical model for microparticle and lymphocyte motions in dielectrophoretic
manipulation device”, Proceedings of the 15th International Conference on Miniaturized Systems for Chemistry and Life Sciences, pp.1364-1366 (2011).
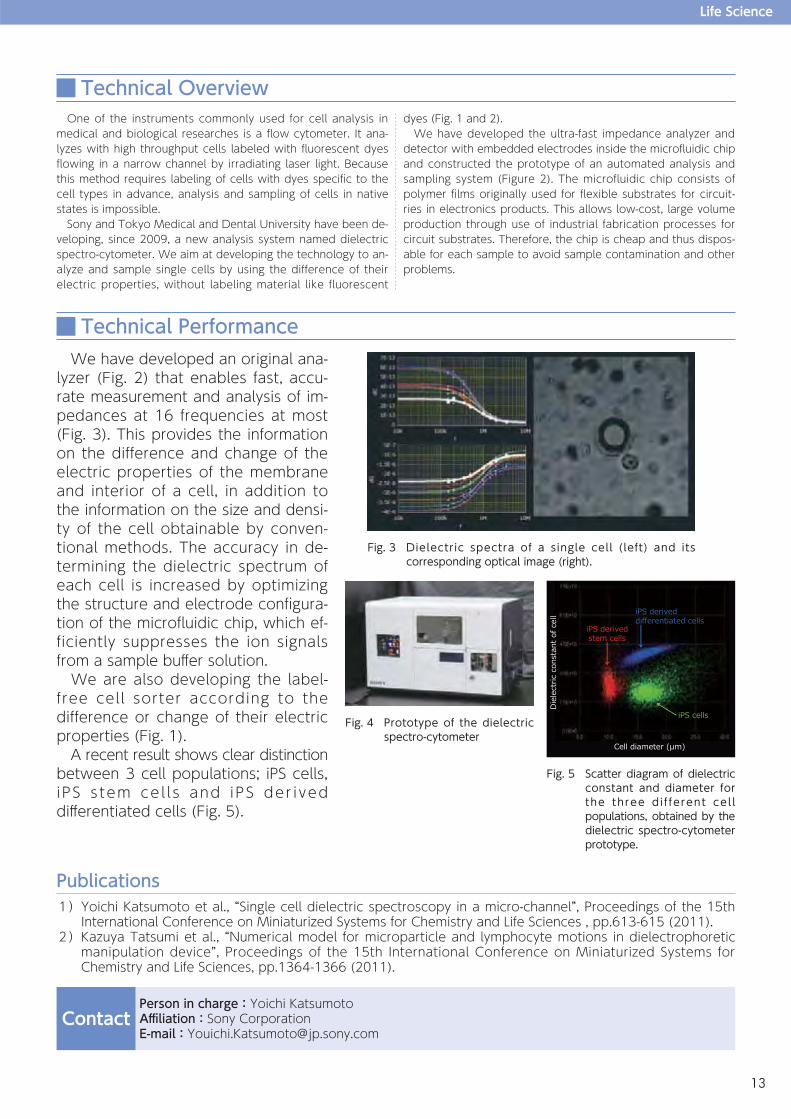
Technical Performance We have developed an original ana-lyzer (Fig. 2) that enables fast, accu-rate measurement and analysis of im-pedances at 16 frequencies at most (Fig. 3). This provides the information on the difference and change of the electric properties of the membrane and interior of a cell, in addition to the information on the size and densi-ty of the cell obtainable by conven-tional methods. The accuracy in de-termining the dielectric spectrum of each cell is increased by optimizing the structure and electrode configura-tion of the microfluidic chip, which ef-ficiently suppresses the ion signals from a sample buffer solution. We are also developing the label-free cell sorter according to the difference or change of their electric properties (Fig. 1). A recent result shows clear distinction between 3 cell populations; iPS cells, iPS s tem ce l l s and iPS der ived differentiated cells (Fig. 5).
Fig. 5 Scatter diagram of dielectric constant and diameter for the three di f ferent cel l populations, obtained by the dielectric spectro-cytometer prototype.
Fig. 3 Dielectric spectra of a single cell (left) and its corresponding optical image (right).
Fig. 4 Prototype of the dielectric spectro-cytometer
13

Life Science
Automated 2D Electrophoresis and Electro-Blotting Device
Participating organizationSHARP Corporation, Kumamoto University
Apparatus nameAutomated 2D-Electrophoresis Device (Auto2D BM-100)Automated 2D-Electrophoresis and Electro-Blotting Device
Keywords 2D Electrophoresis, Proteome, IEF, SDS-PAGE, Western Blotting
Protein analysis that combines a two dimensional (2D) electrophoresis and a western blotting method has been used for drug discovery and clinical research. In these methods, proteins are separated by an isoelectric focusing and SDS-PAGE, and transferred to a membrane electrically, followed by the detection with immunological reaction. This method consists of a lot of complicated processes on many different instruments. Therefore, the results are poorly reproducible. 1) We have developed an automated 2D electrophoresis device. It can automatically execute all the 2D electrophoresis process including soaking up sample, IEF, chemical treatments, connecting 1st gel to 2nd gel, and SDS-PAGE in 100 minutes. We commercialized this product in September, 2011.
2) We have stepped into the next stage of automation including electro-blotting process. We have developed an automation device that was able to perform 2D electrophoresis, electro-elution of protein, combined with protein blotting to a PVDF membrane. We achieved high transfer efficiency >90% and high reproducibility CV<5%.
Abstract
Yutaka Unuma SHARP Corporation
Team Leader
Norie ArakiKumamoto University
Sub Leader
AEE
ResultNo.6
Fig. 1 Automated 2D elec-trophoresis device (Auto2D BM-100)
Fig. 2 Automated 2D elec-t r opho r e s i s a nd electro-blotting de-vice
14

ContactPerson in charge:Yutaka UnumaAffiliation:Research Dept. II, Healthcare Systems Laboratories, Corporative Research and Develop-ment, Sharp CorporationE-mail:[email protected]
Life Science
Publications1) Araki, N, Integrated proteomics for studying cellular mechanism of neural tumor formation. Connective Tis-sue Research, 2012 in press
Technical Overview
Technical PerformanceFully automated 2D electrophoresis and electro-blotting device
Auto2D BM-100 Conventional DevicesOperation Fully automated ManualAnalysis time 2~3 hours 3~4 daysTransfer efficiency >90% <70%Reproducibility (CV) <5% >30%
1) Automated 2D-Electrophoresis Device (Auto2D BM-100, Fig.1)
Conventional method of 2D-Electrophoresis requires carefully elaborated manual operation and has problems of analysis time, reproducibility and resolution. We have developed “Au-to2D”, 2D electrophoresis device by achievement of accurate robotic manipulation. This machine provides users easy setting of the sample and user-friendly touch panel operation. And also, it eliminates manual operation by skilled technicians, and shortened analysis time greatly. Automatic analysis with first di-mension of isoelectric point: 0.02pH resolution and second di-mension of molecular weight: 2kDa resolution. The phosphory-lation shift is clearly separated and detected. Long waited device is now available. Auto2D is useful for protein analysis in pharmaceuticals and food industry as well as biochemical study.
2) Automated 2D-Electrophoresis and Electro-Blotting Device (Fig.2)
We have stepped into the next stage of automation including electro-blotting process. Conventional electro-blotting process
consists of a lot of complicated processes based on many dif-ferent instruments. Especially, researchers have to take out gel from the electrophoresis device, and set gel and membrane to electro-blotter manually, and these procedures always lack re-producibility of the protein transfer efficiency and resolution, and also are complicated and time consuming. Therefore, we developed an automation system that was able to perform 2D electrophoresis, electro-elution of protein, combined with pro-tein blotting to a PVDF membrane. The separated proteins in the second-dimensional electrophoresis (i.e. SDS-PAGE) step are eluted continuously from the edge of gel, and then the elut-ed proteins can be transferred continuously on the moving membrane (Fig.3). We developed a prototype device of fully automated 2D-electrophoresis and electro-blotting system. It took about 3 hours for total analysis. To confirm whether the prototype can detect post-translational modifications of protein, samples de-rived from human brain tumor was analyzed. As the results, the 2DE-WB pattern that showed the proteinpost-translational modification was obtained immediately with the high resolution (0.02pH)(Fig.4).
Fig. 3 Scheme for automated electro-blotting Fig. 4 Western blotting result of brain tumor specific proteins (Vimentin)
15

High-temperature Thermophysical Proterty Measurement using Electromagnetic Levitation in DC Magnetic Field
Participating organizationTohoku University, Gakushuin University, Chiba Institute of Technology, ULVAC-RIKO, Inc., System House Inc.
Apparatus namePROSPECT (Properties and Simulations Probed with Electromagnetic Containerless Technique)
Keywords Electromagnetic levitation, DC magnetic field, High-temperature melts, Thermophysical property
Thermophysical properties of high-temperature melts are indispensable for numerical simulations of materials processes. However, crucial obstacles make measurements of thermophysical properties difficult at elevated temperatures because of high chemical reactivity and fluidity of melts. From the background mentioned above, we have developed a thermophysical property measurement system for heat capacity, thermal conductivity, emissivity, surface tension and density of high-temperature metallic melts using an electromagnetic levitator in a dc magnetic field. The oscillation and convection of the droplet are suppressed because of the Lorentz force, which enables true thermal conductivity measurement. Numerical simulation was also conducted to justify the thermal conductivity measurement.
Abstract
Hiroyuki FukuyamaTohoku University
Team Leader
Material Science
Yoichi TakasakiULVAC-RIKO, Inc.
Sub Leader
HMMMi
ResultNo.7
Fig. 1 PROSPECT Fig. 2 Molar heat capacities of liquid Fe, Ni and Si
Fig. 3 Thermal conductivities of liq-uid Fe, Ni and Si
16

ContactPerson in charge:Hiroyuki FukuyamaAffiliation:Institute of Multidisciplinary Research for Advanced Materials (IMRAM), Tohoku UniversityE-mail:[email protected]
Material Science
Publications1) H. Kobatake, H. Fukuyama, T. Tsukada, S. Awaji Noncontact modulated laser calorimetry in a dc magnetic field for stable and supercooled liquid silicon Meas. Sci. Technol. 21 (2010) 0259012)K. Morohoshi, M. Uchikoshi, M. Isshiki, H. Fukuyama Surface Tension of Liquid Iron as Functions of Oxygen Activity and Temperature ISIJ International, Vol. 51 (2011), No. 10, pp. 1580‒15863)K. Sugie, H. Kobatake, M. Uchikoshi, M. Isshiki, K. Sugioka, T. Tsukada, H. Fukuyama Noncontact Laser Modulation Calorimetry for High-Purity Liquid Iron Jpn. J. Appl. Phys., 50 Nov. (2011) pp.11RD04-1-6
Technical PerformanceThe following table shows the thermophysical properties with uncertainty measured using PROSPECT.
Thermophysical property Element Value at melting point Uncertainty/% Temperature range/ KDensity Si 2585 kg/m3 ±1.0 1440-1700Heat capacity Si 24.1 J/ (mol·K) ±2.9 1550‒1960
Fe 45.4 J/ (mol·K) ±3.5 1848‒1992Thermal conductivity Si 56.0 W/ (m·K) ±2.6 1550‒1960
Fe 39.1 W/ (m·K) ±3.2 1794‒2050Total hemispherical emissivity Si 0.27 ±3.8 1750‒1910Normal spectral emissivity at 807 nm Si 0.227 ±1.8 1660‒1790Surface tension Fe 1925 mN/m ±3.4 1666-2120The experimental uncertainty used here is the value of the standard deviation.
Technical Overview This high-temperature thermophysical property measurement system (PROSPECT) consists mainly of an electromagnetic levi-tator incorporating a superconducting magnet, laser heating system, high-speed video camera, data-logging system and gas-controlling system including an oxygen sensor and oxygen pump. The electromagnetic levitator consists of a radio-fre-quency power source (max power of 10 kW and automatic tuning ranging from 150 to 400 kHz). A superconducting mag-net with a bore diameter of 120 mm was used to generate a dc magnetic field. The magnet coils are made of Nb3Sn and NbTi, and generate max magnetic field of 10 T. A fiber-coupling type CW laser diode was equipped on the system for laser modulation calorimetry. The laser wavelength is 807 ± 3 nm, and its max power is 140 W. The PROSPECT also has an inte-grated measurement and control system constructed using Lab-VIEW. The system includes user-friendly simulation applications
software (electromagnetic field, heat and mass flow, and sur-face oscillation analysis) and thermophysical property analysis applications software (heat capacity, emissivity, thermal con-ductivity, density and surface tension measurements). Using the PROSPECT, (1) Sample melts can be kept noncontact, which provides
contamination-free measurements.(2) Surface oscillation and convection of sample droplet can
be suppressed in a dc magnetic field, which enables true thermal conductivity measurements.
(3) Measurements can be conducted even at a deep super-cooling state, which enables wide-temperature measure-ments and non-equilibrium processes.
(4) Measurements can be conducted under vacuum condi-tion or reducing ambient or controlled oxygen partial pressure using a gas/liquid equilibrium method.
Fig. 4 Surface tension of liquid Fe vs Temp. under various oxygen activities
Fig. 5 Surface tension of liquid Fe in 3D diagram
17

Hydrogen Sensor for Molten Metals Based on Alumina-base Proton Conducting Oxide
Participating organizationNagoya Institute of Technology, TYK Corporation
Apparatus nameHydrogen sensing system for molten metals.
Keywords Electromotive-force, Galvanic Cell, Oxide Proton Conductor, Monitoring of Hydrogen Content in Molten Metal
Monitoring hydrogen content in the molten metals at the ingot making process is important because the dissolved hydrogen may cause the gas porosity and harms the mechanical characteristics of the metal products. By composing the concentration cell using a new type proton conductor based on alumina-base oxide, a hydrogen sensor probe has been developed to measure the hydrogen content in the industrial metal making process. This is a unique real time hydrogen sensing system that can detect continuously the amount of hydrogen in molten metals at the temperature around 1300̊C. This powerful system is able to assure the high quality of the products and to attain the energy and CO2 reduction in the production process of base-metal materials.
Abstract
Norihiko FukatsuNagoya Institute of Technology
Team Leader
Material Science
Tomoko OhshimaTYK Corporation
Sub Leader
HAA
ResultNo.8
Fig. 1 Whole view of the developed hydrogen sensing system :
The sensor probe and the measurement equipment are electrically connected by the cable through which the reference gas (ambient air) is also supplied. The metal block on the top of the probe is the protection cap which melts down and softens the attack of ther-mal shock when the sensor is inserted into the molten metal.
Fig. 2 Example of the monitor-ing of hydrogen content :
This is the example of monitor-ing of hydrogen content of the molten copper flowing in the pot of the continuous casting ma-chine. The oxygen content de-tected by the conventional type oxygen sensor is also plotted. It can be seen that the temporary oxygen increase and hydrogen decrease due to the reduction of the metal flow are settled gradu-ally on the recovery of the flow rate.
18

ContactPerson in charge:Norihiko FukatsuAffiliation:Nagoya Institute of TechnologyE-mail:[email protected]
Material Science
Publications1) N. Kurita et al., “Hydrogen concentration cell using α-alumina as a solid electrolyte.”, Solid State Ionics,
vol.162-163, pp.135-145, 2003.2) Y. Okuyama et al., “A new type of hydrogen sensor for molten metals usable up to 1600K.”, Electrochimi-ca Acta, vol.55, pp. 470-474, 2009.
3) N. Kurita et al., “Development of Electromotive-Force Type Hydrogen Sensor for Copper Melting Process.”, Journal of Japan Institute of Copper, vol.53, No.1, pp. 171-176, 2014.
Technical PerformanceSensor Probe
Item Specification
Working Temperature 1100°C -1350°CMeasuring Range Equilibrium Hydrogen Pressure 10-3-1bar
Concentration 0.080-5.9 ppm for CuAccuracy 5% of Displayed ValueLife Time 24 hour+ (Tough-pitch Copper)
Measurement Equipment
Item Specification
Acceptable Input Thermocouple 1, Sensor 2Operation Function Equilibrium Hydrogen Pressure, Equilibrium Oxygen Pressure,
Hydrogen Concentration, Oxygen Concentration Sampling Time Arbitral (more than 1s)Key Operation Touch PanelDisplay Function Value or GraphPower Supply AC and BatteryData Save SD Card, CSV File FormatOut Put Printer and Display PanelAmbient Temperature 0-40°C
Technical Overview The gas elements analysis in the liquid metal is difficult as the considerable amount of gas is lost or enriched in the quench of the sample, and the following extraction procedures take a long time. Therefore, the result of the analysis based on the conventional method is seldom used as the input data of the process control. For oxygen, the galvanic-cell type dipping oxy-gen sensor was already developed by employing the oxide ion conducting ceramics as the electrolyte, so the real-time moni-toring of oxygen content was widely adopted in the industrial process. For hydrogen, on the contrary, the proper proton con-ducting material has not been obtained and the similar technol-ogy has not been developed. Recently, we have found that the acceptor-doped alpha alu-
mina works as proton conducting solid electrolyte even at the high temperatures around 1300°C ( Ref. 1 & 2 ). Employing this new material, we have developed a galvanic-cell type hydrogen sensor usable in the industrial process of metal production. The new sensor first achieved the real-time and continuous moni-toring of the hydrogen content in the flowing molten metals at the temperature around 1300°C such as copper, copper alloy, etc (Ref. 3). Moreover, thanks to the unique electrochemical characteristic of the electrolyte material, the present sensor re-quires only ambient air in the place of the reference material. The hydrogen sensor for molten metal has now been available with comparable performance and handiness of which the ex-isting galvanic-cell type oxygen sensor offers.
19

Portable Raman Imaging Spectrometer Using Dimension-Compressed Imaging Optical Fibers
Participating organizationNational Museum of Japanese History
Apparatus namePortable Raman imaging system
Keywords Raman, Imaging spectrometer, cultural-assets, Chemical Image
The portable type Raman imaging instrument using ‶Liquid Crystal Tunable Filter (LCTF)" was already developed for studying cultural-assets. The instrument with LCTF is suitable for obtaining Raman image data at a specific Raman shift, but it is required comparatively long measuring time to take a Raman spectrum in a broad Raman wavenumber region, because the sweep speed for wavelength (wavenumber) is not so fast. To improve the above mentioned inconvenience, we constructed a novel portable Raman imaging system with the innovative ‶dimension compression mold image fiber". With this new system, broad range Raman spectra from all points on the surface of the target area can be obtained simultaneous, in several minutes from several seconds.
Abstract
Hisamitsu HigashiyamaS.T.Japan Inc.
Team Leader
Material Science
Akira SakamotoSaitama University
Sub Leader
PDD
ResultNo.9
Fig. 1a) Unique portable Raman Im-aging system with Dimen-sion Compressed Imaging Optical Fibers
b) Compact des ign , l i gh t weight, portability permit at site measurements
c) Both Macro and Micro sam-pling Optics are available
d) Imaging analysis software with Chemometrix function is available
Fig. 2 Concept of the new Raman imaging spectrom-eter using dimension-compressed imaging op-tical fibers and a dispersive polychromator
20

ContactPerson in charge:Hisamitsu HigashiyamaAffiliation:S. T. Japan Inc.E-mail:[email protected]
Material Science
Publications1) Akira Sakamoto, Shukichi Ochiai, Hisamitsu Higashiyama, Koji Masutani, Jun-ichi Kimura, Emi Koseto-Horyu. Mitsuo Tasumi. “Raman Studies of Japanese Art Objects by a Portable Raman Spectrometer Using Liquid
Crystal Tunable Filters”, published online on October 27, 2011 (DOI 10.1002/jrs.3080).
Technical PerformanceGeneral Specification
Single Areaa Measurement Wide Areaa Measurement
Spectroscopic Principle Dimension Compressed Imaging Optical Fibers + Transmission Dispersive Polychromator
Data acquisition Simultaneous multi point measurement with no moving part.
Spectral Range 2500~200cm-1 (785nm Excitation Laser)
Spectral resolution 4cm-1
Imaging area 2 × 2mm (16 × 16 points) 6 × 20mm (48 × 160points)
Spacial Resolution 125μm (Standard Macro Lens)、10μm (Optional Micro Lens)
Working distance 50mm (Standard Macro Lens)
Technical Overview
Example of Results and Analyses Ukiyo-e and its wood-blockThe Ukiyo-e “Eiyu 5nin Otoko YOSHIOKA KENBO” Drown by Utagawa ShiroshigeMeasurements on the Geee part of an ukiyo-e “Yoshioka Kenbo” and its woodblock. The Raman spectra obtained from the sample area marked by red squares in pictures.
Cont.It was recognized in this study that the green of YOSHIOKA KENBO (Uki-yo-e and woodblock) is drown using mixing Or-piment (Yellow) and Prussian blue.
* UCL Chemistry - Chem-istry Resources -Raman Spectroscopic Library
http://www.chem.ucl.ac.uk/resources/ra man/index.html
21

Ultra Fast Magic Angle Spinning Module in the Solid State NMR with a Rotor of 1mm Diameter
Participating organizationJEOL RESONANCE Inc., Tokyo University of Agriculture and Technology
Apparatus nameUltra fast magic angle spinning probe
Keywords Solid-state NMR, Nano volume analysis, Ultra fast magic-angle-spinning
A ultra tiny magic-angle-sample spinning (MAS) system in solid-state NMR has been developed. The diameter of the sample tube is only 1 mm, which enables a very fast MAS rate of 80 kHz, very strong rf field irradiation and nano volume sample analysis of less than 800 nL. The 1H high resolution NMR spectrum can be obtained from only ultra fast MAS, giving the intra- and inter-molecular structural information from the 1H NMR spectra easily. And highly sensitive 1H-14N two dimensional (2D) correlation NMR spectra of peptide and inorganic material analysis of volume limited samples have been reported.
Abstract
Katsuya HiokaJEOL RESONANCE Inc.
Team Leader
Material Science
Tetsuro AsakuraTokyo University of Agriculture and Technology
Sub Leader
USSS
ResultNo.10
Fig. 1 27Al MAS NMR spectra of LED phosphors before (green), af-ter (blue) degradation and non-Ce ion doped YAG (red).
Fig. 2 1H-14N 2D correlation HMQC spectrum of gly-cyl-L-alanine at 70 kHz MAS
22

ContactPerson in charge:Yusuke NishiyamaAffiliation:JEOL RESONANCE Inc.E-mail:[email protected]
Material Science
Publications1) Koji Yazawa, Furitsu Suzuki, Yusuke Nishiyama, Takuya Ohhata, Akihiro Aoki, Katsuyuki Nishimura, Hirono-
ri Kaji, Tadashi Shimizu and Tetsuo Asakura, “Determination of accurate 1H positions of an alanine tripep-tide with anti-parallel and parallel β-sheet structures by high resolution 1H solid state NMR and GIPAW chemical shift calculation”, Chem. Commun., 48, 11199-11201. 2012
2) Yusuke Nishiyama, Yuki Endo, Takahiro Nemoto, Hiroaki Utsumi, Kazuo Yamauchi, Katsuya Hioka, Tetsuo Asakura, “Very fast magic angle spinning 1H-14N 2D solid-state NMR: Sub-micro-liter sample data collection in a few minutes”, J. Magn. Reson., 208, 44-48. 2011
3) Riko MIYOSHI, Yuko MIWA, Masanobu YOSHIKAWA, Katsuya HIOKA, and Tetsuo ASAKURA, Phosphor Re-search Society of Japan The 388th Meeting Technical Digest (June 3, 2011) 13
Technical PerformanceSpecifications Sample tube outer diameter: 1 mm Main observation nuclei: 1H, 31P, 7Li, 11B, 23Na, 27Al, 13C, 79Br, 207Pb, 29Si, 6Li, 15N, 14N Irradiation nucleus: 1H Maximum RF intensity 1H: 360 kHz 90° pulse width 1H: 0.7 µs 1.0 µs 13C: 0.7 µs 1.0 µs Sensitivity: ( 19 Unlabeled Gly 13C-α, 32 scans, reference value)
Technical Overview A ultra tiny magic-angle-sample spinning (MAS) system in sol-id-state NMR has been developed. The diameter of the sample tube is only 1 mm, which enables a very fast MAS rate of 80 kHz, very strong rf field irradiation and nano volume sample analysis of less than 800 nL. Figure 1 shows a typical application of its high sensitivity per unit volume. The 1 mm MAS system is applied to investigate the degradation of a very small amount of phosphors (Ce-doped YAG) in phosphor-based white LEDs. Although the sam-ple weight of the phosphors taken from a few LEDs is only 1 mg, 27Al MAS NMR spectra of Ce-doped and non-doped YAG has successfully revealed the change of valence state of Ce ions in the degraded LED phosphors. This example illustrates its promising ability to characterize other tiny materials in elec-
tronic devices. The 1H high resolution NMR spectrum can be obtained from only ultra fast MAS, giving structural information from the 1H NMR spectra easily. This was applied to determine the struc-tures of peptide and proteins. The 1H-14N 2D correlation measurement is a novel application of combining ultra fast MAS and strong rf field as shown in Fig-ure 2. The spectrum is obtained within a few minutes despite of very small sample volume of 800 nL. This opens a new way to high throughput analysis of 14N nuclei.Thus, ultra tiny and ultra fast magic-angle- sample spinning (MAS) system developed here promise to expand new applica-tion of solid state NMR.
23

Material Science
Technology development of innovativeviscoelasticity measurement system
Participating organizationKyoto Electronics Manufacturing Co., Ltd., University of Tokyo
Apparatus nameQuadrupole Electro-Magnetically Spinning Rheometer
Keywords Viscoelasticity measurement, Quadrupole electromagnet,Electro-Magnetically Spinning method, Rheometer
Viscoelasticity measurement technology has made less progress in recent years. Commercially available viscometers with conventional methods still require complicated and skillful operations, such as adjustment and washing. In addition, the sample should necessarily be exposed to the open air. To settle these problems, we have developed a novel measurement system based on the Electro-Magnetically Spinning (EMS) technique. This system has unique features: It is quite easy to use, requires very small amount of sample, and keeps hermetically sealed condition. In addition, sample tubes are disposable, and it is possible to measure over wide viscosity range. The EMS system extends the variety of the rheology measurements to, for example, the medical and biological fields.
Abstract
Shinsuke Ishihara Kyoto Electronics Manufacturing Co., Ltd.
Team Leader
Keiji SakaiUniversity of Tokyo
Sub Leader
Tvv
ResultNo.11
Fig. 1 Photograph of QEMS.
Fig. 2 Time-series variation of rotational speed of sphere in warm like micellar solution after induction of electromagnetic torque with a constant value.
24

ContactPerson in charge:Masanori YasudaAffiliation:Kyoto Electronics Manufacturing Co., Ltd.E-mail:[email protected]
Material Science
Publications1) Keiji Sakai, et al ,“Electromagnetically Spinning Sphere Viscometer”, Appl. Phys. Express, 3, 016602 1-3, 2010
2) Maiko Hosoda, et al ,“Low-Viscosity Measurement by Capillary Electromagnetically Spinning Technique”, Japanese Journal of Applied Physics, 50, 07HB03 1-3. 2011
3) Taichi Hirano, et al ,“Spontaneous Ordering of Spherical Particles by Electromagnetically Spinning Method”, Appl. Phys. Express, 5, 027301 1-3. 2012
Technical PerformanceThe advantages of QEMS over conventional measurement systems are shown in Talble.1.Table 1. Comparison with QEMS and the conventional method
Method QEMS Conventional MethodsSample volume 0.3 ml More than 30 ml
Sample cell Possible to be sealed Difficult to prevent exposure the air
Operation Easy and quick Troublesome adjustment and preparation
Moving part NOHigh reliability and high MTBF
YESlow MTBF and need preven-
tive maintenance
Cleaning Not required(could be disposable) Required
Technical Overview The Electro-Magnetically Spinning method for the viscosity measurement was devised by Prof. Sakai of the University of Tokyo. The principle of the measurement is as follows; The sample is placed into a small sample tube together with a met-al sphere. A rotating magnetic field is then applied to the sphere and the Lorentz interaction between the magnetic field and the current induced in the sphere generates torque that ro-tates the sphere in a non-contact manner. By measuring the ro-tational speed of the sphere relative to that of the external magnetic field, we can determine the viscosity of the sample. We have remarkably improved the technology by introducing the Quadrupole Electro-Magnetically Spinning (QEMS) tech-nique to the system.
The QEMS generates computer-controlled arbitrary magnetic field with electromagnets. Figure 1 shows an external view of the QEMS prototype. The QEMS creates a measuring system that is totally free of moving parts for enhanced reliability. Since the QEMS allows control over the magnitude and direc-tion of the magnetic field, it enables rapid and precise measure-ments of viscoelasticity spectrum. Figure 2 shows the dynamic response of the probe sphere against the applied torque in a step function measured for the surfactant solution. The behavior is well described by a mechanical model of the viscoelastic relaxation shown in Figure 3. The QEMS system would be a powerful tool for the variety of rheology measure-ments including medical and biological fields.
Fig. 3 Schematic image of a mass-spring-damper model.
25

Material Science
Development of an Real-Time Stereo SEM
Participating organizationHitachi High-Technologies Corporation, Niigata University, Shizuoka University, EIZO Corporation
Apparatus nameReal-time Stereo SEM(Hitachi SU3500)
Keywords 3D, SEM, Real-Time, Naked Eye
Scanning Electron Microscope (SEM, hereinafter) is useful for observing the specimen surface three-dimensionally. However, stereoscopic (3D) information has not been utilized effectively because simple SEM images contain monocular information. 3D observation with a SEM usually requires obtaining a stereo-pair image by tilting mechanically the specimen stage, combining the two views, and finally viewing them with a 3D glass (e.g., red-cyan glass). These 3D images cannot be observed in real time because of the mechanical tilt of samples. To overcome this problem, we developed a Real-Time Stereo SEM which allows observing 3D images in real time. In this project, we developed novel techniques including tilted-beam control technology, 3D display technology and off-axis aberration reduction technology for 3D SEM imaging.
Abstract
Sukehiro Ito Hitachi High-Technologies Corporation
Team Leader
Tatsuo UshikiNiigata University
Sub Leader
DDResultNo.12
Fig. 1 Principle of b e a m t i l t and control technology
Fig. 2 R e du c t i o n technology of the off-axis aberration
26

ContactPerson in charge:Hideki TsuboiAffiliation:Marketing Dept.2, Science Systems Sales & Marketing Div., Science & Medical Systems Business Group, Hitachi High-Technologies CorporationE-mail:[email protected]
Material Science
Publications1) Akinori Hayashi, Akira Sakai, Tomohiro Kometani, Hiroshi Ito : Cross-talk Caused by Light Reflected on a
Back-face of a LCD glass in Auto-stereoscopic Display with Field-sequential Method and Directional Back-light System: SID Display Week 2011/5/15-20 Digest P-2, pp.1098-1011
2) F. Iwata, Y. Mizuguchi, H. Ko, T. Ushiki : Nanomanipulation of biological samples using a compact atomic force microscope under scanning electron microscope observation: Journal of Electron Microscopy, 60(6) (2011) 359‒36
Technical Performance Fig. 3 shows the relation between beam tilt angle and resolution. The full line indicates the effect after aberration reduction, and the dotted line shows the value of aberration and resolution before aberration reduction. Comatic aberration and chromatic field aberration shown in Fig. 3 cause low resolution at beam tilting. The aberration reduction optical system is designed as resolution is 15 nm when the beam tilt an-gle is 3.0 degrees, and observation magnification is 20,000 times. Fig. 4 is the image where the beam tilt angle is about 3.0 degrees and observation magnification is about 20,000 times. The aberration reduction is successfully confirmed as shown in Fig. 4 (after). This development contributes to the practical use of real-time stereo observation function as an option of Model SU3500 made by Hitachi High-Technologies Corporation, which was already re-leased in 2012. The appearance to illustrate a combination of Model SU3500 SEM and FDF2301-3D are shown in Fig. 5.
Technical Overview1.Tilted beam control technology(Fig. 1) To observe 3D images in real time, we have succeeded in getting a stereo-pair of SEM images by tilting electron beam. In this technique, the beam can be controlled from right to left by lines or frames with the specific tilt coil.
2.3D display technology A newly developed data-conversion software enabled the ste-reo-pair images to be outputted for commercial 3D monitor. On the other hand, conventional 3D viewing techniques using glasses (e.g., deflection or anaglyph methods) are unsuitable for the long operation because these methods cause brightness decrease. Though some other methods such as the parallax barrier method and the lenticular method do not need glasses, these methods cause resolution decrease, moiré and pseudoscopic images. Thus, we developed the novel stereoscopic image display device
which can execute real-time 3D observation with high quality by the naked eyes. For this purpose, we adopted directional backlight with an elliptical mirror, achieving space saving with the appearance of 262mm long. This device has been released as FDF2301-3D since fiscal 2011.
3.Reduction technology of the off-axis aberration(Fig. 2) To acquire parallax images by electron beam tilt, the Real-Time Stereo SEM should prevent the beam from going through the axis of objective lens so that off-axis aberration and low-resolution oc-cur. Therefore, off-axis aberration reduction lens is added to the side of the electron source seen from the objective lens. Aberration reduction at the objective lens, by making use of ab-erration at the off-axis aberration reduction lens, executes 3D ob-servation at high magnification.
Fig. 3 Relation between beam tilt angle and resolution
Fig. 4 Effect of the aberration reduction Fig. 5 Real-time Stereo SEM Setup
27

Material Science
Atomic Resolution Scanning Probe Microscope Working in Air/Liquid
Participating organizationSHIMADZU Corporation, Kyoto University, Osaka University, Kobe University, Japan Advanced Institute of Science and Technology (JAIST), Kanazawa University
Apparatus nameHigh Resolution Scanning Probe Microscope, SPM-8000FM
Keywords SPM, AFM, FM detection, Atomic or molecular scale
We developed the high resolution microscope that can be evaluated the structural and functional properties of metal, semiconductor, insulator and organic material at the atomic and molecular scale operating in air or liquid. Scanning probe microscopy (SPM) is a high resolution imaging technique applied for a variety of samples. In ultrahigh vacuum, by detecting the change of the resonant frequency of the cantilever (Frequency modulation method: FM method), it is possible to observe the structure of the atomic or molecular scale. However, there was a lack of stability and resolution in air or liquid. The purpose of this project is to establish a high-resolution observation technology by FM-AFM in air-liquid.
Abstract
Ryohei Kokawa SHIMADZU Corporation
Team Leader
Hirofumi YamadaKyoto University
Sub Leader
AWW
ResultNo.13
Fig. 1 SPM-8000FM
28

ContactPerson in charge:Ryohei KokawaAffiliation:SHIMADZU CorporationE-mail:[email protected]
Material Science
Publications1) Ryohei Kokawa, Masahiro Ohta, Akira Sasahara, Hiroshi Onishi, Kelvin Probe Force Microscopy Study of a
Pt/TiO2 Catalyst Model Placed in an Atmospheric Pressure of N2 Environment, Chemistry-An Asian Journal, 7, 1251-1255 (2012).
2) Kei Kobayashi, Noriaki Oyabu, Kenjiro Kimura, Shinichiro Ido, Kazuhiro Suzuki, Takashi Imai, Katsunori Tag-ami, Masaru Tsukada and Hirofumi Yamada, Visualization of hydration layers on muscovite mica in aque-ous solution by frequency-modulation atomic force microscopy, Journal of Chemical Physics, 138, 184704 (2013).
3) Takumi Hiasa, Kenjiro Kimura, Hiroshi Onishi, Masahiro Ohta, Kazuyuki Watanabe, Ryohei Kokawa, Noriaki Oyabu, Kei Kobayashi, Hirofumi Yamada, Aqueous Solution Structure over α-Al2O3 (0112) Probed by Fre-quency-Modulation Atomic Force Microscopy, J. Phys. Chem. C, 2010, 114 (49), pp 21423-21426.
Technical PerformanceThe noise level of the optical beam deflection sensor: 20fm/√HzThe sensitivity of FM detection method: 0.01Hz/√HzThermal drift: 1nm/min
Technical Overview1. Capable of Ultra-High Resolution Observations in Air and in Liquids
By heightening the efficiency of the optical condenser system that detects the cantilever vibrations, and developing laser light non-interference techniques, the noise in the optical beam deflec-tion system that detects cantilever displacement has been signifi-cantly reduced, to about 1/20th of conventional levels. As a re-sult, this instrument provides ultra-high resolution observations in air and in liquids, which has been difficult for conventional SPMs. Examples include the molecular structure of thin films of lead phthalocyanine crystals in air, and the atomic structure of sodium chloride (NaCl) in water. Since this instrument can evaluate the re-actions and functionality of organic molecules, which demonstrate specific reactions in solution, it will also be useful in the develop-ment of organic devices. The SPM-8000FM is an HR-SPM that for the first time transcends the ultra-high vacuum limitation.
2. Provides Not Only Surface Observations But Also Measurements of the Localized 3D Structure of Solid-Liquid Interfaces
Solid-liquid interfaces are known to be structured into com-
plicated layers by interactions between the solutes and water (the solvent). This is referred to as hydration/solvation. Hydra-tion/solvation is known to have a significant impact on chemi-cal reactions at the solid-liquid interface, as well as charge transfer, lubrication, and heat conduction. However, since the layers are extremely thin, they are not easily measured. In par-ticular, observations of hydration/solvation, with its 3 dimen-sional structure, non-uniform horizontally with respect to the surface, have been impossible to date. With the SPM-8000FM, it is now possible to measure local-ized hydration/solvation structures, thank to ultra-sensitive force detection. The liquid structure at solid-liquid interfaces can be observed by operating the probe at the interface, and taking accurate measurements of the force as a function of the probe position. Furthermore, by adopting a new scanning meth-od, not only 2D but also 3D structures can be analyzed for the first time. With behavioral observations in liquids of biological interfaces, surfactants, polymers, and electrodes, application of this instrument will extend not only to surface observations, but also to structural measurements of solid-liquid interfaces.
Fig. 2 High Resolution Topography in Air Fig. 3 Molecular Resolution Obser-vation in Liquid
Fig. 4 Water Structure at Interfaces
29

Development of AFM Tip Characterizers and Evaluating the Tip Shape
Participating organizationNTT Advanced Technology Corporation, National Institute of Advanced Industrial Science and Technology(AIST), Olympus Corporation, Daiken chemical Co. Ltd., National Institute of Materi-als Science (NIMS), Tokyo University of Science
Apparatus nameAFM tip characterizer and the software to reconstruct the AFM image
Keywords Atomic force microscopy, Tip, Cantilever, Probe characterizer and CD measurement
Atomic force microscopy (AFM) images are strongly affected by the shape of the AFM probe used for imaging. In this project, we aimed for establishing a technology to fabricate an AFM tip characterizer also to evaluate the tip shape. We established a process to deposit multilayer and succeed in fabricating tip characterizers which have multiple trench patterns with from 5 to 100 nm and a narrow ridge with 1.5-nm curvature. Using the tip characterizer, AFM users can evaluate the tip shape. Besides that, we developed an algorithm to correct the AFM image. These results are contributing to an international standardization for AFM.
Abstract
Hisataka TakenakaNTT advanced technology Corporation
Team Leader
Material Science
Hiroshi ItoNational Institute of Advanced Industrial Science and Technology (AIST)
Sub Leader
DEE
ResultNo.14
Fig. 1 Cross sectional TEM image of a tip characterizer(a) Outlook of the proto type, (b) Designed value, (c) Measured value using TEM image(d) TEM image of a 40 nm-width ridge and the 15 nm-width ridge.
30

ContactPerson in charge:Akio TakanoAffiliation:NTT-AT CorporationE-mail:[email protected]
Material Science
Publications1) C. Wang et al., “Characterizing Atomic Force Microscopy Tip Shape in Use”, J. Nanosci. Nanotechnol. , 9, No. 2, 803-808, (2009).
2) S. Ichimura et al., “Current standardization activities for the measurement and characterization of nanoma-terials and structures”, J. Phys. Conf. Series 159, 012001, (2009).
3) H. Takenaka et al., “Development of Si/SiO2 Multilayer Type AFM Tip Characterizers”, J. Surf. Anal. 17, 264, (2011).
Technical Performance The developed depositing process can make a 5-nm-width-narrow ridge structure and 3-nm-width trench structure. The developed tip characterizer contains 15-nm-width ridge structure, multiple-trenches with 10 nm to 50 nm and 25-nm-pitch scale, also being practically mass-pro-ducible. The corner radius of the ridge pattern is less than 2 nm, typically 1.5 nm, the angle of inclination is less than 0.5°. Using the tip characterizer, AFM users can evaluate their tip shape within an errorrange of 1~2 nm.
Technical Overview AFM is a powerful tool to measure the shape of nanometric structures. However, AFM images are strongly affected by the shape of the AFM probe used for imaging. So AFM users need to know the shape of AFM probe tip to measure nanostruc-tures. Therefore, we developed the tip characterizers to evalu-ate the probe tip shape. The developed characterizers have a narrow-ridge structure, multiple-trench structure and a grating scale. Besides that, we developed the procedure to reduce the effect of the tip shape for the AFM image as well as a software to reconstruct the AFM image using the determined tip shape. We also developed a detection method for the phase change, and then succeeded in tracing the true shape. Figure 2 shows an example to measure the diameter of a multi-wall car-bon-nano tube (MW-CNT) after the AFM tip had been evaluat-
ed using the tip characterizer. The widen AFM image of MW-CNT was corrected with the tip shape, and then we could measure the diameter of MW-CNT within an error of 1 nm. Us-ing the tip characterizer, we can evaluate not only the tip shape by measuring the 15-nm-narrow ridge structure, but also the detection limit by measuring the multiple-trench depth. In figure 2(b), the probe shape characteristics are drawn using the effec-tive probe shape characteristic method combined with the measured data of the multiple-trench structure. In order to measure the tip diameter in detail, we made a CNT type char-acterizer whose CNT is bridged on the multiple-trench struc-tures. Using the CNT type characterizer, the tip shape is mea-sured easily.
Fig. 2 (a) AFM image and line profile of the characterizer.(b) Probe shape characteristic from the effective probe shape.(c) Example to measure a diameter of a multi-wall carbon nano-tube after the AFM probe shape was evaluated.
31

Portable Total Reflection X-Ray Fluorescence Elemental Analyzer
Participating organizationKyoto University
Apparatus nameOURSTEX 200TX (Ourstex Co., Ltd., Neyagawa, Japan)
Keywords Analytical chemistry, Trace elemental analysis
In X-ray fluorescence (XRF) analysis, trace elemental analysis was usually performed using a stationary X-ray analyzer with a high power X-ray source. Measurements at synchrotron radiation facility made it possible to detect elements in the fg range (1 fg = 10-15g). On the other hand, we have developed a light weight (less than 6 kg) portable total reflection X-ray fluorescence (TXRF) elemental analyzer with a several watts X-ray tube. Although a low power X-rays tube is used, elements in the pg range can be detected.
Abstract
Jun Kawai Kyoto University
Team Leader
Environmental Science
PEE
ResultNo.15
Fig. 1 Portable total reflection X-ray fluorescence ele-mental analyzer.
32

ContactPerson in charge: Shinsuke Kunimura, Jun KawaiAffiliation:Tokyo University of Science (SK), Kyoto University (JK)E-mail: [email protected] (SK), [email protected] (JK)
Environmental Science
Publications1) S. Kunimura and J. Kawai, Polychromatic Excitation Improves Detection Limits in Total Reflection X-Ray Flu-orescence Analysis Compared with Monochromatic Excitation, Analyst, 135, 1909-1911, 2010.
2) S. Kunimura, D. P. Tee, J. Kawai, Analysis of Nanograms of Cadmium Using a Portable Total Reflection X-Ray Fluorescence Spectrometer, Tetsu-to-Hagané, 97, 81-84, 2011.
3) S. Kunimura and J. Kawai, Application of a Portable TXRF Spectrometer to Determine Trace Amounts of Toxic Elements, Advances in X-Ray Analysis, 53, 180-186, 2010.
4) S. Kumnimura and J.Kawai, The Japan Society for Analytical Chemistry Award for Advanced Analytical Technology (JAIMA Award), 2014.
Technical PerformanceThe portable TXRF elemental analyzer is used for analysis of elements with an atomic number greater than 14 (Si). Detection limits of representative elements are shown in Table 1.
Table 1. Detection limits of representative elements.Cr As Y Cs Cd Pb
Detection limit (ng) 0.005 0.035 0.06 0.3 1 0.15Measurement time (s) 1800 1800 1800 600 1800 1800Anode material of X-ray tube W W W W W WTube voltage (kV) 25 25 25 25 40 25Tube current (µA) 200 200 200 200 200 200
Technical Overview The portable TXRF elemental analyzer mainly consists of a naturally air-cooled X-ray tube, a semiconductor X-ray detector, an X-ray waveguide as a collimator, and an X-ray reflector as a sample holder. This portable analyzer is less than 6 kg, and it is possible to carry by hand. An X-ray tube is usually operated at 25 kV and 200 µA (5 W), and detection limits down to 5 pg have been achieved by 5 W X-ray tube. Analysis of ppb (µg/L) concentrations of elements in water solution samples can be performed by using the present porta-ble analyzer, and the total volume of a sample solution needed for a measurement is typically 10 µL. For example, trace ele-mental analysis of river water, commercial bottled drinking wa-ter, wines, a leaching solution of soil, a leaching solution of toy,
and a leaching solution of metallic material were performed without pre-treatment. Using sample preparation techniques leads to improvement in detection limits. Microwave decom-positions for blood analysis, solid-phase extraction for seawater analysis, and a combination of acid decomposition of steel and separation of iron for steel analysis were performed, and a few nanograms of elements were detected after using these sample preparation techniques. Powder samples can be analyzed with the present portable analyzer after preparing suspensions. The present portable analyzer can be used for monitoring environ-mental pollution, safety evaluation of foods and toys, and man-ufacturing process control of metallic materials.
Fig. 2 Total reflection X-ray fluorescence spectrum of a leaching solution of soil. To prepare this leaching solution, the soil sample was immersed into 1 M HCl.
33

Automated Asbestos Counting System Based on Bio-fluorescence Method
Participating organizationHiroshima University, INTEC Inc., Siliconbio inc.
Apparatus nameAutomated asbestos detection and counting system
Keywords Asbestos, Bioimaging, Fluorescence microscope, Image analysis
Using a protein that can specifically bind to asbestos, we previously developed an easy and highly sensitive bio-fluorescence method to detect asbestos fibers under fluorescence microscopy (JST Development of Systems and Technologies for Advanced Measurement and Analysis, 2007-2010). However, analysts still need to follow complex rules when identifying and counting asbestos fibers, making asbestos analysis a complicated and time-consuming task. Asbestos fibers on the sampling filter membrane may cross or get entangled with each other, adopt a twisted shape, and overlap with non-fibrous dust particles, leading to large variability in the resulting asbestos counts among different analysts. To address this problem, we have developed automated asbestos detection and counting system that would enable anyone, and not just experienced analysts, to reliably identify and count asbestos fibers.
Abstract
Akio KurodaHiroshima University
Team Leader
Environmental Science
ABB
ResultNo.16
Fig. 1 Bio-fluorescent asbestos testing kit (A) and asbestos detection and counting system (B)
Fig. 2 Fluorescent image of asbestos obtained by bio-fluorescent asbestos testing kit
34

ContactPerson in charge:Prof. Akio KurodaAffiliation:Department of Molecular Biotechnology, Graduate School of Advanced Sciences of Matter, Hiroshima UniversityE-mail:[email protected]
Environmental Science
Publications1) T. Ishida, A. Kuroda et al , Selective detection of airborne asbestos fibers using protein-based fluorescent
probes, Environ Sci Technol. , 44 (2), 755-9, 2010.2) T. Ishida, A. Kuroda et al , Evaluation of Sensitivity of Fluorescence-based Asbestos Detection by Correla-
tive Microscopy, J. Fluorescence, 22, 357-363, 2012
Technical Performance The developed system automatically detects and counts asbestos fibers according to the “Asbestos counting rules.” The system is capable of detecting asbestos fibers with diameter above 30 nm. Asbestos testing using the system takes only one hour, including the time neces-sary for sample preparation, examination of the filter under fluorescent microscope, image ac-quisition, and automated fiber counting by the software. Portable fluorescence microscope can be used to acquire images, making it possible to conduct on-site analysis. Automated fiber counts generally fall within 10% of average fiber counts by experienced analysts.
Technical Overview The amount of asbestos-containing construction materials in Japan has been estimated at 40 million tonnes. During demoli-tion of the old buildings, which is expected to peak in the near future, it is necessary to check whether any asbestos fibers are released into the environment. We previously developed a nov-el bio-fluorescence method that solved the problems of the conventional methods, such as insufficient rapidity and selectivi-ty, presenting a unique opportunity to greatly simplify on-site asbestos testing (figure 1 and 2). However, asbestos analysis still remains a complicated and time-consuming task, as analysts need to follow complex rules when identifying and counting asbestos fibers on up to 100 fields of view per each sample. Therefore, we developed a soft-ware algorithm for counting such fibers according to the official-
ly-endorsed “Asbestos counting rules”. The software can auto-matically correct for the differences in fluorescent background and fiber brightness, which arise due to diverse sampling and imaging conditions. Since some non-fibrous particles are natu-rally fluorescent, we also developed a method for selective im-age correction (removing particle image areas) followed by lo-calized background adjustment, leading to more accurate fiber identification. The use of software greatly simplified asbestos analysis, and the test results were well correlated with the re-sults of the conventional asbestos testing method, confirming the effectiveness of the developed software for rapid asbestos testing (figure 3). This automated asbestos-counting system en-abled even non-experienced analysts to perform reliable and rapid on-site detection or inspections for airborne asbestos.
Fig. 3 Automated asbestos detection and counting software screenshot
35
Lidar System for Simultaneous Measurements of CO2 Density, Wind and Temperature Profiles
Participating organizationTokyo Metropolitan University, EIKO Instruments Corporation
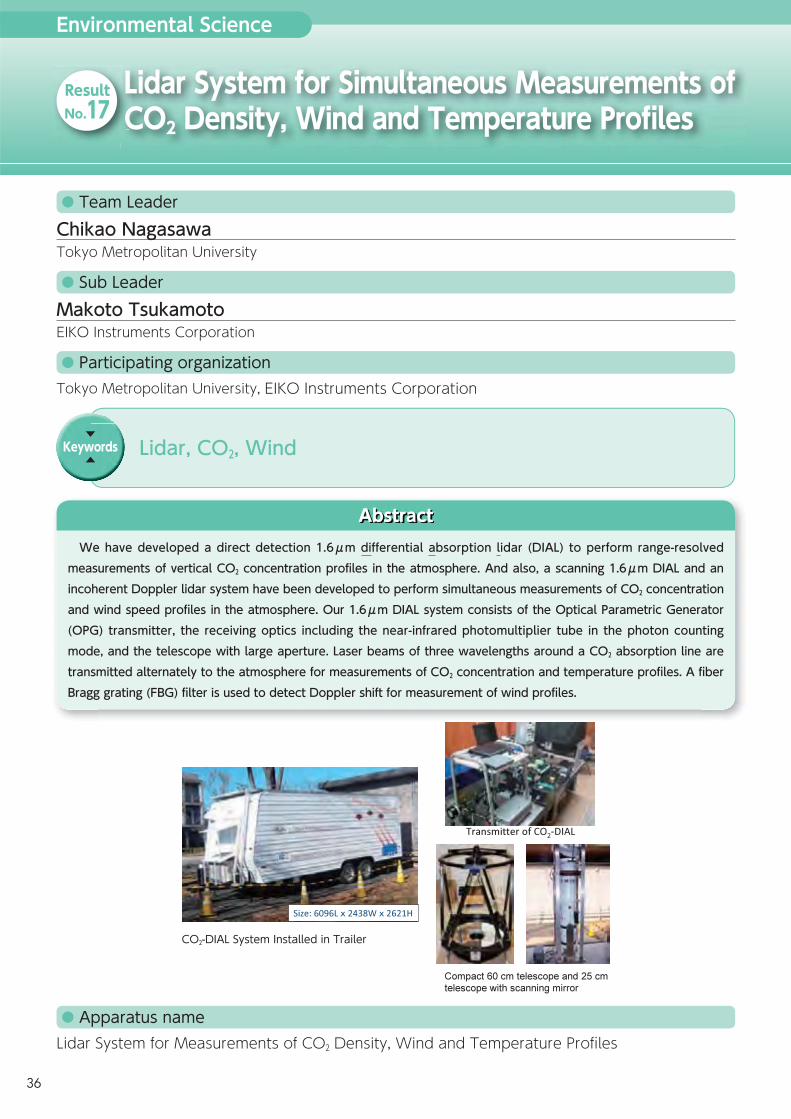
Apparatus nameLidar System for Measurements of CO2 Density, Wind and Temperature Profiles
Keywords Lidar, CO2, Wind
We have developed a direct detection 1.6μm differential absorption lidar (DIAL) to perform range-resolved measurements of vertical CO2 concentration profiles in the atmosphere. And also, a scanning 1.6μm DIAL and an incoherent Doppler lidar system have been developed to perform simultaneous measurements of CO2 concentration and wind speed profiles in the atmosphere. Our 1.6μm DIAL system consists of the Optical Parametric Generator (OPG) transmitter, the receiving optics including the near-infrared photomultiplier tube in the photon counting mode, and the telescope with large aperture. Laser beams of three wavelengths around a CO2 absorption line are transmitted alternately to the atmosphere for measurements of CO2 concentration and temperature profiles. A fiber Bragg grating (FBG) filter is used to detect Doppler shift for measurement of wind profiles.
Abstract
Chikao NagasawaTokyo Metropolitan University
Team Leader
Environmental Science
Makoto TsukamotoEIKO Instruments Corporation
Sub Leader
LCC
ResultNo.17
CO2-DIAL System Installed in Trailer
36

ContactPerson in charge:Chikao NagasawaAffiliation:Tokyo Metropolitan UniversityE-mail:[email protected]
Environmental Science
Publications1) D. Sakaiazawa et al., Development of a 1.6μm differential absorption lidar with a quasi-phase-matching optical parametric oscillator and photon-counting detector for the vertical CO2 profile, Applied Optics, 48, 748-757, 2009.
2) C. Nagasawa et al., Direct detection 1.6μm DIAL for measurements of CO2 concentration profiles in the troposphere, Proc. SPIE 8182, 81820G, 2011.
Technical Performance The vertical CO2 concentration profiles from ground to an altitude of 10km can be obtained with 200m (at the lower altitude range) and 500m (at the upper altitude range) altitude resolu-tions by integration time of 30 minutes within 1% standard deviation. Moreover, this CO2 DIAL system can be used as the scanning lidar in the atmospheric boundary layer. We can obtain vertical wind vector profiles up to 5 km altitude with 1km altitude resolution by measuring line-of-sight wind profiles at two azimuth angles with a fixed elevation angle.
Technical Overview The accurate vertical CO2 profiles in the troposphere are in-creasingly required to improve quantification of the global CO2 budget and also to understand global climate changes. In com-parison with the ground-based monitoring network, CO2 mea-surements for vertical profiles in the troposphere have been conducted by dirigible airplanes and commercial airlines so as spatial and temporal coverage are limited. Horizontal CO2 distri-bution and wind profiles are important information to under-stand the regional sink of CO2 and its source. The differential absorption lidar (DIAL) and the renge resolved Doppler lidar are expected to bring several advantages over passive mea-surements. Our 1.6 µm DIAL system consists of the Optical Parametric Generator (OPG) transmitter excited by the LD pumped Nd:YAG laser with high repetition rate. It also consists of the
receiving optics with a near-infrared photomultiplier tube of high quantum efficiency in the photon counting mode. This sys-tem also includes a telescope with larger aperture than that of the coherent detection method. Laser beams of three wave-lengths around a CO2 absorption line are transmitted alternate-ly to the atmosphere for measurements of CO2 concentration and temperature profiles. Moreover, retrieval algorithms of CO2-DIAL are also performed to improve measurement accura-cy. The scanning 1.6 µm DIAL and the incoherent Doppler lidar system can perform simultaneous measurements of CO2 con-centration and wind speed profiles in the atmosphere. Laser beam is transmitted coaxially, and then a motorized scanning mirror system scans the laser beam and field of view 0-360deg horizontally and 0-52deg vertically.
37

High Accuracy and High Stability pH Combination Electrode Equipped with Ionic Liquid Salt Bridge
Participating organizationHORIBA Ltd., Kyoto University, Akita University, Nihon-HELS Co. Ltd.
Apparatus namepH combination electrode equipped with liquid salt bridge. “PUREIL”
Keywords pH sensors, Ionic liquid, Salt bridge, Dilute aqueous solutions, Environmental analysis, Pharmaceutical research
Conventional pH electrodes have intrinsic problems such as the unstable electrode response in dilute solutions and the contamination of the sample due to the leakage of concentrated KCl. These problems originate from the working principle of the salt bridge (SB) used in the reference electrode, which relies on the diffusion of concentrated KCl. In this project, a new type of SB based on the distribution of ions constituting an ionic liquid (IL) into water was improved so that it can be applied to the reference electrode for accurate pH measurement. The new type of pH electrode equipped with new type of SB has enabled us to determine more accurate pH of low ionic strength sample solutions than conventional pH electrode.
Abstract
Satoshi NomuraHORIBA Ltd.
Team Leader
Environmental Science
Takashi KakiuchiKyoto University
Sub Leader
HEE
ResultNo.18
Fig. 1 pH combination electrode equipped with ILSB, “PUREIL”
38
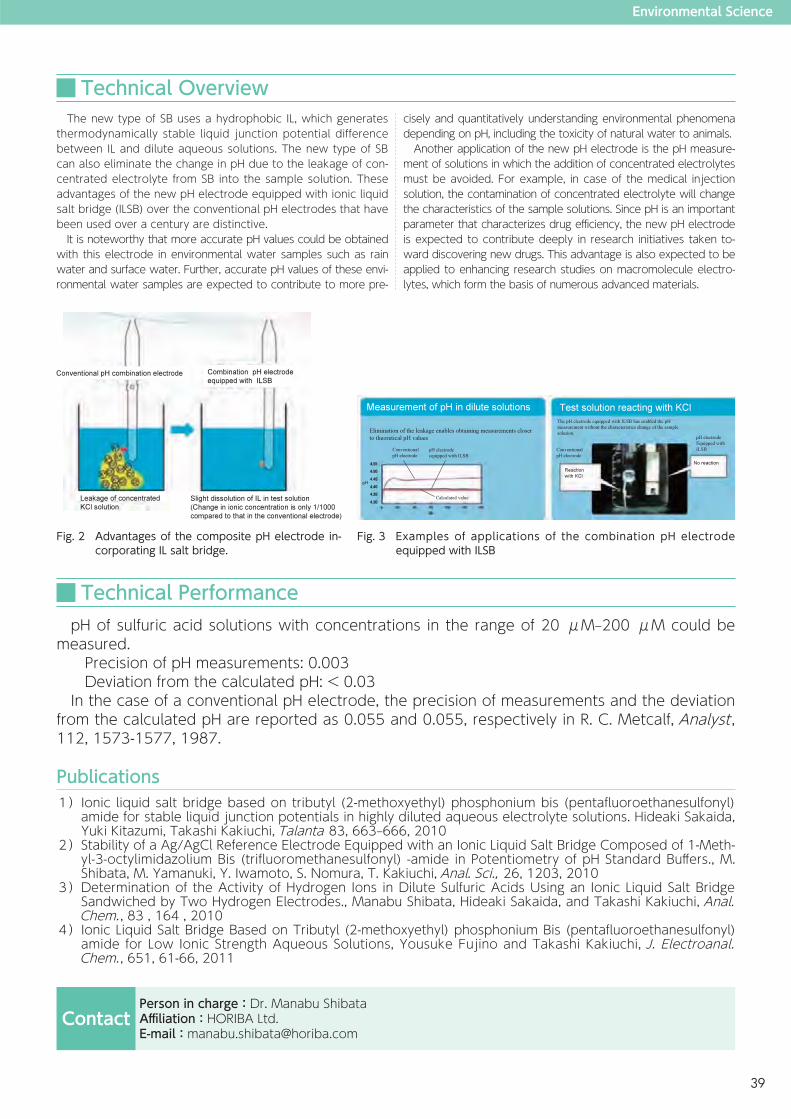
ContactPerson in charge:Dr. Manabu ShibataAffiliation:HORIBA Ltd.E-mail:[email protected]
Environmental Science
Publications1) Ionic liquid salt bridge based on tributyl (2-methoxyethyl) phosphonium bis (pentafluoroethanesulfonyl)
amide for stable liquid junction potentials in highly diluted aqueous electrolyte solutions. Hideaki Sakaida, Yuki Kitazumi, Takashi Kakiuchi, Talanta 83, 663‒666, 2010
2) Stability of a Ag/AgCl Reference Electrode Equipped with an Ionic Liquid Salt Bridge Composed of 1-Meth-yl-3-octylimidazolium Bis (trifluoromethanesulfonyl) -amide in Potentiometry of pH Standard Buffers., M. Shibata, M. Yamanuki, Y. Iwamoto, S. Nomura, T. Kakiuchi, Anal. Sci., 26, 1203, 2010
3) Determination of the Activity of Hydrogen Ions in Dilute Sulfuric Acids Using an Ionic Liquid Salt Bridge Sandwiched by Two Hydrogen Electrodes., Manabu Shibata, Hideaki Sakaida, and Takashi Kakiuchi, Anal. Chem., 83 , 164 , 2010
4) Ionic Liquid Salt Bridge Based on Tributyl (2-methoxyethyl) phosphonium Bis (pentafluoroethanesulfonyl)amide for Low Ionic Strength Aqueous Solutions, Yousuke Fujino and Takashi Kakiuchi, J. Electroanal. Chem., 651, 61-66, 2011
Technical Performance pH of sulfuric acid solutions with concentrations in the range of 20 μM‒200 μM could be measured. Precision of pH measurements: 0.003 Deviation from the calculated pH: < 0.03 In the case of a conventional pH electrode, the precision of measurements and the deviation from the calculated pH are reported as 0.055 and 0.055, respectively in R. C. Metcalf, Analyst, 112, 1573-1577, 1987.
Technical Overview The new type of SB uses a hydrophobic IL, which generates thermodynamically stable liquid junction potential difference between IL and dilute aqueous solutions. The new type of SB can also eliminate the change in pH due to the leakage of con-centrated electrolyte from SB into the sample solution. These advantages of the new pH electrode equipped with ionic liquid salt bridge (ILSB) over the conventional pH electrodes that have been used over a century are distinctive. It is noteworthy that more accurate pH values could be obtained with this electrode in environmental water samples such as rain water and surface water. Further, accurate pH values of these envi-ronmental water samples are expected to contribute to more pre-
cisely and quantitatively understanding environmental phenomena depending on pH, including the toxicity of natural water to animals. Another application of the new pH electrode is the pH measure-ment of solutions in which the addition of concentrated electrolytes must be avoided. For example, in case of the medical injection solution, the contamination of concentrated electrolyte will change the characteristics of the sample solutions. Since pH is an important parameter that characterizes drug efficiency, the new pH electrode is expected to contribute deeply in research initiatives taken to-ward discovering new drugs. This advantage is also expected to be applied to enhancing research studies on macromolecule electro-lytes, which form the basis of numerous advanced materials.
Fig. 2 Advantages of the composite pH electrode in-corporating IL salt bridge.
Fig. 3 Examples of applications of the combination pH electrode equipped with ILSB
39

Development of an Online Aerosol Particle Combined Analysis System
Participating organizationUniversity of Tokyo, Fuji Electric, Co., Ltd., Japan Agency for Marine-Earth Science and Technology (JAMSTEC)
Apparatus nameAerosol Particle Combined Analysis System
Keywords Aerosol, Climate change, Air pollution, PM2.5
Atmospheric aerosols have significant impacts on air pollution and climate change. We have developed a new analysis system based on laser and mass spectrometric techniques for online measurements of aerosol properties (size distribution, chemical composition, mixing state, etc.) relevant to the environmental issues. The system may also be applicable to particle monitoring in clean rooms or industrial processing sections.
Abstract
Nobuyuki TakegawaTokyo Metropolitan University
Team Leader
Environmental Science
Noritomo HirayamaFuji Electric, Co., Ltd.
Sub Leader
DCC
ResultNo.19
Fig. 1 (a) Importance of aerosols in atmospheric environment Fig. 1 (b) Typical aerosol mass size distribution
40

ContactPerson in charge:Noritomo HirayamaAffiliation:Fuji Electric, Co., Ltd.E-mail:[email protected]
Environmental Science
Publications1) Moteki, N., N. Takegawa, K. Koizumi, T. Nakamura, and Y. Kondo, Multiangle Polarimetry of Thermal Emis-
sion and Light Scattering by Individual Particles in Airflow, Aerosol Science and Technology, 45, 1184-1198, 2011.
2) Takegawa, N., T. Miyakawa, T. Nakamura, Y. Sameshima, M. Takei, Y. Kondo, and N. Hirayama, Evaluation of a New Particle Trap in a Laser Desorption Mass Spectrometer for Online Measurement of Aerosol Com-position, Aerosol Sci. Technol. , 46, 428-443, 2012.
3) Taketani F., Y. Kanaya, T. Nakamura, K. Koizumi, N. Moteki, N. Takegawa, Measurement of Fluorescence Spectra from Atmospheric Single Submicron Particle Using Laser-induced Fluorescence Technique, J. Aerosol. Sci., 58, 1-8, 2013.
Technical PerformanceSpecifications (nominal) Remarks
Diameter range 0.1-2.5µm Approximately PM2.5
Time resolution 5‒20min or continuous Depends on ambient aerosol concentrationsSample flow 120cc min-1 16.7L min-1 with cycloneMain productsNumber sizeDistribution
Concentration range 0-5000cm-3
Number of size bins 20ch LII
Black carbonmass concentration
Concentration range 0-100µg m-3
LOD (10s) <0.01µg m-3 LII
SO42-, NO3-, OCmass concentration
Concentration range 0-100µg m-3
LOD (SO42-・5 in) 0.04µg m-3MS
Bio-aerosol Excitation 266 nm, Fluorescence 3ch, Diameter >0.5µm LIFMixing state SO42-, NO3-, OC mass concentration classified by BC mixing state LII+MSSize and weight W1400・D800・H1500, 300kgPower supply AC100V, 1.5kW
Technical OverviewIntroduction Aerosols (suspension of particles in air) play important roles in air pollution and climate change from local to global scales. Aerosol particles can efficiently scatter or absorb solar radiation (direct effect) and also alter cloud properties as cloud conden-sation nuclei (indirect effect). These effects can significantly af-fect the radiation budget of the Earth’s atmosphere (Figure 1a). In addition, high concentrations of aerosols due to diesel ex-haust and photochemical smog in urban air have adverse influ-ences on human health. Figure 1b represents a typical aerosol mass size distribution. Aerosol particles with diameters smaller than 2.5 µm are re-ferred to as PM2.5. Aerosols consist of a number of compounds including black carbon and sulfate from anthropogenic origins and biogenic materials from natural sources. Development of instruments for online measurements of aerosol properties in-cluding size, composition, and mixing state is one of the re-
search frontiers of atmospheric science. The purpose of our de-velopment is to meet these demands.
Instrument description The concept of the Aerosol Combined Analysis System is to use multiple analysis methods to characterize variety of aerosol properties in sample air. Figure 2 shows a picture of the sys-tem. The major components include a laser-induced fluores-cence (LIF) detector, laser-induced incandescence (LII) detec-tor, and mass spectrometer (MS). A combination of these components provides a new insight into chemical composition and mixing state of aerosols. Figure 3 illustrates an example of time series of sulfate aerosols obtained by the system. Sulfate is one of the most relevant compounds of atmospheric aerosols and often contributes to the major fraction of PM2.5. Highly time-resolved measurements of aerosol composition would im-prove our understanding of sources and processes of aerosols.
Fig. 2 P ro to t ype o f Aerosol Particle Combined Anal-ysis System
Fig. 3 Comparison of online proto-type data with off - l ine f i l ter ana l y s i s f o r sulfate (June 2012)
41

Ultra Compact Measurement System for Carbon Dioxide Monitoring
Participating organizationYazaki Corporation, Research Institute for Humanity and Nature, Kyoto University, Hokkaido University, Nagoya University, Meisei Electric Co., Ltd.
Apparatus name・Balloon-borne CO2 measurement system (CO2 sonde)・CO2 meter for educational purposes
Keywords Carbon dioxide, CO2, Sonde, High accuracy, Measurement system
Carbon dioxide gas (CO2) is considered as one of the primary global warming gases. More accurate measurement of vertical distribution of atmospheric CO2 enables more precise evaluations of CO2 emissions and absorptions. A CO2 sonde has been used to investigate the vertical distribution of CO2, but conventional apparatuses demonstrate lower performance than the required level. We developed the ultra-small optical CO2 sensors that contribute to more accurate measurement CO2 concentration by sondes. Furthermore, we succeeded in the mass production of, the CO2 sensors. The sensor can be used not only in meteorological balloon (sonde) for researchers but also in environmental education for students. The latter establishes the environmental education network to provide regional CO2 concentration distributions.
Abstract
Shoichi UematsuYazaki Corporation
Team Leader
Environmental Science
Gen InoueUniversity of Tokyo
Sub Leader
UCC
ResultNo.20
Fig. 1 CO2 Sensor (Prototype) Fig. 2 CO2 Sonde (Prototype)Fig. 3 CO2 meter for educa-
tion (Prototype)
42

ContactPerson in charge:Shoichi UematsuAffiliation:Yazaki Research and Technology Center, Yazaki CorporationE-mail:[email protected]
Environmental Science
Publications1) Y. Matsumi et al. (T4-073) Development of balloon-borne CO2 instruments, 8th International Carbon Diox-ide Conference (Jena, Germany), 13-19 September 2009.
2) S. Takegawa et al. AAS001-P12 Improvements of Balloon-borne CO2 instrument for the high accurate measure-ment of CO2 vertical profile, Japan Geoscience Union Meeting 2010 (Makuhari, Chiba), May 23-28, 2010.
Technical PerformanceSpecifications of CO2 sonde prototype
Measurement items CO2 Concentration, Temperature, Humidity, Atmospheric pressure, Wind Direction, Wind Speed, Altitude, Position
CO2
Measurement Range 0ppm~1000ppmAccuracy 1ppmAltitude Range 0m~10000mAltitude Resolution 250m~300mTime Resolution 60sec~80sec
Reference gases Equipped (2 types of CO2 reference gases)Size approx. 280×270×140mm (w/o reference gas containers)Weight approx. 1000g
DataTransmissions
Transmission Range 250km Measurement Interval 1sec
Technical Overview Developments of two types of CO2 meters have been carried out. One is balloon-borne CO2 measurement system (CO2 sonde) for its measuring vertical distributions and the other is a ground level CO2 meter for environmental educations. We also aim to develop compact apparatus with high accuracy and low cost. As the CO2 sensing element, we adopt non-dispersive infrared (NDIR) method. The optimizations on IR source, IR detectors, cells, driving methods, signal processing method and tempera-ture compensations have been carried out to develop a CO2 sensor which meets the requirements on the accuracy, cost and size of the system. The developed CO2 sensor is applied to CO2 sonde and CO2 meters for meteorological research, and also to those for environmental education. During ascent, the CO2 sonde measures CO2 concentration, temperature, humidity and altitude, and transmits the data to
the ground. The sonde carries two types of CO2 reference gas-es (370ppm and 400ppm). The sensor in the sonde monitors the reference gases and external air alternately to perform ac-curate CO2 measurement. In the launch test, the altitude resolu-tion of approximately 250m was archived together with the CO2 concentration measuring accuracy of approximately 1ppm. And in various tests, high stability of the measurement was con-stantly obtained. A CO2 meter developed for environmental education is equipped with a display, and the data can be stored to a SD memory card or a personal computer. Data transmission tests through a phone line were successfully carried out by using personal computer connected to the meter. And the CO2 meter installed in a classroom detected the CO2 concentration chang-es related to the daily school activities within an error range of approximately ±1ppm.
43

Rapid and Simultaneous Monitoring Method for Radiocesium in Water
Participating organizationJapan Vilene Company, Ltd., National Institute of Advanced Industrial Science and Technology (AIST), Fukushima Agricultural Technology Centre
Apparatus nameJINSOKU-kun, PB-Cartridge, SS-Cartridge
Keywords Radiocesium in water, Nonwoven fabric, Prussian Blue, Particulate form, Dissolved form.
Rapid and simultaneous radiocesium (137Cs) monitoring method is developed for both suspended and dissolved 137Cs in water. This method uses pleated polypropylene nonwoven fabric filter to collect 137Cs particulate, and nonwoven fabric impregnated with Prussian blue (PB) to absorb water dissolved radiocesium. Each fabric was placed into cylindrical plastic cartridges (SS-cartridge and PB-cartridge). Conventional monitoring methods require time consuming pre-processing such as evaporative concentration. Our method demonstrates shorter pre-processing time before the detection.
Abstract
Yasuhiro ItoJapan Vilene Company, Ltd.
Team Leader
Rediation Measurement
Tetsuo YasutakaNational Institute of Advanced Industrial Science and Technology (AIST)
Sub Leader
Rff
ResultNo.21
Fig. 1 Water flow in “JINSOKU-kun” Fig. 2 Monitoring device “JINSOKU-kun”
44

ContactPerson in charge:Yoshihiko Kondo, Tetsuo YasutakaAffiliation:Japan Vilene Company, Ltd., National Institute of Advanced Industrial Science and TechnologyE-mail:[email protected], [email protected]
Rediation Measurement
Publications1) Hideki Tsuji, Yoshihiko Kondo, and Yasukazu Suzuki, Tetsuo Yasutaka, (2014) Development of a method for rapid and simultane-ous monitoring of particulate and dissolved radiocesium in water with nonwoven fabric cartridge filters, Journal of Radioanalyti-cal and Nuclear Chemistry, 2014, Volume 299, Issue 1, pp 139-147
2) Tetsuo Yasutaka, Hideki Tsuji, Yoshihiko Kondo, and Yasukazu Suzuki (2013), Developemnt of Rapid Monitoring for Dissolved Radioactive Cesium with a Cartridge Type of Prussian blue-impregnated Nonwoven Fabric, BUNSEKI KAGAKU Vol.62, No.6, pp.499-506 (in Japanese)
3) Tetsuo Yasutaka, Tohru Kawamoto, Yoshishige Kawabe, Toshio Sato, Mutsuto Sato, Yasukazu Suzuki, Kimihito Nakamura, Takeshi Komai (2013) Rapid measurement of radiocesium in water using a Prussian blue impregnated nonwoven fabric, Jour-nal of Nuclear Science and Technology. 50 (7), pp.674-681.
Technical Performance The applicability of this system to the natural water monitoring was verified in laboratory by using environmental water mimic sample. Over 99 % of the suspended solids were collected in one SS-cartridge. Furthermore, two PB-cartridges could collect more than 92% (filtration rate; 2.5L/min) and 97% (filtration rate; 0.5L/min) of water dissolved 137Cs under neutral pH in any given tem-perature. Monitoring of the Abukuma River by this method was evaluated and compared with conventional filtrating and evapora-tive concentration methods. The detected suspended solids concentrations, particulate and dissolved radiocesium concentrations measured by this method corresponded well with the results obtained by other methods.
Pre-concentration of dissolved radiocesium Pre-concentration of particulate radiocesiumMethod Using two
PB-CartridgesConventional evapo-ration methods Using a SS-cartridge Conventional
filtering methodsPre-concentration time for 20L of envi-ronmental water 10-40 minites 420-600 minutes
(7-10 hours) 10-40 minites 120-180 minutes(2-3 hours)
Recovery rate Over 92% (FR: 2.5L/min)Over 97% (FR: 0.5L/min) 100% Over 99% 100%
Detection limits (Measuring time of Ge semiconductor detector)
0.006-0.008Bq/L(43200s)
0.011~0.014Bq/L(43200s)
0.007~0.011Bq/L(9000s)
0.010~0.019Bq/L(4000s)
Technical Overview An effective and simultaneous radiocesium monitoring system was developed for natural water. This system named “JIN-SOKU-KUN” consists of a feed-water tank, peristaltic pump, housing component with plain filter, flow meter, and drain tank. To monitor radiocesium in natural water, one only needs pass-ing water through the system and measure trapped radiocesi-um concentration of each cartridge. Two types of cartridge filter were designed to collect radioce-sium in water. SS-cartridge is housed with the plain nonwoven fabric to collect water suspended solids including radiocesium particulates. This fabric is made of polypropylene fibers with a
pore size of 1μm. PB-cartridge is made to absorb water dissolved radiocesium on Prussian Blue (PB) impregnated nonwoven fabric filter. PB is made up of potassium ferrocyanide (II) potassium ox-ide iron (II) KFe [Fe (CN)6]3·zH2O), and its radiocesium absorbent property has been discovered by our previous study. By using this system, the separation time for particulate and dissolved 137Cs is reduced by 60 times compared to the conven-tional evaporative concentration method. Based on these re-sults, “JINSOKU-KUN” present monitoring method exhibits re-markable efficiency for simultaneously monitoring particulate and dissolved radiocesium concentration in the field.
Fig. 3 Concentrations of 137Cs of SS-cartridg-es(SS-C) and filtration residues by 5-μm filter. The concentrations of 137Cs from the 0.45-μm membrane filters was less than the detection limit (0.005-0.009 Bq/L) Error bars indicate the counting error by Ge semiconductor detector
Fig. 4 137Cs of residues, treated water from SS-cartridg-es, and PB-cartridges(PB-C). Error bars indicate the counting error.137Cs radioactivity of the sec-ond PB-cartridges was less than detection limit (0.004-0.006 Bq/L) except in Fukushima, and the third PB-cartridges were not served to the detector because of low concentration of the second PB-cartridges. Error bars indicate the counting error by Ge semiconductor detector
45

Certified Reference Materials for Determination of Environmental Radioactivity
Participating organizationMusashi University, Environmental Technology Service Co. Ltd., National Institute of Advanced Industrial Science and Technology (AIST), Saitama University, Japan Institute of International Affairs, Japan Soci-ety for Analytical Chemistry
Apparatus nameCertified reference materials for determination of environmental radioactivity
Keywords Quality control, Cs-134, Cs-137, Food
Application of proper reference material is an indispensable element for ensuring the reliability of determination of chemical constituents. Our project focus on establishing production technology of reference materials for determination of radioactivity in foods and agricultural products. The reference material of brown rice, having the certified values for radioactivity of radiocesium, was the first product of this program; it was released before the fall harvest in 2012. The certified values based on the analytical data from ca.10 collaborative institutes have been confirmed by some foreign organizations. Consequently, the reference materials of beef, soybean, and mushroom were developed in the year 2012-2013.
Abstract
Yoshitaka MinaiMusashi University
Team Leader
Rediation Measurement
Hiroshi IwamotoEnvironmental Technology Service Co., Ltd.
Sub Leader
Coo
ResultNo.22
Fig. 1 Certified reference material of brown rice (granular): (left) 100 mL bottle and (right) 1 L bottle packages, respectively.
46

ContactPerson in charge:Ken-ichi AbeAffiliation:Japan Society for Analytical ChemistryE-mail:crmpt@ml.jsac.or.jp
Rediation Measurement
Publications1) The measurement comparability of 134Cs and 137Cs in foodstuff samples in Japan-result of inter-laboratory experiment for certification of certified reference material, Tsutomu Miura et al., Yoshitaka Minai, Shoji Hi-rai, Hiroshi Iwamoto, Chushiro Yonezawa, Yoshinobu Uematsu, Akira Okada, Masami Shibukawa, Koichi Chiba, Kiyoshi Kitamura, Takahiro Yamada, Kazutoshi Kakita, and Isao Kojima, Journal of Radioanalytical and Nuclear Chemistry, in press.
Technical Performance Certified values for concentrations of radionuclides in the reference materials of beef, soy-bean, and mushroom are listed as follows.
CRM Code (JSAC) Material 134Cs (Bq/kg) 137Cs (Bq/kg) 40K (Bq/kg) Reference date
0751 0752 Beef 174±12 297±20 276±46 11/19/20120761 0762 0763 Soybean 37.1±2.6 68.2±4.6 619±60 2/1/20130753 0754 Beef 63±6 106±9 283±54 11/19/20120764 0765 0766 Soybean 190±11 345±19 613±40 2/1/2013※Certified reference material for mushroom is in prepation
Technical Overview The reference materials were prepared from foodstuffs and agricultural products contaminated by radionuclides possibly released from the Fukushima Daiichi Nuclear Power Plant. Our group successfully develops the reference materials of brown rice, beef, soybean, and mushroom, having the certified values of radioactivity for 134Cs, 137Cs, and 40K. In the case of the development of brown rice reference mate-rial, over hundred kilograms of the brown rice granules, having several hundreds Bq/kg of radiocesium, harvested from a vil-lage in the Eastern Japan was used as the source of the refer-ence material developed. The brown rice granules were gently mixed to achieve homogenous distribution, packed into two types of brown bottles. After γ-irradiation for sterilization, sev-eral bottles were chosen for homogeneity test. This indicated low uncertainty in each certified value for inhomogeneity. Final-
ly, following the procedures noted in JIS based on ISO, the in-ter-laboratory collaborative test (Round-Robin test) was carried out to obtain the certified values for radioactivity of 134Cs, 137Cs, and 40K. The thorough reviewing on development procedures and certification with the experts in the Japan Society of Ana-lytical Chemistry allows to distributing the reference materials as one of the composite reference materials having certified values issued by the society. The other standard materials have developed in similar manner. The reference materials would be used to control the quality of food analysis in food production and distribution system. De-velopers of analytical instruments would be interested in the reference materials to ensure the performance of the develop-ing apparatus.
Table. 1 Certified values of radioactivity in the brown rice (granular) reference materials. Reference Date: June 1. 2012, JST 00:00:00.
47

Development of Handy-type Smart Radiation Becquerel Counter
Participating organizationShinnihondenko Co., Ltd., Osaka University, Mie University
Apparatus nameHandy type-Smart Radiation Becquerel Counter (H-SRBC).
Keywords Cesium iodide crystal, Handy-Type, foods and soils.
We develop a small and light weight γ-ray detector, named “H-SRBC” which has a large volume of CsI crystal (about 7 times larger than the conventional one). This device realizes high speed measurement of radioactivity concentration and space radiation dose of foods, soils, forests, for both cesium-137 and cesium-134 nuclide with high accuracy and sensitivity. Our cost effective and compact γ-ray detector demonstrates high competitiveness compare to other existing products. By the present results of this development, it will realize a simple measurement for the radioactivity concentration in the foods and the spatial radiation dose.
Abstract
Shigeo OkuboShinnihondenko Co., Ltd.
Team Leader
Rediation Measurement
Ryohei SatoOsaka University
Sub Leader
DBB
ResultNo.23
Fig. 1 H-SRBC (Handy type Smart Radiation Becquerel Counter)Fig. 2 Large Csl (Tl) & MPPC (Multi Pixel Pho-
ton Counter)
48

ContactPerson in charge:Goken HinoAffiliation:Shinnihondenko Co.,Ltd.E-mail:[email protected]
Rediation Measurement
Publications1) Hideji Yumen, Shigeo okubo, Ken Kawamura, Yuuichiro Manabe, Yoshihide Kimura, Isao Murata, Kenzo Ike-da, Kyousiro Imagawa, Kensuke Yasuda, Ryohei Satou, Ryuichi Shimizu:
A Smart Becquerel Counter for On-site Inspection, Proc. 8th International Workshop on Ionizing Radiation Monitoring (Dec.1-2, 2012, Oarai, Japan) pp312-313.
2)Patent No2013-37315/Measuring device3) J. Yoshii, R. Ikeda, Y. Kimura, K. Kawamura, Y. Manabe, R. Sato, S. Nagai, S. Okubo, R. Shimizu; Software Platform for Smart Becquerel Counter,JSPS-141 Committee Technical Repoort#149th Meeting
(2012.9.27-Nagoya) pp1-9
Technical PerformanceEquipment:H-SRBC (Handy type smart Radiation Becquerel counter)Model number:H-SRBC3600AScintillation crystal : CsI (Tl) scintillator is of 3.8×3.8×2.5cm3 (thallium addition type cesium io-
dide crystal)Detection element:MPPC (Multi Pixel Photon Counter) 2×2chEnergy resolution:Less than 10% (Cs137)Energy range:50kev~2000kevMeasurement range detection limit minimum:50Bq/kg ※100Bq/kg/20 minutes or less
Technical Overview We develop a handy type smart radiation Becquerel counter (H-SRBC) for on-the-spot radiation contamination assessment of foods and environment in affected area by radioactive sub-stances, originated from the Fukushima dai-ichi nuclear power plant accident. Our previously reported mobile smart Becquerel counter (M-SBC) (1) has been supersensitized by adopting multi-pixel photon counter (MPPC) to the photodiode (PD). This has as-sured high energy resolution in γ-ray spectroscopy (~8%) as seen in Fig. 3. Highly stabile radioactivity measurement has been performed even under the severe environmental circumstances such as atmospheric temperature, vibration, electric and mag-netic disturbance etc., which the M-SBC had been faced during on-the-spot inspection of γ-ray emitting substances.
The CsI (Tl) scintillator of 3.8×3.8×2.5cm3 is supplied from I.S.C. Lab. Co., Ltd. and connected to the MPPC (S11830-3344MF) (Fig.2) of HAMAMATSU PHOTONICS K.K. Whole body of the H-SRBC is 17.5×20×16cm3 with 13kg weight (Fig.1), which allows to be carried by one person. Furthermore, H-SRBC is able to be operated over 5 hours from build-in Lithium-ion Battery (DC5V 30Wh). A typical example of the measurement of Cs standard sample provided by Japan Society of Analytical Chemistry is shown in Fig. 4. The practical use of the H-SRBC for hot spots screening in the farms and/or forest is scheduled to be exemplified under the guidance of the Recovery Measures for Farms and Forest Unit, Fukushima Prefectural Government.
Fig. 3 Large Csl (Tl) & MPPC to achieve high resolution-① Fig. 4 Large Csl (Tl) & MPPC to achieve high resolution-②
49

Development of Sensitive and Handy Compton Camera
Participating organizationHamamatsu Photonics K.K., Waseda University
Apparatus nameHighly sensitive portable Compton camera
Keywords Compton camera, Scintillation Detection, Radioactive Substance, Decontamination
We have developed a highly sensitive portable Compton camera which visualizes distribution of radioactive substances (cesium 134 and 137). This handy Compton camera is useful to visualize the effect of decontamination in the radioactive substance affected area. The Compton camera utilizes two gamma-ray detectors, a scatterer and an absorber, which consist of two dimensionally or three dimensionally aligned scintillator blocks and high performance photodetectors, multi-pixel photon counters (MPPCs). These detectors can measure precisely the locations where incident gamma-rays are Compton-scattered or photo-absorbed. Our compact Compton camera weight less than 2 kg. It can identify a cesium 137 point source within 10 to 30 seconds, under the condition where the source produces a dose rate of 5 μSv/h at the camera position.
Abstract
Shinji OhsukaHamamatsu Photonics K.K.
Team Leader
Rediation Measurement
Jun KataokaWaseda University
Sub Leader
DCC
ResultNo.24
Fig. 1 Photograph of the non-DOI type Compton camera. Dimensions: 15×15×13.5 cmWeight: 1.9 kg.
Fig. 2 Conceptual drawing of the Compton camera which has two scintil-lation gamma-ray detector as a scatterer and an absorber. These detectors consist of two dimensionally (non-DOI* type) or three di-mensionally (DOI type) aligned scintillator blocks and high perfor-mance photodetectors, multi-pixel photon counters (MPPCs). *) DOI: Depth of Interaction
50

ContactPerson in charge:Shinji OhsukaAffiliation:Central Research Laboratory, Hamamatsu Photonics K.K.E-mail:[email protected]
Rediation Measurement
Publications1) Jun Kataoka et al., “Handy Compton camera using 3D position-sensitive scintillators coupled with large-ar-
ea monolithic MPPC arrays”, Nucl. Instr. and Meth. A, vol.732, pp.403-407, 2013.2) Kenshiro Takeuch et al., ““Stereo Compton cameras” for the 3-D localization of radioisotopes”, Nucl. Instr.
And Meth. A, 2014, DOI: 10.1016/j.nima.2014.04.039.
Technical PerformanceSpecifications of the highly sensitive portable Compton cameras are as follows.
non-DOI type DOI type
Dimensions 15L×13.5W×15H cm 15L×16W×15H cm
Weight 1.9 kg 2.5 kg
Energy resolution @ 662 keV Approximately 9% (FWHM) Less than 9% (FWHM)
Angular resolution @ 662 keV Approximately 14 degree (FWHM)
Approx imate ly 9 degree (FWHM)
SensitivityIdentify point source of Cs 137 producing 5 mSv/h in 20-30 sec.
Identify point source of Cs 137 producing 5 mSv/h in 10 sec.
Technical Overview Visualizing the distribution of radioactive substances (cesium 134 and 137) at the decontamination sites represent a great demand in Fukushima prefecture. Compton cameras are useful for that purpose, which determine the direction of incident gamma-rays using the kinematics of Compton scattering. And in principle there is no need for using heavy shielding materials such as lead or tungsten. We have developed a highly-sensitive portable Compton camera (Fig. 1) whose weight is only 1.9 kg. The Compton cam-era has two scintillation gamma-ray detector with high sensitivi-ty as a scatterer and an absorber (Fig. 2). These are consisted of aligned scintillator blocks of two dimensional (non-DOI* type) or three dimensional (DOI type) alignment, and high per-formance photodetectors, multi-pixel photon counters (MPPCs).
In these gamma-ray detectors, deposited energies are precisely measured to distinguish the nuclei source, together with accu-rate identification of the scintillator blocks where gamma-rays Compton-scattering or photo-absorbing occur. And thus both sufficient angular resolution and high sensitivity are obtained which are necessary for visualizing radioactive hotspots at de-contamination sites. The no-DOI type Compton camera was tested in Fukushima prefecture. The result shows that the distribution of cesium 137 could be visualized within a few minute under the background dose rate was around 10 μSv/h (Fig. 3). Now, the non-DOI Compton camera is released by Hamamatsu Photonics K.K. *) DOI: Depth of Interaction
Fig. 3 Visualization of radioactive substances (cesium 137) with different reconstruction algorithm, (a) back projection, (b) MLEM (maximum likelihood expectation maximization).Distribution of cesium 137 (pseudo color image) measured with a 300-second collection time is superimposed on an optical image taken with a fish eye camera. The background dose rate was around 10 μSv/h.
51

Advanced Gamma-ray Imaging System with an Ultra-wide Angle Field of View and a High Sensitivity
Participating organizationJAXA, Mitsubishi Heavy Industries (MHI), Ltd., Nagoya University
Apparatus nameUltra-wide angle Compton Camera and ASTROCAM-7000HS
Keywords Gamma-ray imaging, Si/CdTe Compton camera, radioactive substances.
A gamma-ray imaging system equipped with a wide-angle vision and high sensitivity is desired to visualize radioactive substances (Cesium 137 and 134) released from Fukushima Daiichi nuclear power plant. We have developed a new Compton camera consisting of silicon (Si) and cadmium telluride (CdTe) semiconductor detectors, which is originally proposed by ISAS/JAXA group for the next-generation gamma-ray astrophysics. This camera covers almost 180 degree (2π steradian), hence it can be utilized to obtain images of the radioactive substances over a large area of ground or a house that are difficult to survey using an investigation method by human with a survey meter. Mitsubishi Heavy Industry released the first commercial Compton camera, “ASTROCAM 7000 HS”.
Abstract
Tadayuki TakahashiJapan Aerospace eXploration Agency (JAXA)
Team Leader
Rediation Measurement
Yoshikatsu KurodaMitsubishi Heavy Industries (MHI), Ltd.
Sub Leader
AaaS
ResultNo.25
Fig. 1 Photograph of A S T R O C A M 7000 HS. The Si/CdTe Comp-ton camera and an optical fish-eye camera are included.
Fig. 2 Conceptual view of Si/CdTe Compton camera consisting of many layers of Si and CdTe semicon-ductor imaging devices. Gamma-ray scattered in S i part and then ab-sorbed in CdTe part are recorded by the detec-tors, and used for image reconstruction.
52

ContactPerson in charge:Tadayuki TakahashiAffiliation:ISAS/JAXAE-mail:[email protected]
Rediation Measurement
Publications1) Tadayuki Takahashi et al. “High resolution CdTe detectors for the next generation multi-Compton gam-ma-ray telescope”, Proc. SPIE, vol.4851, pp.1228-1235, 2003
2) Shin Watanabe et al. “A Si/CdTe semiconductor Compton camera”, IEEE Trans. Nucl. Sci, vol.52, no.5, pp.2045-2051, 2005
3) Shin’ichiro Takeda et al. “Applications and imaging techniques of a Si/CdTe Compton gamma-ray camera”, Physics Procedia, vol.37, pp.859-866, 2012
Technical PerformanceFollowing is the specifications of ASTROCAM 7000 HS.
Dimensions 445L×340W×235H (mm)
Weight Approximately 8-13kg (Camera Unit)<depending on specifications>
Power Source AC 100-240V and BatteryOperating temperature 0 to 40 degree CelsiusView angle 180 degree (2π steradian)Energy resolution Approximately 2% (FWHM) @ 662keVAngular resolution Approximately 5degree @ 662keV
Efficiency 0.16cps/MBq @ 1m, 137-Cs (standard configuration)2.8cps/MBq @ 1m, 137-Cs (expanded configuration)
Technical Overview Gamma-rays emitted from Cesium 137 and 134 have ener-gies ranging 600 to 800 kilo electron volts (keV). A Compton camera is a visualization technology that constraints the direc-tion of incident gamma-rays by using Compton scattering pro-cess. The Compton camera can locate the radioactive sub-stances without using a pinhole collimator and lead shields that are used in conventional gamma cameras, We have developed a “Ultra-wide-angle Compton Camera”, which has a wide field of view, almost 180 degrees (2π stera-dian) and an angular resolution of several degrees in the energy range of 500 to 800 keV. The camera is based on a concept to use densely stacked Si and CdTe semiconductor imagers (Si/CdTe Compton camera), The concept is originally proposed by ISAS/JAXA for the ASTRO-H X-ray astronomy satellite. The com-bination of Si and CdTe is thought to be ideal to achieve both
good angular resolution and high efficiency. Since the effect of the Doppler broadening is smaller in the Si devices than other semiconductor devices, ambiguities in determining the direction of incident gamma-ray is small in our camera. CdTe semicon-ductoris good for absorption part thanks to its high probability of photo-absorption and high density. “ASTROCAM 7000 HS” is the first commercial Compton cam-era released by Mitsubishi Heavy Industry, based on our data taken in Fukushima by using the prototype Si/CdTe cameras developed in this project. Its large of view and a high-contrast image give great advantages in hotspot survey over a large area of ground or a house. We performed imaging tests at the evac-uation zone, and demonstrated abilities to detect hotspots on the environmental radiation level of even below 1µSv/h.
Fig. 3 Visualization of radioactive substances. Optical image (left) taken by the fish-eye camera is overlaid with the gamma-ray image by the Compton camera (right). Ul-tra-wide vision covering almost 180×180 degree is achieved, while that of typical gamma camera is about 40×40 degree (bold white line).
53

Name Index
Name Page
Abe Ken-ichi 47
Araki Norie 14
Asakura Tetsuro 22
Fukatsu Norihiko 18
Fukuyama Hiroyuki 16
Hamada Kazuyuki 4
Higashiyama Hisamitsu 20
Hino Goken 49
Hioka Katsuya 22
Hirayama Noritomo 40
Inoue Gen 42
Ishihara Shinsuke 24
Ito Hiroshi 30
Ito Sukehiro 26
Ito Yasuhiro 44
Iwamoto Hiroshi 46
Iwata Koichi 6
Kakiuchi Takashi 38
Kataoka Jun 50
Katsumoto Yoichi 13
Kawai Jun 32
Kawamura Kenichi 6
Kokawa Ryohei 28
Kondo Yoshihiro 45
Kunimura Shinsuke 33
Kuroda Akio 34
Kuroda Yoshikatsu 52
Minai Yoshitaka 46
Mizutani Shuki 12
Name Page
Nagasawa Chikao 36
Nagatsuka Sumiya 8
Nishimura Shin-ichiro 4
Nishiyama Yusuke 23
Nomura Satoshi 38
Ohshima Tomoko 18
Ohsuka Shinji 50
Ogawa Kiyoshi 10
Okubo Shigeo 48
Omori Shinji 12
Sakai Keiji 24
Sakamoto Akira 20
Sato Ryohei 48
Seto Mitsutoshi 10
Shibata Manabu 39
Takahashi Tadayuki 52
Takano Akio 31
Takasaki Yoichi 16
Takegawa Nobuyuki 40
Takenaka Hisataka 30
Tanaka Junji 8
Tsuboi Hideki 27
Tsukamoto Makoto 36
Uematsu Shoichi 42
Unuma Yutaka 14
Ushiki Tatsuo 26
Yamada Hirofumi 28
Yasuda Masanori 25
Yasutaka Tetsuo 44
54

Institution Index
Institution Page
Akita University 38
Bruker Daltonics K. K. 4
Chiba Institute of Technology 16
Daiken chemical Co., Ltd. 30
EIKO Instruments Corporation 36
EIZO Corporation 27
Environmental Technology Service Co., Ltd. 46
Fuji Electric, Co., Ltd. 40
Fukushima Agricultural Technology Centre 44
Gakushuin University 6,16
Hamamatsu Photonics K.K. 50
Hamamatsu University School of Medicine 10
Hiroshima University 34
Hitachi High-Technologies Corporation 26
Hokkaido University 4,42
HORIBA Ltd. 38
INTEC Inc. 34
Institution Page
Japan Advanced Institute of Science and Technology (JAIST) 28
Japan Aerospace eXploration Agency (JAXA) 52
Japan Agency for Marine-Earth Science and Technology (JAMSTEC) 40
Japan Institute of International Affairs 46
Japan Society for Analytical Chemistry 46
Japan Vilene Company, Ltd. 44
JEOL RESONANCE Inc. 22
Kanazawa University 28
Keio University 10
Kobe University 28
Konica Minolta, Inc. 8
Kumamoto University 14
Kyoto Electronics Manufacturing Co., Ltd. 24
Kyoto University 28,32, 38,42
Meisei Electric Co., Ltd. 42
Mie University 48
Mitsubishi Heavy Industries (MHI), Ltd. 52
55

Institution Page
Musashi University 46
Nagoya Institute of Technology 18
Nagoya University 42,52
National Institute of Advanced Industrial Science and Technology (AIST)
30,44, 46
National Institute of Materials Science (NIMS) 30
National Museum of Japanese History 20
Nihon-HELS Co., Ltd. 38
Niigata University 26
NTT Advanced Technology Corporation 30
Olympus Corporation 30
Osaka University 28,48
Research Institute for Humanity and Nature 42
S.T.Japan Inc. 20
Saitama Medical University 8
Saitama University 20,46
Science & Technology Systems, Inc. 4
SHARP Corporation 14
SHIMADZU Corporation 10,28
Institution Page
Shinnihondenko Co., Ltd. 48
Shizuoka University 26
Siliconbio inc. 34
Sony Corporation 12
System House Inc. 16
System Instruments Co., Ltd. 4
Tohoku University 8,16
Tokyo Instruments, Inc. 6
Tokyo Medical and Dental University 12
Tokyo Metropolitan University 36,40
Tokyo University of Agriculture and Technology 22
Tokyo University of Science 30
TYK Corporation 18
ULVAC-RIKO, Inc. 16
University of Tokyo 24,40, 42
Yazaki Corp. 42
Waseda University 50
56

Technology Index
Technology PageAir analysis 34,36,40,42Atomic Force Microscope (AFM) 28,30Automated analysis 4,14,34Benchtop apparatus 4,6,12,14,24,28,44Biochemical detection 4,14,34Cell analysis 4,12,14CO2 analysis 36,42Compton Camera 50,52Diagnostics 4,8,10,14Electron microscopy 26Element analysis 32Environmental monitoring 14,32,34,36,38,40,42,44,48,50,52Fluorescence 32,34Gamma-ray 44,46,48,50,52High resolution 8,10,14,22,28,30High throughput analysis 4,6,12,14,20Imaging 6,8,10,20,26,28,34,50,52In situ measurement 18,28,36,40,42Infrared Spctroscopy 36,42Large equipement 10,16,26,36Laser 6,10,16,20,36,40,42Mass Spectrometry 10,40Material characterization 8,16,18,22,26,28,30,32Nuclear Magnetic Resonance (NMR) 22Physical property analysis 16,24Portable device 20,32,34,38,42,50,52Quality control 6,8,12,14,18,20,30,46Quantitative analysis 14,36,40,42Raman spectroscopy 6,20Realtime analysis 18,26,36,40,42Reference Material 46Sampling 12,44Scanning Probe Microscope (SPM) 28,30Surface analysis 6,20,26,28Trace analysis 32Ultramicro analysis 22,32Water analysis 38,44X-ray 8,32
57

Office of Advanced Measuring Technology,Japan Science and Technology Agency
K’s Gobancho, 7, Gobancho, Chiyoda-ku, Tokyo, 102-0076 JapanE-mail: [email protected] http://www.jst.go.jp/sentan/
©Copyright Japan Science and Technology Agency, Office of Advanced Measuring Technology2014.09