thesis.eur.nl j.r. (325380).docx · web viewin 1998, liberman and trope introduced the construal...
TRANSCRIPT
Master Thesis
Construal Level TheoryAn Experiment in the Tourism-Marketing Field
Erasmus University RotterdamErasmus School of Economics
Justin Raimond ZuureID: 325380
MSc. in Business & EconomicsMarketing Program7 November 2011
Supervisor: Prof. Dr. Willem J.M.I. Verbeke
1

2

Contents
1.0 Introduction
2.0 Theoretical Background2.1 Psychological Distance2.2 Temporal Distance before Construal Level Theory2.3 Roots of Construal Level Theory
3.0 Construal Level Theory3.1 Distinguishing Between High- and Low-Level Features3.2 Different Applications of Construal Level Theory3.3 Changes in Attitude as Time Goes By3.4 Interaction Effects3.5 Contribution of this Thesis
4.0 Method of Testing4.1 Previous Experiments as Base4.2 Hypotheses4.3 The Questionnaire
5.0 Data5.1 Population5.2 Control Questions
5.2.1 High-Level and Low-Level Features5.2.2 Perception of Temporal Distance
5.3 Measuring the Distance5.4 Results
6.0 Conclusions6.1 Theoretical Conclusions6.2 Limitations and Future Research
References
Appendix
3

1.0 Introduction
Research in the past has shown that there are a number of ways in which
the amount of time remaining to a particular activity, the temporal distance, has
an effect on an individual’s decision making concerning and the attitudes
towards these activities. As an example, Gilovich et al. (Gilovich, Kerr, Medvec –
1993) introduced the term cold feet referring to the idea that people get less
positive about near future activities compared to distant future activities. For
instance, people might get more nervous as activities like weddings or exams
come closer.
In 1998, Liberman and Trope introduced the Construal Level Theory, a theory
that deals with the question of how people’s decisions regarding events that will
happen in their near or far future are affected by the amount of time left until
that event. They show that high-level features of events play a more important
part in decision making when the event is in the far future, and low-level features
become more decisive in the near future. High-level features include the more
descriptive, abstract features that are linked to the main purpose of an event.
Low-level features are more detailed, concrete features, relating more to the
practical matters of an event. As time goes by, people’s attitudes towards an
event can change, as there is a shift in relative importance from the high-level to
the low-level features. An interesting (high-level feature) lecture a half year from
now, which is held at a conference far away from home (low-level feature), might
sound appealing at first. However, as time goes by, the large distance to travel
becomes a more important factor and might decrease the utility gain from
attending the lecture however interesting it may be.
This thesis contains an experiment to find proof whether or not Construal Level
Theory holds in the tourism-marketing industry. An analysis will be made of
differences in evaluations of vacations after changes in high-level or low-level
features for vacations in the near and distant future.
4
It turns out that this experiment does not provide enough proof to confirm
Construal Level Theory in the tourism-marketing industry.
5

2.0 Theoretical Background
2.1 Psychological Distance
Before discussing the Construal Level Theory it is necessary to discuss
psychological distance. The word distance most likely evokes geographical
thoughts (e.g. distance in kilometers or miles between cities) or perhaps
thoughts related to sports (e.g. athletes running a 100 meter dash in track and
field). Psychological distance however, is a much wider concept and it can entail
several kinds of distances. The most important distance discussed in this thesis is
temporal distance. Temporal distance is “a measurement of the distance between
two points or intervals in time” (Dahl, 1983). Practical issues that can be
addressed with the future dimension of temporal distance are questions
concerning savings, durable investments, investments in future goods, planning
and taking actions for goals to be achieved in the future. Regret is an issue that
deals with past temporal distance (Liberman, Trope & Wakslak, 2007). Besides
temporal distance, Liberman et al (2007) mention social, probability, and spatial
distance. A close friend is an example of a person at a close distance to you,
whereas a complete stranger is at a large social distance. Social distance deals
with situations such as those in which you would make a decision for someone
else. In such cases you might think in a different way than you would if you had
to make the same decision for yourself. Probability distance involves certainty
versus uncertainty such as in gambling and when launching a new product.
Internet shopping is an example of a larger spatial distance, compared to
physically going to the store.
2.2 Temporal Distance before Construal Level Theory
The role of temporal distance on decision-making has been at the focus of
a number of papers over the last fifty years. Nisan (1972) researched how
temporal distance between the moment of making and executing a decision has
and effect on the making of those decisions. More precisely, his test was to
6

investigate how expected temporal distance affects an individual’s level of risk
taken in skill-dependent tasks.
One of the determinants of risk taking is expectancy. Expectancy is defined as
“the subjective probability that a given outcome will follow the individual’s
choice”. When it comes to skill dependent tasks, temporal distance increases the
amount of expectancy for success since more time allows an individual to
become more familiar with the task and gain confidence. This higher expectancy
is also generalized to other skill dependent tasks, even if a greater temporal
distance has no effect on the preparation quality. Results indicated that there is a
consistent trend to higher expectancies for success when students were told they
had to take a test four weeks from now, compared to taking the test on the same
day.
The results found by Nisan are in line with findings by Gilovich, Kerr, and
Medverc (1993), although they state Nisan’s findings are somewhat limited.
According to them the group taking the test after four weeks might not have
been fully convinced they would actually have to take the test. Therefore they
doubt that the difference between the immediate group and the delayed group is
not due to expectancy about the test itself, but rather due to confidence in
actually having to take the test. Gilovich, Kerr, and Medverc focus on the
relationship between temporal distance and the confidence in succeeding in
various tasks, prospectively and retrospectively. That means that students would
feel more confident about taking up a heavier workload during next year’s
semester than for the current one. In retrospect, students are more confident
about having signed up for an extra course during a semester a year ago than
during the semester that just ended.
Results of their second study show a strong relationship between temporal
distance and confidence in performing various tasks. Tasks for which there was
neither a possibility in learning more about as time went by and therefore allow
for better performance, nor could the subjects have unrealistic expectations
about the amount of preparation time they would dedicate, which could have an
7
effect on the performance. Tasks such as pressing a button as soon as they hear a
beep through an earphone or watching a videotape of job interviews and pick
out the people who were lying.
The test concerning the retrospective temporal distance (study 3) was
conducted on three groups of students; the first group was asked how an
increased workload during the current semester would affect their performance,
for the second group it concerned the semester that had just finished, and the
third group was a group of alumni students. The alumni students were asked
how they would have performed if they had had an increased workload during a
semester of one of their undergraduate years. The results were as expected; the
alumni students indicated the extra workload would be easiest the handle,
followed by the recently finished semester subjects. Students asked about the
current semester feared the largest negative effect on their performance.
Cold feet (Gilovich, Kerr, Medvec – 1993) is a phenomenon that occurs when
people get nervous, anxious, or insecure when a certain event comes closer in
time, and is another great example of how attitudes towards events change over
time. It is a real life example of future optimism as described in their studies
discussed earlier. When it comes to sports, there are plenty of fans that are
convinced their team will become the next champion beforehand, but when the
time arrives for the team to make it happen, those same fans are worried and not
at all as confident as before. Another example is the cliché about the fully-in-love
couple experiencing doubts on the day of their wedding. Also, going to the
dentist might not seem so bad when it is supposed to happen two months from
now, but when the visit will take place an hour from now, you probably don’t feel
the same way; you might be afraid the dentist will have to perform an
uncomfortable procedure.
These examples are of situations where utility is decreases as the amount of time
between now and the event decreases, and is in line with what we have
discussed so far even though it does not involve a skill-dependent task. However,
this is not necessarily always the way it happens. There has also been research
8

showing a reversed effect with increased temporal distance through
consumption of expectations; people might be savoring a certain positive event
so much, that anticipation of it already adds value to the activity. Conversely,
people might not be looking forward to an activity at all; dreading it, so that their
value decreases even more if the negative activity is further away in time (Elster
& Loewenstein, 1992; Loewenstein, 1987).
2.3 Roots of Construal Level Theory
A relating theory is Construal Level Theory (Liberman & Trope, 1993).
This theory is an extension of a related study by Buhler, Griffin, and Ross (1994)
that showed that people tend to be victim of the planning fallacy; systematically
underestimating task completion times. This over-confidence is caused by
individuals failing to “incorporate into their construal of future events non-
schematic aspects of reality, that is, aspects that are not part of the constructed
scenario” (Liberman & Trope, 1998). This basically means that people do not
take into account certain events that are unforeseen but do have an influence on
the progress of completing a main activity, and therefore underestimate the time
to complete a task. As an example they mention a visit from the in-laws, which is
not incorporated in the predictions for the final goal of finishing writing a paper,
even though this visit was known beforehand.
Even though a direct comparison between near and distant future judgments has
not been part of the above researches, it does suggest that individuals somehow
fail to incorporate certain aspects that are not directly part of the distant future
activity; aspects that in fact do have an influence as time goes by and the distant
future activity becomes a near future activity. Reason for this failing is that if the
event is in the far future, people do not yet have all the information and therefore
can not make the most accurate predictions about it. When thinking about events
in the far future, only the incidental and contextual features are thought of. When
the event gets closer in time the more detailed features become more apparent
(Trope & Liberman, 2003).
9

3.0 Construal Level Theory
Construal Level Theory extends the planning fallacy by making a
difference between low and high levels of construal. Construal Level Theory
discusses the differences in behavior when it comes to decision-making
concerning activities in the near versus the distant future. According to Liberman
et al (1998), distant future activities are construed on a higher level whereas
near future ones are done so on a lower level. The theory suggests that when it
comes to near future events, peripheral and incidental features are present in the
mind and features are more detailed. As an example: describing the activity
“watching a movie on TV”; in the near future, the feature “commercials” (being
low level) is included more often compared to the distant future. For the distant
future, events are represented in terms of general, superordinate, and
decontextualized features. For instance, where the first mentioned are high-
level: pet vs. dog, being talented vs. being musical, and aggressive behavior vs.
pushing someone. In each of these three examples, the second item is more
detailed.
3.1 Distinguishing Between High- and Low-Level Features
Construal Level Theory can also be explained with the use of the terms
desirability and feasibility. High-level features of activities concern the more
central and abstract features, and are represented by the desirability of the
activity’s end state. Low-level features deal with the more incidental and
concrete features, and are represented by the feasibility of attaining the end state
of an activity. In other words, high level features are motivations for a specific
activity; why a person would engage in it. Low-level features describe how one
gets to the end state of an activity, i.e. whether it is easy or difficult, very time
consuming or not, etc. (Carver & Scheier, 1981, 1990; Vallacher & Wegner,
1987). Obtaining a high grade for a course is the desirability; the work that
needs to be done for it is the feasibility. Compared to the low-level incidental and
peripheral features, high-level central features have greater explanatory power
(Liberman & Trope, 1998) and are more able to catch the essence of the event.
10

As Liberman & Trope (2003) state, “a defining characteristic of high-construal
features is that changes in these features produce major changes in the meaning
of an event [while] changes in [low-construal] features produce relatively minor
changes in the meaning of an event.”
Another way to distinguish between high and low-level features is by placing
them in a certain structure. Hampson et al. (1986) state that when it comes to
goal-directed activities, high-level features fit the “[description] by [activity]”
structure, while low-level ones fit the “[activity] by [description]” structure. The
activity “reading a science fiction book”, for instance, can be described by
“broadening my horizons” or “flipping pages”. According to Hampson, the former
description is a high-level feature (“broadening my horizons by reading a book”)
and is superordinate, whereas the latter is a low-level feature (“I’m reading a
science fiction book by flipping pages”) and is subordinate. Table 3.1 shows the
different characteristics of high- and low-levels of construal.
3.2 Different applications of Construal Level Theory
Another field where feasibility and desirability concerns are important is
when it comes to seeking feedback. Feasibility of feedback would entail being
more vulnerable while being exposed to criticism, which might not be pleasant.
The desirability would be obtaining true and honest information about yourself
or your work. Freitas, Solavey, and Liberman (2001), predicted and found that in
11

the distant future people prefer informative and possibly negative evaluations
more than in the near future, where people tend to prefer less informative but
more flattering feedback.
Feasibility and desirability are also applicable to gambling situations. The
ultimate goal of gambling is winning money or some other prize; therefore the
payoff is the desirability. An obstacle obstructing the way to that prize is the
probability of winning the prize; the feasibility factor. Liberman, Sagristano, and
Trope (2002) showed by testing that the level of interest in the payoff is high no
matter whether the probability of winning is high or low. When the pay-off is low
however, the level of interest in the probability was much lower than the level of
interest in the probability when the payoff is high. From the point of view of
Construal Level Theory, this would mean that, in near future gambles,
probability (the subordinate feature) would be more decisive and in distant
future gambles the payoff (superordinate feature) would be. In the same paper
they tested this and the result was indeed that in the near future gambles with
high probability of winning and low payoffs were preferred, while in the distant
future high payoff, low probability gambles were more attractive.
When it comes to category breadth, Construal Level Theory predicts that people
would use fewer categories when it comes to classifying objects concerning
distant-future activities compared to near-future activities. In a study conducted
by Liberman, Sagristano, and Trope (2002, study 1), participants were asked to
imagine they would go on a camping trip. This trip would either be the coming
weekend or during a weekend a few months later. Participants were presented
with a list of 38 objects that were related to the trip and were asked to organize
them in as many different categories as they wished. The result was that the
number of categories people used for the distant-future camping trip was lower
than for the near-future trip. This supports the theory’s idea that distant-future
events consist of more abstract features, while near-future events consist of
more detailed, concrete features.
12

In study 3, Liberman et al (2002) looked at expectations about good and bad
days in the near of distant future. A good day would consist of mainly positive
experiences, while a bad day would obviously consist of mainly negative
experiences. After having participants describe what they would think of as a
good or bad day in the near of distant future, and also rating the valence of the
events during such a day, the following conclusions were made. First, near-future
days consisted of more diverse expected experiences than distant-future days.
Secondly, expected experiences in the distant-future were more extreme than in
the near-future, making a good (bad) day in the future better (worse) than a
good (bad) day tomorrow. Future good and bad days showed less diversity of
experiences in each type of day and at the same time a future good day would be
more different from a future bad day compared to near-future good and bad
days.
3.3 Changes in Attitude As Time Goes By
As said, distant future activities are more represented by high-level
features and near future activities more by low-level features. This means that as
temporal distance to an event decreases, low-level features become more
important relative to high-level ones.
Besides being high-level or low-level, features can be labeled as being either
positive or negative. Positive features increase the value of an event while
negative features decrease the value. A positive feature of a soon to be held
concert may be the fact that the concert will be held at a venue very close to
home. Conversely, a negative feature could be that the concert is held at a far-
away venue. The distance to home is considered to be a peripheral and incidental
feature, therefore low-level. According to Construal Level Theory, when the
concert is still in the distant future, the distance to the venue is not yet a big
factor in deciding whether or not attend the concert. A high-level feature, such as
whether or not you are a big fan of the band that is playing, plays a more
important role. However, as time goes by, the distance that needs to be traveled
becomes a more practical matter, and gains importance in the decision-making
13

process relative to the level of the idolization of the artist. Therefore, a concert of
your favorite band far away from home might initially sound very appealing, but
as time goes by, and the realization comes that a long travel is necessary to get
there, the level of appeal decreases. The probability that someone will attend a
concert of a band he or she is not that big a fan of but is close to home might
increase as time goes by. In both cases it then becomes a matter of relative
importance of the two factors that will lead to a decision whether or not to go.
Liberman and Trope (1998) conclude from this: “the overall value of a distant
future event should be closer to the value associated with its high-level
construal, whereas the overall value of a near future event should be closer to
the value associated with its low-level construal”.
3.4 Interaction Effects
Kim, Zhang, and Li (2008) focused on multiple dimensions of
psychological distance to study the interaction effect. Their experiment was to
find out how social and temporal distances interact when it comes to the
formation of representations and evaluations of certain events or products. They
stress that consumers and marketers are regularly faced with decisions in which
more than one type of distance plays a role; planning a trip for yourself versus
for someone else for the coming weekend versus a weekend a year from now, for
example. Their main conclusion is that when two dimension of distance are
present and both of them are proximal, low-level construals are of main
influence on consumer evaluations. However, when either one or both
dimensions became distal, high- level construals gained importance.
Bloquiaux (2010) researched how temporal distance affected consumers’
evaluations of different travel offers and also how previous experience in
booking vacations interacted with temporal distance. Participants were faced
with either one of two different travel offers; the first had positive high-level and
negative low-level features, the second had negative high-level and positive low-
level features. Furthermore, there was a variation in temporal distance; last
minute (departure 7 days from now) vs. a regular booking (departure 365 days
14

from now). Results showed that the main cause in different ratings of the offers
lies in the difference in travel description and not in the temporal distance. The
offers with the positive high-level features and negative low-level features were
preferred to the offers with negative high-level and positive low-level features,
no matter the temporal distance. Theoretically and practically this is not
surprising. Since high-level features can be seen as the primary and most goal-
relevant features of a vacation, it can be expected that any vacation will be rated
less compared to a vacation with better high-level features. Making secondary,
goal irrelevant features more positive will not make a huge difference, and the
results confirmed this. I believe that the method of testing the Construal Level
Theory was not optimal in this research. The main reason for this is because the
two different travel offers were different on both level of construal, the high and
low levels, in one step. Therefore, I believe that the rejection of the Construal
Level Theory hypothesis in Bloquiaux’s work is not a convincing argument
against it in the tourism-marketing field. In my thesis, I want to research whether
Construal Level Theory holds in this field by only changing the features of one of
the two levels of construal at a time, while holding the other constant.
3.5 Contribution of this Thesis
The main focus point of this thesis is to test whether or not Construal
Level Theory holds in the tourism-marketing field by measuring the change in
response to vacations when they vary in high-level or low-level features, and
temporal distance. According to Construal Level Theory, low-level features are
more decisive in near future situations while high-level features are more
important for decision making in the distant future. Therefore, a change in low-
level features should have a larger impact in the near future compared to a same
change in a distant future situation. A change in high-level features should then
have a larger effect in distant future situations compared to a same change in the
near-future situation. Therefore, two hypotheses of this thesis are as follows:
15

H1: A change in the low-level features of a vacation, ceteris
paribus, has more impact on its evaluation when the
departure date is three days from now, compared to a
vacation for which the departure date is one year from
now.
H2: A change in the high-level features of a vacation, ceteris
paribus, has more impact on its evaluation when the
departure date is one year from now, compared to a
vacation for which the departure date is three days from
now.
16

4.0 Method of Testing
4.1 Previous Experiments as Base
The experiment designed to research the Construal Level Theory in
tourism-marketing finds its practical base in two last discussed papers. The first
one is by Kim, Zhang & Li (2008), and the second by Bloquiaux (2010).
In their paper, Kim et al (2008) focus on multiple dimensions of psychological
distance and how they interact with each other. They researched the interaction
effect of temporal and social distance on consumer evaluations of products. They
hypothesized that when those two dimensions of psychological distance are
involved in an event or product, they interactively influence the events’
evaluations. Only when both dimensions are proximal (e.g. for self and in the
near future), evaluations would be more associated with the low-level
construals. As soon as either one or both dimensions become distal (e.g. for
another and/or in the distant future), values associated with high-level
construals are more of influence on the evaluations.
In experiment 1 they had participants rate two versions of an online training
program; one with positive high-level and negative low-level features, the other
with negative high-level and positive low-level features. Furthermore,
participants were divided into groups where they either had to give their own
ratings or predict how another student whom they didn’t know would rate the
program (social distance variation), and where the program would either be
available tomorrow or next year (temporal distance variation). After reading the
descriptions about programs, the participants evaluated the programs measured
on four items: bad versus good, favorability, satisfaction, and usefulness; all
measured on a 9-point scale.
This method of rating products was also used by Bloquiaux (2010) in her
research about a three-way interaction effect on the evaluation of different
vacations. The three factors considered were, firstly, the experience people had
17

in booking vacations, secondly the temporal distance to the vacation, and thirdly
the different travel descriptions. Relevant for the method of conducting the
experiment in this thesis was the way Bloquiaux varied the different vacations by
changing high-level and low-level features.
To determine which features of a vacation are considered to be high-level, and
which features are considered to be low-level, Bloquiaux conducted a pre-test. A
list of possible vacation features was presented to the participants which were
then rated by them on five levels; to what extent the feature was a primary,
essential, central, critical, and goal-relevant attribute when it comes to booking a
vacation. This is the same method as Kim et al (2008) in their second
experiment, though the product was different. Fourteen different features were
rated. Results showed that the fitness facilities, room service, medical
requirements in the form of vaccinations, and the distance to the airport were
the four most significant features considered to be low-level. The four most
significant high-level features were the possibility to participate in excursions
and activities, the star rating of the hotel, the presence of a swimming pool, and
the possibility to discover a new culture and environment. Bloquiaux finally
decided to use the two high-level features “the possibility to participate in
excursions and activities” and “the star rating of the hotel”, and the two low-level
features “distance to the airport” and “medical requirements” for her main
research. These four features will also be the four features relevant in this
experiment.
In the main research, participants were asked to rate a travel offer, which
consisted of the four (two high-level, two low-level) features. Bloquiaux had the
participants rate the offer on the same four measures as Kim et al (2008) in their
first experiment, and added a fifth one: a question rating the matter of
attractiveness. Participants were divided in four groups, two of which concerned
the near future, the other two the distant future situations. Within each temporal
group, participants were asked to rate a vacation with positive high-level and
negative low-level features, or a vacation with negative high-level and positive
low-level features. Table 4.1 shows this in a structured form.
18

Bloquiaux’s hypothesis concerning the construal level theory was that the
participants in Group II and III would evaluate the vacation higher than the
participants in Group I and IV. The result was that Group I and III were the ones
with the higher evaluations. In other words, high-level features are preferred to
low-level features, no matter if the vacation is in the near or the distant future. In
paragraph 3.4 I already explained why this is not surprising.
4.2 Hypotheses
The main difference between Bloquiaux’s experiment and the one in this
thesis lies in the column part of Table 4.1. Where Bloquiaux measured the
difference between a vacation with positive high-level and negative low-level
features and a vacation with the opposite of features, I will measure the
difference in evaluations when only the high-level or only the low-level features
change and the other remains constant. See Table 4.2.
Per group, Bloquiaux measured the evaluations of the vacations themselves. In
my research, I will measure the change in evaluation of a vacation. Other minor
but already clear differences in the experiment are in defining the near future. I
chose a period of three days in order to make it even more apparent that the
vacation is in the near future.
19
For the sake of convenience I will now repeat my hypothesis and also explain
them using Table 4.2.
H1: A change in the low-level features of a vacation, ceteris
paribus, has more impact on its evaluation when the
departure date is three days from now, compared to a
vacation for which the departure date is one year from
now.
H2: A change in the high-level features of a vacation, ceteris
paribus, has more impact on its evaluation when the
departure date is one year from now, compared to a
vacation for which the departure date is three days from
now.
Hypothesis 1 states that the change in the evaluations of a vacation derived from
a change in the low-level features of that vacation, will be larger if the vacation
has a departure date three days from now, compared to a vacation one year from
now. This means that the change measured in Group I is expected to be larger
than the change measured in Group III.
Hypothesis 2 states that the change in the evaluations of a vacation derived from
a change in the high-level features of that vacation, will be larger if the vacation
has a departure date one year from now, compared to a vacation three days from
now. This means that the change measured in Group IV is expected to be larger
than the change measured in Group II.
4.3 The Questionnaire
To conduct this experiment, a standard questionnaire was designed of
which four different versions were made. The only difference between the
different versions is found in the temporal distance factor and the change in
20

either the high-level or the low-level features. The questionnaires can be found
in the appendix.
The questionnaire can be divided in seven sections:
1. Introduction
2. Explanation of variables
3. Evaluation of vacation before change of features
4. Evaluation of vacation after change of features
5. Control questions
6. Demographics
7. Thank you
In the first section the participants were welcomed, thanked in advance for their
participation, and told how many questions they could expect. A headline in the
top of the screen immediately indicated the topic of the questionnaire and which
temporal distance was in effect (either departure in 3 days or 1 year from now).
In the second section the situation was described a bit further and an
explanation was given about the four features that would be dealt with.
Concerning the star rating of the hotel it was important to make sure that the
rating would reflect the opinion of the participant. For instance, if a hotel would
have a five-star rating, the hotel should be the perfect hotel in the mind of the
participant. Personal experience has learned that sometimes stars are given
where they are not appropriate, and therefore results might be influenced.
Also noteworthy is the description of the medical requirements. It was important
to stress that the vaccinations for this vacation still needed to be gotten before
the vacation and that previous vaccinations were not sufficient for this trip. This
to make sure that all the participants had the idea that, if relevant, the
vaccinations were still necessary.
21

The final note of the introduction was about money. Since the purpose of this
experiment is to single out the effects of the change in the features of the
vacation and the temporal distance, it is important to cancel the effect that
money can have on the situation. Therefore the participants were told that
money is not a relevant factor and that they should evaluate the vacations purely
on the features shown, not on a value-for-money basis.
The third and forth section are similar to each other and is where the
questionnaire really starts. In both, participants are presented with a vacation
described by the four features. The vacation in section three is the before-change
version, the vacation in section four has either low-level features that are
changed or high-level features that are changed. The features that did not change
are kept at an average level.
The first three questions the participants were asked to answer were based on
the questions Kim et al (2008) and Bloquiaux (2010) used in their research. On a
9-point scale participants were asked what their first impression was about this
vacation, how satisfied they think they would be, and to what extent they felt
appealed to this vacation. Adding to this, participants were asked to rate the
vacation based on the shown features on a scale from 1 to 100. The section’s last
question was if they would book the vacation in real life or not (no, probably not,
I don’t know, probably, yes).
On the next page, participants were told that due to a mistake at the travel
agency they were misinformed about either the star rating of the hotel and the
number and variety of excursions and activities (high-level features) or the
required vaccinations and the airport of departure (low-level features). In either
case the change resulted in an improvement of the features. Participants were
then asked to rate the improved vacation using the same exact questions as for
the vacation before. As a reminder the features of the first vacation were listed as
well.
22

The fifth part of the questionnaire consisted of a number of control questions.
First in order to make sure that the participants regarded “3 days from” as near
future, and “1 year from now” as distant future when it comes to leaving for
vacation. Next the participants were asked to rank the four features used to
23

Version 1: Change in the low-level features.
Version 2: Change in the high-level features.
24
describe the vacation from “adding most value to the vacation” to “adding least
value to the vacation”. The more value a feature adds to a vacation, the more
primary or goal-relevant a feature can be regarded as, and the more a feature can
be treated as a high-level one.
The last section consisted of a number of demographic questions, after which the
results were submitted. After that the participants were thanked again for their
participation.
25

5.0 Data
5.1 Population
The four versions of the questionnaire were posted online and with the
help of social media platforms participants were invited to participate with an
incentive of winning a large poster of a photo of their choice. A total of 134
people participated in the experiment. Since the population is defined as people
who are likely to book a travel, the population is very broad. However, in order
to make sure the participants are familiar with booking vacations, participants
were asked about their travel frequency. One participant was dropped from the
sample who indicated to travel less than twice per year. That resulted in a total
of 65 males and 68 females from 15 different countries of which a majority of
74,4% coming from the Netherlands. Ages ranged from 16 to 67 years, all
indicating that they travel at least once every two years, and averaging 27.55
years with a standard deviation of 7.688 years.
5.2 Control Questions
5.2.1 High-level and Low-Level Features
The first thing to make sure of is to check whether or not the participants
considered the four different features to be high-level or low-level. Questions 12
through 15 were created to test this. Participants were asked to rank the features
from adding
most to least
value to the
vacation. A one-
sample t-test
was performed to look at the different means and at the 95%-confidence
intervals. Results show that the star rating of the hotel (Hotel) and the number
and variety of activities and excursions (Activities) are clearly rated as more
26

important compared to the required vaccinations (Vaccinations) and the distance
to the airport of departure (Distance). The more important the participants
regard a certain feature to be, the more primary or goal-relevant the feature is to
a vacation. Therefore Hotel and Activities can indeed be seen as high-level
features.
5.2.2 Perception of Temporal Distance
The second thing to make sure of is whether or not the participants
regard a departure in three days to be in the near future and a departure in one
year to be in the distant future. Since two different groups of people were
assigned to either a near- or distant-future situation, an independent-means t-
test should provide the answer to this.
Levene’s test for Equality of Variances gave a significance level of .399 and is
therefore insignificant resulting in the assumption that the variances are equal.
On average, and as expected, participants regard 3 days from now (M = 2.78 on a
9-point scale, SE = .199) to be closer in the future than 1 year (M = 7.27 on a 9-
point scale, SE = .215). This difference is highly significant t(131) = -15.235,
p<.05.
The mean difference is -4.483 with a standard error of difference of 0.293. The t-
statistic is -15.325 and is highly significant with a significance value of 0.000.
That makes the r-value equal to .801, from which can be concluded that the
difference in time perception is large as the benchmark for a large effect is .5
(Field, 2009).
We can make the following conclusions:
The star rating of the hotel and the number and variety of activities and
excursions are regarded as high-level features.
The number of required vaccinations and the distance to the airport of
departure are regarded as low-level features.
27

Leaving for vacation three days from now is regarded as being near
future, leaving for vacation one year from now is regarded as being
distant future.
5.3 Measuring the Differences
Now that the control questions provided us with the confirmation of the
high- and low-level features and the time perception, we can continue analyzing
the data for the vacation evaluations. The participants were asked to rate two
vacations of which the second one had either improved high-level or improved
low-level features on a 9-point scale. The difference between these two ratings is
caused by the effect of the change in the features. By subtracting the rating of the
first vacation from the rating of the second vacation, we are left with the numeric
value of this effect.
According to Construal Level Theory, when it comes to the low-level feature
improvements, the average change in evaluation should be larger for the
vacation in the near future compared to the change resulting from the same
improvements of the vacation in the distant future. Conversely, when the
improvements are made in the high-level features, the average change in
evaluation should be larger for the vacation in the distant future compared to the
change resulting from the same improvements for the vacation in the near
future.
The vacations were rated on first impression, expected satisfaction, and level of
appeal. Also, participants gave a score on a scale from 1 to 100 and they
indicated the probability that they would book the vacation in real life. By
conducting independent-means t-tests we can compare the means of the changes
and conclude whether or not the theory holds.
28

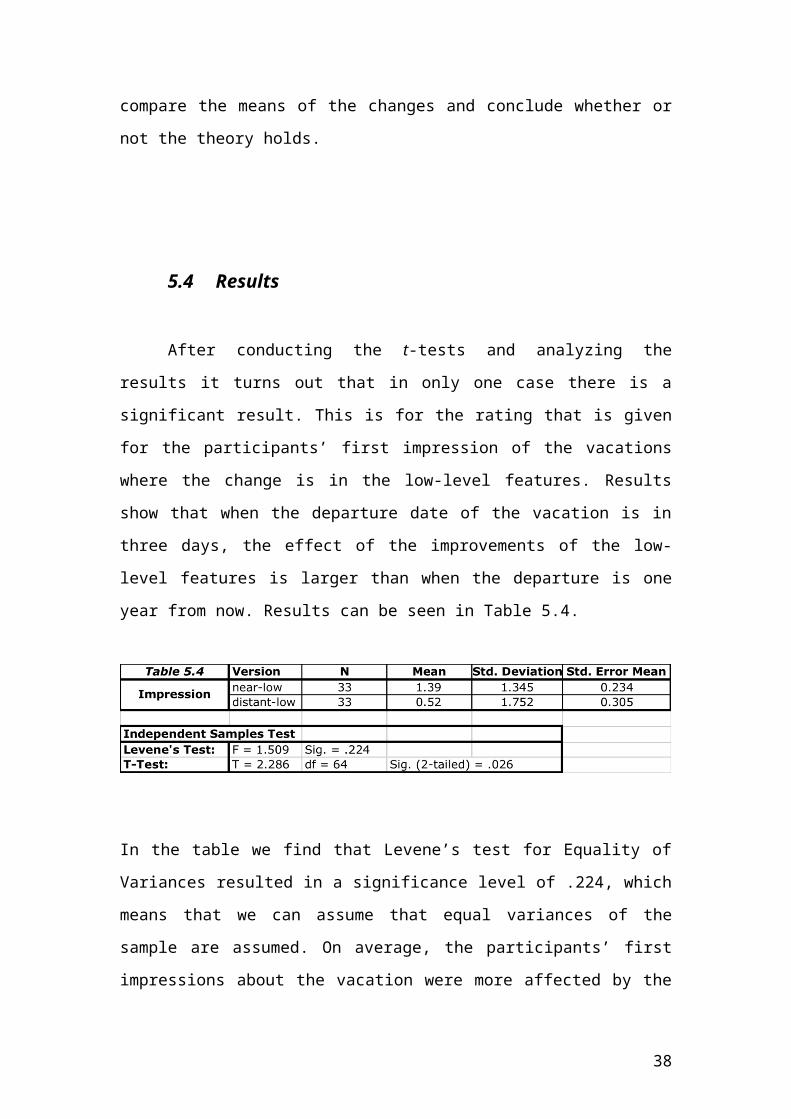
5.4 Results
After conducting the t-tests and analyzing the results it turns out that in
only one case there is a significant result. This is for the rating that is given for
the participants’ first impression of the vacations where the change is in the low-
level features. Results show that when the departure date of the vacation is in
three days, the effect of the improvements of the low-level features is larger than
when the departure is one year from now. Results can be seen in Table 5.4.
In the table we find that Levene’s test for Equality of Variances resulted in a
significance level of .224, which means that we can assume that equal variances
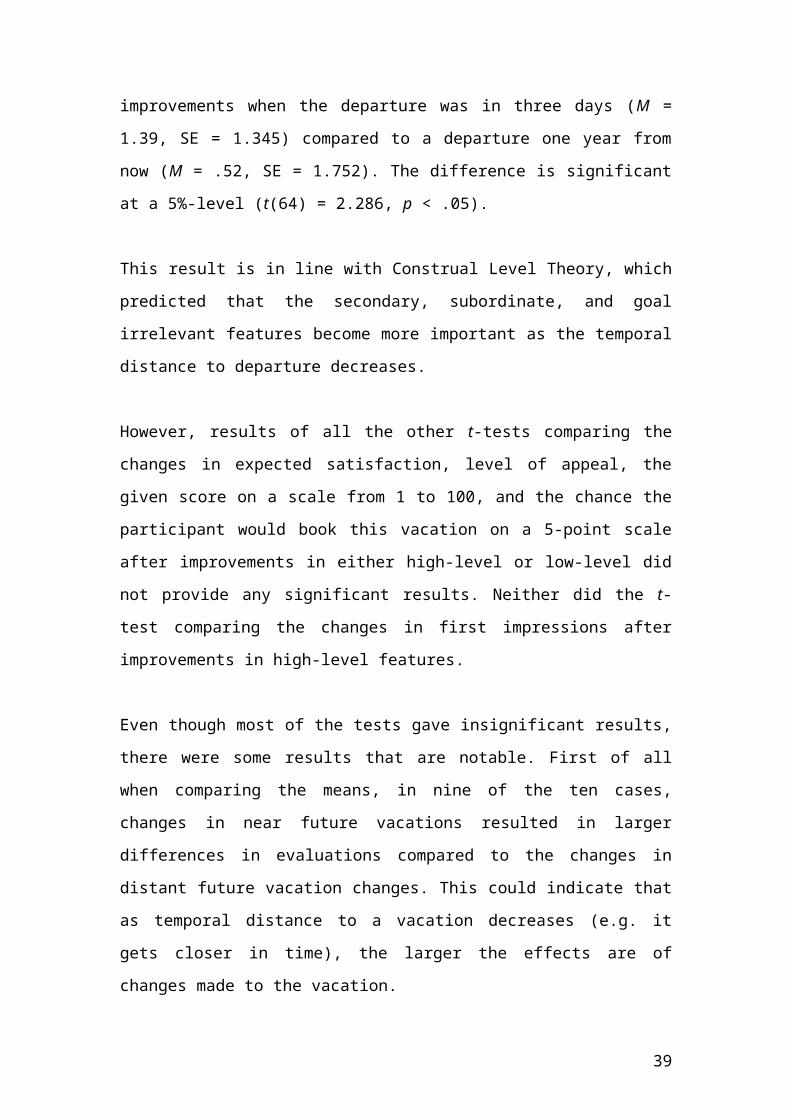
of the sample are assumed. On average, the participants’ first impressions about
the vacation were more affected by the improvements when the departure was
in three days (M = 1.39, SE = 1.345) compared to a departure one year from now
(M = .52, SE = 1.752). The difference is significant at a 5%-level (t(64) = 2.286, p
< .05).
This result is in line with Construal Level Theory, which predicted that the
secondary, subordinate, and goal irrelevant features become more important as
the temporal distance to departure decreases.
However, results of all the other t-tests comparing the changes in expected
satisfaction, level of appeal, the given score on a scale from 1 to 100, and the
chance the participant would book this vacation on a 5-point scale after
improvements in either high-level or low-level did not provide any significant
results. Neither did the t-test comparing the changes in first impressions after
improvements in high-level features.
29

Even though most of the tests gave insignificant results, there were some results
that are notable. First of all when comparing the means, in nine of the ten cases,
changes in near future vacations resulted in larger differences in evaluations
compared to the changes in distant future vacation changes. This could indicate
that as temporal distance to a vacation decreases (e.g. it gets closer in time), the
larger the effects are of changes made to the vacation.
The second result that is noticeable is that for each category (first impression,
expected satisfaction, etc.) the size of the difference in evaluation was larger
when the high-level features changed compared to when the low-level features
changed. However, even if the results were significant, this does not necessarily
mean that high-level features are more decisive for an evaluation than the low-
level features. In this case it would merely mean that the an upgrade from a 2-
star to a 4-star hotel combined with an upgrade from a limited number to many
and various excursions and activities is regarded as a larger improvement than
the combination of a decrease of 2.5 hours in travel time to the airport of
departure and needing zero instead of two medical vaccinations. Basically, this is
comparing apples to oranges, and this was not the aim of the experiment.
30

6.0 Conclusions
6.1 Theoretical Conclusions
With the experiment that has just been discussed, an attempt was made to
find out whether or not the Construal Level Theory holds in the tourism-
marketing industry. We tested the following hypotheses:
H1: A change in the low-level features of a vacation, ceteris
paribus, has more impact on its evaluation when the
departure date is three days from now, compared to a
vacation for which the departure date is one year from
now.
H2: A change in the high-level features of a vacation, ceteris
paribus, has more impact on its evaluation when the
departure date is one year from now, compared to a
vacation for which the departure date is three days from
now.
Ten independent-means t-tests were conducted to compare the mean change in
vacation evaluations after a change in the low-level or the high-level features.
These ten t-tests were equally divided among the two possible changes in the
vacations (either the low-level features or the high-level features changed) and
were conducted for the change in the following factors:
1) First impression
2) Expected satisfaction
3) Level of appeal
4) Score of the vacation on a scale from 1 to 100
5) The chance the participant would book the vacation in real life, on a 5-
point scale.
31

In only one of the 10 tests a significant result was found. The change in
participants’ first impressions after a change in the low-level features changed
more for a vacation in the near future compared to the same feature-changes in
the distant future. This is in line with Construal Level Theory. However, because
in all nine other tests we couldn’t find any significant results it would be too
much to conclude from this that Construal Level Theory holds in the tourism
industry. Moreover, we can reject hypothesis 2, because for the high-level
feature changes, no significant results were found at all.
The main conclusion from this experiment is that, overall, there is no
relationship between temporal distance and way changes in vacations are being
evaluated and that Construal Level Theory does not hold in this situation.
6.2 Limitations and Future Research
The circumstances this experiment was conducted under are subject to a
number of limitations, which may have had an influence on the results. The most
important limitation is one that is similar to the one Gilovich, Kerr, and Medverc
(1993) had as comment on Nisan’s work from 1972, discussed in section 2.2.
That is, the participants who were randomly assigned to the hypothetical
vacation in three days may not have been in the same mental state as they would
have been in if they actually would have gone on a vacation in three days. It is
nearly impossible to replicate that same mind condition. However, by really
putting an accent on it and repeating it several times throughout the experiment,
a serious attempt was made to replicate this mind state as well as possible. The
same holds for replicating the mind-set for people who are leaving for a vacation
in one year.
Also, due to timing constraints, the experiment was conducted as soon as each of
the four versions had at least thirty participants who submitted usable data.
Even though this might be enough to show statistical differences, if there had
been more participants, this would have made the results more precise.
32

This research has opened up a door to future research in a number of ways. First
of all, for travel agencies it might be interesting to research which changes to
which features could be made at a certain point in time in order to pull a
customer over the line and convince them to book a vacation. Customers might
be more sensitive to a change in a certain feature when the vacation is a last-
minute vacation than when it is a regular vacation. Changes could be used as
persuasion instruments. In order to conduct such a research it will be very
important to conduct it with real customers who are actually in the correct state
of mind.
Just because results of this experiment were not in favor of Construal Level
Theory for the tourism-marketing industry, it obviously does not mean that the
theory does not hold in other industries. It is important not to generalize,
especially because the method of testing in this thesis had some limitations.
33

References
Bloquiaux, L. (2010), “The Construal Level Theory for Last-Minutes vs. Regular Bookings”.
Buhler, R., Griffin, D. & Ross, M. (1994). “Exploring the “planning fallacy”: Why people underestimate their task completion times. Journal of Personality and Social Psychology, 36, 917-927. In Liberman & Trope (1998).
Carver, C. & Scheier, M. (1981). “Attention and self-regulation: A control theory approach to human behavior.” New York: Springer-Verlag.
Carver, C. & Scheier, M. (1990). “Principles of self-regulation.” In Liberman & Trope (1998)
Dahl, Ö. (1983). “Temporal Distance: remoteness distinctions in tense-aspect systems. “Linguistics: Volume 21, Issue 1, Pages 105-122.
Elster, J., & Loewenstein, G. (1992). “Utility from memory and anticipation.” In Liberman & Trope (1998).
Field, A. (2009). “Discovering Statistics Using SPSS.” Third Edition
Freitas, A., Solavey, P., and Liberman, N. (2001).“Abstract and concrete self-evaluative goals.” Journal of Personality and Social Psychology, 80, 410-412. In Liberman, N. & Trope, Y. (2003).
Gilovich, T., Kerr, M. & Medverc, V (1993). “Effect of Temporal Perspective on Subjective Confidence”. Journal of Personality and Social Psychology, Vol. 64, No. 4, 552-560.
Hampson, S., John, O. & Goldberg, L. (1986). “Category breadth and hierarchical structure in personality: Studies of asymmetries in judgments of trait implications. Journal of Personality and Social Psychology, 51, 37-54. In Liberman & Trope (1998).
Kim, K., M. Zhang, and X. Li (2008). “Effects of Temporal and Social Distance on Consumer Evaluations.” Journal of Consumer Research: Volume 35, December 2008.
Liberman, N. & Trope, Y. (1998). “The Role of Feasibility and Desirability Considerations in Near and Distant Future Decisions: A Test of Temporal Construal Theory”. Journal of Personality and Social Psychology, Vol. 75, No. 1, 5-18.
34
Liberman, N. & Trope, Y. (2003).“Temporal Construal”. Psychological Review: Volume 110, No. 3, 403-421.
Liberman, N., Trope, Y. & Wakslak, C. (2007). “Construal Level Theory and Consumer Behavior”. Journal of Consumer Psychology, 17(2), 113-117.
Loewenstein, G. (1987). “Anticipation and the valuation of delayed consumption.” The Economic Journal, 97, 666-684. In Liberman & Trope (1998).
Nisan, M. (1972), “Dimension of Time in Relation to Choice Behavior and Achievement Orientation”. Journal of Personality and Social Psychology, Vol. 21, No. 2, 175-182.
Sagristano, M., Trope, Y., and Liberman, N. (2002).“Time-dependent gambling: Odds now, money later. Journal of Experimental Psychology: General, 131, 364-376. In Liberman, N., Trope, Y. & Wakslak, C. (2007).
Vallacher, R., & Wegner, D. (1987).“What do people think they’re doing? Action identification and human behavior.” Psychological Review, 94, 3-15.
35
Appendix
Appendix A: Questionnaires
Appendix B: Data Tables
36
Appendix B: Data Tables
Test Temporal Distance:
Group Statistics
Near future or Distant
Future? N Mean Std. Deviation Std. Error Mean
Time Perceptiondimension1
Near Future 69 2.78 1.653 .199
Distant Future 64 7.27 1.720 .215
Independent Samples Test
Levene's
Test for
Equality of
Variances t-test for Equality of Means
F Sig. t df
Sig.
(2-
tailed)
Mean
Difference
Std. Error
Difference
95%
Confidence
Interval of the
Difference
Lower Upper
Time
Perception
Equal
variances
assumed
.715 .399 -
15.325
131 .000 -4.483 .293 -5.062 -3.904
Equal
variances
not
assumed
-
15.301
129.264 .000 -4.483 .293 -5.063 -3.903
37
T-Test First Impression
Near-low vs. Distant-lowGroup Statistics
Version N Mean Std. Deviation Std. Error Mean
Impression Difference near-low 33 1.39 1.345 .234
distant-low 33 .52 1.752 .305
Independent Samples Test
Levene's
Test for
Equality of
Variances t-test for Equality of Means
F Sig. t df
Sig.
(2-
tailed)
Mean
Difference
Std. Error
Difference
95%
Confidence
Interval of the
Difference
Lower Upper
Impression
Difference
Equal
variances
assumed
1.509 .224 2.286 64 .026 .879 .385 .111 1.647
Equal
variances
not
assumed
2.286 59.990 .026 .879 .385 .110 1.648
38
Near-high vs. Distant-high
Group Statistics
Version N Mean Std. Deviation Std. Error Mean
Impression Difference near-high 35 2.00 2.262 .382
distant-high 30 1.50 1.408 .257
Independent Samples Test
Levene's
Test for
Equality of
Variances t-test for Equality of Means
F Sig. t df
Sig.
(2-
tailed)
Mean
Difference
Std. Error
Difference
95%
Confidence
Interval of the
Difference
Lower Upper
Impression
Difference
Equal
variances
assumed
1.092 .300 1.048 63 .298 .500 .477 -.453 1.453
Equal
variances
not
assumed
1.085 57.831 .282 .500 .461 -.422 1.422
39

T-Test SatisfactionNear-low vs. Distant-low
Group Statistics
Version N Mean Std. Deviation Std. Error Mean
Satisfaction Difference near-low 33 .79 1.293 .225
distant-low 33 .64 1.388 .242
Independent Samples Test
Levene's
Test for
Equality of
Variances t-test for Equality of Means
F Sig. t df
Sig.
(2-
tailed)
Mean
Difference
Std. Error
Difference
95%
Confidence
Interval of the
Difference
Lower Upper
Satisfaction
Difference
Equal
variances
assumed
.147 .703 .459 64 .648 .152 .330 -.508 .811
Equal
variances
not
assumed
.459 63.683 .648 .152 .330 -.508 .811
40

Near-high vs. Distant-high
Group Statistics
Version N Mean Std. Deviation Std. Error Mean
Satisfaction Difference near-high 35 2.06 2.274 .384
distant-high 30 1.63 1.564 .286
Independent Samples Test
Levene's
Test for
Equality of
Variances t-test for Equality of Means
F Sig. t df
Sig.
(2-
tailed)
Mean
Difference
Std. Error
Difference
95%
Confidence
Interval of the
Difference
Lower Upper
Satisfaction
Difference
Equal
variances
assumed
.833 .365 .861 63 .393 .424 .493 -.560 1.408
Equal
variances
not
assumed
.885 60.338 .380 .424 .479 -.534 1.382
41

T-Test Appeal
Near-low vs. Distant-low
Group Statistics
Version N Mean Std. Deviation Std. Error Mean
Appeal Difference near-low 33 1.30 1.531 .266
distant-low 33 .85 1.253 .218
Independent Samples Test
Levene's
Test for
Equality of
Variances t-test for Equality of Means
F Sig. t df
Sig.
(2-
tailed)
Mean
Difference
Std. Error
Difference
95%
Confidence
Interval of the
Difference
Lower Upper
Appeal
Difference
Equal
variances
assumed
.886 .350 1.320 64 .192 .455 .344 -.233 1.142
Equal
variances
not
assumed
1.320 61.598 .192 .455 .344 -.234 1.143
42

Near-high vs. Distant-high
Group Statistics
Version N Mean Std. Deviation Std. Error Mean
Appeal Difference near-high 35 2.51 2.418 .409
distant-high 30 1.93 1.507 .275
Independent Samples Test
Levene's
Test for
Equality of
Variances t-test for Equality of Means
F Sig. t df
Sig.
(2-
tailed)
Mean
Difference
Std. Error
Difference
95%
Confidence
Interval of the
Difference
Lower Upper
Appeal
Difference
Equal
variances
assumed
3.046 .086 1.139 63 .259 .581 .510 -.438 1.600
Equal
variances
not
assumed
1.179 57.870 .243 .581 .493 -.405 1.567
43

T-Test ScoreNear-low vs. Distant-low
Group Statistics
Version N Mean Std. Deviation Std. Error Mean
Score Difference near-low 33 9.73 8.247 1.436
distant-low 33 9.85 25.721 4.477
Independent Samples Test
Levene's
Test for
Equality of
Variances t-test for Equality of Means
F Sig. t df
Sig.
(2-
tailed)
Mean
Difference
Std. Error
Difference
95%
Confidence
Interval of the
Difference
Lower Upper
Score
Difference
Equal
variances
assumed
4.821 .032 -.02
6
64 .980 -.121 4.702 -9.515 9.272
Equal
variances
not
assumed
-.02
6
38.511 .980 -.121 4.702 -9.636 9.393
44

Near-high vs. Distant-high
Group Statistics
Version N Mean Std. Deviation Std. Error Mean
Score Difference near-high 35 23.06 23.276 3.934
distant-high 30 17.83 15.182 2.772
Independent Samples Test
Levene's
Test for
Equality of
Variances t-test for Equality of Means
F Sig. t df
Sig.
(2-
tailed)
Mean
Difference
Std. Error
Difference
95%
Confidence
Interval of the
Difference
Lower Upper
Score
Difference
Equal
variances
assumed
2.075 .155 1.052 63 .297 5.224 4.967 -4.701 15.149
Equal
variances
not
assumed
1.085 59.067 .282 5.224 4.813 -4.406 14.854
45

T-Test Booking ChanceNear-low vs. Distant-low
Group Statistics
Version N Mean Std. Deviation Std. Error Mean
Booking Chance Difference near-low 33 .73 .944 .164
distant-low 33 .39 .864 .150
Independent Samples Test
Levene's
Test for
Equality of
Variances t-test for Equality of Means
F Sig. t df
Sig.
(2-
tailed)
Mean
Difference
Std. Error
Difference
95%
Confidence
Interval of the
Difference
Lower Upper
Booking
Chance
Difference
Equal
variances
assumed
.250 .619 1.496 64 .140 .333 .223 -.112 .778
Equal
variances
not
assumed
1.496 63.497 .140 .333 .223 -.112 .779
46

Near-high vs. Distant-high
Group Statistics
Version N Mean Std. Deviation Std. Error Mean
Booking Chance Difference near-high 35 1.29 1.274 .215
distant-high 30 1.07 1.112 .203
Independent Samples Test
Levene's
Test for
Equality of
Variances t-test for Equality of Means
F Sig. t df
Sig.
(2-
tailed)
Mean
Difference
Std. Error
Difference
95%
Confidence
Interval of the
Difference
Lower Upper
Booking
Chance
Difference
Equal
variances
assumed
.963 .330 .732 63 .467 .219 .299 -.379 .817
Equal
variances
not
assumed
.740 62.972 .462 .219 .296 -.372 .810
47