jpmorgan indian investment trust rukhshad shroff,...
TRANSCRIPT

JPMorgan Indian Investment Trust
Annual General Meeting
29 January 2015
Rukhshad Shroff, CFA
Managing Director

2
JIIT AGM_Jan2015.pptx
JPMorgan Indian Investment Trust
Performance update
JPM Indian – NAV* +43.7 +59.9 +39.6 +276.5 +496.1
MSCI India Index# +31.6 +49.6 +18.1 +262.2 +269.6
Excess Return +9.2 +6.9 +18.2 +3.9 +61.3
1 Year 3 Years 5 Years 10 Years Since Inception^
% % % % %
Cumulative Performance (%)
^ Inception: 1/7/94. # MSCI India (NDR); Prior to 1 Oct 03, BSE100
Source: J.P. Morgan Asset Management, MSCI, Thomson Reuters Datastream. Performance data has been calculated on NAV to NAV basis, including ongoing charges and any applicable fees,
with any income reinvested, in GBP.
Past performance is not an indication of future performance.
As at 31 Dec 2014

3
JIIT AGM_Jan2015.pptx
JPMorgan Indian Investment Trust
Performance update
# MSCI India (NDR); Prior to 1 Oct 03, BSE100
Source: J.P. Morgan Asset Management, MSCI, Thomson Reuters Datastream. Performance data has been calculated on NAV to NAV basis, including ongoing charges and any applicable fees,
with any income reinvested, in GBP.
Past performance is not an indication of future performance.
Quarterly Rolling 12m Performance ending December 2014 (%)
2000
%
2001
%
2002
%
2003
%
2004
%
2005
%
2006
%
2007
%
2008
%
2009
%
2010
%
2011
%
2012
%
2013
%
2014
%
JPM Indian – NAV* -16.1 -20.1 -10.3 +78.5 +20.5 +60.6 +32.4 +63.7 -49.5 +53.5 +29.0 -32.3 +18.9 -6.4 +43.7
MSCI India Index# -22.1 -23.9 -2.8 +72.2 +11.1 +53.9 +32.5 +70.2 -51.0 +80.6 +24.8 -36.7 +20.4 -5.6 +31.6
Excess Return +7.7 +5.0 -7.7 +3.7 +8.5 +4.4 -0.0 -3.8 +3.0 -15.0 +3.4 +7.0 -1.3 -0.9 +9.2
As at 31 Dec 2014

4
JIIT AGM_Jan2015.pptx
JPMorgan Indian Investment Trust
Cumulative performance since launch
Source: Bloomberg, J.P. Morgan Asset Management, Thomson Reuters Datastream
Source: NAV Performance data has been calculated on NAV to NAV basis, including ongoing charges and
any applicable fees, with any income reinvested, in GBP.. Inception: 1/7/94. Rebased to 100 in 1994
Past performance is not an indication of future performance.
0
100
200
300
400
500
600
94 95 96 97 98 99 00 01 02 03 04 05 06 07 08 09 10 11 12 13 14
JPM Indian IT (NAV)
JPM Indian IT (Share Price)
MSCI India (NDR) (Prior to 1 Oct 03, BSE100)
As at 31 December 2014
Pence per Share

5
JIIT AGM_Jan2015.pptx
Top 10 contributors/detractors to active returns
Average Average Contributions
Fund Benchmark^ Stock to Active
Top 10 Contributors Weight % Weight % Return % Return %
Average Average Contributions
Fund Benchmark^ Stock to Active
Top 10 Detractors Weight % Weight % Return % Return %
12 months as at 31 Dec 2014
Past performance is not indicative of future performance. The companies/securities above are shown for illustrative purposes only. Their inclusion should not be
interpreted as a recommendation to buy or sell. However, it cannot be assumed that these types of investments will be available to or will be selected by the fund in
the future. Subject to change at the discretion of the Investment Manager without notice.
^ MSCI India (NDR).
Source: FactSet, J.P. Morgan Asset Management. As at 31 Dec 2014.
IndusInd Bank Ltd. 3.2 0.0 118.3 1.99
HDFC Bank Limited 8.2 3.3 67.3 1.71
Kotak Mahindra Bank Limited 3.3 0.8 80.8 1.30
Maruti Suzuki India Limited 2.2 0.0 101.1 1.17
Gujarat Pipavav Port Limited 0.9 0.0 240.4 1.01
Axis Bank Limited 1.8 0.0 110.2 0.97
Ashok Leyland Limited 1.2 0.0 210.3 0.92
Motilal Oswal Financial Services Limited 0.9 0.0 181.6 0.75
Shree Cement Limited 1.2 0.0 131.5 0.74
Tata Motors Limited 4.5 2.1 44.5 0.56
Larsen & Toubro Ltd. 1.5 2.7 0.8 -0.99
State Bank of India 1.3 2.1 12.0 -0.67
Mahindra & Mahindra Financial Services Ltd. 2.1 0.5 8.3 -0.51
Adani Ports & Special Economic Zone Ltd. 0.0 0.7 114.5 -0.39
Dr. Reddy's Laboratories Ltd. 0.8 1.9 -0.1 -0.37
Infosys Limited 8.5 10.1 20.3 -0.30
Housing Development Finance Corporation Limited 6.9 8.8 50.8 -0.29
Aurobindo Pharma Ltd 0.0 0.4 71.5 -0.29
Bharat Petroleum Corporation Limited 0.0 0.6 98.0 -0.29
LIC Housing Finance Ltd 0.0 0.5 110.2 -0.28

6
JIIT AGM_Jan2015.pptx
Holdings analysis
Concentration Percent of Total Market Cap (USD) Fund Benchmark^
Top 10 Holdings 51.6 > 100 bn 0.0 0.0
Top 20 Holdings 76.8 50 bn <> 100 bn 6.2 7.0
Top 30 Holdings 91.2 10 bn <> 50 bn 47.6 58.2
5 bn <> 10 bn 11.2 16.8
3 bn <> 5 bn 12.5 10.4
1 bn <> 3 bn 20.9 7.5
< 1 bn 6.1 0.0
Total number of holdings: 52
Fund
Holdings# Sector %
Infosys Information Technology 7.7
Housing Development Finance Financials 6.9
HDFC Bank Financials 6.7
Tata Consultancy Services Information Technology 6.3
Reliance Industries Energy 5.0
Tata Motors Consumer Discretionary 4.4
Sun Pharmaceutical Industries Health Care 4.1
IndusInd Bank Financials 3.8
Kotak Mahindra Bank Financials 3.7
Maruti Suzuki India Consumer Discretionary 3.0
51.6
^ MSCI India (NDR); Prior to 1 Oct 03, BSE100 # As at 30 Nov 2014
Source: J.P. Morgan Asset Management, as at 31 Dec 2014
The Fund is an actively managed portfolio, holdings, sector weights, allocations and leverage, as applicable are subject to change at the discretion
of the Investment Manager without notice

7
JIIT AGM_Jan2015.pptx
Top five active positions
* MSCI India Index
Source as at 30 Nov 2014
Source: J.P. Morgan Asset Management
Top 5 Overweight (%)
Stock Name Sector Portfolio Weight Benchmark* Weight Difference
HDFC Bank Financials 6.7 0.0 6.7
IndusInd Bank Financials 3.8 0.0 3.8
Kotak Mahindra Bank Financials 3.7 0.0 3.7
Maruti Suzuki India Consumer Discretionary 3.0 0.0 3.0
Axis Bank Financials 2.6 0.0 2.6
Top 5 Underweight (%)
Stock Name Sector Portfolio Weight Benchmark* Weight Difference
ITC Consumer Staples 0.0 4.5 -4.5
Infosys Information Technology 7.7 11.2 -3.4
Hindustan Unilever Consumer Staples 0.0 3.3 -3.3
Housing Development Finance Financials 6.9 9.6 -2.7
Dr. Reddy's Laboratories Health Care 0.0 2.4 -2.4
The companies/securities above are shown for illustrative purposes only. Their inclusion should not be interpreted as a recommendation to buy or sell.
The holdings represent the current holdings of the fund. However, it cannot be assumed that these types of investments will be available to or will be
selected by the fund in the future.

8
JIIT AGM_Jan2015.pptx
Key issues
Growth appears to have bottomed
Monetary conditions should ease
A strong government could initiate important structural reforms
Valuations are modest
Flows into equities could be strong
Opportunity for active, bottom up investing
The opinions and views expressed here are those held by the author at the time of publication, which are subject to change and are not to be taken as or construed
as investment advice.

9
JIIT AGM_Jan2015.pptx
Improving Ease of
Doing Business
Impetus to
Infrastructure and
manufacturing
Move towards online project approvals for environment and forest clearance will automatically lower the scope for
corruption
Ease in environment rules for mining, roads, power and irrigation projects
Labor reforms are moving ahead with new bills in parliament which seeks to amend a number of labour laws, including: an
increase in overtime hours, hiring apprentices, relaxing the earlier bar on employing women in factories for night shifts,
liberalize labour inspection etc.
Cleared 163 infrastructure projects worth USD100bn
Relaxed rules for banks to increase infrastructure lending
Hike in Foreign Direct Investment limit in defence is aimed at boosting domestic manufacturing of defence equipment;
100% FDI in railway infrastructure
Agreement with foreign countries to boost investments – Japan USD35bn, China USD25bn, USA USD41bn
Tax incentives for manufacturing; launched the “Made in India” campaign aimed at boosting manufacturing and creating
jobs
Ending ‘Policy
Paralysis’
A number of bureaucratic layers have been reduced, unnecessary committees dissolved – abolished Groups of Ministers
(GoM) and Empowered GoM; abolished the Planning Commission a remnant of India’s socialist past
Several ministries merged – ministries reduced from 79 to 45; related sectors such as coal and power merged
Eleven point agenda for government departments to eliminate unnecessary rules and reduce approval layers
Beyond intent –
The first 6 months have been in the right direction
Source: J.P. Morgan research
As at 31/12/2014

10
JIIT AGM_Jan2015.pptx
GDP Growth – Coming off the bottom, slowly…
Source: Morgan Stanley Research, 12 Jan 2015
3
4
5
6
7
8
9
10
11
12
9/04 3/05 9/05 3/06 9/06 3/07 9/07 3/08 9/08 3/09 9/09 3/10 9/10 3/11 9/11 3/12 9/12 3/13 9/13 3/14 9/14
10Y Average Growth: 7.5%
Year on Year %

11
JIIT AGM_Jan2015.pptx
…with pockets of opportunity
Medium & Heavy Vehicle Sales Passenger Car Sales
Source: Morgan Stanley Research, 12 Jan 2015
MMA is monthly moving average
Source: Morgan Stanley Research, 12 Jan 2015
-100%
-50%
0%
50%
100%
150%
200%
250%
12/04 1/06 2/07 3/08 4/09 5/10 6/11 7/12 8/13 9/14
% YoY
% YoY, 3MMA
-30%
-20%
-10%
0%
10%
20%
30%
40%
50%
12/04 2/06 4/07 6/08 8/09 10/10 12/11 2/13 4/14
% YoY
% YoY, 3MMA

12
JIIT AGM_Jan2015.pptx
4%
5%
6%
7%
8%
9%
10%
11%
12%
5/04 7/05 9/06 11/07 1/09 3/10 5/11 7/12 9/13 11/14
Repo Rate
SBI 1 year Deposit Rate*
10 Yr Yield
Source: Morgan Stanley Research, 12 Jan 2015
-2%
0%
2%
4%
6%
8%
10%
12%
4/05 4/06 4/07 4/08 4/09 4/10 4/11 4/12 4/13 4/14
WPI
CPI - New Index
YoY%
Inflation Rates
* Have used State Bank of India (SBI)1-year deposit rates. For recent months we have used
SBI special deposit rates on 555 days.
Source: Morgan Stanley Research, 22 Jan 2015
Falling inflation should lead to lower rates

13
JIIT AGM_Jan2015.pptx
High real rates= scope for easing monetary policy
Real Interest Rates Have Turned Positive
Source: Motilal Oswal Securities (MOSL), 21 Jan 2015
FY is Fiscal Year
4.7
3.4
1.8
1.1
1.7
1.6
1.5
2.6
-1.0
-6.4
-2.2
0.9
-1.5
-0.5
1.9
4.6
FY01 FY02 FY03 FY04 FY05 FY06 FY07 FY08 FY09 FY10 FY11 FY12 FY13 FY14 FY15 FY16
Real deposits rate (SBI 1yr deposits - CPI inflation)
RBI's indicative real
rate of 1.5%

14
JIIT AGM_Jan2015.pptx
Source: Morgan Stanley Research, 12 Jan 2015 Source: Morgan Stanley Research, 12 Jan 2015
8%
12%
16%
20%
24%
28%
32%
12/08 12/09 12/10 12/11 12/12 12/13 12/14
Credit
Deposit
1
YoY%
-12%
-8%
-4%
0%
4%
8%
12/04 2/06 4/07 6/08 8/09 10/10 12/11 2/13 4/14
Real 1Y Deposit Rate (on CPI IW)
Real 1Y Deposit Rate (on new CPI)
Credit cycle could start to recover

15
JIIT AGM_Jan2015.pptx
Valuations: Rerated
Source: RIMES, MSCI, IBES, Morgan Stanley Research, 22 Jan 2015
PB is price to book
Source: RIMES, (data provider) MSCI, Institutional Brokers' Estimate System ( IBES), Morgan
Stanley Research, 22 Jan 2015
PE is Price to Earnings
5
7
9
11
13
15
17
19
21
23
25
95 97 99 01 03 05 07 09 11 13
Fwd PE
10Y Average
5Y Average
1
2
3
4
5
6
7
95 97 99 01 03 05 07 09 11 13
PB
10Y Average
5Y Average
MSCI India

16
JIIT AGM_Jan2015.pptx
Source: RIMES, MSCI, Morgan Stanley Research, 22 Jan 2015 Source: RIMES, MSCI, Morgan Stanley Research, 22 Jan 2015
0.4
1.4
2.4
3.4
4.4
5.4
6.4
7.4
01 02 03 04 05 06 07 08 09 10 11 12 13 14
10-year average
0.3
0.4
0.5
0.6
0.7
0.8
0.9
1.0
01 02 03 04 05 06 07 08 09 10 11 12 13 14
10-year average
MSCI India Small cap trailing Price to Book (PB) MSCI India small cap relative to MSCI India Trailing Price to Book
(PB)
Small caps are no longer outright cheap
17
JIIT AGM_Jan2015.pptx
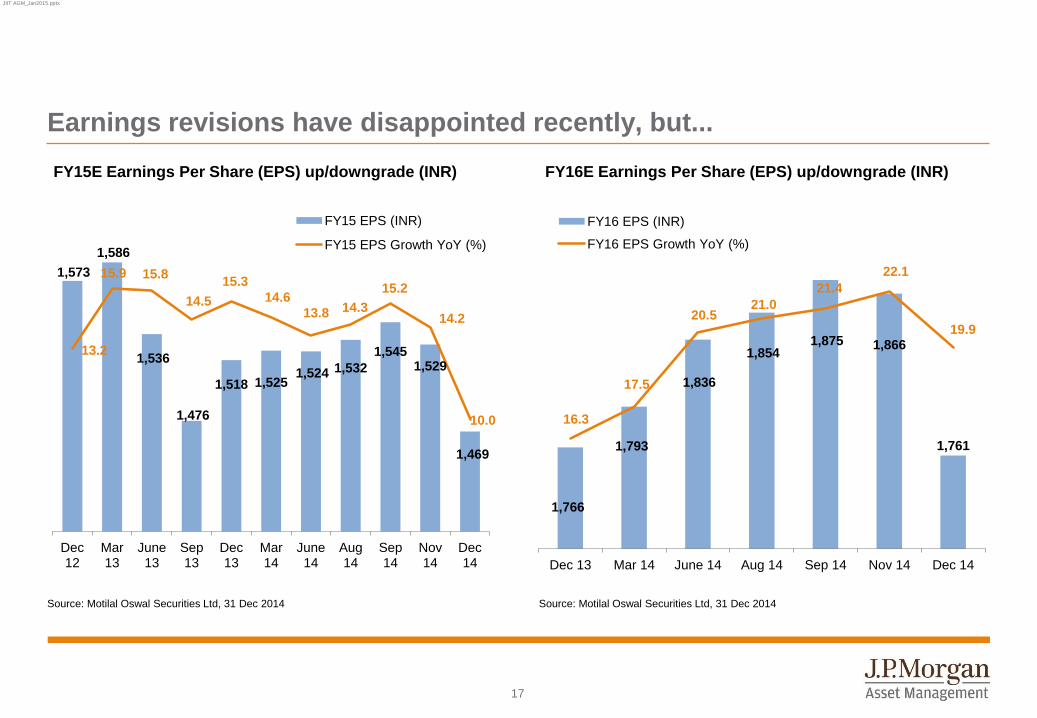
Earnings revisions have disappointed recently, but...
FY16E Earnings Per Share (EPS) up/downgrade (INR) FY15E Earnings Per Share (EPS) up/downgrade (INR)
Source: Motilal Oswal Securities Ltd, 31 Dec 2014 Source: Motilal Oswal Securities Ltd, 31 Dec 2014
1,573
1,586
1,536
1,476
1,518 1,525 1,524 1,532
1,545 1,529
1,469
13.2
15.9 15.8
14.5
15.3
14.6
13.8 14.3
15.2
14.2
10.0
Dec 12
Mar 13
June 13
Sep 13
Dec 13
Mar 14
June 14
Aug 14
Sep 14
Nov 14
Dec 14
FY15 EPS (INR)
FY15 EPS Growth YoY (%)
1,766
1,793
1,836
1,854 1,875 1,866
1,761
16.3
17.5
20.5 21.0
21.4
22.1
19.9
Dec 13 Mar 14 June 14 Aug 14 Sep 14 Nov 14 Dec 14
FY16 EPS (INR)
FY16 EPS Growth YoY (%)

18
JIIT AGM_Jan2015.pptx
Profits are at a cyclical trough
Profits as % GDP
Source: CLSA(Securities Research), 21 Jan 2015
4.5
5.2
5.6
6.7
7.1
5.0
5.4
5.1
4.7 4.6
4.3 4.3
4.5
4.7
3.0
3.5
4.0
4.5
5.0
5.5
6.0
6.5
7.0
7.5
FY04 FY05 FY06 FY07 FY08 FY09 FY10 FY11 FY12 FY13 FY14 FY15CL FY16CL FY17CL

19
JIIT AGM_Jan2015.pptx
Source: AMFI, Morgan Stanley Research, 12 Jan 2015
DMF’s are Domestic Mutual Flows
Source: SEBI, BSE, Morgan Stanley Research
*C2014 data updated till 8 Jan 2015
MF is Mutual Funds, FII is Foreign Institutional Investors; DII is Domestic Institutional Investors
-15,000
-10,000
-5,000
0
5,000
10,000
15,000
20,000
25,000
30,000
C2000 C2002 C2004 C2006 C2008 C2010 C2012 C2014
FII (Cash)
DII (Domestic MF + Insurance)
FII Debt
US$ mn
-4000
-2000
0
2000
4000
6000
8000
12/99 7/01 2/03 9/04 4/06 11/07 6/09 1/11 8/12 3/14
Flows into DMFs (Trailing 3M)
US $mn
Flows have been very strong, but...

20
JIIT AGM_Jan2015.pptx
Source: CLSA & RBI, 21 Jan 2015 Source: CLSA & RBI, 21 Jan 2015
Domestic exposure to equities remains abysmally low
Equities 2.2%
Cash 3.1%
Provident and Pension Funds 4.2%
Insurance Funds 5.2%
Bank Deposits 15.0%
Gold 14.1%
Property 56.2%
Total assets: US$6tn
3.9
4.6
2.4
4.0
3.5
2.6
2.2 2.2
0.0
0.5
1.0
1.5
2.0
2.5
3.0
3.5
4.0
4.5
5.0
3/07 3/08 3/09 3/10 3/11 3/12 3/13 3/14
%
Household assets Household exposure to equities

21
JIIT AGM_Jan2015.pptx
Source: Morgan Stanley Research, E-Morgan Stanley Research Estimates, 23 Jan 2015
MSe is the Morgan Stanley Estimate
-6%
-5%
-4%
-3%
-2%
-1%
0%
1%
2%
3%
-100
-80
-60
-40
-20
0
20
40
Mar-94 Mar-96 Mar-98 Mar-00 Mar-02 Mar-04 Mar-06 Mar-08 Mar-10 Mar-12 Mar-14 Mar-16E
US$ bn % of GDP (RHS)
Current Account Deficit,
Trailing 4-quarter sum MSe
Current Account: From deficit to surplus?

22
JIIT AGM_Jan2015.pptx
We believe the current risks are:
Reforms: willingness v/s ability
An active judiciary
Geopolitics under a Bharatiya Janata Party (BJP)-led majority
USD, US rates, deflation, flow linkages
The opinions and views expressed here are those held by the author at the time of publication, which are subject to change and are not to be taken as or construed
as investment advice.

23
JIIT AGM_Jan2015.pptx
Outlook
Growth appears to have bottomed
Monetary conditions should ease
A strong government could initiate important structural reforms
Valuations are modest
Flows into equities could be strong
Opportunity for active, bottom up investing
The opinions and views expressed here are those held by the author at the time of publication, which are subject to change and are not to be taken as or construed
as investment advice.
Forecasts, projections and other forward looking statements are based upon current beliefs and expectations. They are for illustrative purposes only and serve as an
indication of what may occur. Given the inherent uncertainties and risks associated with forecasts, projections and other forward statements, actual events, results or
performance may differ materially from those reflected or contemplated.

24
JIIT AGM_Jan2015.pptx
The value of investments and the income from them may fall as well as rise and investors may not get back the full amount invested.
Investment trusts may borrow to finance further investment (gearing). The use of gearing will increase the volatility of movements in the Net Asset
Value (NAV) per share. This means that a relatively small change, down or up, in the value of a trust's assets will result in a magnified fall or rise,
in the same direction, of the investment trust's NAV per share.
Exchange rate changes may cause the value of underlying overseas investments to go down as well as up.
Investments in emerging markets may involve a higher element of risk due to political and economic instability and underdeveloped markets and
systems. The trust may invest in smaller company shares, which can be more unpredictable and less liquid than shares of larger companies.
Dividend income payments are not guaranteed and may fluctuate.
Risk Information

25
JIIT AGM_Jan2015.pptx
This is a promotional document and as such the views contained herein are not to be taken as an advice or recommendation to buy or sell any investment or interest
thereto. Reliance upon information in this material is at the sole discretion of the reader. Any research in this document has been obtained and may have been acted upon by
J.P. Morgan Asset Management for its own purpose. The results of such research are being made available as additional information and do not necessarily reflect the views of
J.P. Morgan Asset Management. Any forecasts, figures, opinions, statements of financial market trends or investment techniques and strategies expressed are unless otherwise
stated, J.P. Morgan Asset Management’s own at the date of this document. They are considered to be reliable at the time of writing, may not necessarily be all-inclusive and are
not guaranteed as to accuracy. They may be subject to change without reference or notification to you.
It should be noted that the value of investments and the income from them may fluctuate in accordance with market conditions and taxation agreements and investors may not get
back the full amount invested. Changes in exchange rates may have an adverse effect on the value, price or income of the product(s) or underlying overseas investments. Both
past performance and yield may not be a reliable guide to future performance. There is no guarantee that any forecast made will come to pass. Furthermore, whilst it is the
intention to achieve the investment objective of the investment product(s), there can be no assurance that those objectives will be met.
J.P. Morgan Asset Management is the brand name for the asset management business of JPMorgan Chase & Co and its affiliates worldwide. You should note that if you contact
J.P. Morgan Asset Management by telephone those lines may be recorded and monitored for legal, security and training purposes. You should also take note that information
and data from communications with you will be collected, stored and processed by J.P. Morgan Asset Management in accordance with the EMEA Privacy Policy which can be
accessed through the following website http://www.jpmorgan.com/pages/privacy.
Investment is subject to documentation which is comprised of the Investment Trust Profiles document and either the Supplementary Information Document (SID) or Key
Features/Terms and Condition, copies of which can be obtained free of charge from JPMorgan Asset Management Marketing Limited. Issued by JPMorgan Asset Management
Marketing Limited which is authorised and regulated in the UK by the Financial Conduct Authority. Registered in England No: 288553. Registered address: 25 Bank St, Canary
Wharf, London E14 5JP. Compliance approval number: 4d03c02a8001f159 .