jpmorgan indian investment trust plc annual general...
TRANSCRIPT

0
JPMorgan Indian Investment Trust plc
Annual General Meeting
January 2016
1
JATGC3.pptx_24336
Performance and Attribution
JPMorgan Indian Investment Trust

2
RUSINDIA1.pptx_25549
^ J.P. Morgan Asset Management shadow valuation
Fund launch date: 1 July 1994
* Prior to 1 Oct 2003, BSE100
Past performance is not a guide to the future. Source: J.P. Morgan/Morningstar as of 31 Dec 2015. Performance data has been calculated on NAV to NAV basis, including ongoing charges and any
applicable fees, with any income reinvested, in GBP. Please note Benchmark Indices do not include fees or operating expenses and are not available for actual investment.
JPMorgan Indian Investment Trust Performance (GBP)
As at 31 December 2015
Annualised performance (%)
Market Value
JPMorgan Indian Investment Trust plc GBP 605.2m^
1 Year 2 Years 3 Years 5 Years 10 Years Since Inception
JPMorgan Indian Investment Trust plc +3.6 +22.0 +11.7 +2.3 +9.3 +8.8
MSCI India (NDR)* -0.7 +14.3 +7.2 -1.2 +8.9 +6.2
Excess Return (Arithmetic) (Diluted) +4.3 +7.7 +4.4 +3.5 +0.4 +2.6
Excess Return (Geometric) (Diluted) +4.3 +6.7 +4.1 +3.6 +0.4 +2.4
2011 2012 2013 2014 2015
JPMorgan Indian Investment Trust plc (Share Price) -33.8 +16.4 -10.5 +49.9 +1.2
JPMorgan Indian Investment Trust plc (NAV) -32.3 +18.9 -6.4 +43.7 +3.6
MSCI India (NDR)* -36.7 +20.4 -5.6 +31.6 -0.7
Rolling 12 Months at Year Ends (%)

3
RUSINDIA1.pptx_25549
Source: J.P. Morgan Asset Management, 31 Dec 2015
Past performance is not a guide to the future. Source: J.P. Morgan/Morningstar as of 31 Dec 2015. Performance data has been calculated on NAV to NAV basis, including ongoing charges and any
applicable fees, with any income reinvested, in GBP. Please note Benchmark Indices do not include fees or operating expenses and are not available for actual investment.
JPMorgan Indian Investment Trust Performance (GBP)
0
100
200
300
400
500
600
700
800
7/94 7/95 7/96 7/97 7/98 7/99 7/00 7/01 7/02 7/03 7/04 7/05 7/06 7/07 7/08 7/09 7/10 7/11 7/12 7/13 7/14 7/15
NAV (Net of Fees)
Share Price
MSCI India (NDR) (Prior to 1 Oct 03, BSE100)
(%)

4
RUSINDIA1.pptx_25549
JPMorgan Indian Investment Trust Portfolio Holdings
Holdings# Country Sector
Fund
%
Benchmark^
%
HDFC Bank Limited India Financials 8.2 0.0
Infosys Limited India Information Technology 7.8 10.6
Housing Development Finance Corporation Limited India Financials 7.2 9.6
Tata Consultancy Services Limited India Information Technology 5.6 5.9
Sun Pharmaceutical Industries Limited India Health Care 4.9 3.7
Kotak Mahindra Bank Limited India Financials 4.9 0.0
Maruti Suzuki India Limited India Consumer Discretionary 4.4 0.0
IndusInd Bank Ltd. India Financials 4.4 0.0
Ashok Leyland Limited India Industrials 4.3 0.0
UltraTech Cement Limited India Materials 3.8 0.5
55.5 30.4
# As at 30 Nov 2015
^ MSCI India (NDR)
Source: J.P. Morgan Asset Management, as at 31 Dec 2015.
The Trust is an actively managed portfolio, holdings, sector weights, allocations and leverage, as applicable are subject to change at the discretion of the Investment Manager without notice.
Concentration Fund Benchmark^
Top 10 Holdings 56.1 50.3
Top 20 Holdings 82.3 67.9
Top 30 Holdings 94.9 78.5
Active Shares: 60.4
5
RUSINDIA1.pptx_25549
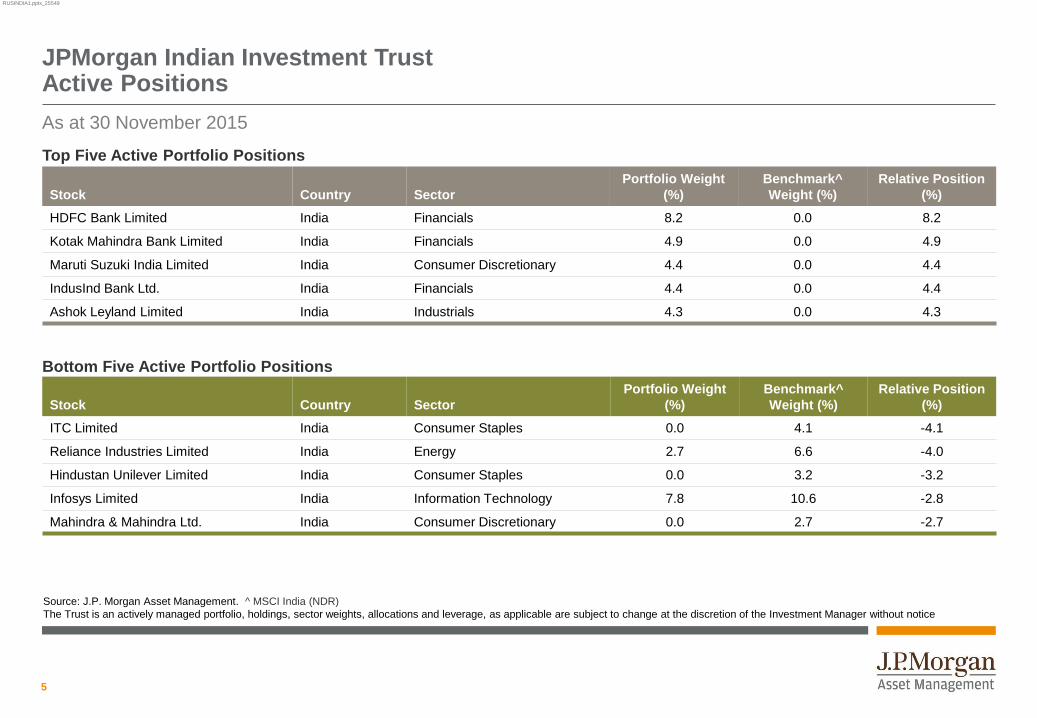
JPMorgan Indian Investment Trust Active Positions
As at 30 November 2015
Top Five Active Portfolio Positions
Bottom Five Active Portfolio Positions
Stock Country Sector
Portfolio Weight
(%)
Benchmark^
Weight (%)
Relative Position
(%)
HDFC Bank Limited India Financials 8.2 0.0 8.2
Kotak Mahindra Bank Limited India Financials 4.9 0.0 4.9
Maruti Suzuki India Limited India Consumer Discretionary 4.4 0.0 4.4
IndusInd Bank Ltd. India Financials 4.4 0.0 4.4
Ashok Leyland Limited India Industrials 4.3 0.0 4.3
Stock Country Sector
Portfolio Weight
(%)
Benchmark^
Weight (%)
Relative Position
(%)
ITC Limited India Consumer Staples 0.0 4.1 -4.1
Reliance Industries Limited India Energy 2.7 6.6 -4.0
Hindustan Unilever Limited India Consumer Staples 0.0 3.2 -3.2
Infosys Limited India Information Technology 7.8 10.6 -2.8
Mahindra & Mahindra Ltd. India Consumer Discretionary 0.0 2.7 -2.7
Source: J.P. Morgan Asset Management. ^ MSCI India (NDR)
The Trust is an actively managed portfolio, holdings, sector weights, allocations and leverage, as applicable are subject to change at the discretion of the Investment Manager without notice
6
RUSINDIA1.pptx_25549
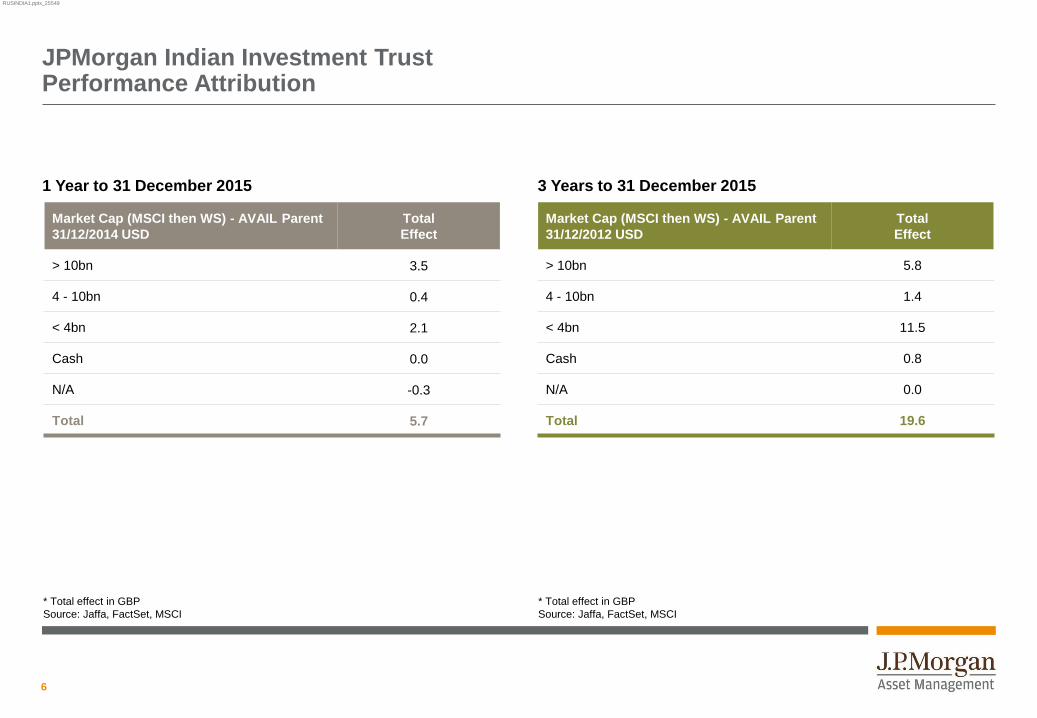
JPMorgan Indian Investment Trust Performance Attribution
Market Cap (MSCI then WS) - AVAIL Parent
31/12/2014 USD
Total
Effect
> 10bn 3.5
4 - 10bn 0.4
< 4bn 2.1
Cash 0.0
N/A -0.3
Total 5.7
Market Cap (MSCI then WS) - AVAIL Parent
31/12/2012 USD
Total
Effect
> 10bn 5.8
4 - 10bn 1.4
< 4bn 11.5
Cash 0.8
N/A 0.0
Total 19.6
* Total effect in GBP
Source: Jaffa, FactSet, MSCI
* Total effect in GBP
Source: Jaffa, FactSet, MSCI
1 Year to 31 December 2015 3 Years to 31 December 2015

7
RUSINDIA1.pptx_25549
Top 10 contributors/detractors to active returns
Source: FactSet, J.P. Morgan Asset Management, as at 30 Nov 2015.
Past performance is not indicative of future performance. The companies/securities above are shown for illustrative purposes only. Their inclusion should not be interpreted as a recommendation to
buy or sell. However, it cannot be assumed that these types of investments will be available to or will be selected by the fund in the future. Subject to change at the discretion of the Investment
Manager without notice.
1 Year to 30 November 2015
Top 10 Contributors Sector
Average
Fund
Weight %
Average
Benchmark
Weight %
Stock
Return %
Contributions
To Active
Return %
HDFC Bank Limited Financials 7.49 0.00 22.15 2.21
Ashok Leyland Limited Industrials 3.45 0.00 76.14 2.18
Maruti Suzuki India Limited Consumer Discretionary 3.58 0.00 32.65 1.39
Kotak Mahindra Bank Limited Financials 4.54 0.00 12.30 0.93
IndusInd Bank Ltd. Financials 4.09 0.00 12.47 0.93
Vedanta Limited Materials 0.00 0.96 -60.46 0.62
Oil & Natural Gas Corp. Ltd. Energy 0.00 1.30 -37.25 0.46
Godrej Industries Limited Materials 1.28 0.00 29.93 0.42
Motilal Oswal Financial Services Limited Financials 1.30 0.00 25.55 0.41
Shree Cement Limited Materials 1.61 0.25 19.99 0.41
Top 10 Detractors Sector
Average
Fund
Weight %
Average
Benchmark
Weight %
Stock
Return %
Contributions
To Active
Return %
Aurobindo Pharma Ltd Health Care 0.00 0.95 44.36 -0.43
Hindustan Unilever Limited Consumer Staples 0.00 3.49 1.48 -0.40
Housing Development Finance Corporation Limited Financials 7.19 9.95 2.20 -0.39
Mahindra & Mahindra Ltd. Consumer Discretionary 1.88 2.39 -5.62 -0.33
Reliance Industries Limited Energy 3.41 6.32 -4.99 -0.32
Tata Motors Limited Consumer Discretionary 3.60 1.96 -23.79 -0.32
HCL Technologies Limited Information Technology 0.00 2.57 3.52 -0.31
IDFC Bank Ltd. Financials 0.16 0.00 -29.20 -0.31
Mahindra & Mahindra Financial Services Ltd. Financials 1.87 0.39 -26.34 -0.30
Bharat Heavy Electricals Limited Industrials 1.47 0.76 -39.90 -0.29
Benchmark MSCI India (NDR)

8
RUSINDIA1.pptx_25549
Market Outlook

9
RUSINDIA1.pptx_25549
Key Issues
Source: J.P. Morgan Asset Management. As at 4 Sep 2015.
B.J.P = Bharatiya Janata Party
The opinions and views expressed here are those held by the author as at 31 Mar 2015, which are subject to change and are not to be taken as or construed as investment advice.
Emerging markets: fundamentally different
India: much improved macro stability
Big beneficiary of low commodity prices
Growth – sluggish, but green shoots of recovery
Easing monetary policy should help
Valuations – headline multiples are near long term averages
But earnings are depressed
Polarised market = active management

10
RUSINDIA1.pptx_25549
Fundamental Risk – Overall: 2013Q1 vs. Current
EM Fundamental Risk: ‘Taper Tantrum’ vs. Now
Source: J.P. Morgan Asset Management. Oxford Economics. Data as at end June 2015.
Shifting external and overall vulnerability within EM
Low
Risk
High
Risk
1Q'13
Country
Rank
2Q'15
Country
Rank
Chile 1 Philippines 1
Philippines 1 Chile 1
Peru 1 Taiwan 1
Poland 1 India 1
China 2 Poland 2
Korea 2 Hungary 2
Colombia 2 Thailand 2
Indonesia 2 Czech 2
Argentina 3 Peru 3
Turkey 3 Korea 3
Taiwan 3 China 3
India 3 South Africa 3
Hungary 4 Argentina 4
Mexico 4 Malaysia 4
Thailand 4 Indonesia 4
Russia 4 Turkey 4
Malaysia 5 Mexico 5
Czech 5 Colombia 5
South Africa 5 Brazil 5
Brazil 5 Russia 5
5 key fundamental risks
External Imbalances
Sovereign risk
Economic Stability
Credit cycle
Governance
11
RUSINDIA1.pptx_25549
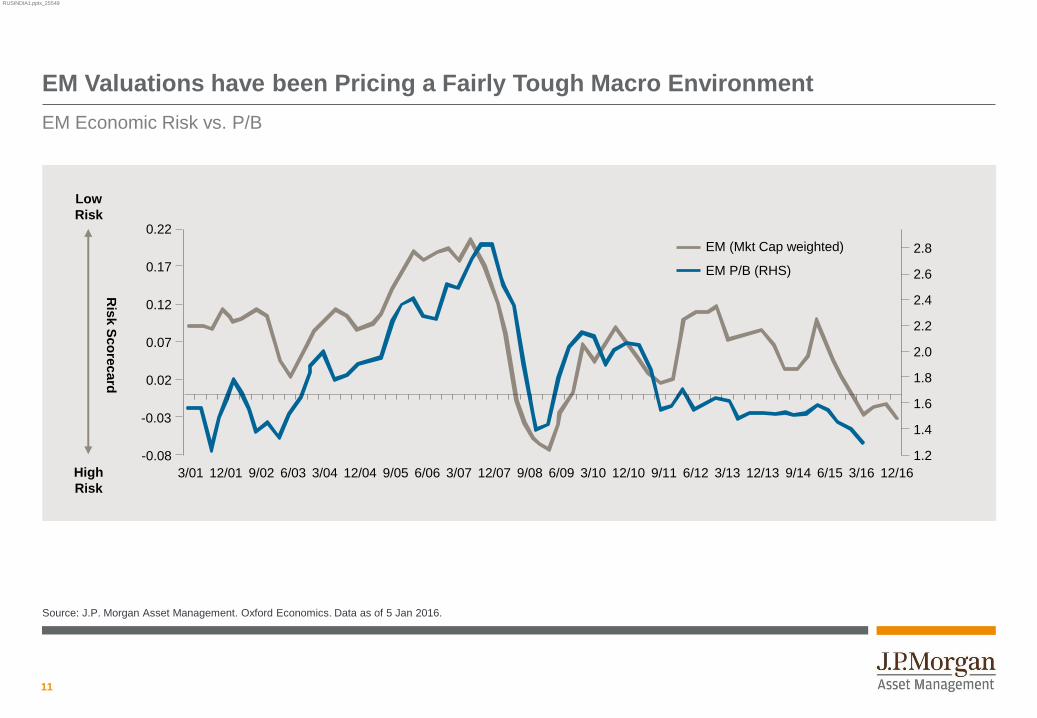
EM Valuations have been Pricing a Fairly Tough Macro Environment
Source: J.P. Morgan Asset Management. Oxford Economics. Data as of 5 Jan 2016.
Low
Risk
High
Risk
Ris
k S
co
recard
EM Economic Risk vs. P/B
0.22
0.17
0.12
0.07
0.02
-0.03
-0.08
2.8
2.6
2.4
2.2
2.0
1.8
1.6
1.4
1.2
EM (Mkt Cap weighted)
EM P/B (RHS)
3/01 9/02 3/04 9/05 3/07 9/08 3/10 9/11 3/13 9/14 3/16 12/01 6/03 12/04 6/06 12/07 6/09 12/10 6/12 12/13 6/15 12/16
12
RUSINDIA1.pptx_25549
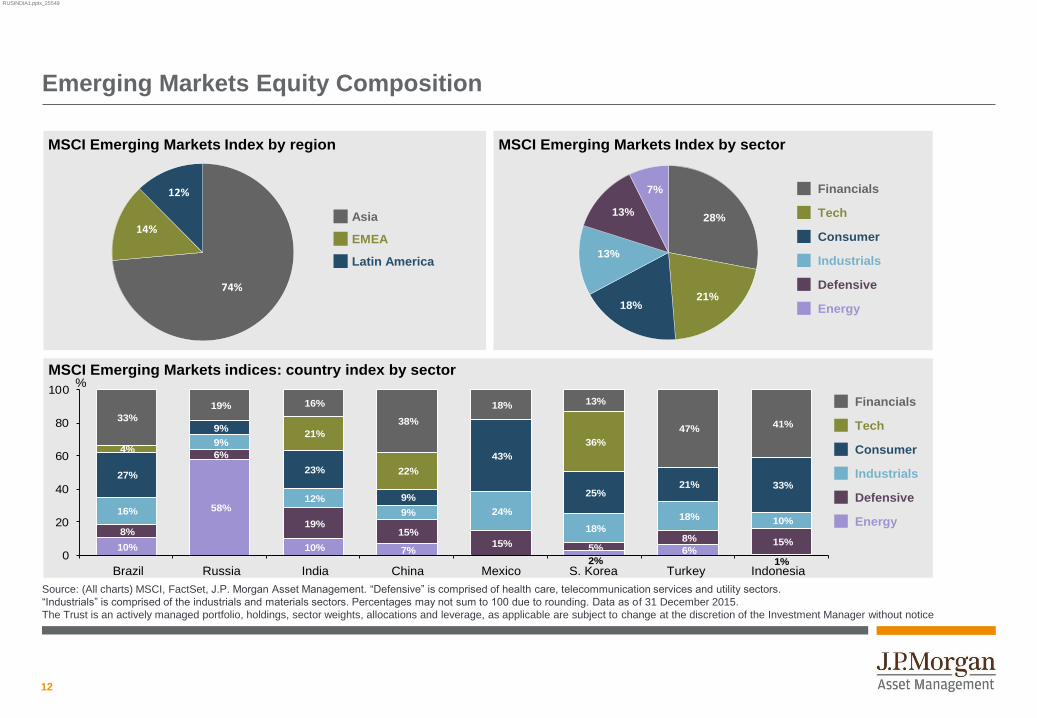
Emerging Markets Equity Composition
Source: (All charts) MSCI, FactSet, J.P. Morgan Asset Management. “Defensive” is comprised of health care, telecommunication services and utility sectors.
“Industrials” is comprised of the industrials and materials sectors. Percentages may not sum to 100 due to rounding. Data as of 31 December 2015.
The Trust is an actively managed portfolio, holdings, sector weights, allocations and leverage, as applicable are subject to change at the discretion of the Investment Manager without notice
MSCI Emerging Markets Index by sectorMSCI Emerging Markets Index by region
MSCI Emerging Markets indices: country index by sector
Asia
EMEA
Latin America
Financials
Tech
Industrials
Defensive
Energy
Consumer
Brazil Russia India China Mexico S. Korea Turkey Indonesia
%
Financials
Tech
Industrials
Defensive
Energy
Consumer
10%
58%
10% 7%2%
6%1%
8%
6%
19%15%
15% 5%8% 15%
16%
9%
12%
9% 24%
18%
18% 10%
27%
9%
23%
9%
43%
25%21% 33%
4%
21%
22%
36%
33%
19% 16%
38%
18% 13%
47%41%
0
20
40
60
80
100
28%
21%18%
13%
13%
7%
74%
14%
12%

13
RUSINDIA1.pptx_25549
Source: Morgan Stanley Research, Jan 2016.
The opinions and views expressed here are as at the date of this document, which are subject to change and are not to be taken as or construed as investment advice.
US and China risks: India stacks up well
US dollar and real rates
Current account balance
Reliance on foreign capital
Trend in total leverage (last 5 years)
China slowdown
Exports to China
Commodity exposure
High
Low
Less Exposed More Exposed
Imp
act
of
Gro
wth
Slo
wd
ow
n in
Ch
ina
Impact of Rising Dollar and Real Rates
Taiwan Korea
Hong Kong
Singapore
Philippines
Thailand
India
Indonesia
Malaysia

14
RUSINDIA1.pptx_25549
India Benefits from Lower Commodity Prices, Especially Oil
Note: Under-recovery refers to the gap between the cost of imports and the subsidised selling
price of diesel, liquefied petroleum gas (LPG) and kerosene in India.
Source: Morgan Stanley Researchestimate, as at 6 Jan 2016. Forecasts, projections and other forward looking statements are based upon current beliefs and expectations. They are for illustrative purposes only and serve as an indication of what may occur.
Overall oil subsidy is sharply reduced…
29 30 23 12 5
112 108
106
84
54
FY12 FY13 FY14 FY15 FY16E
Petroleum Under-recovery (USDb)
Oil price (Indian Basket, USD/bbl)
Source: CEIC, RBI, Morgan Stanley Research, 6 Jan 2016
BE-Budget Estimate
2%
3%
4%
5%
6%
7%
8%
11/06 11/07 11/08 11/09 11/10 11/11 11/12 11/13 11/14 11/15
…Leading to a lower fiscal deficit
Central Govt Fiscal Deficit 12M trailing %
of GDP
15
RUSINDIA1.pptx_25549
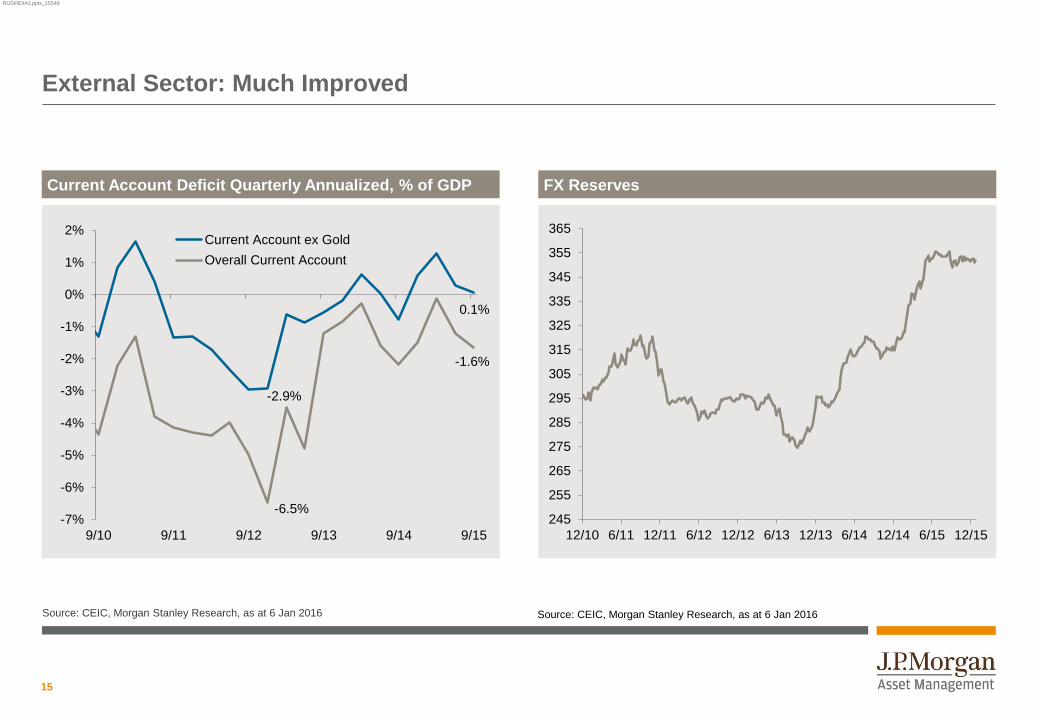
Source: CEIC, Morgan Stanley Research, as at 6 Jan 2016 Source: CEIC, Morgan Stanley Research, as at 6 Jan 2016
Current Account Deficit Quarterly Annualized, % of GDP
External Sector: Much Improved
-2.9%
0.1%
-6.5%
-1.6%
-7%
-6%
-5%
-4%
-3%
-2%
-1%
0%
1%
2%
9/10 9/11 9/12 9/13 9/14 9/15
Current Account ex Gold
Overall Current Account
245
255
265
275
285
295
305
315
325
335
345
355
365
12/10 6/11 12/11 6/12 12/12 6/13 12/13 6/14 12/14 6/15 12/15
FX Reserves
16
RUSINDIA1.pptx_25549
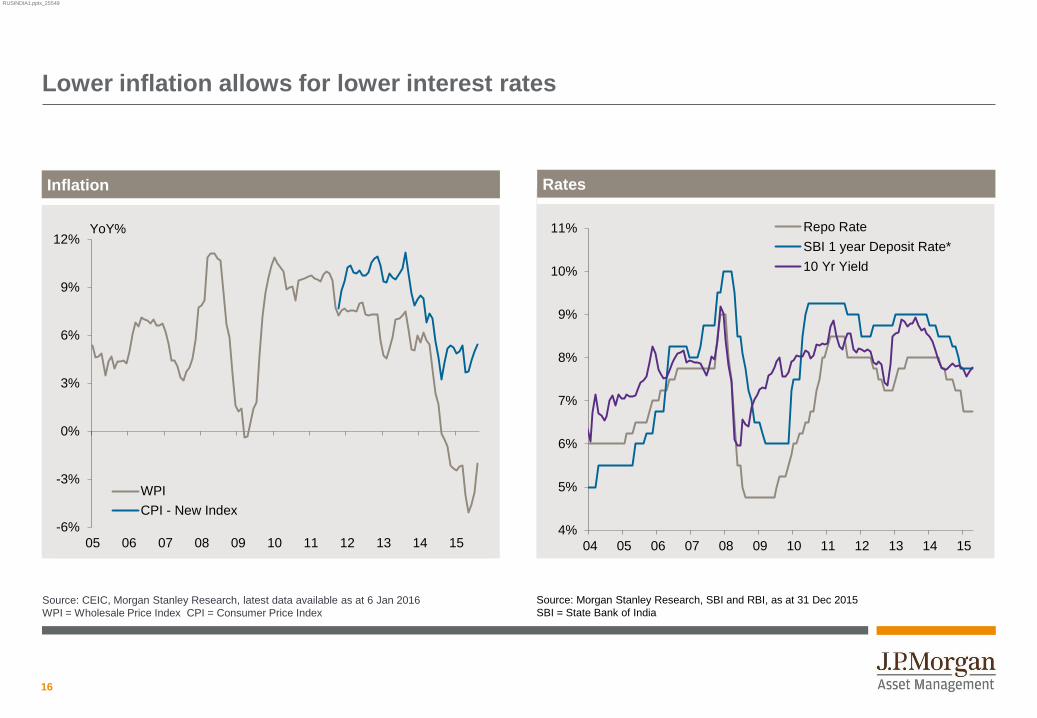
Lower inflation allows for lower interest rates
Source: CEIC, Morgan Stanley Research, latest data available as at 6 Jan 2016
WPI = Wholesale Price Index CPI = Consumer Price Index
Source: Morgan Stanley Research, SBI and RBI, as at 31 Dec 2015
SBI = State Bank of India
Rates Inflation
-6%
-3%
0%
3%
6%
9%
12%
05 06 07 08 09 10 11 12 13 14 15
WPI
CPI - New Index
YoY%
4%
5%
6%
7%
8%
9%
10%
11%
04 05 06 07 08 09 10 11 12 13 14 15
Repo Rate
SBI 1 year Deposit Rate*
10 Yr Yield
17
RUSINDIA1.pptx_25549
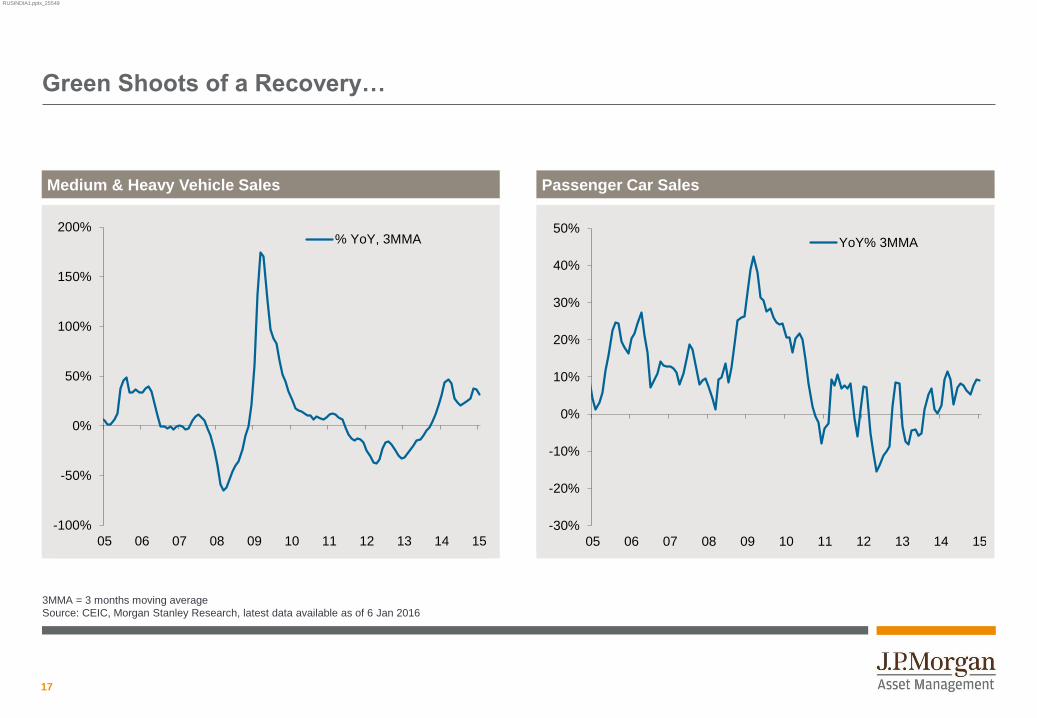
Green Shoots of a Recovery…
3MMA = 3 months moving average
Source: CEIC, Morgan Stanley Research, latest data available as of 6 Jan 2016
Passenger Car Sales Medium & Heavy Vehicle Sales
-100%
-50%
0%
50%
100%
150%
200%
05 06 07 08 09 10 11 12 13 14 15
% YoY, 3MMA
-30%
-20%
-10%
0%
10%
20%
30%
40%
50%
05 06 07 08 09 10 11 12 13 14 15
YoY% 3MMA
18
RUSINDIA1.pptx_25549
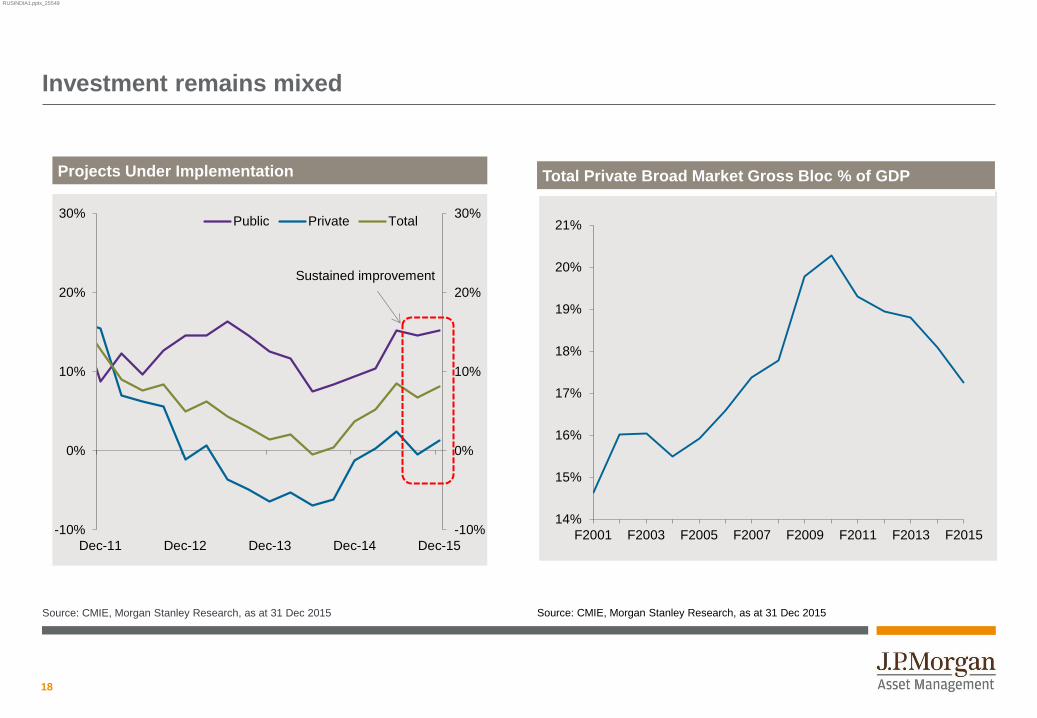
Source: CMIE, Morgan Stanley Research, as at 31 Dec 2015 Source: CMIE, Morgan Stanley Research, as at 31 Dec 2015
Investment remains mixed
Projects Under Implementation
-10%
0%
10%
20%
30%
-10%
0%
10%
20%
30%
Dec-11 Dec-12 Dec-13 Dec-14 Dec-15
Public Private Total
Sustained improvement
14%
15%
16%
17%
18%
19%
20%
21%
F2001 F2003 F2005 F2007 F2009 F2011 F2013 F2015
Total Private Broad Market Gross Bloc % of GDP

19
RUSINDIA1.pptx_25549
Source: CSO, Morgan Stanley Research, latest data available as of 6 Jan 2016
Industrial activity looking up
Industrial Production
-2%
0%
2%
4%
6%
8%
10%
12%
14%
Oct-09 Oct-10 Oct-11 Oct-12 Oct-13 Oct-14 Oct-15
YoY%, 3MMA

20
RUSINDIA1.pptx_25549
Earnings have Disappointed…
Source: Motilal Oswal Securities Ltd, as at 31 Dec 2015
SENSEX = Bombay Stock Exchange Sensitive Index EPS = Earnings Per Share
Sensex EPS Revisions (F16)
16.3 16.2 17.5 18.8 20.5 21.0 21.4 22.1 19.9 19.7 18.4 18.5 15.3 11.9 8.7 6.0
EPS growth YoY (%)
1,766 1,792 1,793 1,811 1,836 1,854 1,875 1,866
1,761 1,698 1,662
1,605 1,561 1,515 1,471 1,435
Dec 13 Feb 14 Mar 14 May 14 June 14 Aug 14 Sep 14 Nov 14 Dec 14 Feb 15 Mar 15 May 15 June 15 Aug 15 Sep 15 Nov 15
FY16 EPS FY16 EPS Growth YoY (%)

21
RUSINDIA1.pptx_25549
… But have been navigable
Source: J.P. Morgan Asset Management. Data as of 6 Jan 2016.
% contribution to FY16 total estimate downgrade
-50
-45
-40
-35
-30
-25
-20
-15
-10
-5
0
GlobalCommodityCyclicals
DomesticCyclicals
PSU -Financials
PVT -Financials
Infra/CapexCyclicals
OthersCyclicals
Exporters -Gobal Non-
CyclicalsConsumer
Staples Tata Motors

22
RUSINDIA1.pptx_25549
Earnings are Cyclical and Depressed
Source: CLSA, as at 6 Jan 2016
Profits as % GDP
4.5
5.2
5.6
6.8
7.1
5.1
5.5
5.2
4.9 4.8
4.6
4.1 4.1
3.0
3.5
4.0
4.5
5.0
5.5
6.0
6.5
7.0
7.5
FY04 FY05 FY06 FY07 FY08 FY09 FY10 FY11 FY12 FY13 FY14 FY15 FY16CL
average
23
RUSINDIA1.pptx_25549
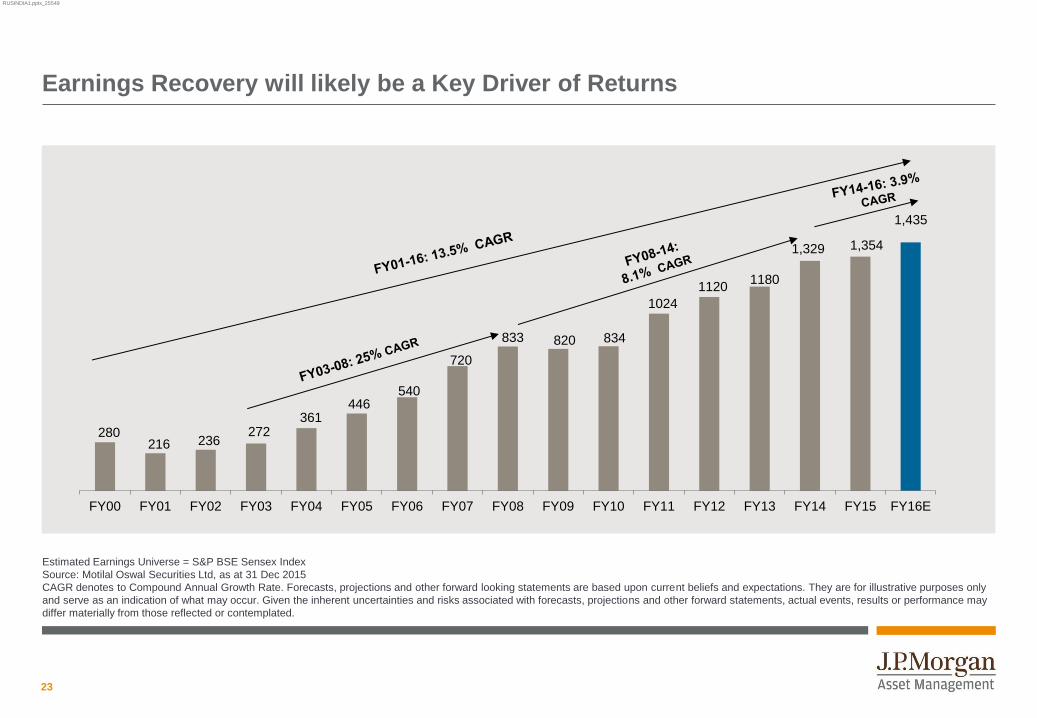
Earnings Recovery will likely be a Key Driver of Returns
Estimated Earnings Universe = S&P BSE Sensex Index
Source: Motilal Oswal Securities Ltd, as at 31 Dec 2015
CAGR denotes to Compound Annual Growth Rate. Forecasts, projections and other forward looking statements are based upon current beliefs and expectations. They are for illustrative purposes only
and serve as an indication of what may occur. Given the inherent uncertainties and risks associated with forecasts, projections and other forward statements, actual events, results or performance may
differ materially from those reflected or contemplated.
280 216 236
272 361
446 540
720
833 820 834
1024
1120 1180
1,329 1,354
1,435
FY00 FY01 FY02 FY03 FY04 FY05 FY06 FY07 FY08 FY09 FY10 FY11 FY12 FY13 FY14 FY15 FY16E

24
RUSINDIA1.pptx_25549
Valuations: average
PB = Price to Book ratio
PE = Price to Earnings ratio
Source: RIMES, MSCI, IBES, Morgan Stanley Research, as of 15 Jan 2016
x x
MSCI India – Forward PE MSCI India – PB
5
7
9
11
13
15
17
19
21
23
25
19
95
19
96
19
97
19
98
19
99
20
00
20
01
20
02
20
03
20
04
20
05
20
06
20
07
20
08
20
09
20
10
20
11
20
12
20
13
20
14
20
15
Fwd PE
10Y Average
5Y Average
1
2
3
4
5
6
7
19
95
19
96
19
97
19
98
19
99
20
00
20
01
20
02
20
03
20
04
20
05
20
06
20
07
20
08
20
09
20
10
20
11
20
12
20
13
20
14
20
15
PB
10Y Average
5Y Average
25
RUSINDIA1.pptx_25549
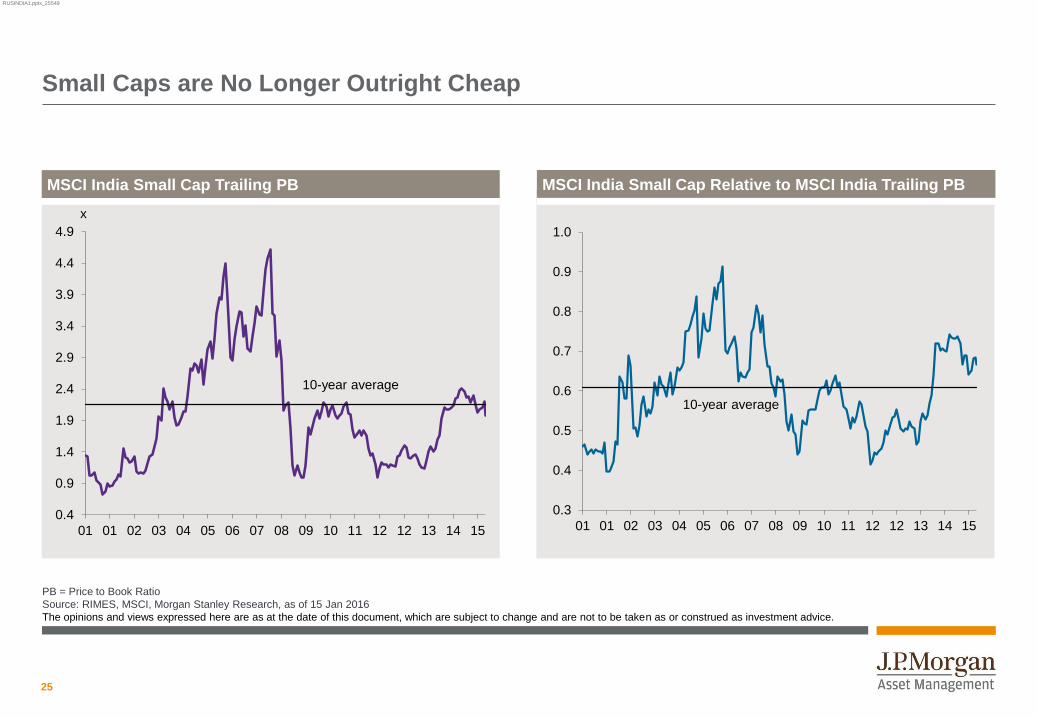
Small Caps are No Longer Outright Cheap
PB = Price to Book Ratio
Source: RIMES, MSCI, Morgan Stanley Research, as of 15 Jan 2016
The opinions and views expressed here are as at the date of this document, which are subject to change and are not to be taken as or construed as investment advice.
MSCI India Small Cap Trailing PB MSCI India Small Cap Relative to MSCI India Trailing PB
x
0.4
0.9
1.4
1.9
2.4
2.9
3.4
3.9
4.4
4.9
01 01 02 03 04 05 06 07 08 09 10 11 12 12 13 14 15
10-year average
0.3
0.4
0.5
0.6
0.7
0.8
0.9
1.0
01 01 02 03 04 05 06 07 08 09 10 11 12 12 13 14 15
10-year average
26
RUSINDIA1.pptx_25549
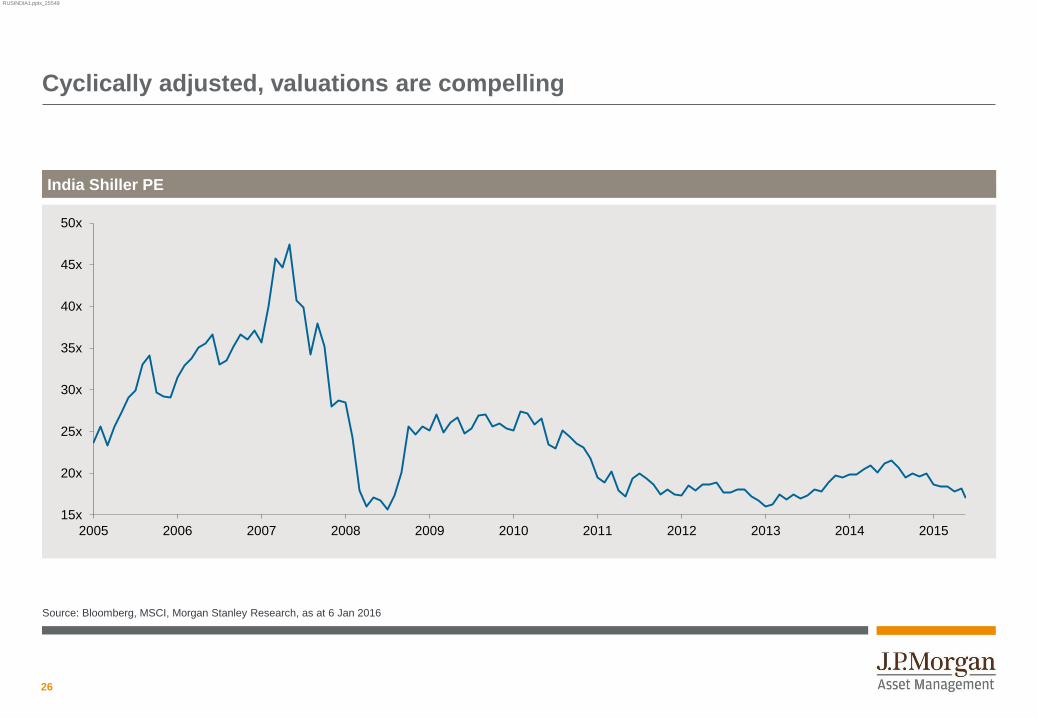
Cyclically adjusted, valuations are compelling
Source: Bloomberg, MSCI, Morgan Stanley Research, as at 6 Jan 2016
India Shiller PE
15x
20x
25x
30x
35x
40x
45x
50x
2005 2006 2007 2008 2009 2010 2011 2012 2013 2014 2015

27
RUSINDIA1.pptx_25549
-4000
-2000
0
2000
4000
6000
8000
99 00 01 02 03 04 05 06 07 08 09 10 11 12 13 14
Flows into DMFs(Trailing 3M)
in USD mn
Source: SEBI, BSE, Morgan Stanley Research. C2015 data as at 31 Dec 2015
FII = Foreign Institutional Investor DII = Domestic Institutional Investor
MF = Mutual Funds Source: AMFI, Morgan Stanley Research, latest data available as at 6 Jan 2016
DMF = Domestic Mutual Funds
Flows have been Strong But...
India Fund Flows Domestic Mutual Fund Flows
-15,000
-10,000
-5,000
0
5,000
10,000
15,000
20,000
25,000
30,000
C2000 C2003 C2006 C2009 C2012 C2015
FII (Cash)
DII (Domestic MF + Insurance)
FII Debt
USD mn
28
RUSINDIA1.pptx_25549
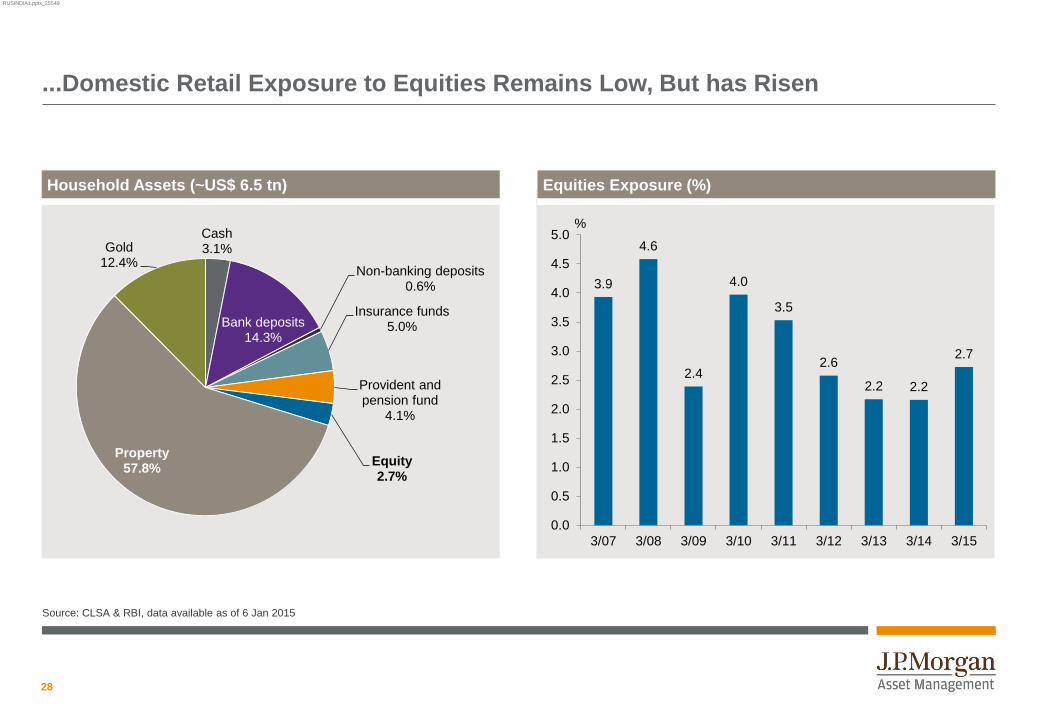
Source: CLSA & RBI, data available as of 6 Jan 2015
...Domestic Retail Exposure to Equities Remains Low, But has Risen
%
Household Assets (~US$ 6.5 tn) Equities Exposure (%)
Cash 3.1%
Bank deposits 14.3%
Non-banking deposits 0.6%
Insurance funds 5.0%
Provident and pension fund
4.1%
Equity 2.7%
Property 57.8%
Gold 12.4%
3.9
4.6
2.4
4.0
3.5
2.6
2.2 2.2
2.7
0.0
0.5
1.0
1.5
2.0
2.5
3.0
3.5
4.0
4.5
5.0
3/07 3/08 3/09 3/10 3/11 3/12 3/13 3/14 3/15

29
RUSINDIA1.pptx_25549
Risks
Source: J.P. Morgan Asset Management as at 30 Sep 2015
BJP = Bharatiya Janata Party
The opinions and views expressed here are as at the date of this document, which are subject to change and are not to be taken as or construed as investment advice.
Emerging market stress = correlation towards 1
Growth recovery is further delayed
Health of State-Owned banks
Reforms: willingness v/s ability

30
RUSINDIA1.pptx_25549
Summary
Source: J.P. Morgan Asset Management as at 30 Sep 2015.
The opinions and views expressed here are as at the date of this document, which are subject to change and are not to be taken as or construed as investment advice.
Emerging markets: fundamentally different
India: much improved macro stability
Big beneficiary of low commodity prices
Growth – sluggish, but green shoots of recovery
Easing monetary policy should help
Valuations – headline multiples are near long term averages
But earnings are depressed
Polarised market = active management

31
RUSINDIA1.pptx_25549
Important notes
JPMorgan Indian Investment Trust plc ■ Exchange rate changes may cause the value of underlying overseas investments to go down as well as up. ■ Investments in emerging markets may involve a higher element of risk due to political and economic instability and underdeveloped markets and systems. Shares may also be traded less frequently than those on
established markets. This means that there may be difficulty in both buying and selling shares and individual share prices may be subject to short term price fluctuations ■ External factors may cause an entire asset class to decline in value. Prices and values of all shares or all bonds could decline at the same time ■ This trust may utlilise gearing (borrowing) which will exaggerate market movements both up and down. ■ This trust may also invest in smaller companies which may increase its risk profile.
Investment involves risk. Please refer to the offering document(s) for details, including the risk factors before investing.
32
RUSINDIA1.pptx_25549
J.P. Morgan Asset Management
FOR PROFESSIONAL CLIENTS ONLY. NOT FOR PUBLIC DISTRIBUTION
This is a promotional document and as such the views contained herein are not to be taken as an advice or recommendation to buy or sell any investment or interest thereto.
Reliance upon information in this material is at the sole discretion of the reader. Any research in this document has been obtained and may have been acted upon by J.P. Morgan
Asset Management for its own purpose. The results of such research are being made available as additional information and do not necessarily reflect the views of J.P. Morgan
Asset Management. Any forecasts, figures, opinions, statements of financial market trends or investment techniques and strategies expressed are unless otherwise stated, J.P.
Morgan Asset Management’s own at the date of this document. They are considered to be reliable at the time of writing, may not necessarily be all-inclusive and are not guaranteed
as to accuracy. They may be subject to change without reference or notification to you. It should be noted that the value of investments and the income from them may fluctuate in
accordance with market conditions and taxation agreements and investors may not get back the full amount invested. Changes in exchange rates may have an adverse effect on
the value, price or income of the product(s) or underlying overseas investments. Both past performance and yield may not be a reliable guide to future performance. There is no
guarantee that any forecast made will come to pass. Furthermore, whilst it is the intention to achieve the investment objective of the investment product(s), there can be no
assurance that those objectives will be met. J.P. Morgan Asset Management is the brand name for the asset management business of JPMorgan Chase & Co and its affiliates
worldwide. You should note that if you contact J.P. Morgan Asset Management by telephone those lines may be recorded and monitored for legal, security and training purposes.
You should also take note that information and data from communications with you will be collected, stored and processed by J.P. Morgan Asset Management in accordance with
the EMEA Privacy Policy which can be accessed through the following website http://www.jpmorgan.com/pages/privacy. Investment is subject to documentation (Investment Trust
Profiles, Key Features and Terms and Conditions), copies of which can be obtained free of charge from JPMorgan Asset Management Marketing Limited. Issued by JPMorgan
Asset Management Marketing Limited which is authorised and regulated in the UK by the Financial Conduct Authority. Registered in England No: 288553. Registered address: 25
Bank St, Canary Wharf, London E14 5JP. Approval code: 4d03c02a80030adf